Article

Freeze-Up Ice Jam Formation in the River Bend, a Case Study on the Inner Mongolia Reach of Yellow River

1
State Key Laboratory of Simulation and Regulation of Water Cycle in River Basin, Institute of Water Resources for Pastoral Area, Ministry of Water Resources, Hohhot 010020, China
2
College of Water Conservancy and Civil Engineering, Inner Mongolia Agricultural University, Hohhot 010018, China
3
Department of Civil and Environmental Engineering, Gdańsk University of Technology, 80-233 Gdańsk, Poland
*
Authors to whom correspondence should be addressed.
Crystals 2021, 11(6), 631; https://doi.org/10.3390/cryst11060631
Submission received: 19 March 2021 / Revised: 12 May 2021 / Accepted: 27 May 2021 / Published: 1 June 2021
(This article belongs to the Special Issue Frazil Ice—Physical and Engineering Aspects)

Abstract

:
Concern has been expressed regarding the impacts of climate change on river ice and ice jam formation in cold regions. Ice jams are easily initiated in bends and narrow channels and cause disasters. In this study, observations and remote sensing monitoring are used to study the freeze-up ice jam formation of bends. Sediment transport and freezing process of the river interact, influencing bed changes profile and sedimentary budget. River ice processes, channel evolution, ice hydro-thermodynamics, and ice jam accumulation are explored. The results show that the channel topography determines the river thalweg, and that the channel elevation interacts with the river ice through sediment transport. The channel shrinkage increases the probability of ice jam, and the sharp bend is prone to ice jam formation. Under the effect of secondary circulation flow in the bend and in the outer bank, the juxtaposed freeze-up and the hummocky ice cover occur in the same location, and frazil ice accumulates under the junction of the main channel and the shoals. Affected by the increase of the hydraulic slope and the velocity downstream, open water reaches develops downstream of the ice accumulation. An open water section is emerged upstream of the bend, due to the ice deposition, and partly cut-off supply of the frazil.

1. Introduction

Ice accumulation, one of the topics in river engineering, is crucial since it may result in hazardous situations. Naturally speaking, rivers are barely found in straight shapes; therefore, it is important to study ice accumulation in the curved shape of the streams. Additionally, more parameters are added to the bending flow, which causes superelevation of water surface near the outer bank and secondary currents, in comparison with the straight one. The complexity in the flow characteristics is owing to both the gravity and the centripetal acceleration, which add an extra dimension, spiral motion, and elevation to the flow. Furthermore, flow near the surface inclines towards the outer bank, and near the bed towards the inner bank. Hence, the interaction between transverse circulation and the longitudinal flow, which produces a spiral motion, increases the turbulent water mass mixture [1]. As regards these changes in the flow behavior, the ice accumulation trend in river bends will also be affected. On that account, prior to freeze up, the flowing ice in the shape of frazil or skim ice floes is mainly along the outer bank. Apart from that, due to the mass mixture and transverse flow, ice accumulation also may occur along the inner bank. This mentioned ice accumulation decreases the local flow velocity. Therefore, resulting in further ice accumulation along the inner bank [2].
As mentioned above, in river bend there is a possibility of increasing the water level. There is also another risk of water level increase due to the ice jamming in the bends, which is problematic because of the potential flooding risks and damage to the banks. Moreover, ice breaks or an abrupt release of ice, which may lead to flood waves and causing risk of bank destruction [3]. Furthermore, ice accumulation in bends leads to probable flow diversion and changes at the river course (e.g., emerging scour holes at the bends in meandering rivers with recurring ice jamming). In sharp bend cases, rerouting of the flow across the basin likely occurs [4]. River ice jamming might affect engineering actions, such as hydraulic structure installation and channel stabilization, due to such changes imported on the river basin by ice jamming [5,6]. Therefore, in-depth knowledge is needed for these types of engineering works to predict the ice jamming effects on river channels to alleviate probable costs [7].
A different aspect of the ice jamming process has been considered by previous research. Urroz and Ettema [8] introduced two mechanisms of ice jam initiation through a cross-section of curved flume, which are lodgement and gorging that trigger ice arching, in a way that wall and fluid forces, and accumulated ice are outweighed. Experiments were subjected with point bars at the bends indicating the ice jamming starts by beaching the floes on these points. The maximum concentration showed a linear correlation with the Froude number. Wang et al. [9] applied the k-ɛ model for turbulence development of under-ice flow in channel bend in a non-orthogonal system. Wang et al. [1] performed an experimental study on different ice discharges in an S-shaped channel bend. Results showed thicker ice accumulation along the inner bank. Shen et al. [3], applied a Lagrangian Smooth Particle Hydro-dynamic (SPH) model for ice dynamics in a curvilinear channel. Their result illustrated the jamming procedure, increased ice thickness, and possible ice stoppage, upstream of the bend begins following the ice velocity reduction. It also showed the important effect of ice resistance on jam release flood waves.
Morin et al. [10] studied ice jamming influences on both morphology and ecosystem of a number of river banks on the Mistassini River. Ice scars, variation of height, vegetation cover height, and deposit types were demonstrated on a schematic diagram for bank composition. The study indicated no correlation between ice-induced erosional features and ice jamming recurrence. Beltaos and Prowse [11] attempted to study the general changes of the ice jamming process in Canadian rivers under the influence of climate change. The study outlined the dominant effects of climate change on ice jamming and breakup processes (ice season length changing following a small temperature increase). Shen and Liu [12] investigated the hydro-meteorological data and hydraulic features of the Shokotsu River for the causes of ice jamming. They found out the reason for the breakup event was the stimulation produced by an abrupt increase in runoff in a duration of a warm spell.
There also are a number of field observations on ice jamming in river bends related to past research. Sui et al.’s [2] field study conducted on transverse flow velocities specified that cells at the vicinity of ice cover and bed mainly travel to the inner bank while the cells in between incline to the outer bank. Smith and Pearce [4] studied the reach of the Milk River, identifying the gully incision as a major reason for chute cut-offs, and U-shaped curves being considered as a sign of recurring ice jams in the channel of meandering rivers in cold regions. Sui et al. [13] worked on the frazil ice jams data of the field measurements on Yellow River, indicated not only water level correlates with thickness of the jams, but it also is dependent on the discharge of the ice. Pawłowski [14] made measurements of the hanging dams at the Vistula River bend. It was indicated the frazil layer thickness along the inner bank is just slightly greater than that of the outer bank, and there are not any noticeable changes in frazil ice inflow under existing ice cover with the varying frazil deposition thickness. Dube et al. [15] surveyed ice dynamics on the Rimouski River, which is a medium-width stream with a sharp 90° bend at the upstream reach and a point bar. The survey demonstrated that ice erosion and flooding influenced bank morphology in a way that the limit lines of ice jam could be notified. The study also showed the complexity of association amongst temporal hydro-meteorological aspects and ice dynamics.
Concern has been expressed regarding the impacts of climate change on ice jam formation in cold regions. Ice jams can be easily initiated in bends and narrow channels and cause a problematic situation. Since the theory behind the ice formation mechanism is still not clear because of many factors involved, further investigations are needed in this field. Frequent ice jam accumulation occurred in the Shensifenzi bend of the Yellow River, and potential economic losses are expected. Obtaining a further vision of the ice jamming mechanism is required for flooding mitigation. Field data is used for ice jamming knowledge improvement at the bending river. Different types of field data harvested in a typical band in the Yellow River are analyzed. The types of data include satellite imagery, ice thickness profiles, river bed bathymetry, and hydro-meteorological data. A combination of remote sensing and field observation techniques is implemented to conduct a case study on the river ice formation process.

2. Materials and Methods

2.1. Research Area

In China, northern rivers are often subjected to the threat of ice jam flooding during winter freeze-ups and spring breakups. The Yellow River is the second largest river in China, and the Inner Mongolia reach is located in the upper reaches of the Yellow River, which has many curves. The ice jams form every year in the bend section of Inner Mongolia reaches of the Yellow River, China. Different degrees of jam flooding occurred 5.77 times per year on average during 1951~2011 [16,17]. The Haibowan reservoir, located at the entrance of the Yellow River in Inner Mongolia, is the main hydraulic structure to regulate the ice conditions in Inner Mongolia, where the normal water level is 1076m, the total storage capacity of is 487 million m3, and the regulating storage capacity is 443 million m3. Controlling by the high atmospheric pressure from Mongolia, the study area belongs to the typical continental monsoon climate. The annual average air temperature during 2007–2012 is 9 °C, and the average maximum and minimum temperatures are 39.6 °C and −28 °C, respectively. The amount of rainfall is low and uneven—the average annual rainfall is about 200–350 mm, mainly concentrated in July to September. Taking Toudaoguai hydrological station as the dividing section, the upstream is a plain channel with a wide gentle surface and a shallow water depth, while the downstream is a canyon channel with a narrow and deep water depth, and rapid flow velocity.
The Shensifenzi bend is located 4 km upstream along the Toudaoguai hydrological station, located at the junction of the middle and lower reaches of the Yellow River (Inner Mongolia), is a typical sharp bend and has repeatedly been the location of the initial ice jam, as shown by the red dashed line in Figure 1. There are two bends along the Shensifenzi section, the first bend in the upstream is called the Shensifenzi bend, which is connected by a 120° bend angle oriented from the northwest sharply to the southeast, and the hydraulic slope is approximately 0.1%. The average river width and water depth of the channel are approximately 300 m and 3–5 m, respectively. The winter is cold and long, and the water temperature reaches below the freezing point to form frazil ice affected by the strong cold air in winter, then the river starts to freeze-up. The frozen period lasts for more than 100 days, and the ice floods often occur in this section from late November to early March. Considering the time span from 1998 to 2015, the average ice floe and freeze-up dates were both 22 November and 16 December, respectively. In addition, the date of ice breakup where the maximal peak discharge usually occurs, mainly revolves around 17 March.
In this study, the air temperature, flow rate, and other meteorological data are all obtained via the monitoring devices of the Toudaoguai hydrological station. To monitor the channel stability, field observations and remote sensing are used in the process of river ice and ice jam formation. The meteorology, hydrology, and ice features data in the study area during the winter season of 2014/2015 are used to analyze this paper.

2.2. Data Sources and Methods

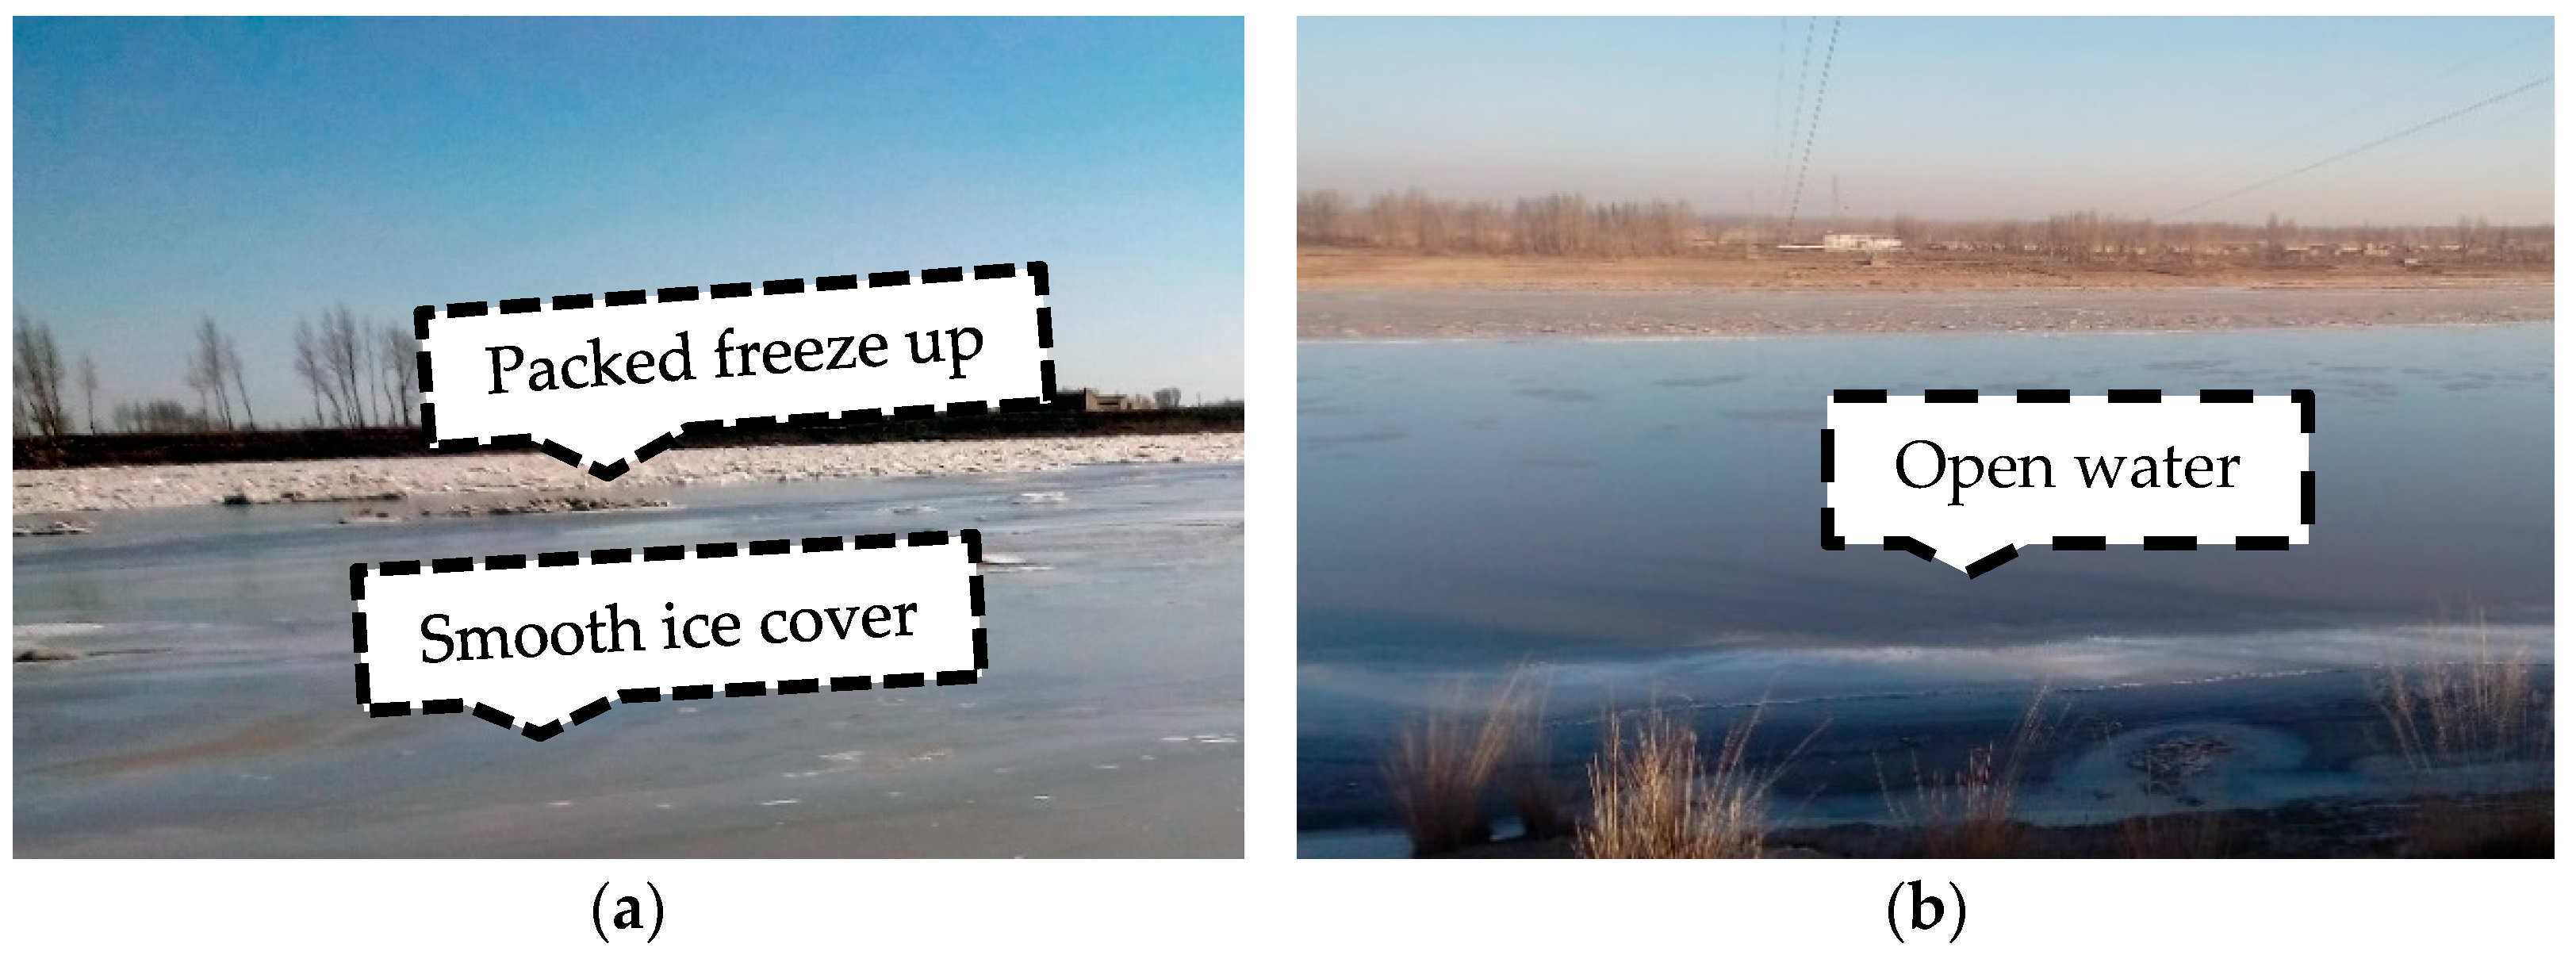
(1) Field observation data. From late November 2014 to mid-March 2015 and the freeze-up period in 2015, the ice conditions in the Shensifenzi bend have been monitored by this field observation station. Specifically, monitoring data can be classified as three types: (i) Ice condition, which obtained using visual and uncrewed aerial vehicle monitoring, velocity measurement with a reference object, drilling test on ice cover, i.e., drifting ice concentration, ice thickness, ice floe thickness, and ice run velocity data. The measurements were performed in different cross-sections. In the Shensifenzi bend, with stable ice cover, 25 holes are drilled with an ice driller every 10 m, and 17 profiles in the downstream of bend with open water every 20 m. We waited for 3–5 min until the water level is stable, then, using a sounding hammer and “L” type ice gauge, measured the ice sheet thickness, frazil ice thickness, and the water surface level. The frazil ice thickness is the soft layer obtained by hooking the bottom of the ice sheet; (ii) hydro-meteorological data, which obtained from the bureau of hydrology, e.g., air temperature, water temperature, and flow discharge; and (iii) hydraulic conditions under ice cover: Flow velocity and water depth under ice cover collected via acoustic Doppler velocity meter (HXH03-1) and vessel-mounted ADCP.
It should be considered that, due to technical reasons, the river ice monitoring system cannot monitor the whole river, and data is collected only using field observations, which is simply influenced by channel topography and visual range. Owing to the development of remote sensing technology, this shortcoming has been eliminated, allowing large-scale long-sequence ice data collection.
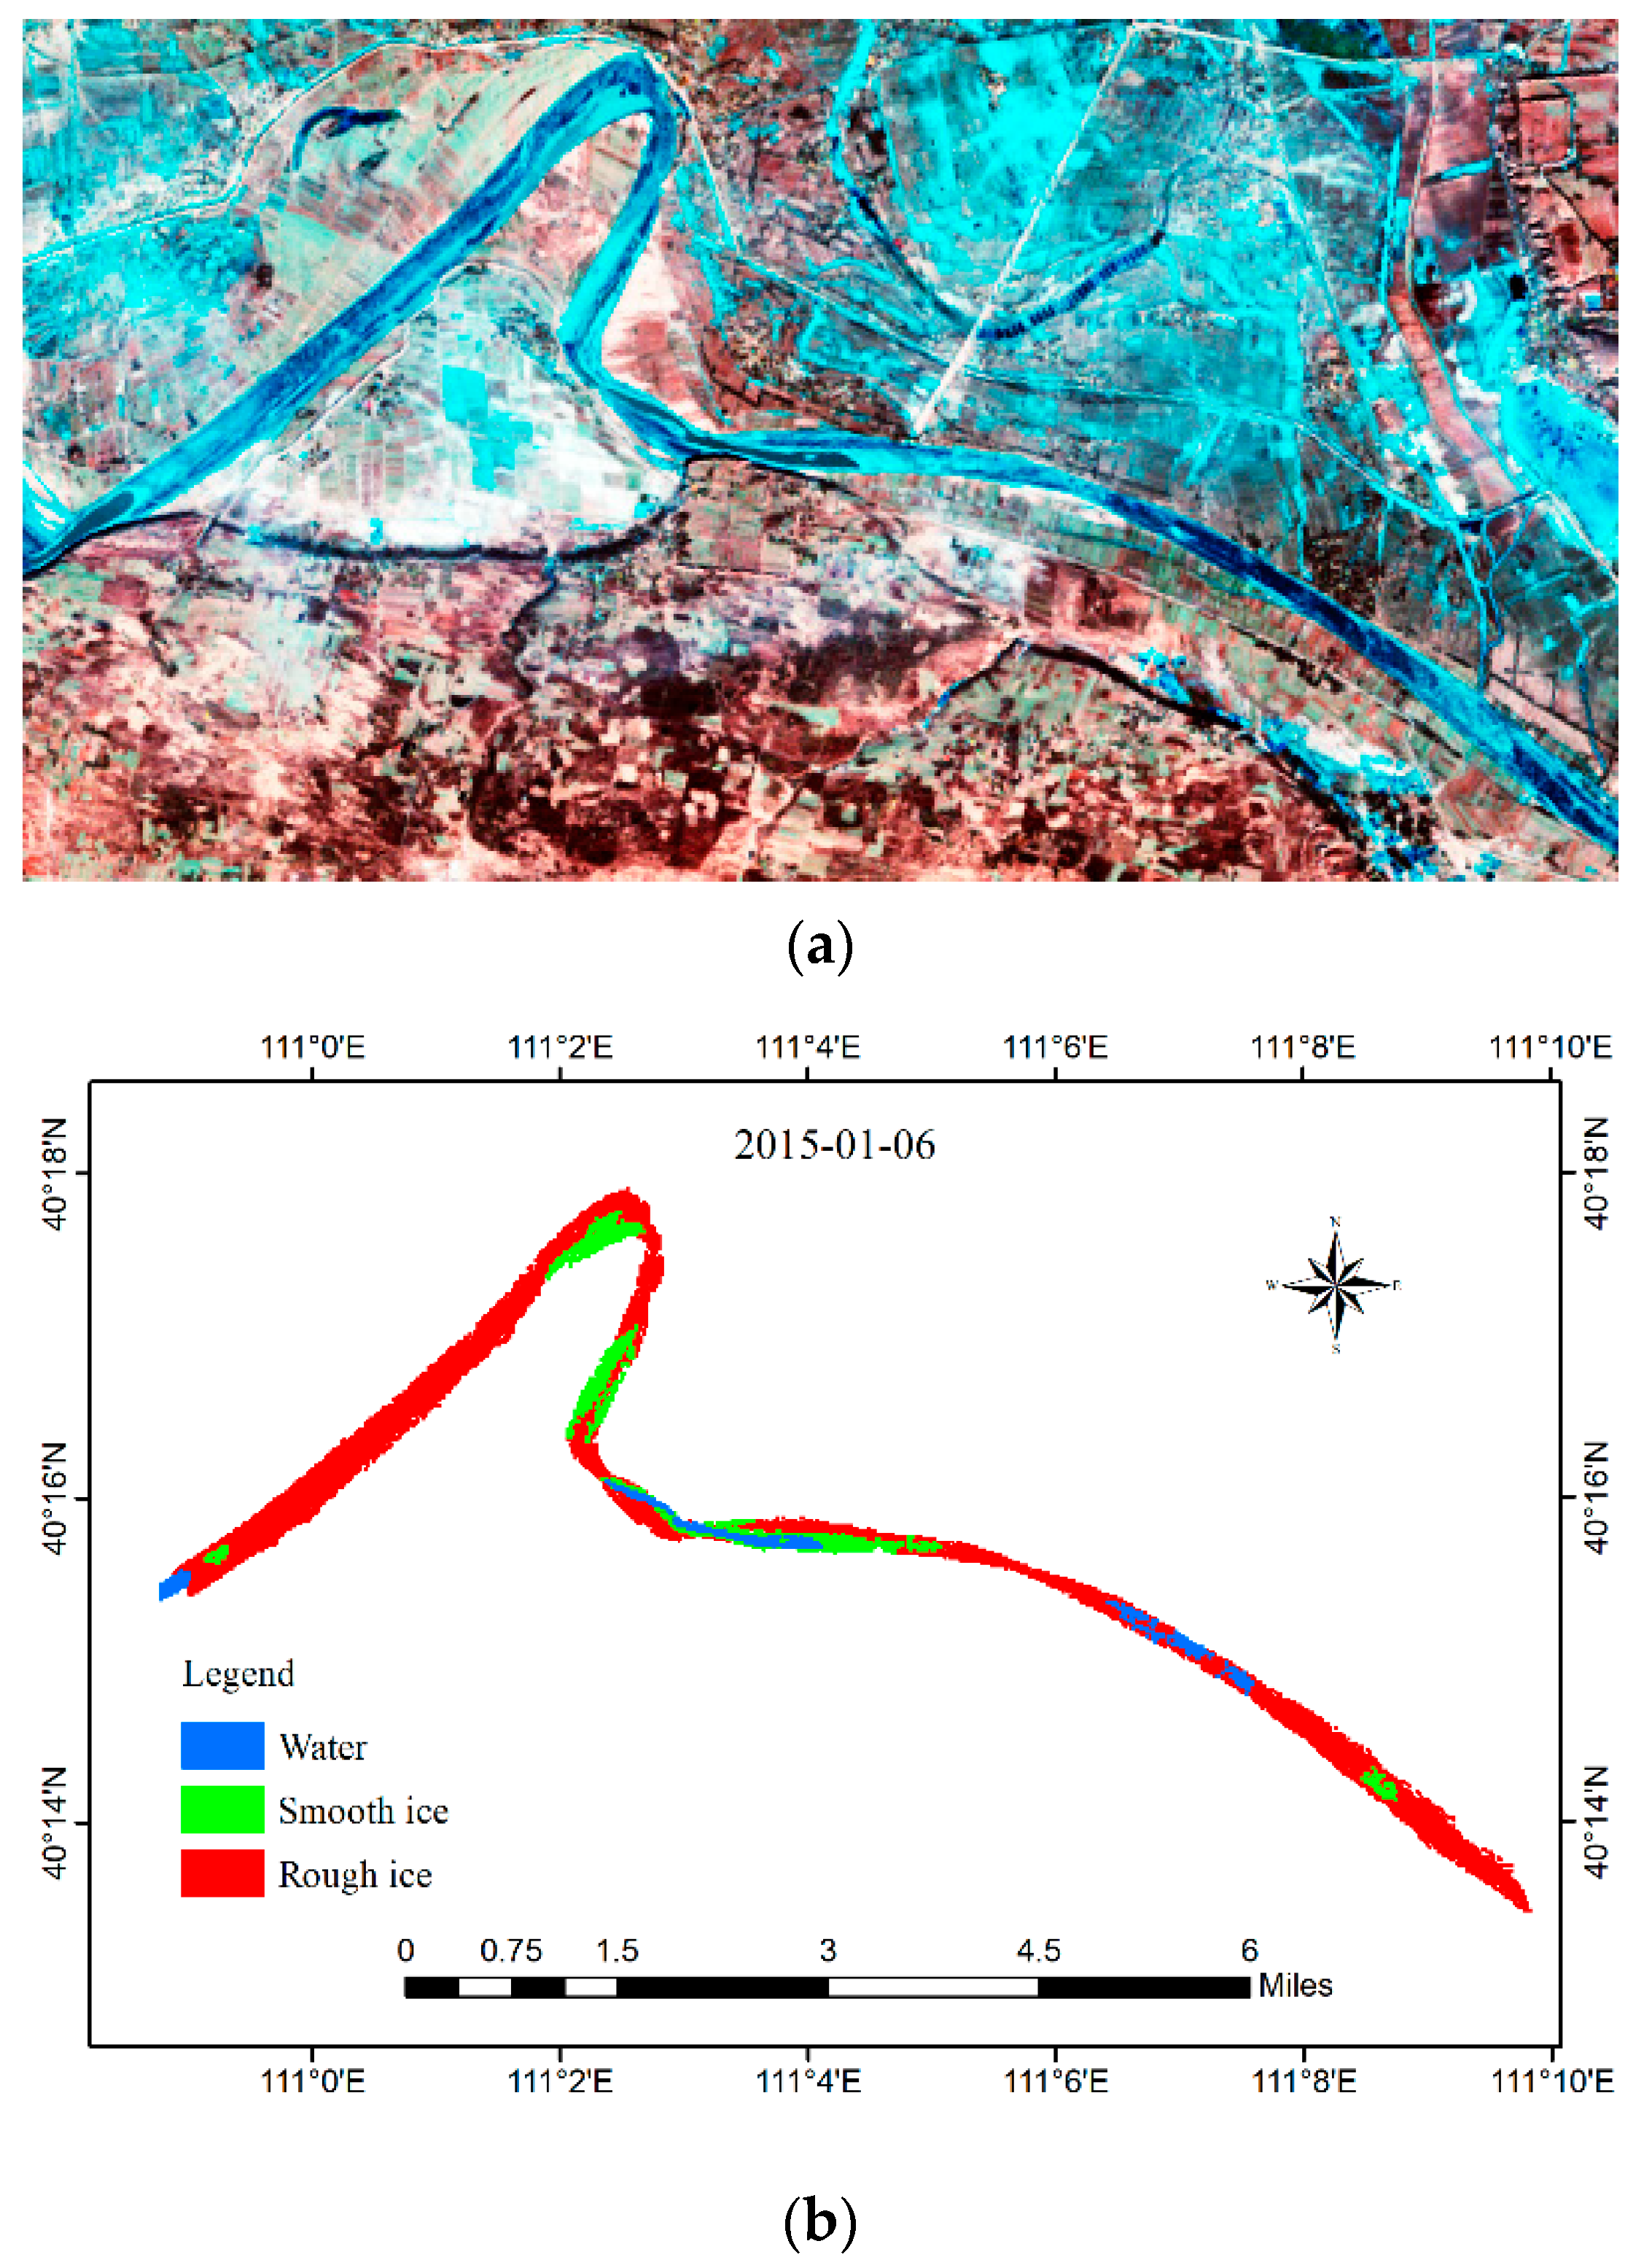
(2) Remote sensing monitoring data. The Landsat 8 on-board OLI sensor launched in February 2013 provides imagery with 12-bit radiometric, 16 days temporal resolution, and 30 m spatial resolution, including a 15 m panchromatic band have been used in this paper. The large-scale river ice process, ice type, and channel evolution are obtained from Landsat 8 images during 5 December, 21 December 2014, and 6 January, 7 February 2015. The Landsat data in 1995 (TM), 1999 (ETM), 2006 (TM), and 2013 (OLI-TIRS) of the research areas are also used to study the channel evolution. As an ally, ENVI 4.7 image processing system often serves as a tool for remote sensing image interpretation. Specifically, it includes four key steps of image cut, color composite, image enhancement, and pre-treatment technique, in which extracting long-sequence river ice information is now possible. The reflectance of ice in the visible and near-infrared is significantly greater than the reflectance of water [18], and the greater roughness of the ice body compared to the water is correlated with a smaller reflectivity of solar radiation. Under the optimal band combination of B743, water and ice can be identified via radiation brightness in the image, i.e., it can be split into static ice (flat ice) and dynamic ice (rough ice). For this purpose, the maximal likelihood method is normally used to classify ice and water, and then vectorize raster data retrieved from classification. The root mean square error is controlled within one pixel, and the average relative error is about 10% within the acceptable range. The original satellite image and the interpreted image comparison of the Shensifenzi section are shown in Figure 2.
Under the ArcGIS 9.3 environment, image post-processing, color changes, spots handle, and clustering handle are frequently used for classification. Similarly, based on the field and remote sensing data, the river ice evolution processes and formation characteristics upstream and downstream of the Shensifenzi bend, have been both analyzed.

3. Results

3.1. River Ice Processes in the Bend

In the duration of the freeze-up period, cold weather cools down water, forming frazil ice particles and slush pans. If the path of these particles, running near or on the surface becomes blocked by any reason, ice jam occurs in the form of surface or thickened jamming [19]. Thickened ice jam includes hanging dams, which refers to large-scaled localization of ice jamming [20].
Considering the winter of 2014 and 2015 as the typical years for analyzing the formation processes of river ice in the Shensifenzi bend, it was found that the freeze-up process was consistent within two winters, as shown in Figure 3. The frazil slush in the Shensifenzi bend of the Yellow River began to appear on 30 November in the winter of 2014, and freeze-up occurred on 7 December. The date of the ice run in the winter of 2015 was on 28 November, with decreasing temperature and increasing upstream ice production, the initial freeze-up date was on 2 December, and the freeze-up date along the entire length of the Shensifenzi bend in 2015 was on 17 December.
Ice formation process is characterized by heat flux, radiation, and friction with the bed and banks [21]. In this analysis supercooling event is going to be contemplated. Affected by the extremely cold air conditions, the temperature of the study area sharply decreased, and concentrations of drifting ice appeared in the river. The secondary circulation flow in river bends has significant effects on the flow velocity distribution where the main stream of the channel slants to the outer bank. The surface ice accumulation has a significant positive correlation with water and air temperature differences [22]. During the freeze-up period, the water temperature is below 0 °C, and the air temperature is mostly negative, so the relationship between air temperature and surface ice accumulation shows a negative correlation.
The high density of drifting ice is mostly beneficial to form ice pans and slush balls with large diameters. With the continuous decrease of air temperature in winter, the ice volume continues to increase, and a portion of the ice floes accumulates at the border of the channel where the velocity is relatively low. When affected by the bank friction and the relatively faster heat transfer rate in soil [23], a thin layer of smooth ice in the inner bank formed and occupied half of the channel. Under the effect of wind speed and flow turbulence intensity, some flowing skim ice and ice pans are washed to accumulate on the outer bank to form agglomerated border ice. In the outer bank, the dynamic ice cover forms from the disordered ice particles, while the static and smooth ice cover forms in the inner bank, due to the lower velocity. With the continuous heat exchange between the water surface and the atmosphere, the ice jamming formed at the outlet of the bend, and the ice cover starts to grow and be more thicken, reducing the cross-section area of the river, and affecting the ice pans transport from upstream to downstream. The dividing line of the freeze-up form is obvious, as shown in Figure 4a, and was monitored in the field.
The flow velocity is affected not only by the bed roughness, but also by the ice cover roughness varies with the ice thickness, when the ice cover formed in the channel. The frazil ice accumulates under the ice cover will increase the hydraulic slope between upstream and downstream, and decrease the amount of frazil ice downstream, which leads to the formation of open water leads, as shown in Figure 4b. Although the ice bridge prevented ice floe transport downstream, the heat loss of water downstream also produced a small amount of frazil slush, decreasing the length and area of the open water area.
To make further understanding on the river ice formation process of bend, and reduce the influence of limited field monitoring range, the corresponding satellite image in 5 December 2014, 21 December 2014, 6 January 2015, 7 February 2015 of research area have been downloaded and interpreted, as shown in Figure 5. Comparing remote sensing interpretation results on 5 December 2014, with measured ice-regime observation photograph, it was conducted that the interpretation results of rive ice condition based on Landsat images reasonably conform to the measured ice-regime observation data.
The interpreted length of Shensifenzi is 22.54 km—the ice and open water area variations and their proportion over time span indicate the river ice process of the bend. With continuous increases in ice thickness and variations in solar radiation intensity, the surface of the ice body exhibits freezing and thawing. Affected by the day and night temperature variations in Inner Mongolia, the surface ice cover will melt, due to heat absorption during the day, while the temperature drops at night, the meltwater on the top of the ice cover freezes up again, which makes the ice surface flat, as shown in Figure 5. At the end of the freeze-up, the open water area in the channel still exists.

3.2. Ice Jam Formation in the Bend

The bend is known as one of the common locations for the initiation ice jam affected by the flow characteristics and the channel curvature; the flow structure under the ice cover or jam is of more complexity influenced by many factors, e.g., boundary conditions and thermal regime [24]. The thickened ice cover is the basis of the accumulation of frazil slush and floes during freeze-up period, and the Froude number at the leading edge of the ice cover determines the position and thickness of the freeze-up jam [20]. Naturally wide rivers exhibit mostly turbulent flow, and turbulent motion has a large influence on the transport of surface ice and undercover ice, especially in bends and narrow channels [25,26,27]. Based on the results of field monitoring and remote sensing image interpretation, the ice jam formation processes of the Shensifenzi bend can be summarized.
The transverse accumulation of frazil ice depends not only on hydraulic variables, but also on the central angle of the river bend [1]. Figure 6 shows the bed elevation distribution of the Shensifenzi section, which can be seen that the relatively lower bed elevation is near the outer bank of the first bend. Whereas, the second bend has the opposite trend in bed elevation, in which the flow direction slants to the outer bank in the upstream bend at the very start, and then inclines to the inner bank downstream. The bed elevation at the outlet of the first bend is the lowest in the research area, where the flow velocity is the smallest under the same flow condition, and frazil ice is easily accumulated here. After the initial ice jamming form, the hydraulic conditions in the channel will be changed.
Figure 7 shows the water elevation distribution and the ice conditions on 18 December 2014 and 2 January 2015 of the Shensifenzi bend. Referring to the theory that the presence of ice cover will cause the secondary circulation flow of the river bend to split into two weaker circulations [28], some simple ideas can be generated. When the initial ice cover form in the Shensifenzi bend, the flow and ice transport velocity under the ice cover will decrease affected by the roughness of bed and ice cover, and the two weak circulations in the bend will develop. With the continuous transport of frazil ice from upstream to downstream, the ice will accumulate at the edge of the ice cover or at the bottom of the cover under certain hydraulic conditions, which can both increase the forces acting on the ice cover, and leads to the risk of ice jam profile thicken. As shown in Figure 7a, the frazil slush under the ice cover in the bend mostly gathers at the junction of the main channel and the shallows, where the water depth is in a transitional position. Whereas in Figure 7b, the bed elevation changed a lot between 18 December 2014 and 2 January 2015 of the Shensifenzi bend, in which the outer bank of bend exhibits an erosional trend, and drifting sediment deposit on the inner bank. The bathymetric data, shown in Figure 7, indicates that the river ice interacts with channel evolution.
Figure 8 shows the water depth and ice condition distribution of open water lead downstream of the Shensifenzi bend. Ice jamming near the first bend increases the upstream and downstream water surface slope difference and decreases the amount of downstream frazil ice, which causes the open water leads to appear. Figure 8 shows that affected by the shoal resistance, some smooth ice and frazil ice accumulate on the left bank.

4. Discussion

As discussed above, the river ice and ice jam formation processes in the bend are complex, especially in hydraulic and thermodynamic processes, since several factors have strong impacts on them, such as temperature, morphology, and flow discharge. The temperature is the basic factor to characterize the thermal and ice condition. During the freeze-up period, the water temperature reaches the freezing point, and the heat loss shows an opposite trend with the air temperature. Figure 9 shows the variation of the average daily temperature, the flow discharge, and the average air temperature for 17 years (1998–2015) of TDG station in the ice period of 2014–2015. Compared with the data for the last 18 years (vertical dashed line), the air temperature in November 2014–2015 is 1 °C greater, which decreases the ice floe density and postpones the initial ice concentration date by eight days. The relatively low temperature in December makes the freeze-up date move up by nine days, and the cumulative negative temperature in December reaches −301 °C. The cumulative negative temperature has a significantly negative correlation with the ice thickness [29,30]. The temperature during the freeze-up period has a significant decreasing trend, and the cumulative negative temperature in March is −42 °C lower than the average in this area. Relatively, thick ice and lower cumulative negative temperatures in March delay the ice breakup date by five days. In general, the thermodynamic characteristics are the key factors affecting ice production, channel freeze-up dates, and ice jam formation, and the heat transfer rate between water and atmosphere is mainly controlled by the difference between the air temperature and the water temperature [31,32]. The relatively low temperature in 2014–2015 of the Shensifenzi section is an important reason for the long-frozen duration.
The flow discharge is an important hydraulic factor for ensuring channel safety and water resource demand in winter [33]. The Haibowan reservoir, located the upstream of the Inner Mongolia reaches of the Yellow River is specially constructed to regulate the flow discharge in the ice period, and reduce the ice flood disaster. During the initial freeze-up period, the reservoirs are used to regulate the discharge that supplies sufficient cross-sectional area for frazil ice transport, and to create conditions for the steady freeze-up of the river [34]. The discharge presents a significant increase when the ice floe first appears; with the formation of ice jamming, the discharge drops rapidly to prevent the frazil ice from accumulating under the ice cover. During the stable freeze-up period, the flow discharge controlled by the reservoir mainly depends on whether river ice is downstream and water inflow is upstream. The period of 2014–2015 was a typical year, when the Haibowan reservoir is used for ice flood prevention for the first time. According to the measured data of the flood control office of Yellow River Water Conservancy Commission, the flow discharge regulation during freeze-up in 2014–2015 is nearly 300 m3/s larger than the average, and the discharge from the reservoir is unstable, which happened to encounter with the strong cold air, and forming a large freeze-up flow discharge [35,36,37] The discharge is limited to 400–800 m3/s during the ice run period and 200–600 m3/s in the freeze-up period of the Shensifenzi section, as shown in Figure 9.
The ice floe from upstream can accumulate at the edge of the ice cover to form a new ice cover, but when the frazil ice discharge under the ice cover is greater than the frazil ice transport capacity of the river, the frazil ice will accumulate under the cover, and an initial hanging dam will be formed [38]. Influenced by the ice and the bed friction roughness, the frazil slush will accumulate in areas with a relatively shallow water depth, which reduces the wetted cross-sectional area and obstructs the flow, allowing more ice particles to form a large undercover ice deposition.
Furthermore, the high sediment concentration of the Yellow River aggravates the ice jam flood threat [39]. Since 1986, the Yellow River has appeared a low flow period with relatively low flood peak, low sediment carrying capacity, and serious channel deposition [
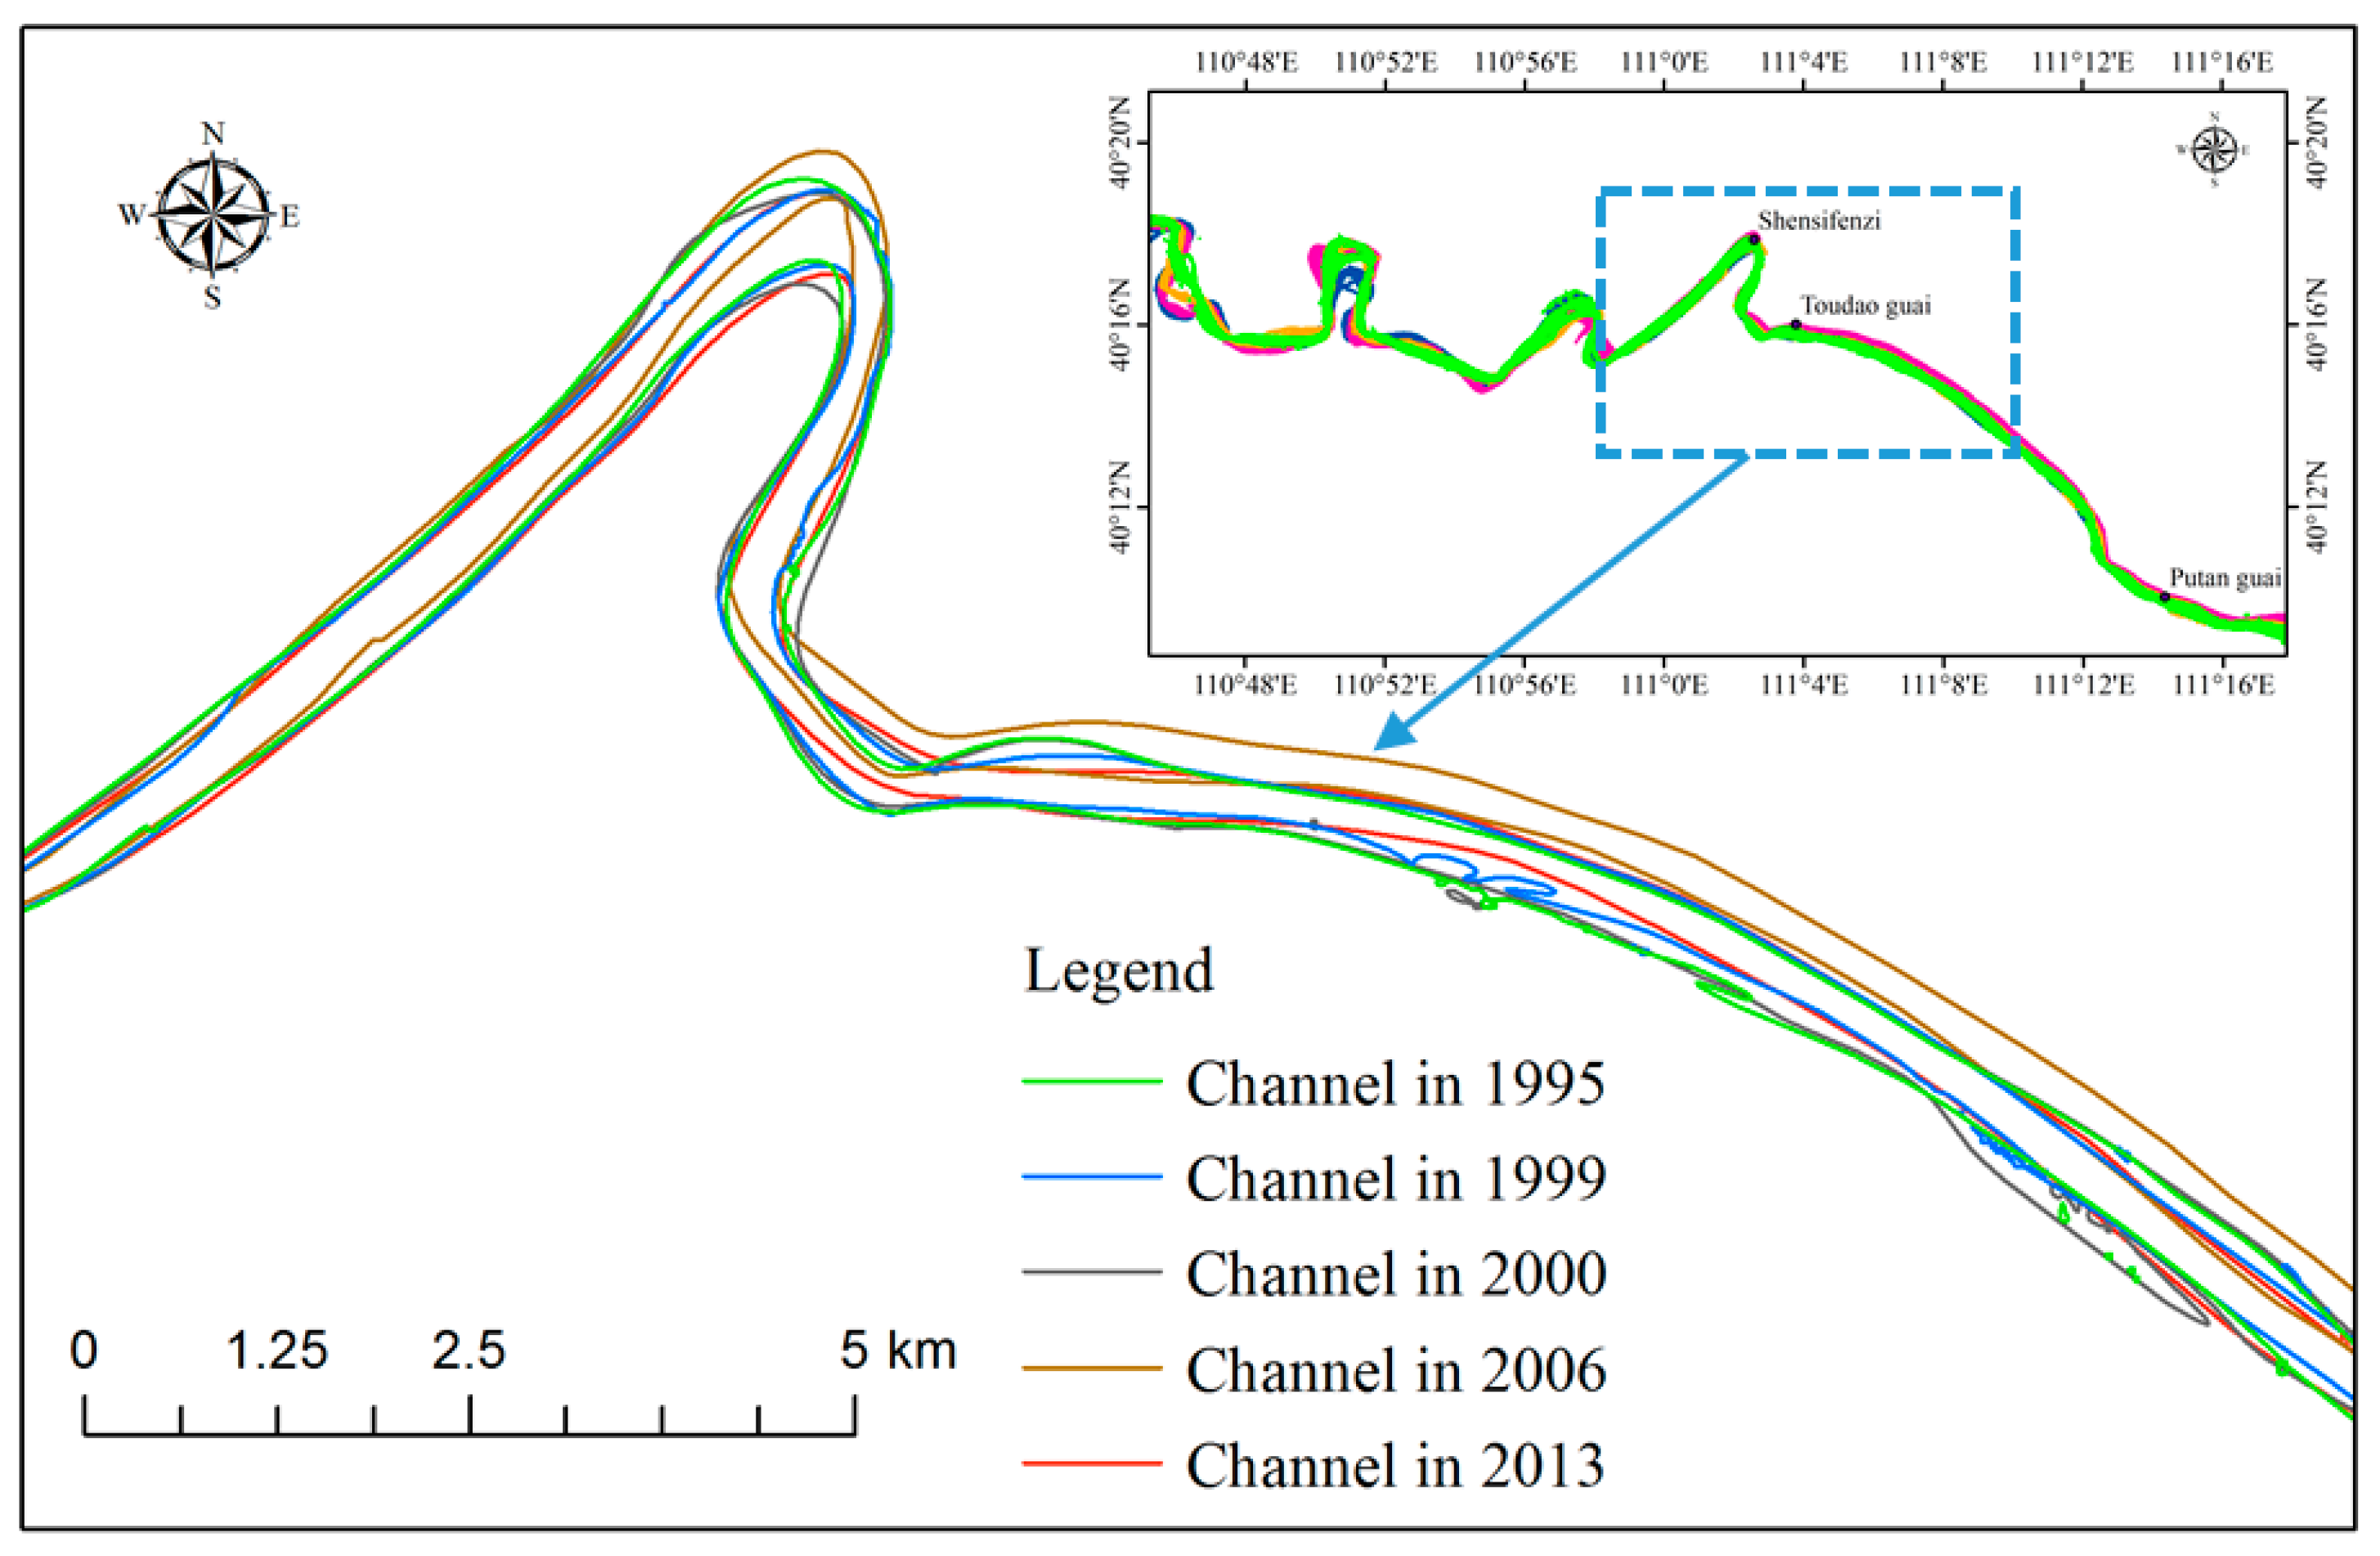
40]. To make further understanding on the influencing factors of a frequent ice jam in the Shensifenzi section, with the support of remote sensing image interpretation, measurements and statistics of the channel width are conducted, and the rate of channel evolution in the study area from 1995 to 2013 was calculated and analyzed. When the rate of channel evolution is positive, channel width will exhibit an increasing trend, and vice versa. Figure 10 plots the interpretations of channel width during 1995, 1999, 2000, 2006, and 2013, when the channel widths of the Shensifenzi bend are 480.2 m, 356.76 m, 459.32 m, 396.34 m, and 344.09 m, respectively. The rate of channel evolution between 1995 and 2013 is −28%, which indicates the seriously shrinking of the Shensifenzi bend. The shrinkage of the channel cross-section will reduce the conveyance of the channel, which increases the possibility of freeze-up jam occurrence. The jam may potentially lead to the flood risk, especially in the case of a grounded type of jam, which radically decreases the river conveyance, and forms an extensive backwater upstream. In addition, it implies that the evolution in the bend is more serious than in the straight sections of the channel, and is influenced by both the river circumfluence and special sediment transport in the bend.

5. Conclusions

The formation of freeze-up ice jam under the condition of s sharp bend in Yellow River has been presented. The process of jamming is influenced by thermal, hydrological, and morphological aspects, which brings more complexity to the mixed-up flow and ice transport process in the river bends. As the main course of action of floe ice, pancake ice travels downstream, accumulating at the vicinity of the outer bank, forming a dynamic ice cover (due to the direction of the secondary current on the water surface). At the adjacent of the inner bank, border ice in the form of smooth ice cover is emerged because of the shallow depth and low velocity. This proceeding continues upstream, which leads to the dynamic cover formation with frazil deposition (hanging dam). Influenced by the hydraulic conditions and secondary circulation of the bend, a portion of the frazil slush accumulates under the ice cover and forms further accumulation.

Author Contributions

Data curation, S.-X.Z., C.L., Q.Q. and S.-N.Z.; Conceptualization, S.-X.Z. and T.K.; methodology, X.-H.S., S.-X.Z., W.L.; Formal analysis, Y.-J.W. and S.-N.Z.; validation, W.-J.W., M.S. and T.K.; writing—original draft preparation, S.-X.Z.; writing—review and editing, X.-H.S. and T.K.; All authors have read and agreed to the published version of the manuscript.

Funding

This research was funded by the National Natural Science Foundation of China (No. 52009084; No. 52060022 and No. 51669024); National key R & D program-International cooperation program (No. 2017YFE0114800) and Natural Science Foundation of Inner Mongolia Autonomous Region (No. 2020BS05038; No. 2019MS05032).

Institutional Review Board Statement

Not applicable.

Informed Consent Statement

Not applicable.

Data Availability Statement

The datasets generated or used during the study are available from the corresponding author on reasonable request.

Acknowledgments

We acknowledge the financial support from the National Natural Science Foundation of China (No. 52009084; No. 52060022 and No. 51669024); National key R & D program-International cooperation program (No. 2017YFE0114800) and Natural Science Foundation of Inner Mongolia Autonomous Region (No. 2020BS05038; No. 2019MS05032).

Conflicts of Interest

The authors declare no conflict of interest.

References

  1. Wang, J.; Sui, J.; Zhang, H.; Chen, P.; Hirshfield, F. Mechanisms of Ice Accumulation in a River Bend—An Experimental Study. Int. J. Sediment Res. 2012, 27, 521–537. [Google Scholar] [CrossRef]
  2. Sui, J.S.; Wang, J.W.; Balachandar, R.B.; Sun, Z.S.; Wang, D.W. Accumulation of Frazil Ice along a River Bend. Can. J. Civ. Eng. 2008. [Google Scholar] [CrossRef]
  3. Shen, H.T.; Gao, L.; Kolerski, T.; Liu, L. Dynamics of Ice Jam Formation and Release. J. Coast. Res. 2008, 52, 25–32. [Google Scholar] [CrossRef]
  4. Smith, D.G.; Pearce, C.M. Ice Jam-Caused Fluvial Gullies and Scour Holes on Northern River Flood Plains. Geomorphology 2002, 42, 85–95. [Google Scholar] [CrossRef]
  5. Szydlowski, M.; Kolerski, T. Numerical Modeling of Water and Ice Dynamics for Analysis of Flow Around the Kiezmark Bridge Piers. In Free Surface Flows and Transport Processes; Springer: Berlin/Heidelberg, Germany, 2018; pp. 465–476. [Google Scholar]
  6. Kolerski, T. Mathematical Modeling of Ice Dynamics as a Decision Support Tool in River Engineering. Water 2018, 10, 1241. [Google Scholar] [CrossRef] [Green Version]
  7. Ettema, R. Review of Alluvial-Channel Responses to River Ice. J. Cold Reg. Eng. 2002, 16, 191–217. [Google Scholar] [CrossRef]
  8. Urroz, G.E.; Ettema, R. Small-Scale Experiments on Ice-Jam Initiation in a Curved Channel. Can. J. Civ. Eng. 2011. [Google Scholar] [CrossRef]
  9. Wang, J.; Sui, J.; Chen, P. Numerical Simulations of Ice Accumulation under Ice Cover along a River Bend. Int. J. Environ. Sci. Technol. 2009, 6, 1–12. [Google Scholar] [CrossRef] [Green Version]
  10. Morin, S.; Boucher, E.; Buffin-Belanger, T. The Spatial Variability of Ice-Jam Bank Morphologies along the Mistassini River (Quebec, Canada): An Indicator of the Ice-Jam Regime? Nat. Hazards 2015, 77, 2117–2138. [Google Scholar] [CrossRef]
  11. Beltaos, S.; Prowse, T.D. Climate Impacts on Extreme Ice-Jam Events in Canadian Rivers. Hydrol. Sci. J. 2001, 46, 157–181. [Google Scholar] [CrossRef]
  12. Shen, H.T.; Liu, L. Shokotsu River Ice Jam Formation. Cold Reg. Sci. Technol. 2003, 37, 35–49. [Google Scholar] [CrossRef]
  13. Sui, J.; Karney, B.W.; Sun, Z.; Wang, D. Field Investigation of Frazil Jam Evolution: A Case Study. J. Hydraul. Eng. 2002, 128, 781–787. [Google Scholar] [CrossRef]
  14. Pawłowski, B. Internal Structure and Sources of Selected Ice Jams on the Lower Vistula River. Hydrol. Process. 2016, 30, 4543–4555. [Google Scholar] [CrossRef]
  15. Dubé, J.; Buffin-Bélanger, T.; Bergeron, N. Interannual Field Observations and Analysis of River Ice Dynamics at a Fluvial Transition on the Rimouski River, Québec. In Proceedings of the 15th Workshop on River Ice, St. John’s, NL, Canada, 15–17 June 2009. [Google Scholar]
  16. Wu, C.-G.; Wei, Y.-M.; Jin, J.-L.; Huang, Q.; Zhou, Y.-L.; Liu, L. Comprehensive Evaluation of Ice Disaster Risk of the Ningxia–Inner Mongolia Reach in the Upper Yellow River. Nat. Hazards 2015, 75, 179–197. [Google Scholar] [CrossRef]
  17. Wang, F.; Wang, L. Analysis of Ice Regime Characteristics in the Ningxia-Inner Mongolia Reach of Yellow River in the Recent Ten Years. South-North Water Transf. Water Sci. Technol. 2014, 4, 21–24. [Google Scholar]
  18. Dai Xiaoai, Y.X.; Xiaojie, G.; Wunian, Y.; Hujun, J.; Ye, Y.; Peifen, P. The Difference Analysis of Spectral Curve Features on Hyperspectral Nonlinear Vector Space. Remote Sens. Technol. Appl. 2016, 30, 1095–1102. [Google Scholar]
  19. Beltaos, S. Progress in the Study and Management of River Ice Jams. Cold Reg. Sci. Technol. 2008, 51, 2–19. [Google Scholar] [CrossRef]
  20. Shen, H.T.; Wang, D.S. Under Cover Transport and Accumulation of Frazil Granules. J. Hydraul. Eng. 1995, 121, 184–195. [Google Scholar] [CrossRef]
  21. McFarlane, V.; Clark, S.P. A Detailed Energy Budget Analysis of River Supercooling and the Importance of Accurately Quantifying Net Radiation to Predict Ice Formation. Hydrol. Process. 2021, 35, e14056. [Google Scholar] [CrossRef]
  22. Zhao, S.; Shen, H.T.; Shi, X.; Li, C.; Li, C.; Zhao, S. Wintertime Surface Heat Exchange for the Inner Mongolia Reach of the Yellow River. JAWRA J. Am. Water Resour. Assoc. 2020, 56, 348–356. [Google Scholar] [CrossRef] [Green Version]
  23. Feng, G.H.; Chaolun, B.; Yan, X. Analysis of Ice Slush Formation Mechanism and Ice Flood Causes of Yellow River in Inner Mongolia. J. China Hydrol. 2008, 3, 74–76. [Google Scholar]
  24. Wang, J.; Chen, P.; Sui, J. Progress in Studies in Ice Accumulation in River Bends. J. Hydrodyn. 2011, 23, 737–744. [Google Scholar] [CrossRef]
  25. Naso, A.; Jucha, J.; Lévêque, E.; Pumir, A. Collision Rate of Ice Crystals with Water Droplets in Turbulent Flows. J. Fluid Mech. 2018, 845, 615–641. [Google Scholar] [CrossRef]
  26. Li, C.; Li, C.; Shen, H.T. Characteristics of Surface Ice Movement in a Channel Bend with Intake and the Layout of Ice Deflection Booms. Adv. Adv. Water Sci. 2014, 25, 233–238. [Google Scholar]
  27. Beltaos, S.; Carter, T. Field Studies of Ice Breakup and Jamming in Lower Peace River, Canada. Cold Reg. Sci. Technol. 2009, 56, 102–114. [Google Scholar] [CrossRef]
  28. Tsai, W.-F.; Ettema, R. Ice Cover Influence on Transverse Bed Slopes in a Curved Alluvial Channel. J. Hydraul. Res. 1994, 32, 561–581. [Google Scholar] [CrossRef]
  29. Shen, H.T.; Yapa, P.D. A Unified Degree-Day Method for River Ice Cover Thickness Simulation. Can. J. Civ. Eng. 1985, 12, 54–62. [Google Scholar] [CrossRef]
  30. Ashton, G.D. River and Lake Ice Thickening, Thinning, and Snow Ice Formation. Cold Reg. Sci. Technol. 2011, 68, 3–19. [Google Scholar] [CrossRef]
  31. Foltyn, E.P.; Shen, H.T. St. Lawrence River Freeze-up Forecast. J. Waterw. Port Coast. Ocean Eng. 1986, 112, 467–481. [Google Scholar] [CrossRef]
  32. Shen, H.T.; Chiang, L.-A. Simulation of Growth and Decay of River Ice Cover. J. Hydraul. Eng. 1984, 110, 958–971. [Google Scholar] [CrossRef]
  33. Vogel, R.M.; Stedinger, J.R. Flood-plain Delineation in Ice Jam Prone Regions. J. Water Resour. Plan. Manag. 1984, 110, 206–219. [Google Scholar] [CrossRef]
  34. Lu, S.B.; Huang, Q.; Wu, C.G.; Gao, F. Ice Jams Disaster in Ningxia-Inner Mongolia Reaches of Yellow River and Its Prevention by Reservoirs. J. Nat. Disaster 2010, 19, 43–47. [Google Scholar]
  35. Li, X.D.; Li, L.X.; Zhang, M. Analysis on the abnormal freeze up discharge of Inner Mongolia reach of the Yellow River in ice flood season of 2014-2015. China Flood Drought Manag. 2016, 26, 32–34. [Google Scholar]
  36. Huo, S.Q.; Wen, L.Y.; Fan, M.H. Analysis of Ice Flood Characteristics and Meteorological Causes at Ningxia-Inner Mongolia Reach of Yellow River in Year 2014–2015. Yellow River 2016, 38, 16–18. [Google Scholar]
  37. Wang, Y. Analysis on the function of Haibowan Reservoir in the prevention of ice in the reach of Inner Mongolia and its storage capacity. Des. Water Resour. Hydroelectr. Eng. 2008, 3, 22–24. [Google Scholar]
  38. Ke, S.; Lu, G.; Ren, Z. Study on Mechanism of Ice Jam Formation in Bayangaole Section of Yellow River. Shuili Xuebao J. Hydraul. Eng. 2000, 7, 66–69. [Google Scholar]
  39. Qiu, Y.; Jia, Y.; Zhao, J.; Wang, X.; Bennett, J.; Zhou, Z. Valuation of Flood Reductions in the Yellow River Basin under Land Use Change. J. Water Resour. Plan. Manag. 2010, 136, 106–115. [Google Scholar] [CrossRef]
  40. Long, H.; Du, Y.; Wu, H.X. Channel Recession and Its Effect on Ice Flood in Ningxia-Inner Mongolia Reach. Yellow River 2007, 29, 25–26. [Google Scholar]
Figure 1. The Inner Mongolia reach of the Yellow River and the Shensifenzi bend location.
Crystals 11 00631 g001
Figure 2. The comparison of the original satellite image (a) and the interpreted image of the Shensifenzi bend (b).
Crystals 11 00631 g002
Figure 3. The freeze-up process of the Shensifenzi bend in the winter of 2014 and 2015.
Crystals 11 00631 g003
Figure 4. The freeze-up form of the Shensifenzi bend, monitored in the field. (a) Freeze-up forms in the bend. (b) Open water leads downstream of bend.
Crystals 11 00631 g004
Figure 5. The Landsat remote sensing interpretation results of the Shensifenzi bend in (a) 5 December 2014, (b) 21 December 2014, (c) 6 January 2015, and (d) 7 February 2015.
Crystals 11 00631 g005aCrystals 11 00631 g005b
Figure 6. The bed elevation of the Shensifenzi bend.
Crystals 11 00631 g006
Figure 7. The distribution of water depth and ice condition of the Shensifenzi bend in (a) 18 December 2014 and (b) 2 January 2015.
Crystals 11 00631 g007
Figure 8. The water depth and ice condition distribution of open water leads.
Crystals 11 00631 g008
Figure 9. Comparison of the average daily temperature in 2014–15 to the past 17 years.
Crystals 11 00631 g009
Figure 10. Channel evolution of research area and the enlarged view of Shensifenzi bend during 1995–2013.
Crystals 11 00631 g010
Publisher’s Note: MDPI stays neutral with regard to jurisdictional claims in published maps and institutional affiliations.

