Article

Temperature-Dependent Optical Properties of Graphene on Si and SiO2/Si Substrates

1
Center on Nanoenergy Research, Laboratory of Optoelectronic Materials & Detection Technology, Guangxi Key Laboratory for the Relativistic Astrophysics, School of Physical Science & Technology, Guangxi University, Nanning 530004, China
2
Department of Physics, University of North Florida, Jacksonville, FL 32224, USA
*
Author to whom correspondence should be addressed.
Crystals 2021, 11(4), 358; https://doi.org/10.3390/cryst11040358
Submission received: 7 February 2021 / Revised: 25 March 2021 / Accepted: 26 March 2021 / Published: 29 March 2021

Abstract

:
Systematic investigations are performed to understand the temperature-dependent optical properties of graphene on Si and SiO2/Si substrates by using a variable angle spectroscopic ellipsometry. The optical constants of graphene have revealed changes with the substrate and temperature. While the optical refractive index (n) of monolayer graphene on Si exhibited clear anomalous dispersions in the visible and near-infrared region (400–1200 nm), the modification is moderate for graphene on SiO2/Si substrate. Two graphene sheets have shown a pronounced absorption in the ultraviolet region with peak position related to the Van Hove singularity in the density of states. By increasing the temperature from 300 K to 500 K, for monolayer graphene on Si, the n value is gradually increased while k decreased. However, the optical constants [n, k] of monolayer graphene on SiO2/Si exhibited unpredictable wave variations. In the wavelength range of 400–1200 nm, an experiential formula of a like-Sellmeier equation is found well suited for describing the dispersions of graphene on Si and SiO2/Si substrates.

1. Introduction

Since the seminal experimental realization of one atom thick graphene sheets [1] along with the measurements of quantum Hall effect [2], a great deal of interest has emerged in both the fundamental research and the development of device engineering concepts. Graphene has an extremely high carrier mobility ~15,000 cm2 V−1 S−1 [3] and thermal conductivity 5000 W m−1 K−1 [4] with a very strong Young’s modulus ~1 TPa [5]. The Dirac Fermions in graphene has caused both integer and fractional quantum Hall effect [6]. Unconventional superconductivity has also been realized in a 2-dimensional superlattice created by stacking two sheets of twisted graphene relative to each other by a small angle [7,8]. Along with the unique electronic features, graphene has displayed extraordinary optical responses. Graphene, being a one-atom-thick sheet of carbon exhibits significant absorption in the visible to infrared wavelength region (2.3%) with reflectance less than 0.1% [9]. This means that a one-atom-thick graphene layer is extremely transparent having a high degree of flexibility with excellent optical properties.
As the variety of graphene for commercial applications is intensifying, so does the compulsion for scientists to exploit reliable characterization methods for studying basic properties and for engineers to design optoelectronic devices for achieving optimum performance. To assess the optical traits of graphene, several measurements have been performed using spinning-disc Picometrology (SDP), spectroscopic ellipsometry (SE), and transmission spectroscopy, etc. [10,11,12,13,14,15,16,17,18,19,20,21,22,23,24,25,26,27]. For graphene SiO2/Si wafer, the complex refractive index is measured earlier by SDP at 532 nm and 633 nm [10]. Optical constants of graphene have also been extracted by SE measurements [11,12,13,14,15,16,17,18,19,20,21,22,23,24,25]. However, the existing results of optical behavior for graphene are significantly different. The difference in outcomes is linked either to the methods used for preparing graphene samples with different numbers of layers and/or substrates.
This work aimed to understand the optical and temperature-dependent features of commercial graphene. A series of graphene samples were prepared by ACS Material, LLC using standard manufacturing procedures (product detail found on the website of https://www.acsmaterial.com/graphene-on-silicon-substrate.html accessed on 29 March 2021). Graphene was first prepared on copper foil by the chemical vapor deposition (CVD) method and then transferred onto Si and on SiO2/Si substrates. The graphene qualities are examined through Raman spectroscopy and atomic force microscopy (AFM). The temperature-dependent optical properties are systemically investigated by exploiting a variable angle spectroscopic ellipsometry (VASE) method. The refractive index (n) and extinction coefficient (k) of the graphene sheets having different layers prepared on Si and SiO2/Si substrates are carefully analyzed, establishing temperature-dependence between 300 K and 500 K. The anomalous optical dispersions of graphene prepared on Si and SiO2/Si in the visible to near-infrared wavelength region (i.e., λ between 400 to 1200 nm), are well described by a modified Sellmeier equation.

2. Materials and Methods

Four graphene samples were meticulously examined by using VASE and variable temperature methods. The samples considered here were: (a) monolayer and bilayer graphene on Si substrate, and (b) monolayer, bilayer graphene on SiO2/Si substrate (a Si wafer covered with a 300 nm SiO2 layer). The dimensions of the graphene sheets were 2.54 cm × 2.54 cm. To examine the graphene qualities, room temperature Raman scattering spectra were measured using a micro-region Raman spectrometer with an excitation laser source of a wavelength of 532 nm and a spot size of 2 μm (iHR550, HORIBA, Kyoto, Japan), and the surface morphology of the samples were examined by the atomic force microscope (Dimension Icon, BRUKER NANO Inc., Billerica, MA, USA). The SE measurements were performed by using a Müeller Matrix Ellipsometer (Wuhan Eoptics Technology Co. Ltd., Wuhan, China) equipped with a heating and cooling system (THMS600, Linkam, Surrey, UK). The optical constants were extracted by modeling and data fitting analysis. The SE has the advantages of being a non-destructive and highly accurate technique. In the VASE studies, we used deuterium and halogen sources and varied the incident angles from 50°, 55°, 60°, 65°, and 70°, respectively. The beam size was about 4 mm. To study the temperature-dependent characteristics of graphene, we recorded the angle of polarization psi (ψ) and phase difference delta (Δ) of the reflective polarization lights between 300–500 K in the steps of 20 K.
To extract the optical constants, we fitted and modeled the recorded data of psi (ψ) and delta (Δ) by using Eometrics (Wuhan Eoptics Technology Co. Ltd., Wuhan, China). In our data analysis, a three-layer model was adopted, which properly included contributions from the substrate, oxide layer, and graphene, and the goodness of fitting was evaluated by the Mean Squared Error (MSE) method. Since the manufacturing procedures would induce a modification of bandgap properties of graphene [28,29,30,31], the dispersion properties of the graphene layers were described by 5 Tauc-Lorentz oscillators and 1 Drude oscillator. As for the oxide layer (SiO2) and the substrate (Si), their dispersions were described by the Sellmeier and parametric models which were provided by the materials database of Eometrics.

3. Results and Discussion

3.1. Raman Scattering and AFM Measurements

Raman spectroscopy was used to characterize the quality of the transferred graphene. Figure 1 shows the room temperature Raman scattering spectra recorded for four graphene samples, in which all samples displayed typical Raman peaks of graphene. All graphene samples included two intrinsic Raman peaks (G, 2D) and two disorder-induced peaks (D, D+D” peaks for graphene on Si, and D, D’+D” peaks for graphene on SiO2) [32,33,34]. Among the defect-activated peaks, D’+D” and D+D” corresponded to the combination mode of the D’ and D” modes as well as the D and D” modes [34]. Si had strong absorption in the visible wavelength, the intensity of Raman scattering light for the graphene on Si substrate was weaker than that of graphene on SiO2/Si substrate. The Raman scattering results indicated there existed a degree of defects in the four transferred graphene sheets. The intensity ratio between the 2D band and the G band can determine the number of graphene layers [35,36,37]. The I2D/IG values were higher than 2, in the range between 1 and 2, and lower than 1, corresponding to the presence of monolayer graphene, bilayer graphene, and three or more layers, respectively [35]. As for our four graphene samples, the I2D/IG values of two monolayer graphene were respectively 2.1 (on Si substrate) and 3.4 (on SiO2/Si substrate) while those of two bilayer graphene were 1.5 (on Si substrate) and 1.7 (SiO2 /Si substrate).
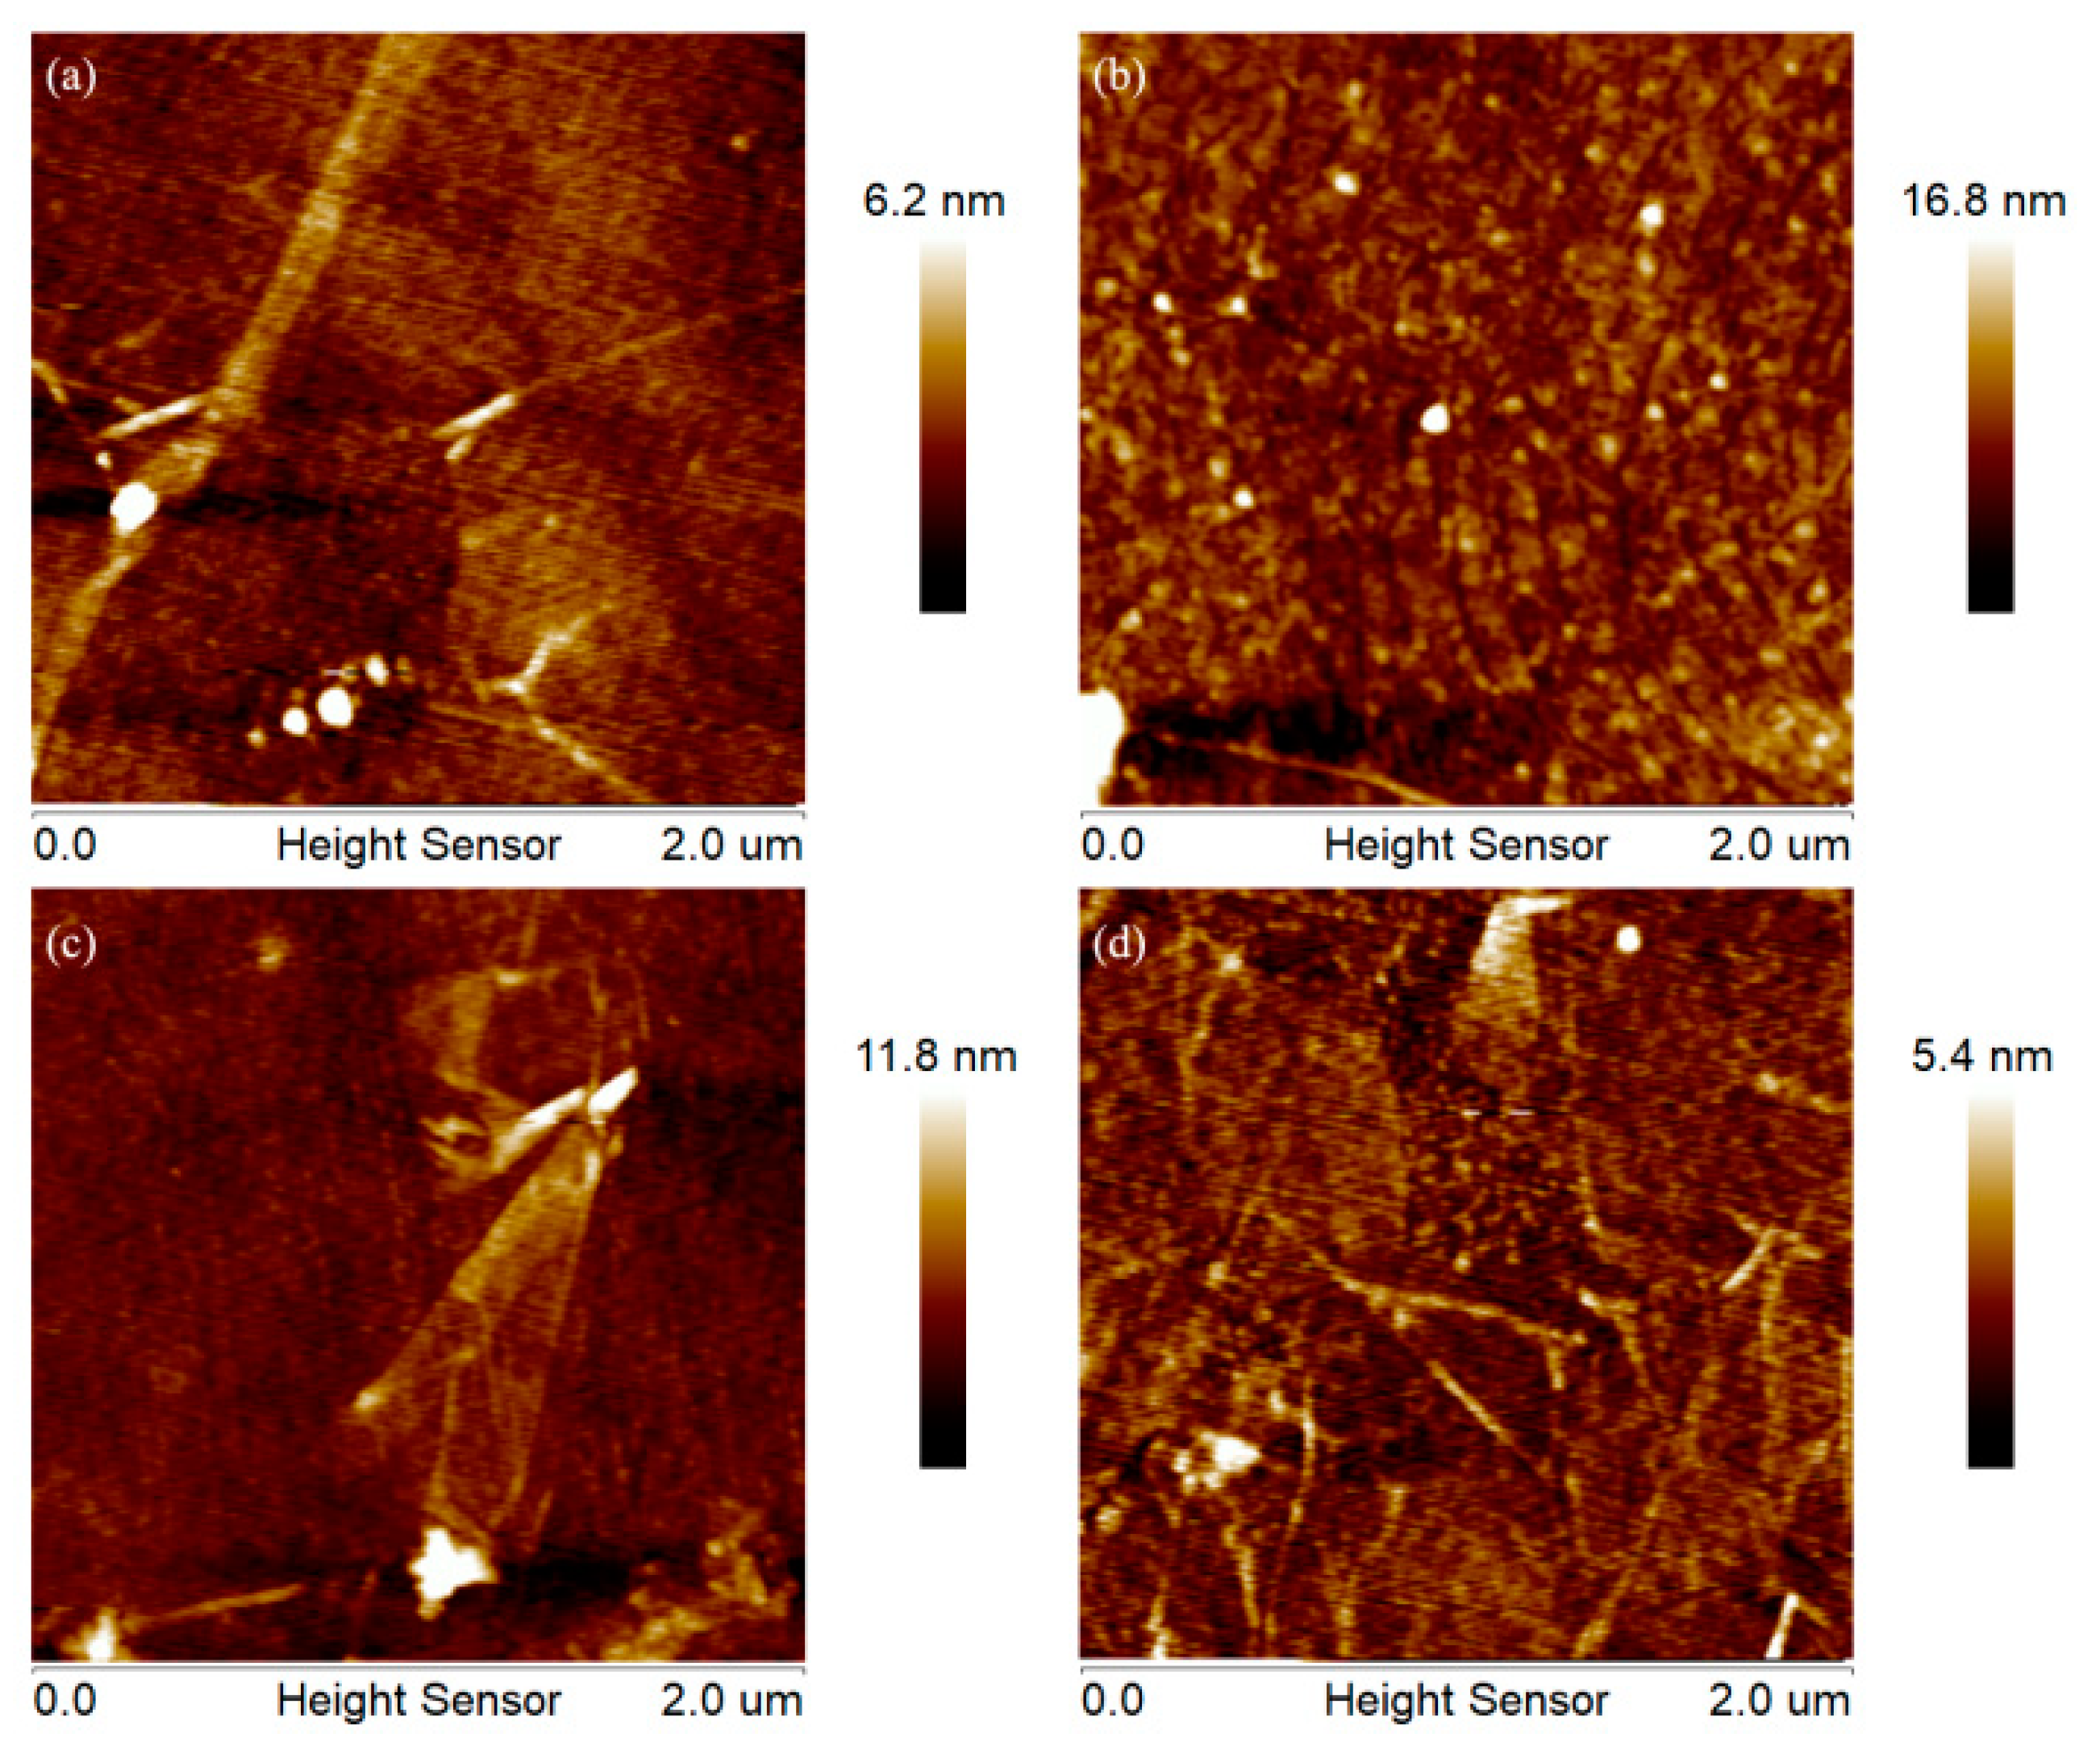
Figure 2 illustrates the AFM images of graphene samples displaying smooth surfaces with a few surface contaminants. In 2 μm × 2 μm AFM images, the Root Mean Square (RMS) roughness was around 1.5–4.5 nm and the average roughness was 0.6–0.9 nm respectively. The samples had enough smooth surfaces for SE measurements and analysis.

3.2. Spectroscopic Ellipsometric Measurements

The optical characteristics of graphene samples were investigated by variable angle spectroscopic ellipsometry. In Figure 3a–d we have displayed the measured psi(ψ) and delta(Δ) at 300 K for monolayer graphene samples on Si and SiO2/Si substrates, respectively by varying incident angles from 50°, 55°, 60°, 65°, and 70°. The experimental data (black solid lines) and the fitted curves (red dotted lines) compared reasonably well. In Table 1, for four samples the thicknesses of graphene and oxide layers and the MSE values are presented. The low MSE values (<15 in Table 1) indicated good fits. The thicknesses of monolayer graphene on Si and on SiO2/Si were 0.38 nm and 0.34 nm, respectively, which was in accordance with those previously reported [13,16,21,25]. In Table 2, the fitting parameters of Tauc-Lorentz and Drude oscillators for monolayer graphene on Si and SiO2/Si substrates are presented, where Ampn, Brn, Eon, and Egn correspond to amplitude, broadening, center energy, and bandgap energy of oscillator n (n is an integer), and Scat. Time is scattering time, respectively. The bandgap energy of Tauc-Lorentz oscillators as shown in Table 2 well agreed with the reports in References [28,29,30,31], indicating the dispersion models for graphene layers we have chosen were reasonable.
The extracted optical constants (n and k) in the wavelength range of 218–1200 nm are shown in Figure 3e,f. It is to be noted that graphene sheets on Si and on SiO2/Si exhibited markedly different optical properties. In the range of λ between 400–1200 nm, the monolayer graphene on Si exhibited anomalous dispersions with a larger extinction coefficient than those on SiO2/Si. In the ultraviolet wavelength range λ between 220–400 nm, the n of monolayer graphene on Si displayed a sharp peak while on SiO2/Si it revealed a moderate feature. Likewise, the k of monolayer graphene on Si exhibited a pronounced peak at ~4.64 eV while a weak peak was noticed at ~4.78 eV for graphene on SiO2/Si. The peak position of k, which is considered as a van Hove singularity of graphene density of state [11], showed an energy difference of 0.14 eV for two samples. Obviously, the interaction of graphene with substrate had significantly affected the optical properties of graphene.
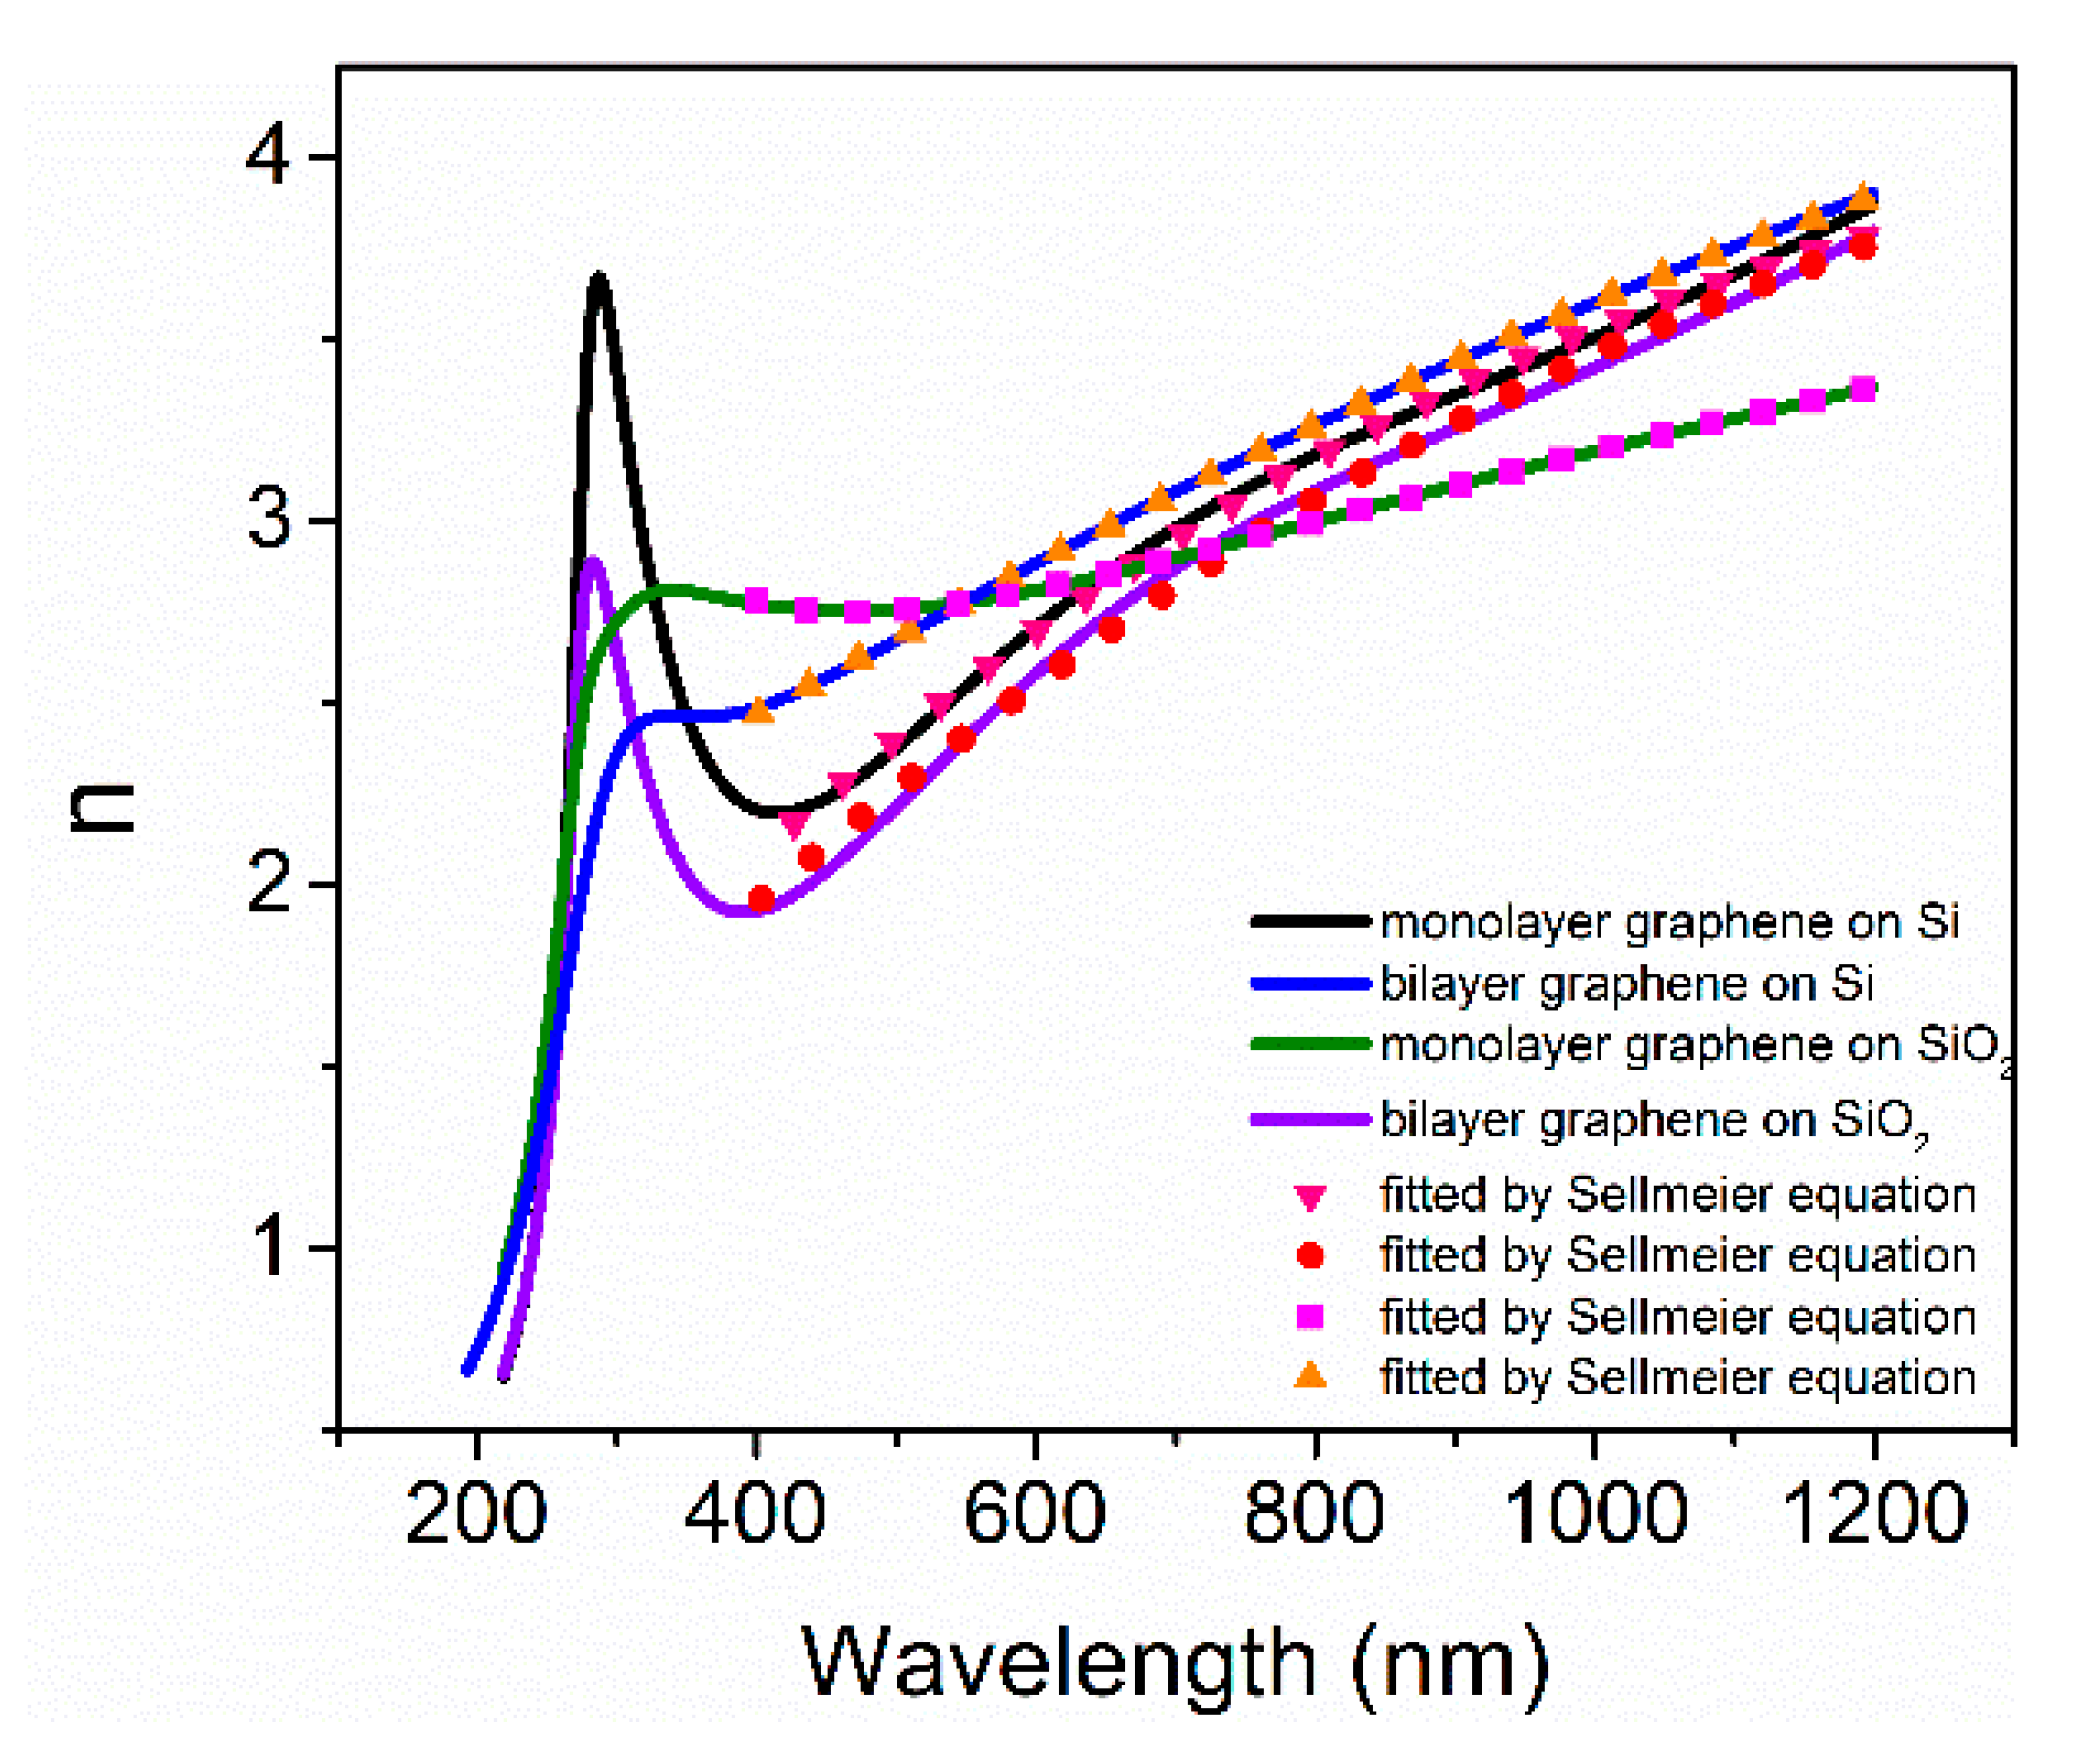
Moreover, we compared the optical constants of monolayer and bilayer graphene. In Figure 4 the optical constants extracted by SE measurements are displayed for four graphene samples along with the fitted results. We noticed that for graphene samples on Si substrate, the n decreased while k increased with the increase in the number of layers. Moreover, the peak positions of k were found redshifted. This was possibly due to the increase of the number of layers—the layer-to-layer interaction decreased the energy of π-to-π* exciton transition near the M point of the Brillouin zone [38,39]. Unlike graphene on Si, the bilayer graphene on SiO2/Si displayed a greater n than that of monolayer graphene as wavelengths were longer than 600 nm. Moreover, it exhibited significant dispersion features compared to the monolayer graphene on SiO2/Si. It has been suggested earlier that the substrates modulate the dispersion of graphene sheets and the enhanced layer-to-layer interaction of graphene degrades the excitonic effects [38,39,40].
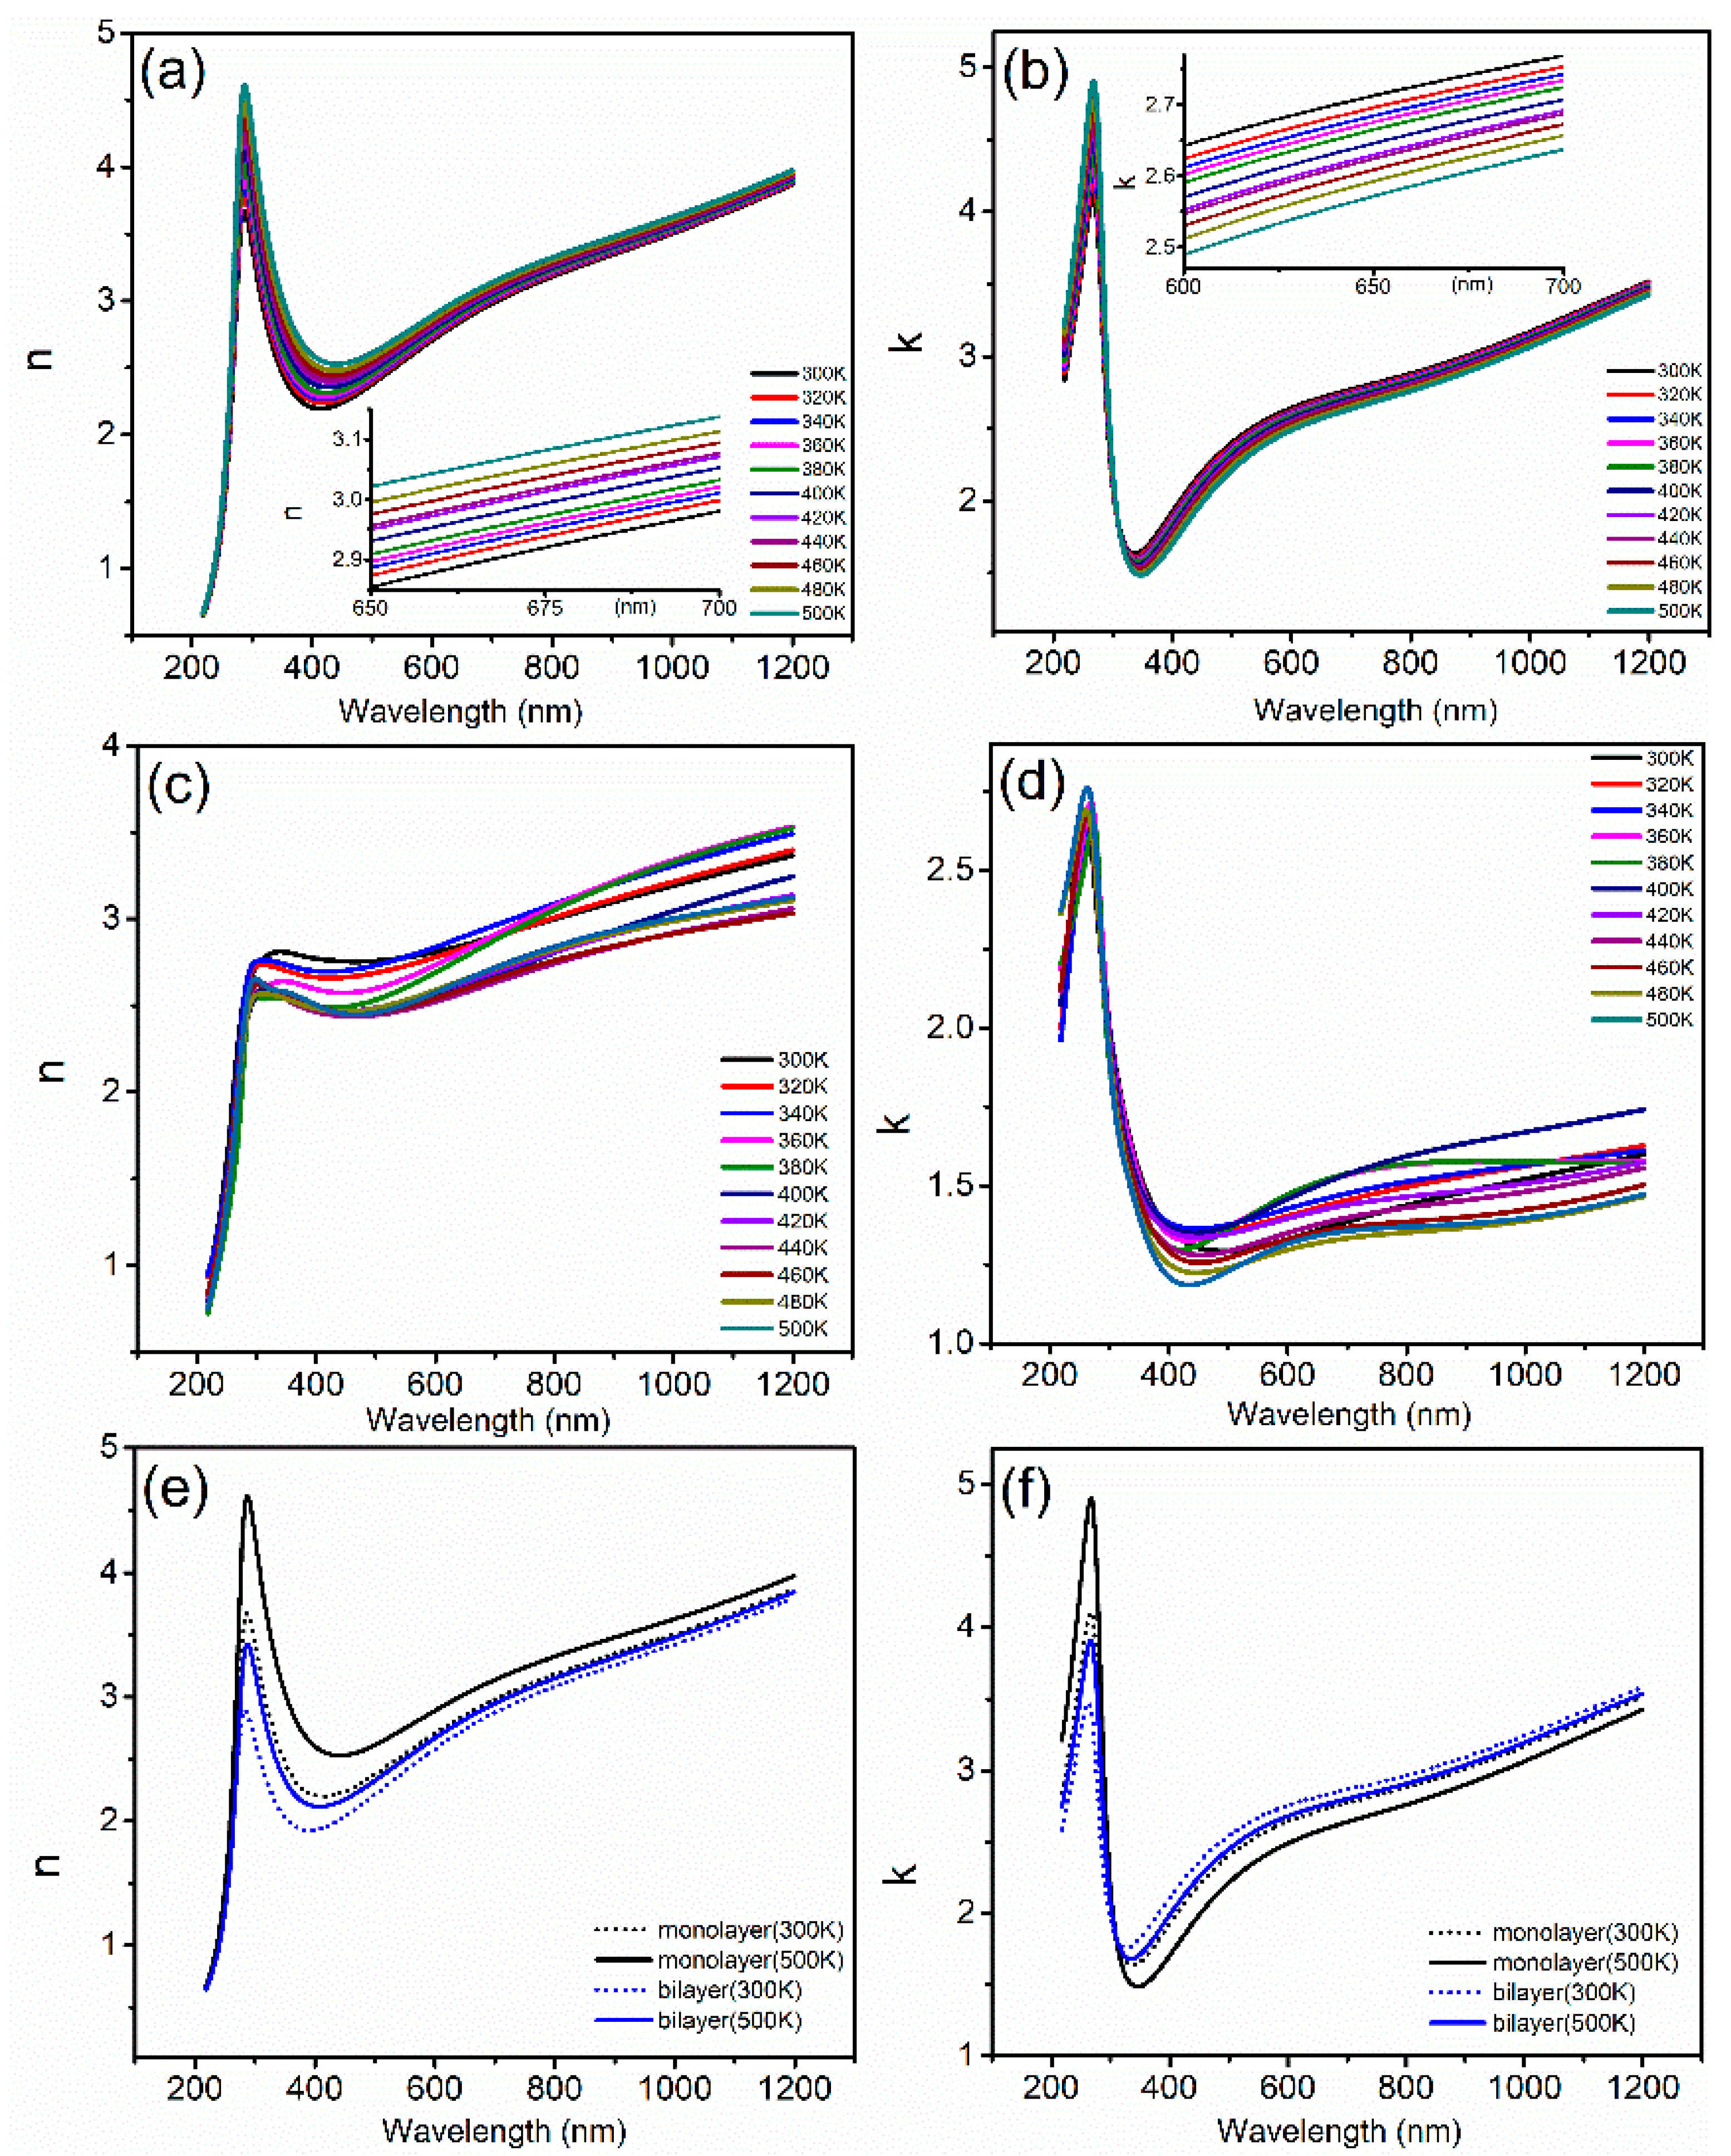
In Figure 5 we have displayed the results of temperature-dependent optical constants for two monolayer graphene on Si and SiO2/Si substrates from 300 K to 500 K with a step of 20 K. The optical constants of monolayer graphene on Si varied consistently with temperature. In the region of λ between 400 to 1200 nm, we noticed the n increased while k decreased with the increase of temperature because the coupling between light and electrons was intensified in graphene. However, the optical constants [n, k] of monolayer graphene on SiO2/Si exhibited unpredictable variations, i.e., the refractive index n and the extinction coefficient k displayed fluctuations with the increase of temperature.
Figure 5e,f illustrates respectively the difference of the extracted optical constants by VASE measurements for four samples of graphene sheets prepared on Si substrate at 300 K and at 500 K. It was revealed that the difference of optical constants between 300 K and 500 K for the monolayer graphene on Si were bigger than those of bilayer graphene, suggesting more temperature sensitivity of the monolayer graphene. It could be caused by the fact that monolayer graphene has more defects, stronger graphene-substrate interactions, and lower thermal stability. The temperature effect was relatively smaller and the thermal stability was enhanced with the increasing number of layers.
Graphene is usually applied in photoelectric devices. The optical constant n(λ) reflects the dispersion properties of graphene. It is essential to understand the dependence of dispersion properties of graphene on wavelength and temperature in the transparent region. To further explore the specific dispersion relationship of graphene on Si and on SiO2/Si substrates, we fitted the n by using a like-Sellmeier equation based on the extracted data in the wavelength range of λ between 400–1200 nm at room temperature. The traditional Sellmeier equation describing the dispersion is given by [41]:
n λ = [ 1 + j = 1 A j λ 2 λ 2 B j ] 1 / 2
where λ is the wavelength, Aj and Bj are the fitting parameters, and j is an integer. The fitting results for monolayer and bilayer graphene are displayed in Figure 6. The dispersion curves of graphene on Si were fitted well by a like-Sellmeier equation with j = 1 and for graphene on SiO2/Si with j = 2. The fitting parameters are recorded in Table 3 and the fitting parameter B1 was negative which mainly reflected an anomalous dispersion of graphene. It is worth noting that graphene on SiO2/Si possessed more complex dispersion features. It was possibly caused by an enhancing layer-to-layer interaction which complicated the dispersion relationship.
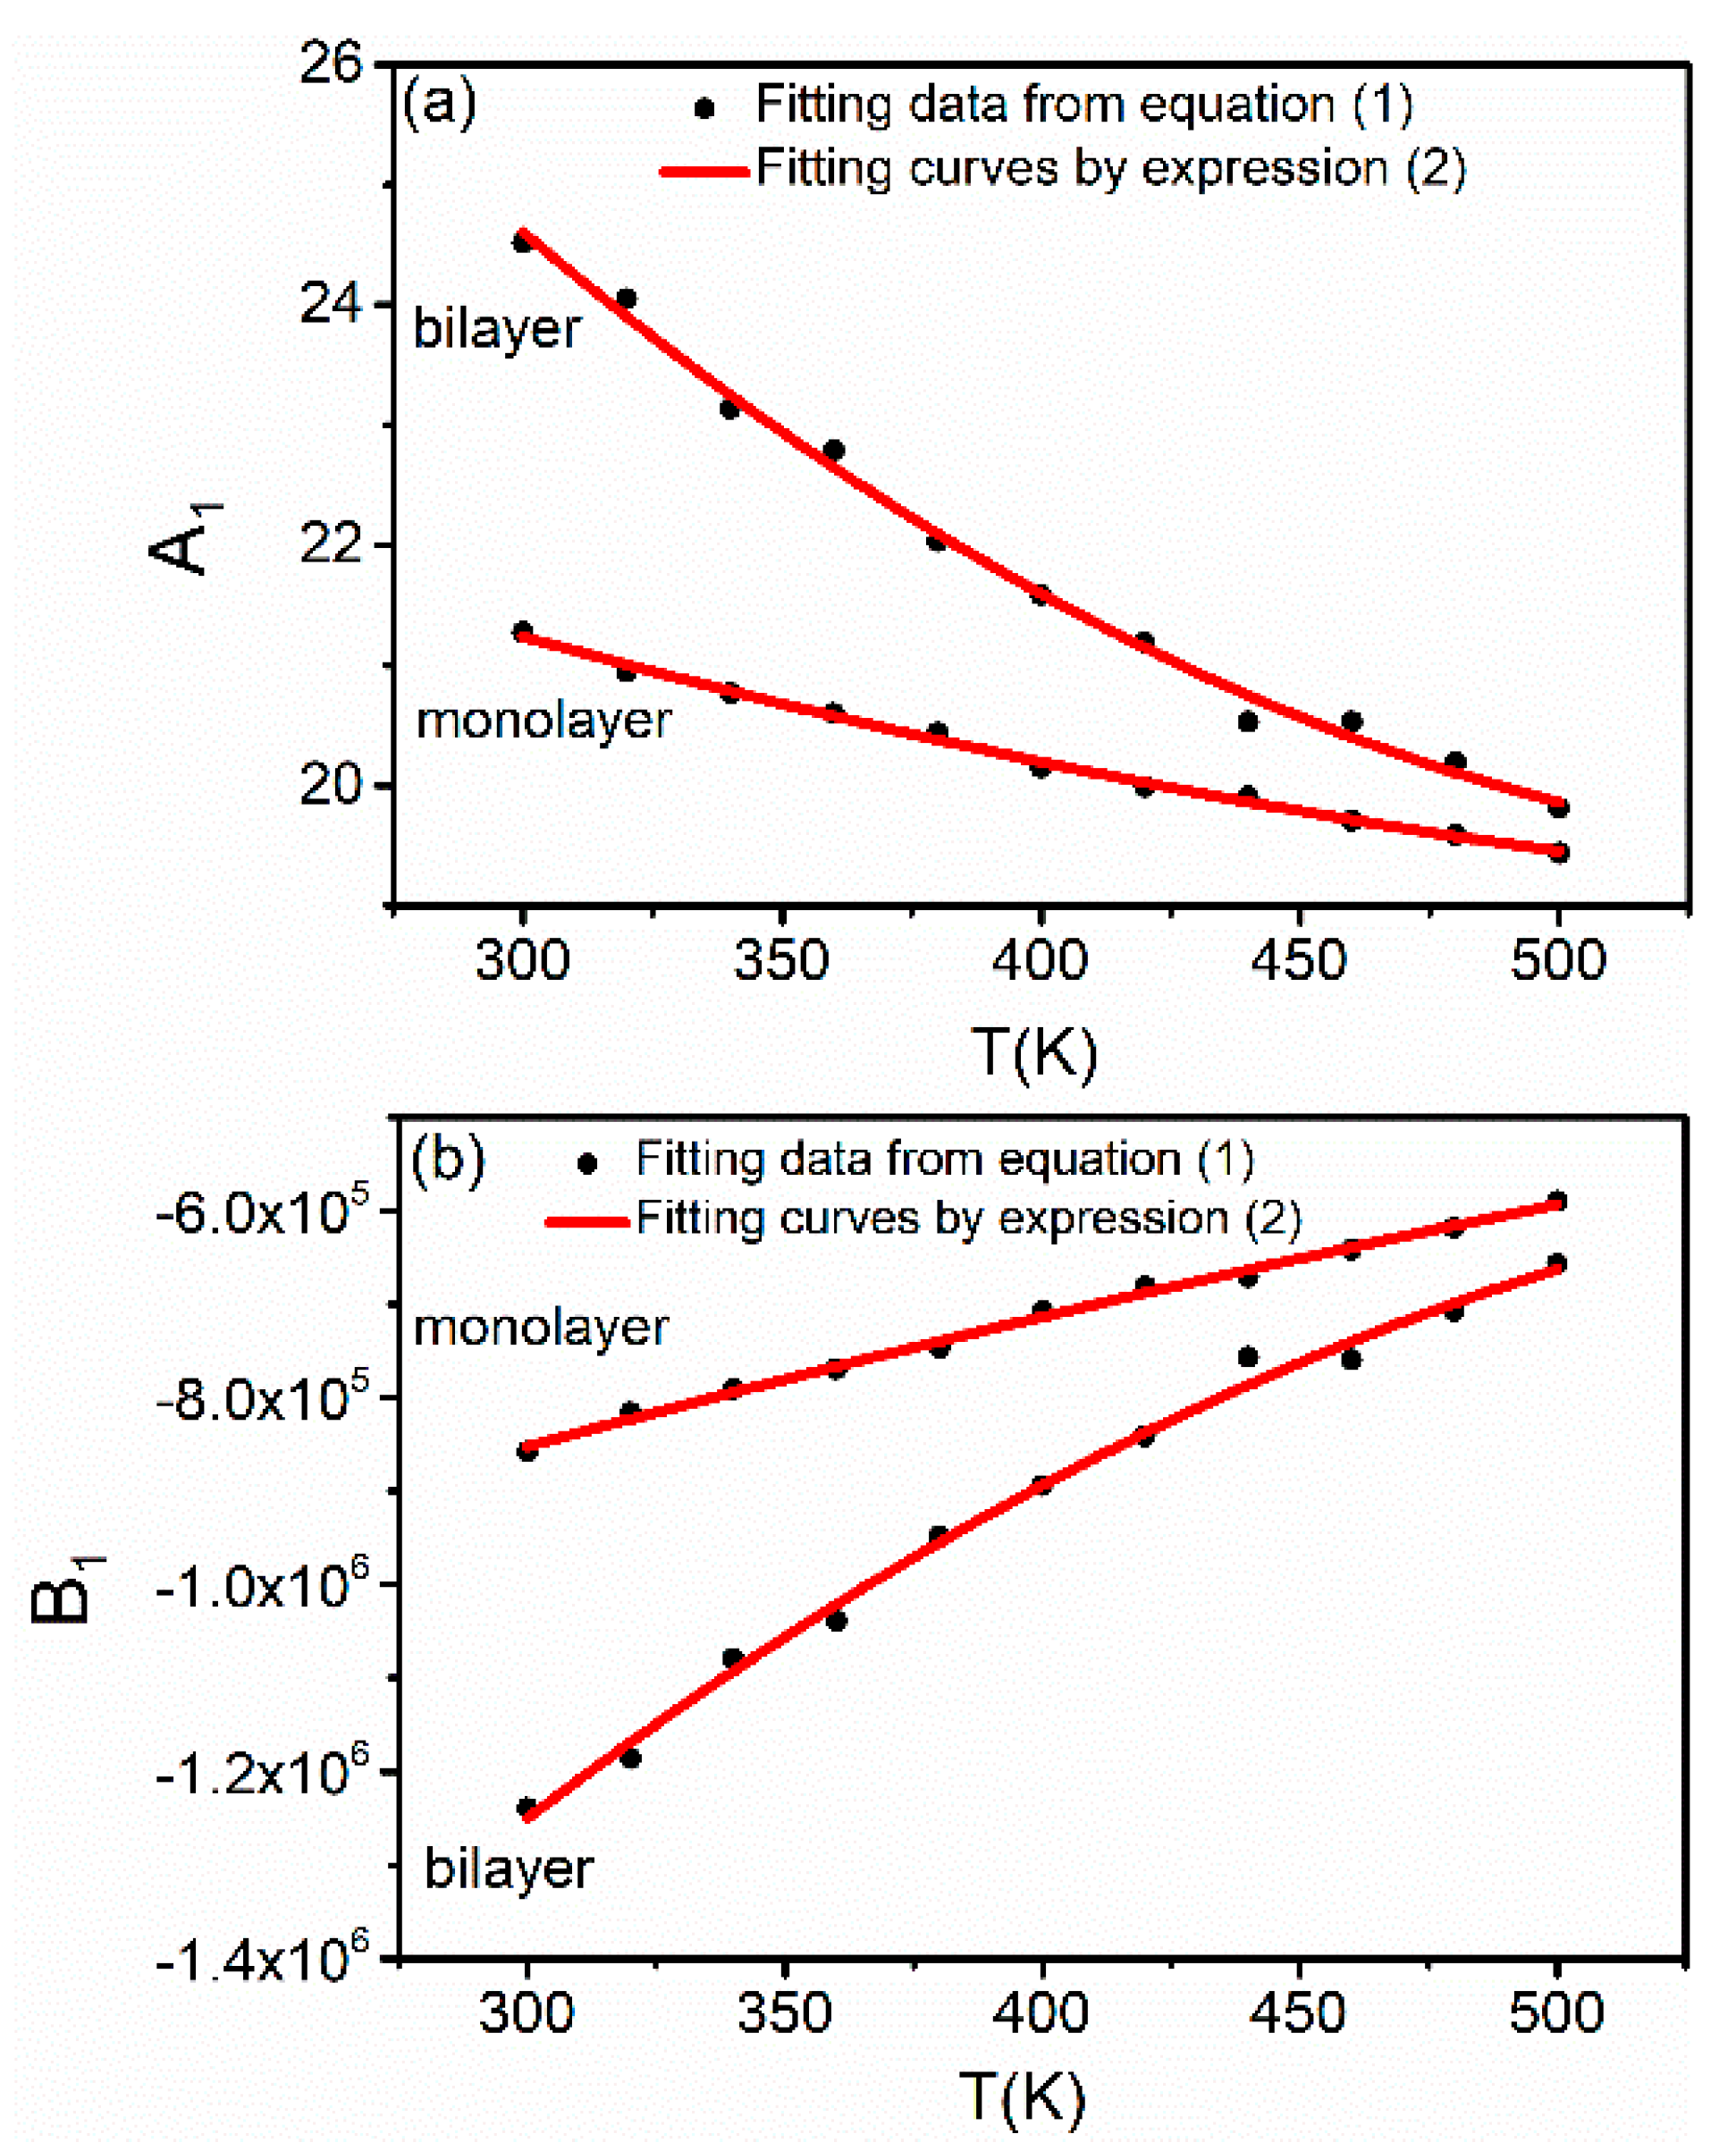
Furthermore, for graphene on Si substrate, the parameters A1 and B1 as a function of temperature (T) were well represented by a polynomial which is given by.
A 1 ( T ) = a 0 + a 1 T + a 2 T 2 B 1 ( T ) = b 0 + b 1 T + b 2 T 2
where a0, a1, a2, b0, b1, and b2 are constants. By substituting the testing temperature and values of A1 and B1 into Equation (2) the fitted results are shown in Figure 7. The red solid lines are the fitted curves using Equation (2), with parameter values of a0, a1, a2, b0, b1, and b2 tabulated in Table 4. Combining the fitting results of expressions (1) and (2), the complete dispersion and temperature-dependent properties of graphene were revealed.

4. Conclusions

In summary, the results of the comprehensive study for the optical properties of graphene revealed interesting characteristics which are not only substrate-, layer- but also temperature-dependent. The graphene samples on Si substrate exhibited significant dispersion features and higher exciton transition energy than those on SiO2/Si substrate. With the increase of temperatures from 300 K to 500 K, the optical constants of monolayer graphene on Si varies regularly while the monolayer graphene on SiO2/Si has fluctuations. An experiential formula of a like-Sellmeier expression is demonstrated well exemplifying the wavelength dependence of refractive indices of monolayer and bilayer graphene samples. In addition, for monolayer graphene on Si, the temperature-dependent dispersion properties are well described by combining the like-Sellmeier equation and a quadratic expression.

Author Contributions

Conceptualization, L.W. (Lingyu Wan) and S.W.; Data curation, S.W. and L.W. (Liangmin Wei); Formal analysis, L.W. (Lingyu Wan) and S.W.; Funding acquisition, L.W. (Lingyu Wan); Investigation, L.W. (Lingyu Wan), S.W. and Z.F.; Project administration, L.W. (Lingyu Wan); Resources, L.W. (Lingyu Wan), K.H. and Z.F.; Supervision, L.W. (Lingyu Wan); Writing—original draft, L.W. (Lingyu Wan) and S.W.; Writing—review & editing, L.W. (Lingyu Wan), D.N.T. and Z.F. All authors have read and agreed to the published version of the manuscript.

Funding

This research was funded by the Guangxi Natural Science Foundation, China (2018GXNSFAA138127).

Conflicts of Interest

The authors declare no conflict of interest.

References

  1. Novoselov, K.S.; Geim, A.K.; Morozov, S.V.; Jiang, D.; Zhang, Y.; Dubonos, S.V.; Grigorieva, I.V.; Firsov, A.A. Electric Field Effect in Atomically Thin Carbon Films. Science 2004, 306, 666–669. [Google Scholar] [CrossRef] [Green Version]
  2. Novoselov, K.S.; Geim, A.K.; Morozov, S.V.; Jiang, D.; Katsnelson, M.I.; Grigorieva, I.V.; Dubonos, S.V.; Firsov, A.A. Two-dimensional gas of massless Dirac fermions in graphene. Nature 2005, 438, 197–200. [Google Scholar] [CrossRef]
  3. Geim, A.K.; Novoselov, K.S. The rise of graphene. Nat. Mater. 2007, 6, 183–191. [Google Scholar] [CrossRef] [PubMed]
  4. Balandin, A.A.; Ghosh, S.; Bao, W.Z.; Calizo, I.; Teweldebrhan, D.; Miao, F.; Lau, C.N. Superior Thermal Conductivity of Single-Layer Graphene. Nano Lett. 2008, 8, 902–907. [Google Scholar] [CrossRef]
  5. Lee, C.; Wei, X.; Kysar, J.W.; Hone, J. Measurement of the Elastic Properties and Intrinsic Strength of Monolayer Graphene. Science 2008, 321, 385–388. [Google Scholar] [CrossRef]
  6. Novoselov, K.S.; Jiang, Z.; Zhang, Y.; Morozov, S.V.; Stormer, H.L.; Zeitler, U. Room-Temperature Quantum Hall Effect in Graphene. Science 2007, 315, 1379. [Google Scholar] [CrossRef] [Green Version]
  7. Wu, F.C.; Hwang, E.; Das Sarma, S. Phonon-induced giant linear-in-T resistivity in magic angle twisted bilayer graphene: Ordinary strangeness and exotic superconductivity. Phys. Rev. B 2019, 99, 165112. [Google Scholar] [CrossRef] [Green Version]
  8. Lu, X.B.; Stepanov, P.; Yang, W.; Xie, M.; Aamir, M.A.; Das, I.; Urgell, C.; Watanabe, K.; Taniguchi, T.; Zhang, G.Y.; et al. Superconductors, orbital magnets and correlated states in magic-angle bilayer graphene. Nature 2019, 574, 653–657. [Google Scholar] [CrossRef] [PubMed]
  9. Nair, R.R.; Blake, P.; Grigorenko, A.N.; Novoselov, K.S.; Booth, T.J.; Stauber, T.; Peres, N.M.R.; Geim, A.K. Fine Structure Constant Defines Visual Transparency of Graphene. Science 2008, 320, 1308. [Google Scholar] [CrossRef] [Green Version]
  10. Wang, X.F.; Chen, Y.P.; Nolte, D.D. Strong anomalous optical dispersion of graphene: Complex refractive index measured by Picometrology. Opt. Express 2008, 16, 22105–22112. [Google Scholar] [CrossRef]
  11. Kravets, V.G.; Grigorenko, A.N.; Nair, R.R.; Blake, P.; Anissimova, S.; Novoselov, K.S.; Geim, A.K. Spectroscopic ellipsometry of graphene and an exciton-shifted van Hove peak in absorption. Phys. Rev. B 2010, 81, 115413. [Google Scholar] [CrossRef] [Green Version]
  12. Wurstbauer, U.; Roling, C.; Wurstbauer, U.; Wegscheider, W.; Vaupel, M.; Thiesen, P.H.; Weiss, D. Imaging ellipsometry of graphene. Appl. Phys. Lett. 2010, 97, 231901. [Google Scholar] [CrossRef] [Green Version]
  13. Weber, J.W.; Calado, V.E.; van de Sanden, M.C.M. Optical constants of graphene measured by spectroscopic ellipsometry. Appl. Phys. Lett. 2010, 97, 091904. [Google Scholar] [CrossRef]
  14. Nelson, F.J.; Kamineni, V.K.; Zhang, T.; Comfort, E.S.; Lee, J.U.; Diebold, A.C. Optical properties of large-area polycrystalline chemical vapor deposited graphene by spectroscopic ellipsometry. Appl. Phys. Lett. 2010, 97, 253110. [Google Scholar] [CrossRef]
  15. Isić, G.; Jakovljević, M.; Filipović, M.; Jovanović, D.; Vasić, B.; Lazović, S.; Puač, N.; Petrović, Z.L.; Kostić, R.; Gajić, R.; et al. Spectroscopic ellipsometry of few-layer graphene. J. Nanophotonics 2011, 5, 051809. [Google Scholar] [CrossRef]
  16. Losurdo, M.; Giangregorio, M.M.; Capezzuto, P.; Bruno, G. Ellipsometry as a Real-Time Optical Tool for Monitoring and Understanding Graphene Growth on Metals. J. Phys. Chem. C 2011, 115, 21804–21812. [Google Scholar] [CrossRef]
  17. Kostruba, A.M. Influence of the graphene substrate on morphology of the gold thin film. Spectroscopic ellipsometry study. Appl. Surf. Sci. 2013, 283, 603–611. [Google Scholar] [CrossRef]
  18. Matković, A.; Ralević, U.; Chhikara, M.; Jakovljević, M.M.; Jovanović, D.; Bratina, G.; Gajić, R. Influence of transfer residue on the optical properties of chemical vapor deposited graphene investigated through spectroscopic ellipsometry. J. Appl. Phys. 2013, 114, 93505. [Google Scholar] [CrossRef]
  19. Shen, C.C.; Tseng, C.C.; Lin, C.T.; Li, L.J.; Liu, H.L. Optical properties of nitrogen-doped graphene thin films probed by spectroscopic ellipsometry. Thin. Solid. Films 2014, 571, 675–679. [Google Scholar] [CrossRef]
  20. Chang, Y.-C.; Liu, C.-H.; Liu, C.-H.; Zhong, Z.; Norris, T.B. Extracting the complex optical conductivity of mono- and bilayer graphene by ellipsometry. Appl. Phys. Lett. 2014, 104, 261909. [Google Scholar] [CrossRef] [Green Version]
  21. Ochoa-Martínez, E.; Gabás, M.; Barrutia, L.; Pesquera, A.; Centeno, A.; Palanco, S.; Zurutuza, A.; Algora, C. Determination of refractive index and extinction coefficient of standard production CVD-graphene. Nanoscale 2015, 7, 1491–1500. [Google Scholar] [CrossRef] [PubMed] [Green Version]
  22. Li, W.; Cheng, G.; Liang, Y.; Tian, B.; Liang, X.; Peng, L.; Hight Walker, A.R.; Gundlach, D.J.; Nguyen, N.V. Broadband optical properties of graphene by spectroscopic ellipsometry. Carbon 2016, 99, 348–353. [Google Scholar] [CrossRef] [Green Version]
  23. Pápa, Z.; Csontos, J.; Smausz, T.; Toth, Z.; Budai, J. Spectroscopic ellipsometric investigation of graphene and thin carbon films from the point of view of depolarization effects. Appl. Surf. Sci. 2017, 421, 714–721. [Google Scholar] [CrossRef] [Green Version]
  24. Song, B.K.; Gu, H.G.; Zhu, S.M.; Jiang, H.; Chen, X.G.; Zhang, C.W.; Liu, S.Y. Broadband optical properties of graphene and HOPG investigated by spectroscopic Mueller matrix ellipsometry. Appl. Surf. Sci. 2018, 439, 1079–1087. [Google Scholar] [CrossRef]
  25. Castriota, M.; Politano, G.G.; Vena, C.; De Santo, M.P.; Desiderio, G.; Davoli, M.; Cazzanelli, E.; Versace, C. Variable Angle Spectroscopic Ellipsometry investigation of CVD-grown monolayer graphene. Appl. Surf. Sci. 2019, 467, 213–220. [Google Scholar] [CrossRef]
  26. Sun, D.; Wu, Z.K.; Divin, C.; Li, X.B.; Berger, C.; de Heer, W.A.; First, P.N.; Norris, T.B. Ultrafast Relaxation of Excited Dirac Fermions in Epitaxial Graphene. Using Optical Differential Transmission Spectroscopy. Phys. Rev. Lett. 2008, 101, 157402. [Google Scholar] [CrossRef] [PubMed]
  27. Zhu, S.E.; Yuan, S.J.; Janssen, G.C.A.M. Optical transmittance of multilayer graphene. Europhys. Lett. 2012, 108, 17007. [Google Scholar] [CrossRef] [Green Version]
  28. Zhou, S.Y.; Gweon, G.H.; Fedorov, A.V.; First, P.N.; De Heer, W.A.; Lee, D.H.; Guinea, F.; Castro Neto, A.H.; Lanzara, A. Substrate induced bandgap opening in epitaxial graphene. Nat. Mater. 2007, 6, 770–775. [Google Scholar] [CrossRef] [PubMed] [Green Version]
  29. Peng, X.Y.; Ahuja, R. Symmetry breaking induced bandgap in epitaxial graphene layers on SiC. Nano Lett. 2008, 8, 4464–4468. [Google Scholar] [CrossRef] [PubMed]
  30. Tiwari, R.P.; Stround, D. Tunable band gap in graphene with a noncentrosymmetric superlattice potencial. Phys. Rev. B 2009, 79, 205435. [Google Scholar] [CrossRef] [Green Version]
  31. Azadeh, M.S.S.; Kokabi, A.; Hosseini, M.; Fardmanesh, M. Tunable bandgap opening in the proposed structure of silicon-doped graphene. Micro Nano Lett. 2011, 6, 582–585. [Google Scholar] [CrossRef] [Green Version]
  32. Das, A.; Chakraborty, B.; Sood, A.K. Raman spectroscopy of graphene on different substrates and influence of defect. Bull. Mater. Sci. 2008, 31, 579–584. [Google Scholar] [CrossRef]
  33. Cancado, L.G.; Jorio, A.; Ferreira, E.H.M.; Stavale, F.; Achete, C.A.; Capaz, R.B.; Moutinho, M.V.O.; Lombardo, A.; Kulmala, T.S.; Ferrari, A.C. Quantifying Defects in Graphene via Raman Spectroscopy at Different Excitation Energies. Nano 2011, 11, 3190–3196. [Google Scholar] [CrossRef] [Green Version]
  34. Eckmann, A.; Felten, A.; Verzhbitskiy, I.; Davey, R.; Casiraghi, C. Raman study on defective graphene: Effect of the excitation energy, type, and amount of defects. Phys. Rev. B 2013, 88, 035426. [Google Scholar] [CrossRef] [Green Version]
  35. Enzo, C.; Oreste, D.L.; Danilo, V.; Alfonso, P.; Marco, C.; Giovanni, D.; Penelope, D.S.M.; Alfredo, A.; Angela, F.; Tania, R.; et al. Characterization of graphene grown on copper foil by chemical vapor deposition (CVD) at ambient pressure conditions. J. Raman Spectrosc. 2018, 49, 1006–1014. [Google Scholar]
  36. Li, B.B.; Yu, D.P.; Zhang, S.L. Raman spectral study of silicon nanowires. Phys. Rev. B 1999, 59, 1645–1648. [Google Scholar] [CrossRef]
  37. Tan, P.H.; An, L.; Liu, L.Q.; Guo, Z.X.; Czerw, R.; Carroll, D.L.; Ajayan, P.M.; Zhang, N.; Guo, H.L. Probing the phonon dispersion relations of graphite from the double-resonance process of Stokes and anti Stokes Raman scatterings in multiwalled carbon nanotubes. Phys. Rev. B 2002, 66, 245410. [Google Scholar] [CrossRef] [Green Version]
  38. Mak, K.F.; Shan, J.; Heinz, T.F. Seeing Many-Body Effects in Single- and Few-Layer Graphene: Observation of Two-Dimensional Saddle-Point Excitons. Phys. Rev. Lett. 2011, 106, 046401. [Google Scholar] [CrossRef]
  39. Yang, L.; Deslippe, J.; Park, C.-H.; Cohen, M.L.; Louie, S.G. Excitonic Effects on the Optical Response of Graphene and Bilayer Graphene. Phys. Rev. Lett. 2009, 103, 186802. [Google Scholar] [CrossRef] [PubMed]
  40. Chae, D.-H.; Utikal, T.; Weisenburger, S.; Giessen, H.; von Klitzing, K.; Lippitz, M.; Smet, J. Excitonic Fano Resonance in Free-Standing Graphene. Nano Lett. 2011, 11, 1379–1382. [Google Scholar] [CrossRef] [PubMed] [Green Version]
  41. Tropf, W.J. Temperature-dependent refractive index models for BaF2, CaF2, MgF2, SrF2, LiF, NaF, KCI, ZnS, and ZnSe. Opt. Eng. 1995, 34, 1369–1373. [Google Scholar] [CrossRef]
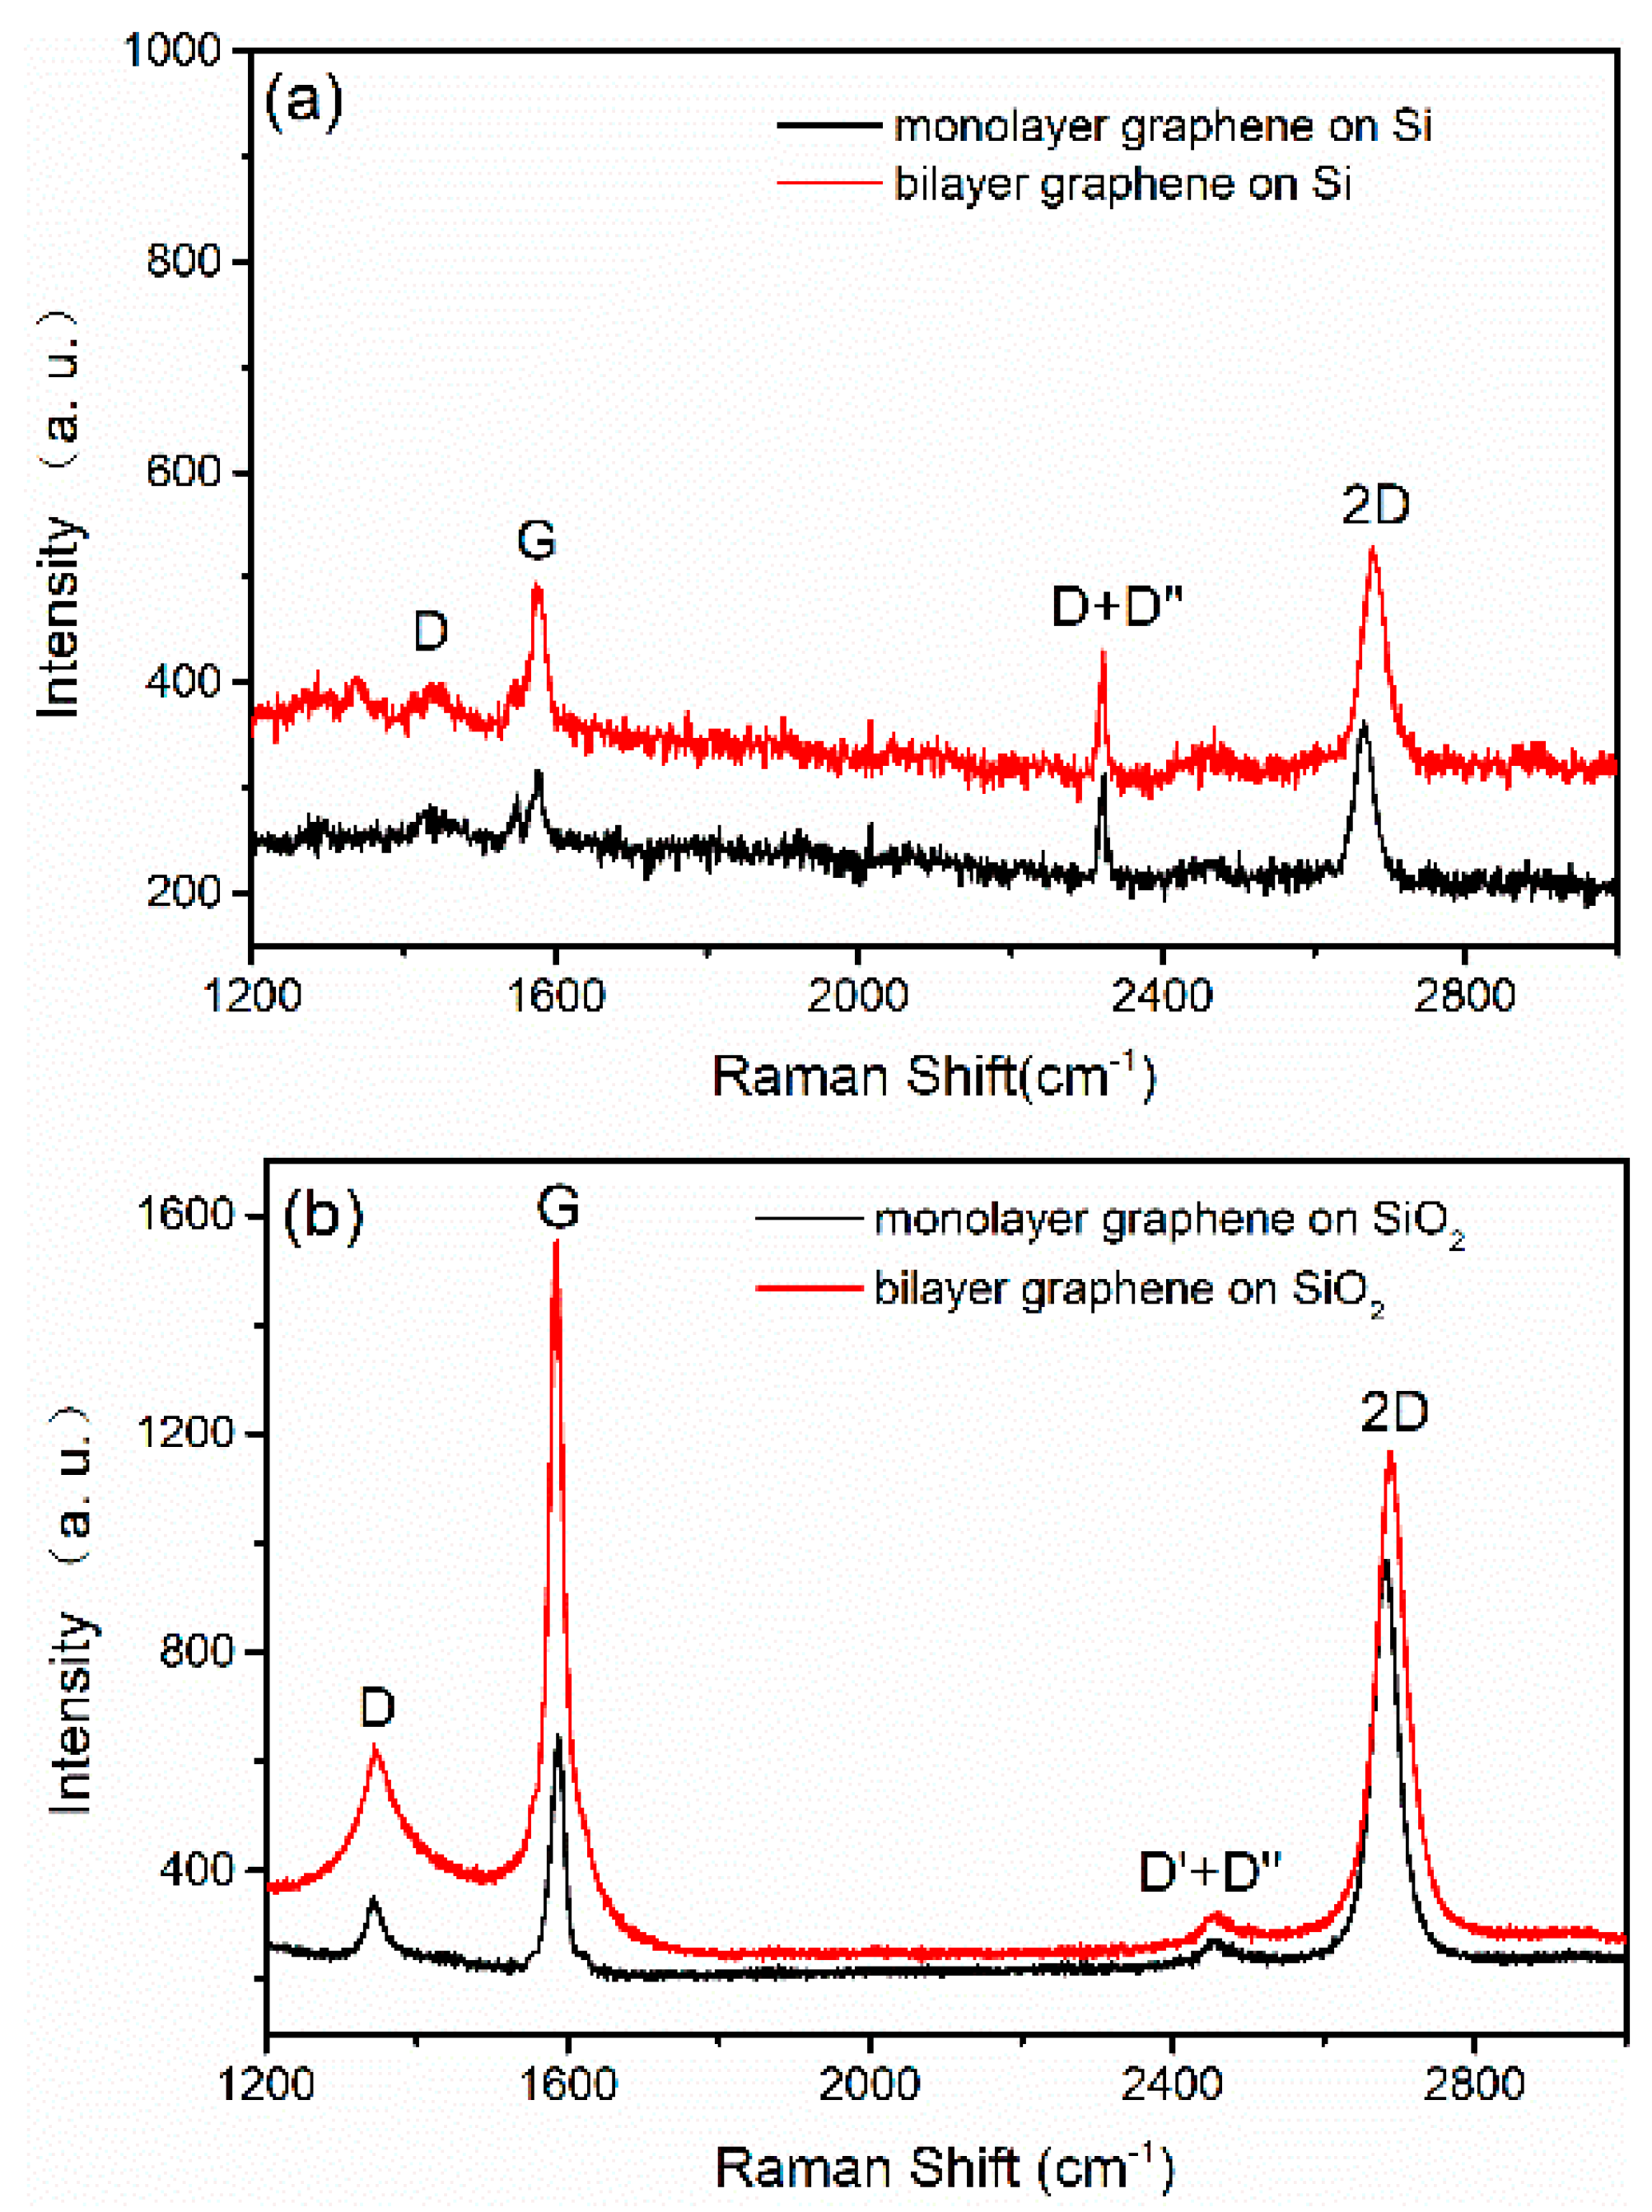
Figure 1. Raman scattering spectra of graphene samples. (a) graphene on Si substrate; (b) graphene on SiO2/Si substrate.
Crystals 11 00358 g001
Figure 2. Atomic force microscopy (AFM) images of graphene samples. (a) monolayer graphene on Si substrate; (b) bilayer graphene on Si substrate; (c) monolayer graphene on SiO2 substrate; (d) bilayer graphene on SiO2 substrate.
Crystals 11 00358 g002
Figure 3. Variable angle spectroscopic ellipsometry of graphene on Si and on SiO2/Si substrates at room temperature. the measured (black line) and fitting (red dot) psi(ψ) and delta(Δ) spectra for the monolayer graphene on Si substrate (a,b) and on SiO2/Si substrate (c,d), (e,f) represent the extracted refractive indices (n) and the extinction coefficients (k) by SE fitting.
Crystals 11 00358 g003
Figure 4. Layer-dependent optical constants of graphene on Si (a,b) and on SiO2/Si substrate (c,d).
Crystals 11 00358 g004
Figure 5. Temperature-dependent optical constants of graphene on Si substrate (a,b) and on SiO2/Si substrate (c,d) from 300 K to 500 K with a step of 20 K. (e,f) optical constants of four graphene samples on Si at 300 K and at 500 K.
Crystals 11 00358 g005
Figure 6. The refractive indices of graphene on Si and on SiO2/Si substrates fitted by a like-Sellmeier Equation (1) in the wavelength range of 400–1200 nm.
Crystals 11 00358 g006
Figure 7. The parameters A1 and B1 as a function of temperature from 300 K to 500 K for the graphene on Si substrate.
Crystals 11 00358 g007
Table 1. Thicknesses and mean squared error (MSE) values of graphene samples.
Samples1 Layer on Si2 Layers on Si1 Layer on
SiO2/Si
2 Layers on
SiO2/Si
Thickness
(nm)
Graphene0.380 ± 0.0020.730 ± 0.0050.340 ± 0.0010.880 ± 0.001
Oxide Layer4.560 ± 0.0044.700 ± 0.008297.980 ± 0.011293.370 ± 0.011
MSE4.2524.86811.56413.498
Table 2. The fitting parameters of Tauc-Lorentz and Drude oscillators for monolayer graphene on Si and SiO2/Si substrates (300 K).
Graphene SamplesTauc-LorentzAmp1 = 108.5431Br1 = 1.024Eo1 = 0.433 eVEg1 = 0.138 eV
Monolayer on SiTauc-LorentzAmp2 = 26.2332Br2 = 2.677Eo2 = 2.085 eVEg2 = 0.233 eV
Tauc-LorentzAmp3 = 11.5482Br3 = 7.543Eo3 = 2.944 eVEg3 = 0 eV
Tauc-LorentzAmp4 = 7.2054Br4 = 1.307Eo4 = 4.492 eVEg4 = 0.191 eV
Tauc-LorentzAmp5 = 14.3884Br5 = 0.56Eo5 = 4.477 eVEg5 = 0.87 eV
DrudeRsisitivity = 0.0008 Ω cmScat. Time = 12.576 fs--
Monolayer on SiO2/SiTauc-LorentzAmp1 = 41.068Br1 = 2.783Eo1 = 0.329 eVEg1 = 0.174 eV
Tauc-LorentzAmp2 = 24.0227Br1 = 2.783Eo2 = 1.799 eVEg2 = 0.188 eV
Tauc-LorentzAmp3 = 14.095Br3 = 3.618Eo3 = 3.739 eVEg3 = 0.476 eV
Tauc-LorentzAmp4 = 9.9583Br4 = 1.641Eo4 = 4.172 eVEg4 = 0.554 eV
Tauc-LorentzAmp5 = 15.58Br5 = 0.904Eo5 = 4.594 eVEg4 = 2.077 eV
DrudeRsisitivity = 1000 Ω cmScat. Time = 1000 fs--
Table 3. Fitting parameters of graphene on Si and on SiO2/Si substrates by using a like-Sellmeier Equation (1).
Graphene SamplesA1B1 (×105 nm2)A2B2 (×105 nm2)R2
monolayer on Si21.40 ± 0.05−8.674 ± 0.034--0.99747
bilayer on Si24.486 ± 0.124−12.360 ± 0.095--0.99418
monolayer on SiO213.682 ± 0.025−17.006 ± 0.0783.935 ± 0.0060.466 ± 0.0010.99987
bilayer on SiO225.107 ± 0.074−20.045 ± 0.1623.713 ± 0.025−0.238 ± 0.0080.99992
Table 4. The fitting parameters using Equation (2) for graphene on Si.
Graphene Samplesa0a1a2 (×10−5 K−2)b0 (×106 nm)b1 (103 nm2 K−1)b2 (nm2 K−2)
monolayer on Si26.16 ± 0.58−0.020 ± 0.0021.495 ± 0.368−1.379 ± 0.0852.038 ± 0.430−0.932 ± 0.530
bilayer on Si41.302 ± 1.790−0.074 ± 0.0096.387 ± 1.136−3.068 ± 0.2287.94 ± 1.16−6.256 ± 1.450
Publisher’s Note: MDPI stays neutral with regard to jurisdictional claims in published maps and institutional affiliations.