1. Introduction
The aluminum-lithium (Al-Li) alloys are characterized by density reduction, stiffness increase, increase in fracture toughness, and fatigue crack growth resistance [
1]. The stability at elevated temperatures, a higher modulus of elasticity, and additional weight savings enable Al-Li alloys to substitute 2xxx and 7xxx series of Al alloys in the transportation industry. Compared to copper (Cu) and zinc (Zn), Li additions directly reduce density and increase the modulus of elasticity. Each 1 wt.% of Li added decreases density by 3% and increases the modulus of elasticity by 6% and stiffness by 5% for additions up to 4.2 wt.% Li [
2]. The primary strengthening precipitate in Al-Li alloys is the metastable Al
3Li (δ′) phase [
3]. Unlike intermetallic precipitates in 2XXX and 7XXX series of Al alloys, the δ′ phase stays spherical and coherent with the α
Al matrix at high temperatures retaining the stability of microstructure and mechanical properties [
4,
5,
6,
7]. The preferred precipitation of the δ′ phase in Al-Li alloys can be achieved with Mg additions. By reducing the solid solubility of Li in α
Al solid solution and partially substituting Li in the δ′ phase lattice, Mg additions increase the volume fraction of the δ′ phase [
8]. Based on chemical composition, thermodynamic parameters, and processing parameters, the microstructure development [
9] of Al-Li-Mg alloys also comprehends the solidification of coherent precipitates that alter the planar slip band formation, precipitation of course and angular equilibrium phases as well as the formation and widening of Precipitate-free zone (PFZ) [
10,
11]. The microstructure development during solidification or processing directly influences mechanical properties [
12] and corrosion behavior of Al-Li-Mg alloys. The microstructure degradation in corrosive environments will affect the applicability of Al-Li-Mg alloys in the transportation industry [
13].
Despite the high reactivity of Li, Al-Li-Mg alloys exhibit good resistance to uniform microstructure degradation originating from surface passive film formation [
14]. However, they are strongly susceptible to cavity formation, intergranular degradation, and exfoliation depending on the composition of the environment and microstructure development [
15]. The cavity formation occurs when the Al-Li-Mg alloys are exposed to environments outside 3 pH–10 pH [
16], and it can act as a precursor to the other microstructure degradation processes [
17].
The intergranular degradation selectively attacks the grain boundaries and adjacent matrix without affecting the grains. The progress of microstructure degradation in Al-Li-Mg alloys is described by the Anodic dissolution theory and PFZ breakdown model [
18].
Anodic dissolution of the grain-boundary precipitates results in continuous anodic path formation along the grain boundaries leading to the dissolution of the α
Al matrix and intergranular degradation [
19]. In Al-Li-Mg alloys, the metastable Al
3Li (δ′) [
20], stable AlLi (δ), ternary Al
2LiMg (T), and secondary eutectic Al
8Mg
5 (β) phases are anodic with respect to the α
Al matrix contributing to the microstructure degradation in corrosive environments [
21]. The metastable δ′ is the most important hardening precipitate that solidifies homogeneously distributed in the α
Al matrix. The similarities in the structure and lattice parameters between the α
Al matrix and the δ′ phase manifest with low-coherency strain and low-interfacial energy leading to the order hardening [
22]. The detrimental effect of the δ′ phase on intergranular degradation is caused by interaction with dislocations leading to the microstructure texture development. The stable δ phase precipitates inside the grains of the α
Al matrix on the previously precipitated δ′ phase. The coarsening of the δ phase that occurs during the aging process increases the degradation rate [
17]. The solidification of the T phase has less effect on the microstructure degradation of the alloy due to its nucleation at the high-angle grain boundaries and the grain boundary triple points [
23,
24]. The initial nucleation at the grain boundaries limits the negative impact of the β phase on the Al-Li-Mg alloy microstructure degradation [
25].
The PFZ breakdown model correlates the effect of chloride (Cl
−) or halide ions on the PFZ with cavity formation and exfoliation in heat-treated Al alloys. Since the electrochemical potential of the PFZ is lower compared to the potential of enriched α
Al matrix and grain-boundary precipitates, a localized attack will result in microstructure degradation [
24]. The formation of PZF in Al-Li-Mg alloys depends on the Li/Mg ratio. When the Li/Mg ratio is high, the peritectic reaction between liquid (L) and δ′ leads to the precipitation of the stable δ phase. The stable δ phase precipitates inside the grains of the α
Al matrix. The formation of PFZ in the alloys containing 2 wt.% > Mg and a lower Li/Mg ratio comprehends precipitation of the T phase at the expense of the previously precipitated δ′ and the bulked α
Al matrix [
26,
27].
The exfoliation is characterized by lamellar surface attack of the alloy containing a highly directional grain structure. It is an intergranular degradation based on the galvanic interaction between grain-boundary precipitates and the adjacent matrix. During the exfoliation process, the Al from the α
Al matrix and precipitates is transformed into the non-soluble highly voluminous hydrated aluminum oxide (Al(OH)
3), which causes wedging and enables further attack. The wedging effect of the degradation products can lead to cavity progression, flaking, powdering, blistering or SCC. The texture originates from the interaction between dislocations and the δ′ phase. Additionally, high oxidation and hydrogen release during the dissolution of the β phase are the main causes of Al-Li-Mg alloys’ exfoliation appearance [
28].
The goal of the research is to determine the microstructure degradation of Al-2.18Mg-1.92Li alloys in as-cast and solution-hardened conditions during electrochemical testing. The solution hardening was performed to dissolve all precipitated phases and enrich the αAl matrix. By dissolving the anodic phases, higher resistance to microstructure degradation is expected. The application of electrochemical measurements, mainly Time dependence of open-circuit potential and Tafel polarization curves, enabled the assessment of sample stability, corrosion potential, and corrosion rate. The progress of the accelerated degradation process and its impact on the macrostructure and microstructure will be estimated visually using light microscopy. The applied method is used to simulate the material degradation in various types of outdoor services, especially in marine and automotive applications.
2. Materials and Methods
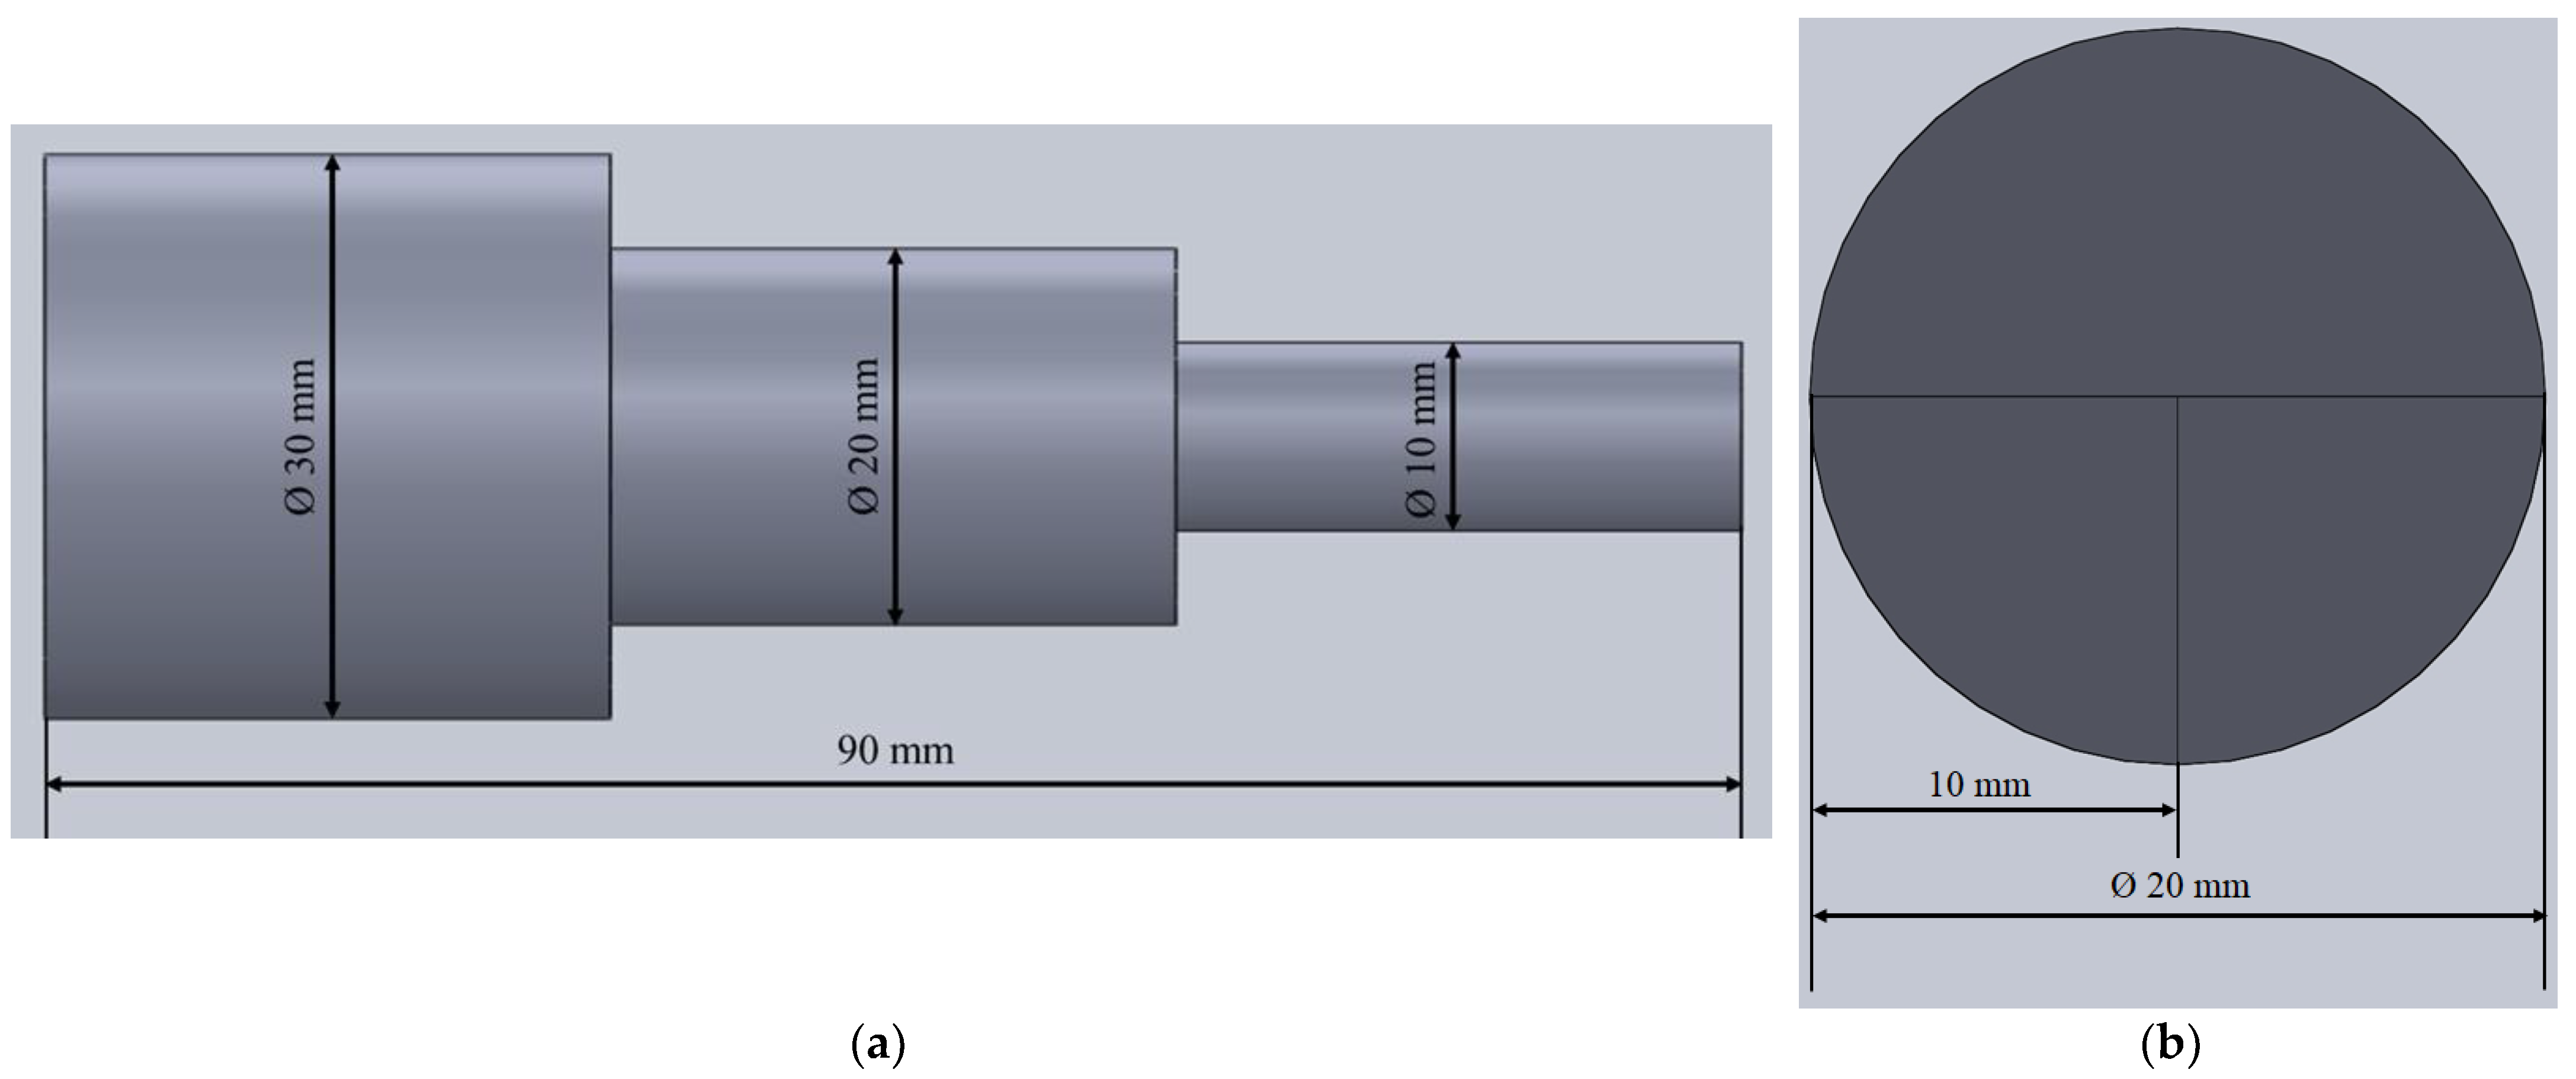
To synthesize the alloy, an Al block of technical purity (99.0%) was placed into a graphite crucible coated with boron nitride (BN) and deposited into an induction melting furnace. The alloy synthesis was performed in the new (never used) graphite crucible containing a sufficient amount of carbon necessary to achieve and retain the melting temperature of the raw materials. The graphite crucible was coated to prevent impurity pickup from refractory materials. The controlled atmosphere was obtained through the argon (Ar) introduction. Maintaining a controlled atmosphere during melting and full shielding of the melt was ensured by the crucible cover. To avoid the pickup of impurities originating from raw materials, the alloying was performed using an Mg rod of 99.98% purity and a Li rod of 99.8% purity. The Mg and Li were wrapped into an Al foil (commercial purity) and placed into a steel bell coated with BN. The alloying was performed at 720 °C by introducing a previously prepared steel bell into molten Al. The homogeneous distribution of alloying elements was ensured through reheating to 740 °C and stirring the melt using the steel bell coated with boron nitrite. Casting was performed into a permanent steel mold at 740 °C without a protective atmosphere of Ar. The geometry of the sample with indicated sampling for corrosion testing is given in
Figure 1.
The sample is 90 mm in length comprising of three cylinders with different diameters. The largest cylinder is 30 mm in diameter, while the smallest cylinder has a diameter of 10 mm (
Figure 1a).
The produced alloy’s chemical composition was determined using inductively coupled plasma with mass spectroscopy (ICP-MS) on the Agilent Technologies Inductively coupled plasma-mass spectrometer. Before initiating measurements, the spectrometer was calibrated using standardized calibrating solutions. Due to the high reactivity of Li, the ICP-MS was additionally calibrated using solutions containing 1, 10, 50, 100 mg/m3 of Li.
Based on the chemical composition results, the Thermo–Calc software support was used to calculate the equilibrium and non-equilibrium solidification sequence and reactions in liquid and solid states. The solidification sequence was calculated using the TCAL6 v6.0 technical sheet for Al. The prediction of non-equilibrium solidification was based on the classic Scheil–Gulliver model.
The obtained solidification sequence and corresponding temperatures were used to select the solution-hardening temperature. The sample was solution hardened at 520 °C for 4 h and quenched in water.
The electrochemical measurements were performed using a standard three-electrode cell with a saturated calomel reference electrode (SEC), a platinum counter electrode, and a 1 cm
3 exposed surface of a working electrode sample. The solution for the electrochemical testing was obtained by dissolving 234 g of sodium chloride (NaCl) and 50 g of potassium nitrate (KNO
3) in water. Afterwards, 6.3 mL of HNO
3 was added and the solution was diluted to 1 L by adding distilled water. The obtained solution had a pH of 0.4. To avoid the influence of degradation products on the bulk-solution chemistry, approximately 250 mL of solution was used for each test. The samples for corrosion testing were taken from the middle cylinder of the cast sample with a diameter of Ø 20 mm and a length of 30 mm. The middle cylinder was cut into quarters (
Figure 1b). One quarter was used to estimate microstructure degradation in as-cast condition, while the other quarter was solution hardened first and then subjected to corrosion testing. The electrochemical measurements were performed using potentiostat/galvanostat Parstat 2273 at room temperature (19 ± 2 °C) with a 0.5 mV/s scan rate. Before initiating the corrosion measurements, the Open circuit potential (E
opc) was stabilized for 600 s. The Tafel extrapolation method was performed using potentiodynamic polarization in the potential range from −250 mV to +250 mV vs E
corr with a scan rate of 0.5 mV/s. The corrosion potential (E
corr), corrosion current density (i
c), anode slope (B
a), cathode slope (B
c), and corrosion rate (v
corr) were extrapolated from Tafel’s polarization curves using PowerCorrTM software support.
The metallographic analysis was performed on the samples in as-cast and solution-hardened conditions before and after electrochemical testing. The samples were prepared using standard grinding and polishing techniques. The samples for macrostructural analysis were etched using Poulton’s etching solution (60 mL of hydrochloric acid (HCl), 30 mL of nitric acid (HNO3), 5 mL of hydrofluoric acid (HF), and 5 mL water (H2O)) and observed on the stereo microscope Olympus SZ11. The samples for microstructural analysis were etched using Weck’s (4 g KMnO4, 1 g NaOH, and 100 mL H2O) and Keller’s (1 volume part of HF, 1.5 volume part of HCl, 2.5 volume parts of HNO3, and 95 volume parts of water). The microstructure was analyzed on an Olympus GX51 inverted metallographic microscope equipped with Olympus Stream Motion 2.4.3. software support. The metallographic analysis of the tested samples was performed on the exposed surface and cross-section perpendicular to the exposed surface. The cross-section of the samples was analyzed in polished and etched conditions after standard metallographic preparation. The scanning electron microscope (SEM) Tescan Vega TS 5136 MM equipped with an energy-dispersive spectrometer was used to quantify the amounts of Al and Mg in as-cast and solution-hardened samples. Since EDS cannot determine light elements, such as Li, the X-Ray Diffraction (XRD) was used to identify Li-containing intermetallic phases in the as-cast sample. The XRD was performed on a PANalytical X’Pert PRO diffractometer with non-monochromated X-rays produced by an Empyrean Cu anode tube operating at 45 kV and 40 mA. The calibration was not performed because the standards are used for powder samples.
3. Results
The results of the chemical analysis are given in
Table 1.
The produced alloy contains 2.18 wt.% of Mg and 1.92 wt.% of Li (
Table 1). The Mg content of 2.18 wt.% and lower Li/Mg ratio (Li/Mg = 0.88) indicates preferred solidification of T phase.
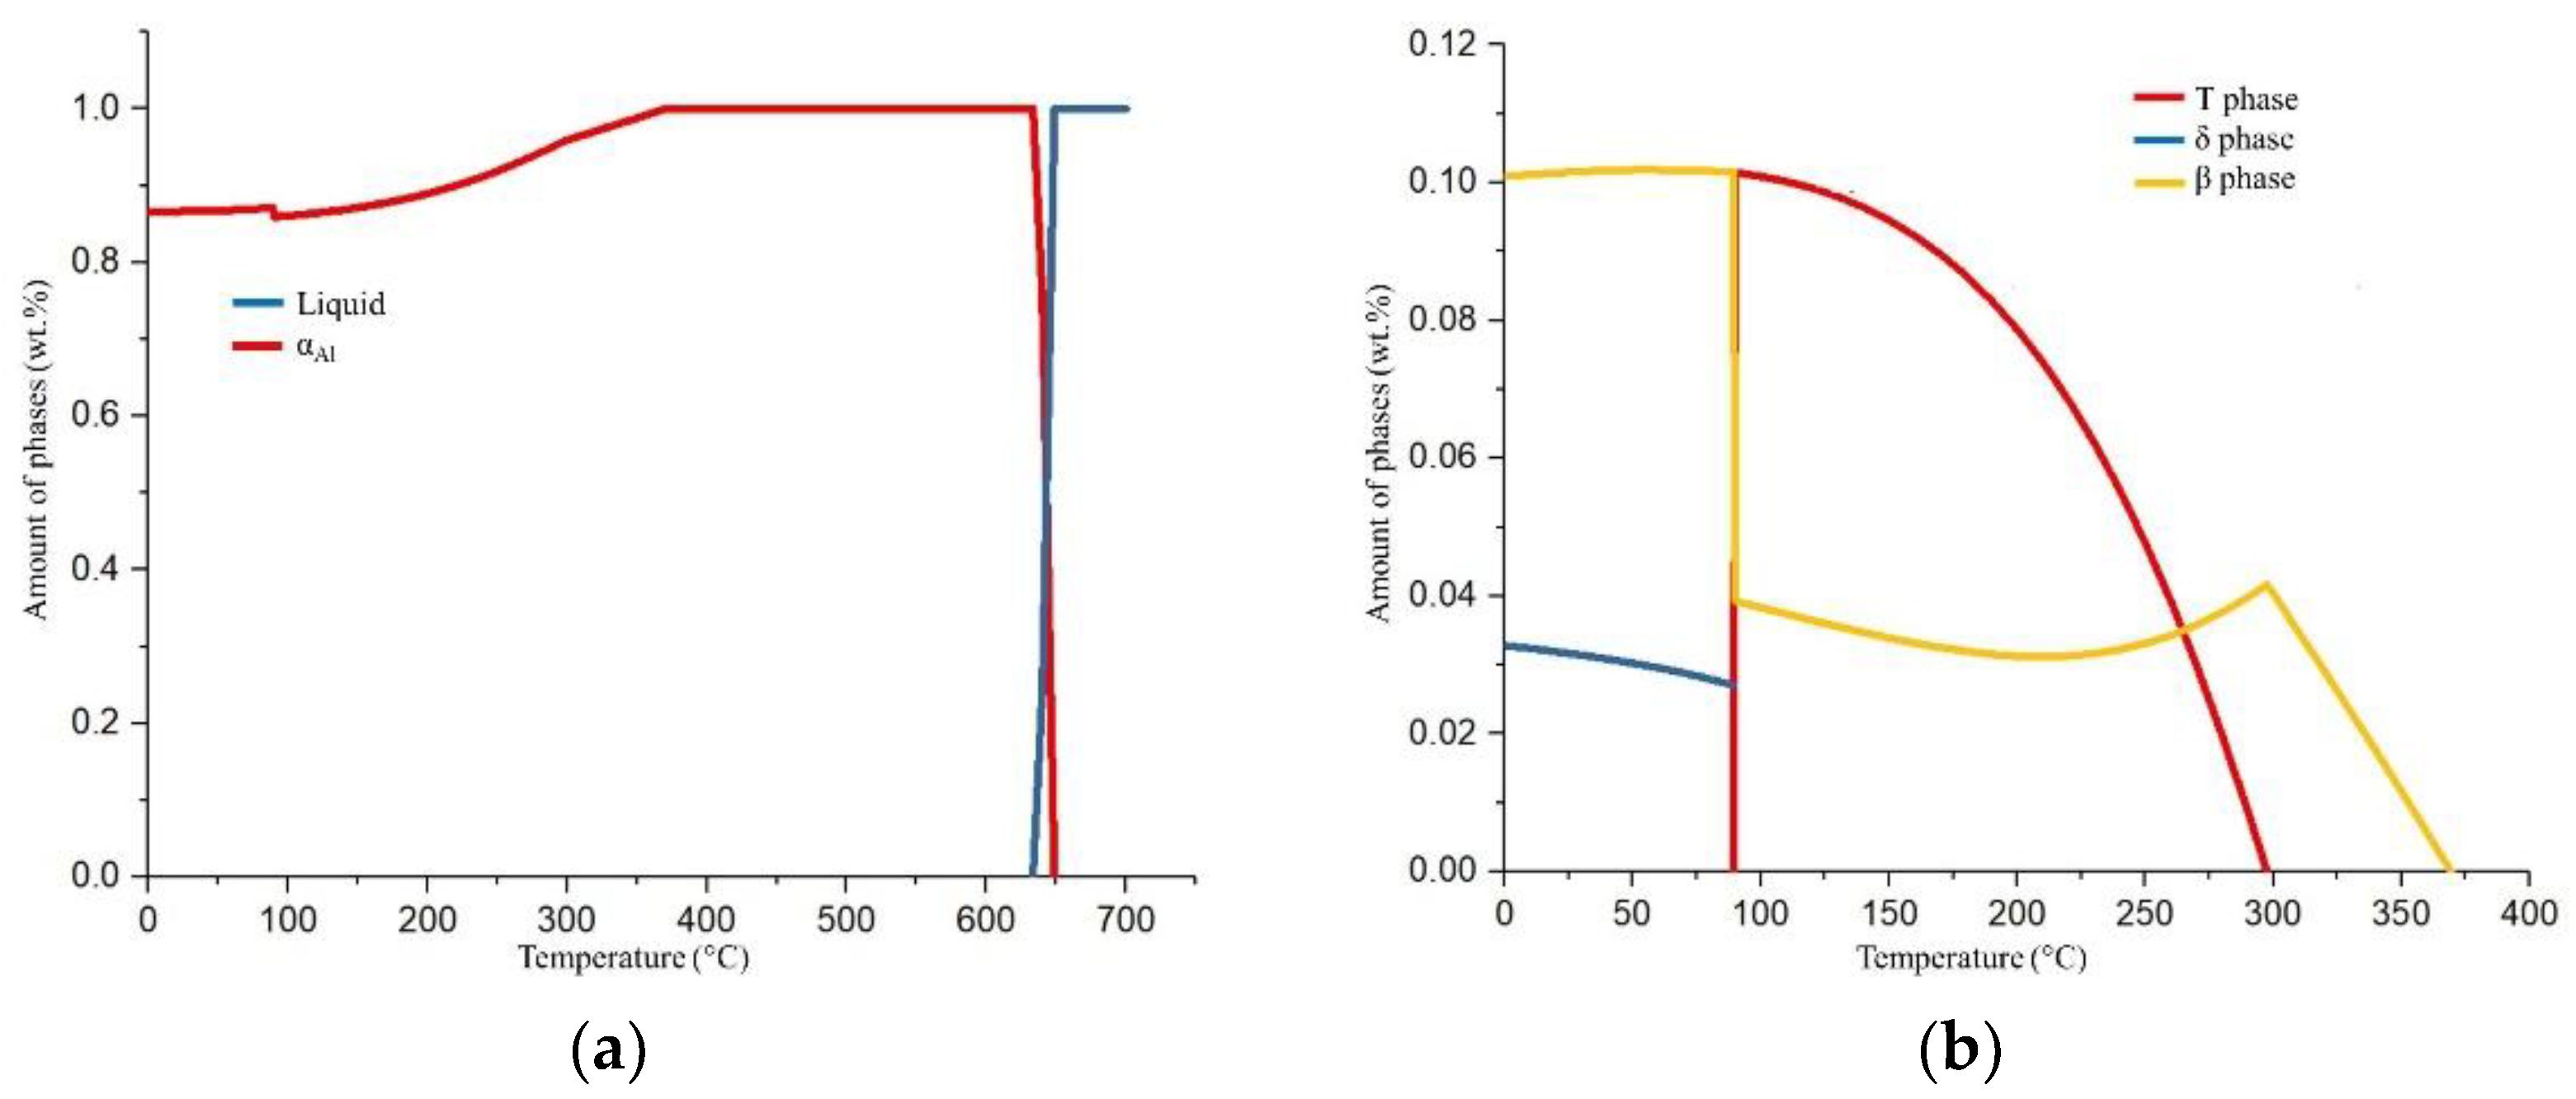
The solidification sequence of Al-2.18Mg-1.92Li alloy under equilibrium conditions is shown in
Figure 2a,b, while the following invariant reactions and corresponding temperatures are given in
Table 2.
The equilibrium solidification sequence begins with the transformation of the α
Al dendritic network at 640 °C (
Figure 2a) containing 96.59 wt.% Al, 1.66 wt.% Mg, and 1.75 wt.% Li (
Table 2). The rest of the equilibrium solidification sequence is based on the solid-state diffusion processes in the α
Al dendritic network (
Figure 2b). The stable δ phase precipitates at 360 °C containing 78.44 wt.% Al, 4.77 wt.% Mg, and 16.79 wt.% Li (
Table 2). The amount of precipitated δ phase grows until 290 °C when the T phase begins to precipitate (
Figure 2b) containing 71.53 wt.% Al, 17.02 wt.% Mg, and 11.46 wt.% Li (
Table 2). The solidification sequence ends with the precipitation of the β phase containing 49.95 wt.% Al, 44.73 wt.% Mg, and 5.31 wt.% Li at 89.15 °C (
Table 2). The precipitation of the β phase suppresses the T phase’s precipitation and increases the precipitation of the δ phase (
Figure 2b) and the α
Al dendritic network (
Figure 2a).
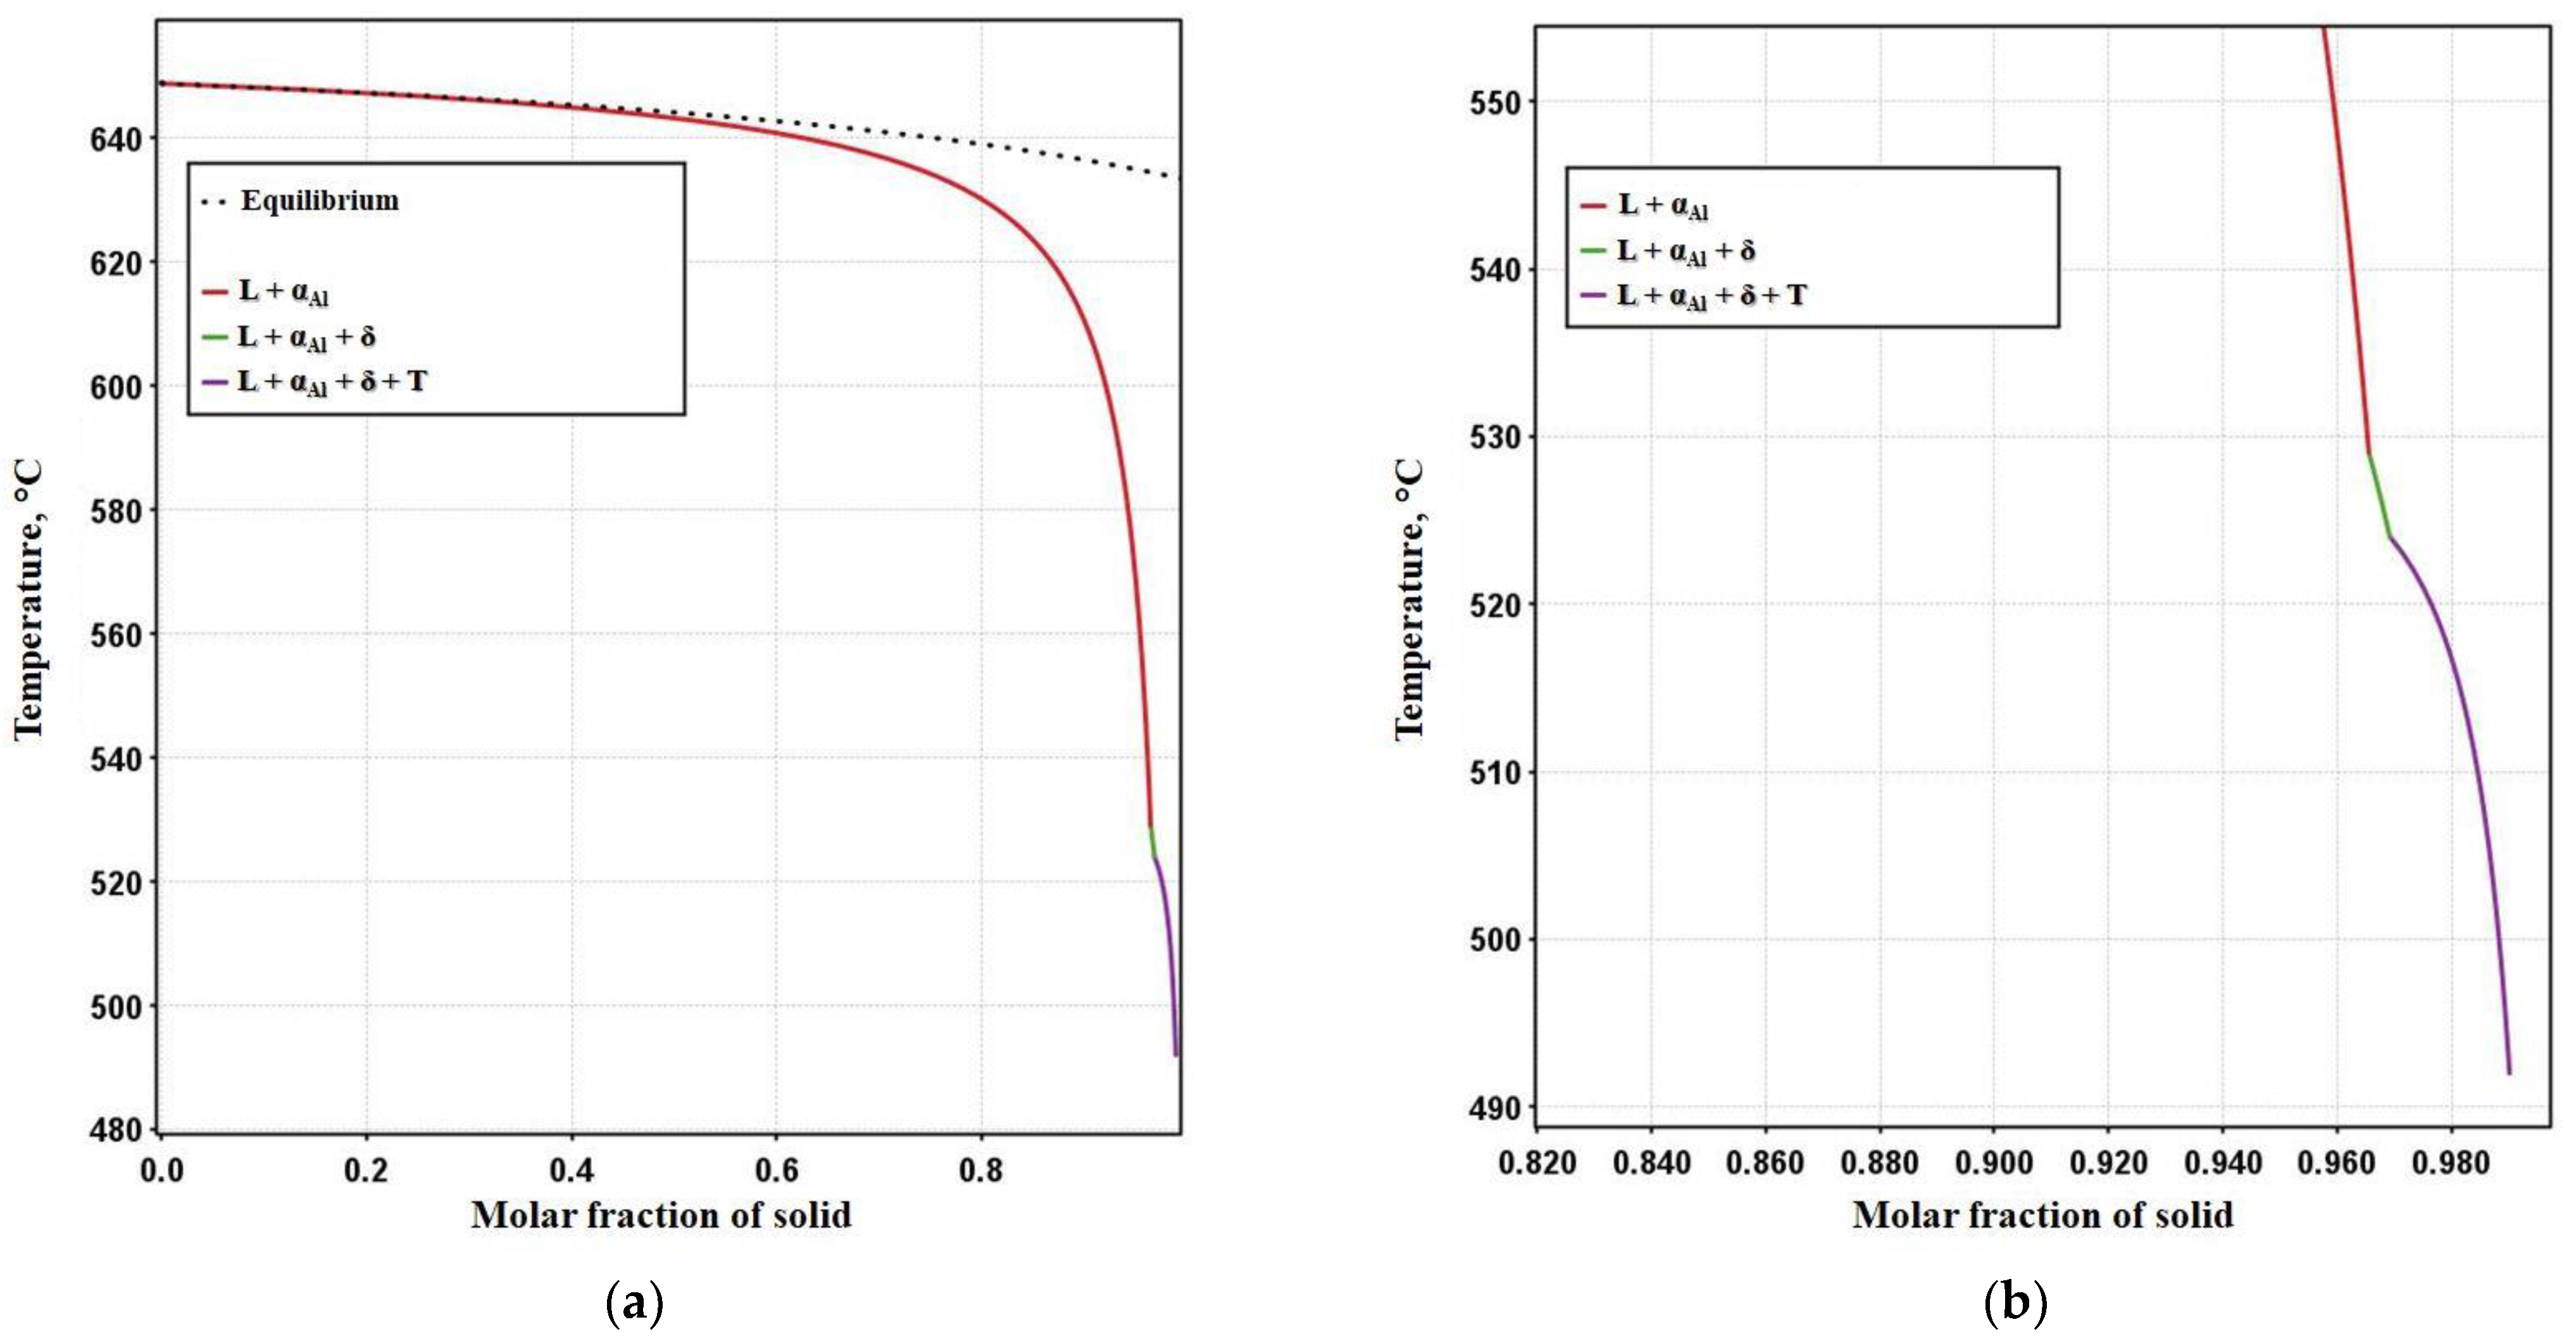
The non-equilibrium solidification sequence of Al-2.18Mg-1.92Li alloy is shown in
Figure 3, while the following invariant reactions and corresponding temperatures are given in
Table 3.
The non-equilibrium solidification exclusively comprehends transformations and solidification in L state. The solidification sequence begins with the transformation of the α
Al dendritic network at 649 °C (
Figure 3 and
Table 3) followed by the solidification of the δ phase at 529 °C and T phase at 524 °C (
Figure 3 and
Table 3). The solidification of the secondary eutectic β phase is not recognized by this model. The alloy exhibits a wide solidification range indicating a greater temperature gradient and degree of undercooling (
Figure 3, Equilibrium solidification line). The solidification with a higher degree of undercooling enables microstructure refinement, improvement in alloy properties, and microstructure degradation resistance.
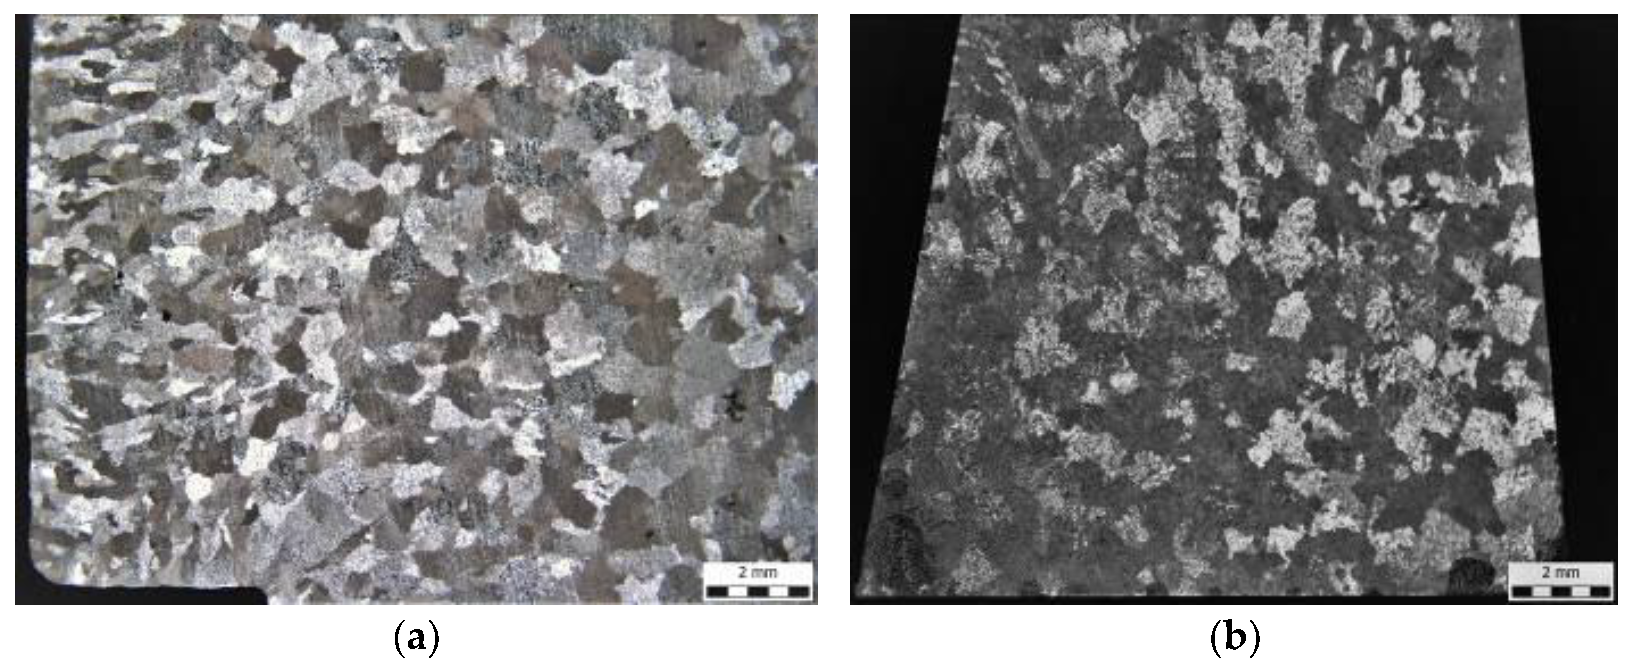
The macrostructure of the sample in as-cast and solution-hardened conditions is given in
Figure 4.
The macrostructure of the sample in as-cast condition has a heterogeneous grain morphology consisting of chill, columnar, and equiaxed zones. The narrow chill zone formed at the surface of the sample is followed by the zone of columnar grains. The zone of equiaxed grains is in the center of the sample (
Figure 4a). The solution hardening led to homogenization in the grain morphology (
Figure 4b).
The results of XRD analysis are given in
Figure 5.
The XRD of the sample in the as-cast condition identified the presence of the α
Al matrix and the T and δ phases (
Figure 5).
The microstructure of the sample in the as-cast condition is given in
Figure 6a,b.
Figure 6c represents the Scanning Electron Image (SEI) with the indicated details for EDS analysis. The results of the EDS analysis are given in
Table 4.
The microstructure of the sample in the as-cast condition consists of the α
Al dendritic network (
Figure 6a) and precipitates located between the branches of α
Al dendrites (
Figure 6a). The precipitates located between differently oriented α
Al dendrites have coarse morphology corresponding to the secondary eutectic β phase (
Figure 6b). The precipitates located between the secondary branches of α
Al dendrites have finer morphology and can be identified as T phase (
Figure 6b). The α
Al dendrites consist of 98.08 wt.% Al and 1.92 wt.% Mg (
Figure 6,
Table 4, detail 1). The reduced solid solubility of Mg in α
Al matrix with respect to temperature resulted in Mg segregation to interdendritic areas (
Figure 6,
Table 4, detail 2). Consequently, the Mg content in interdendritic areas increased to 3.37 wt.% Mg. The highest Mg content of 4.49 wt.% is connected to the secondary eutectic β phase (
Figure 6,
Table 4, detail 3).
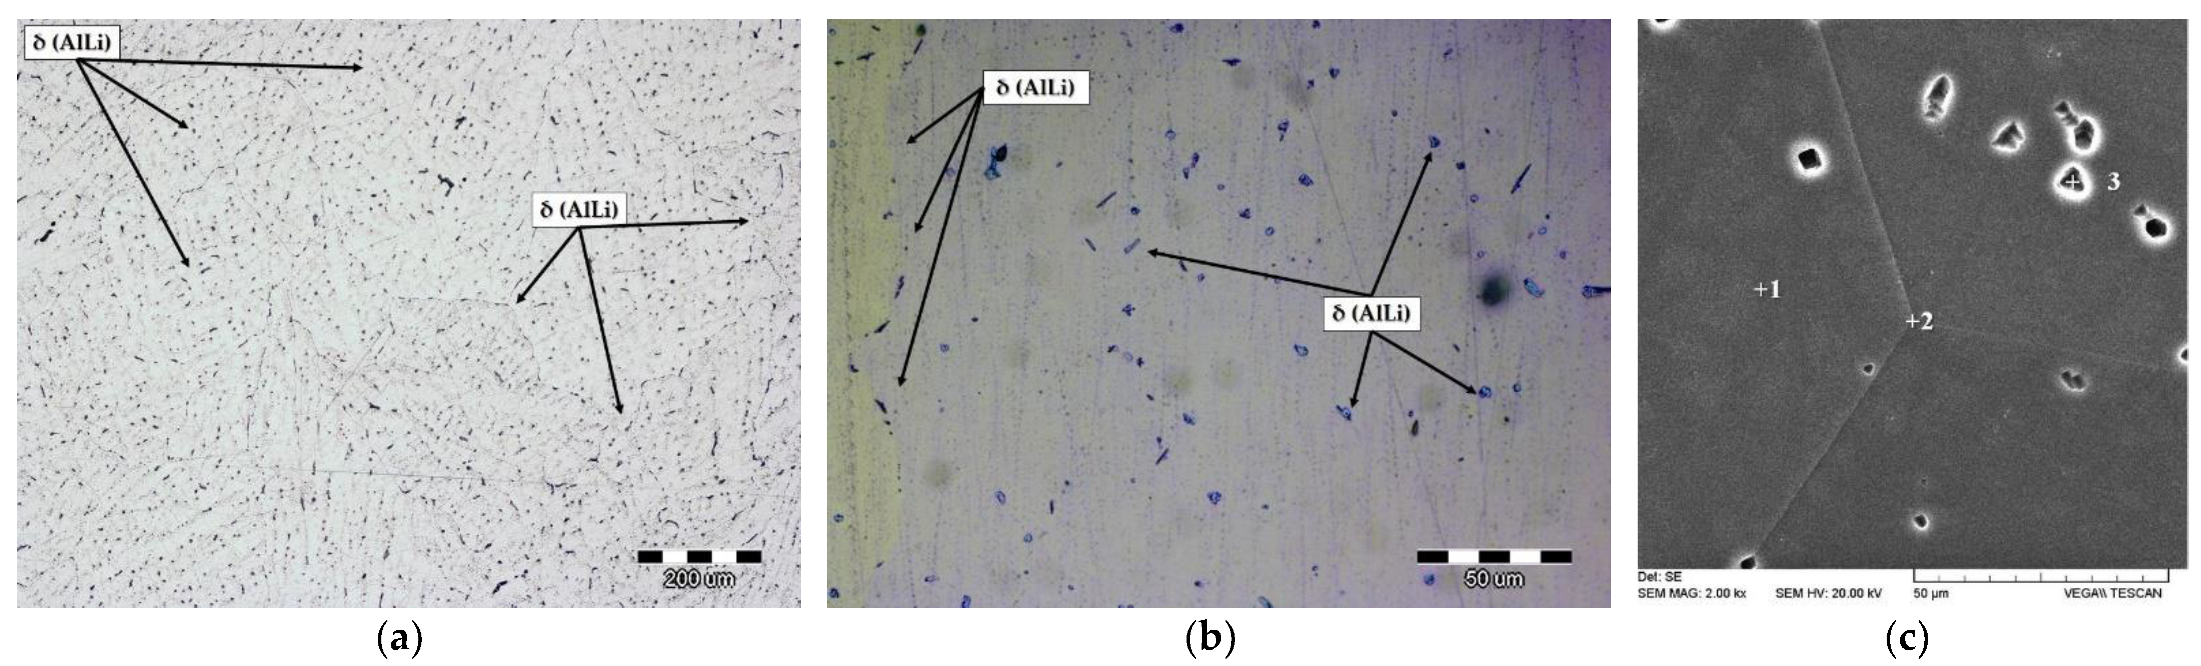
The microstructure of the solution-hardened sample is given in
Figure 7a,b.
Figure 7c represents the SEI with the indicated details for EDS analysis given in
Table 5.
The microstructural analysis of the solution-hardened sample reveals the α
Al grains (
Figure 7) and residual phase precipitated inside the grains of α
Al (
Figure 7) corresponding to the δ phase (
Figure 7). The T phase and β phase were not detected in the solution-hardened sample. The δ phase is homogeneously distributed inside the grains of the α
Al matrix with no PFZ near the grain boundaries (
Figure 7a,b). The solution hardening resulted in equal distribution of Mg inside the grains (3.29 wt.% Mg) and on the grain boundaries (3.44 wt.% Mg) (
Table 5, details 1 and 2). The lowest amount of Mg (2.79 wt.% Mg) was measured in the δ phase (
Table 5, detail 3).
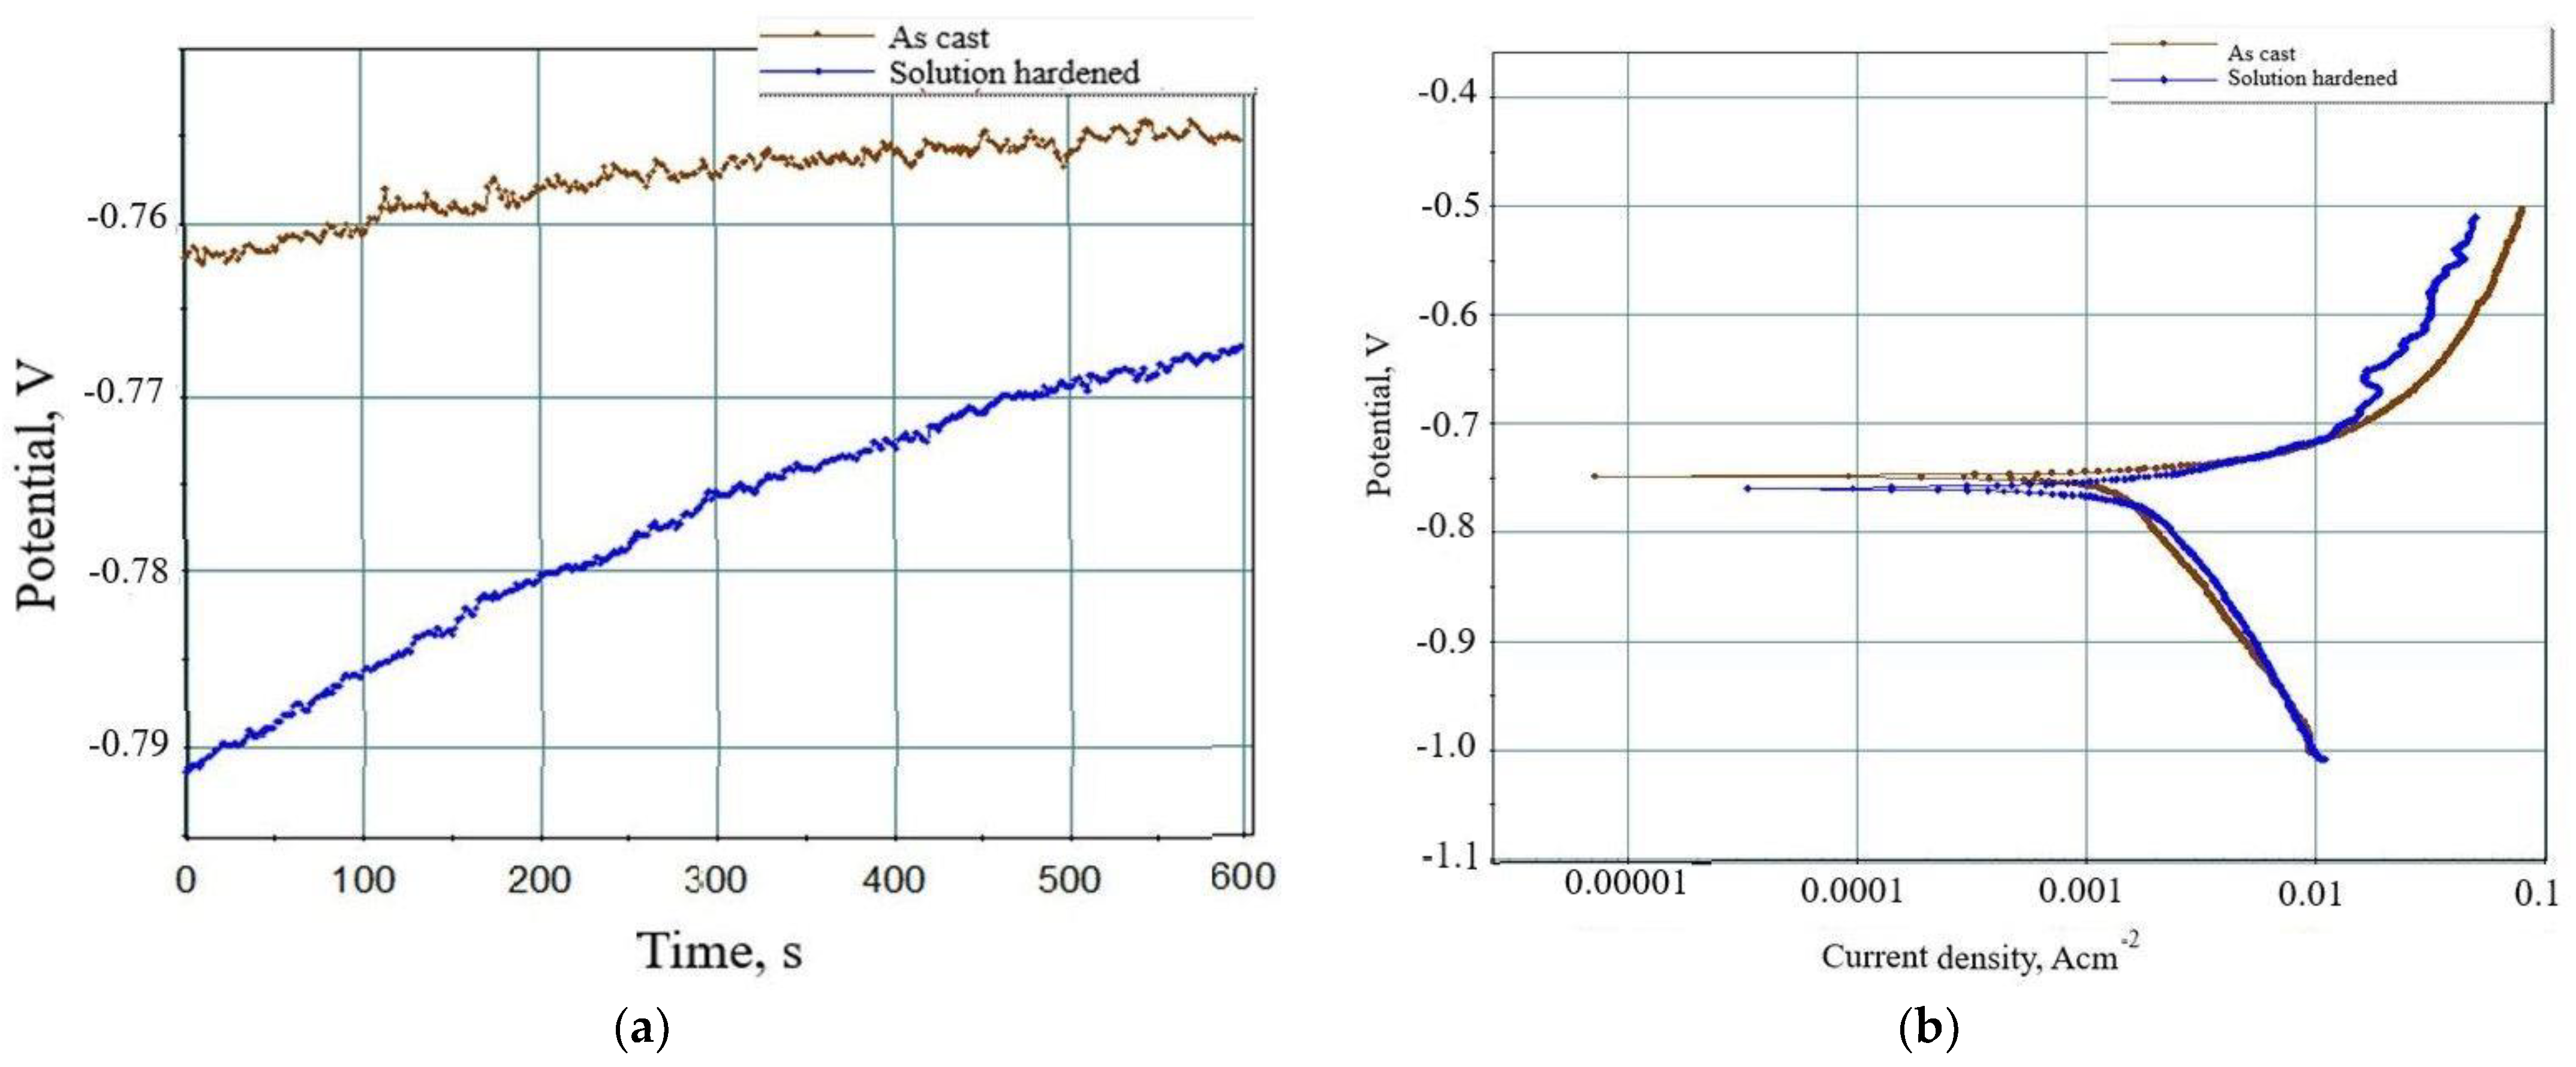
The results of electrochemical testing are given in
Figure 8.
The results of the electrochemical testing are given in are given in
Table 6.
The negative corrosion potential (E
corr) recorded during Time dependence of open circuit potential measurements indicates instability of samples and their dissolution during testing (
Figure 8a and
Table 6). The sample in as-cast condition shows less negative potential (−755 mV) compared to the solution-hardened sample (−767 mV), indicating higher resistance to microstructure degradation (
Table 6). However, an increase in the corrosion potential of the solution-hardened sample during the Time dependence of open circuit potential measurements points to spontaneous passivation (
Figure 8a). The Tafel polarization curves ratify the higher stability of the sample in as-cast condition compared to the solution-hardened sample (
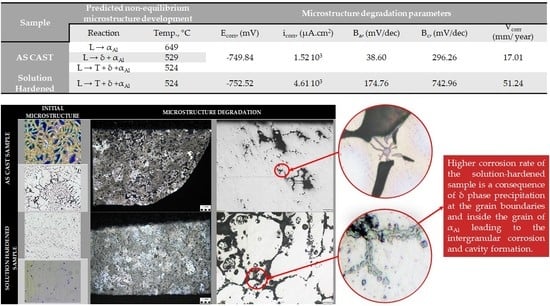
Figure 8b). The extrapolation of obtained Tafel polarization curves indicates more negative corrosion potential (−752.52 mV), higher current density (4.61·103 µA.cm2), anode slope (174.76 mV/dec), cathode slope (742.96 mV/dec), and corrosion rate (51.24 mm/year) for the solution hardened sample. The higher current density and anode slope are consequences of the dealloying and dissolution of Al (
Table 6). The higher cathode slope is attributed to the solution reduction and local increase in pH value. The local increase in the pH value of the testing solution led to the spontaneous passivation of the solution-hardened sample and an increase in corrosion potential (
Figure 8a and
Table 6).
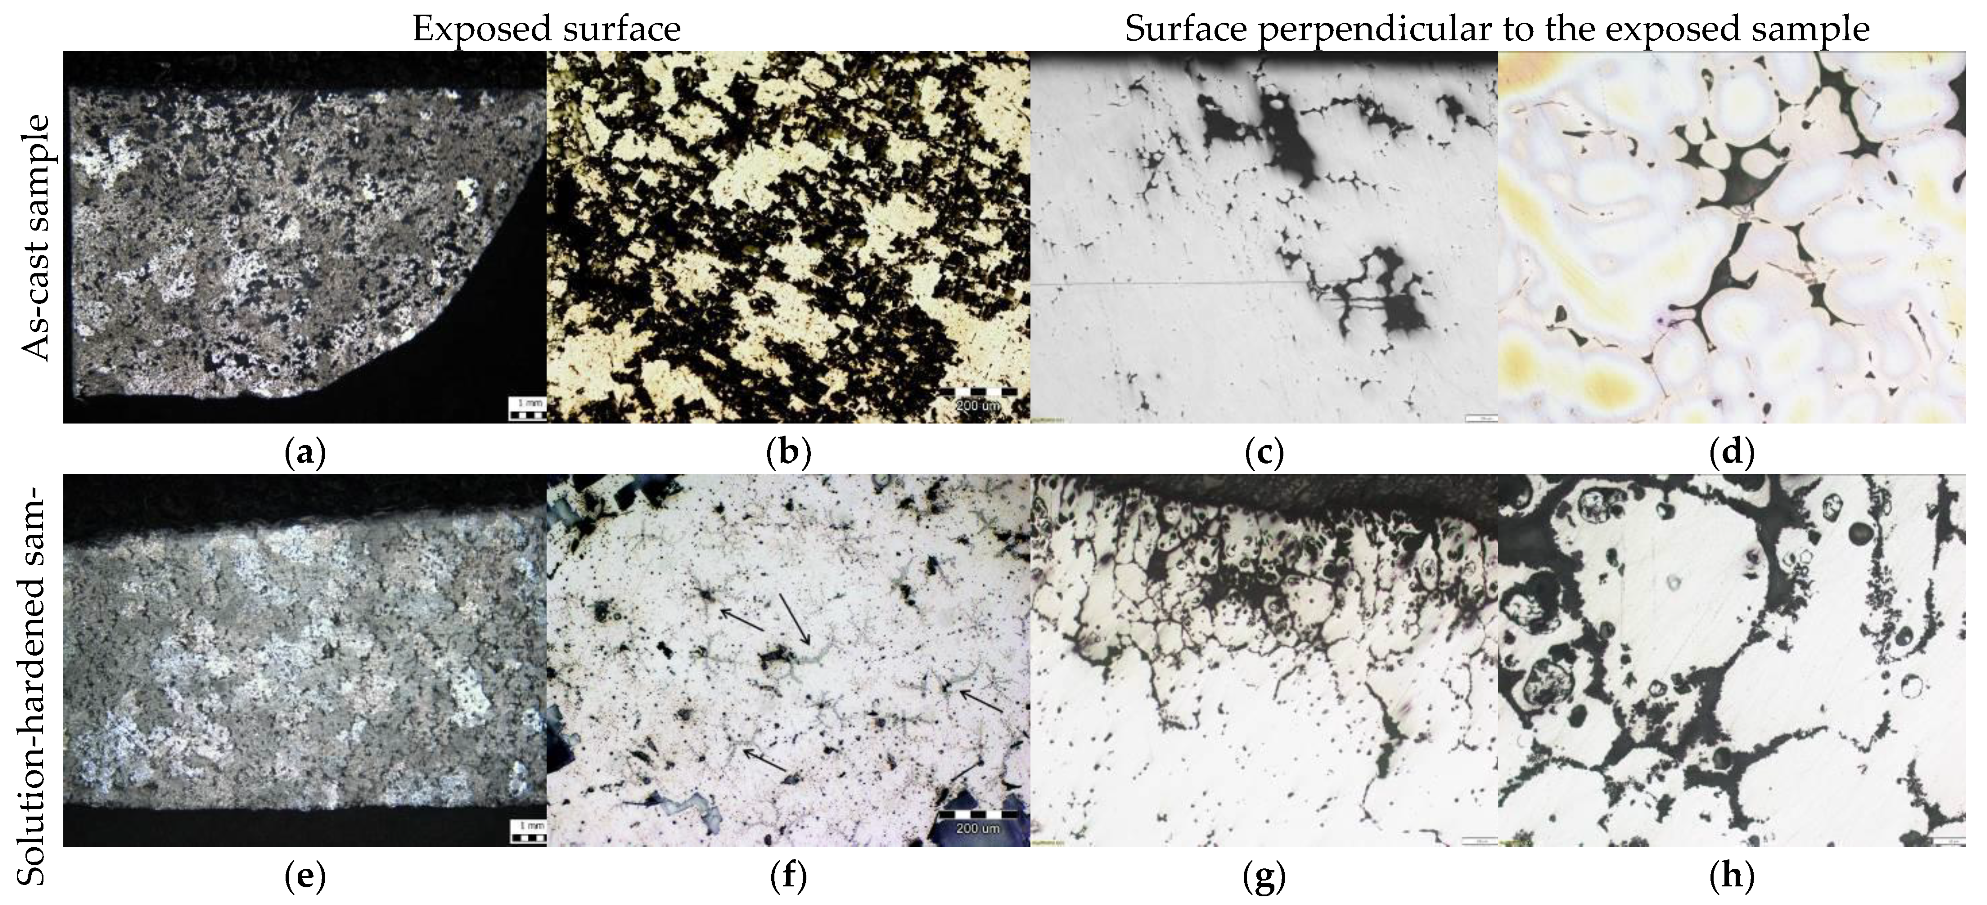
The macrostructure and microstructure of the samples after electrochemical testing are given in
Figure 9.
The macrostructure of the sample in as-cast condition after electrochemical testing indicates cavity formation (
Figure 9a). The cavities are equally distributed across the exposed surface of the sample (
Figure 9b). On the other hand, the pitting corrosion of the solution-hardened sample initiates and propagates at the grain boundaries (
Figure 9e) surrounded by the precipitates (
Figure 9f).
The microstructural analysis indicates cavity formation at the surface of both samples (
Figure 9c,g). In the as-cast sample, the degradation progresses by the dissolution of the β and T precipitates located between the branches of the α
Al dendritic network (
Figure 9c,d). In the solution-hardened sample, degradation is manifested as intergranular and transgranular involving the grain boundaries and α
Al grains. The existence of the δ phase precipitates inside the α
Al grains resulted in the cavity formation (
Figure 9g,h).
4. Discussion
The use of an induction melting furnace and a protective atmosphere of Ar enabled the synthesis of Al-2.18Mg-1.92Li. The alloy was cast into a permanent steel mold without a protective atmosphere.
The Mg content of 2.18 wt.% and lower Li/Mg ratio (Li/Mg = 0.88) implied preferred solidification of the T phase. However, the use of Thermo–Calc software support indicated more complex microstructure development during solidification. The equilibrium solidification calculations indicated the transformation of the αAl dendritic network followed by solid-state precipitation of the δ, T and β phases. The δ phase precipitated from the αAl matrix containing 16.79 wt.% Li at 360 °C. The reduction of Li content in the αAl matrix to 11.46 wt.% and an increase in Mg content to 17.02 wt.% caused precipitation of the T phase at 290 °C. The equilibrium solidification ended at 89.15 °C with precipitation of the β phase from the Mg enriched αAl matrix containing 44.73 wt.% Mg. The non-equilibrium solidification sequence comprehended the transformation of the αAl dendritic network followed by the solidification of δ and T phases at higher temperatures with respect to the equilibrium solidification sequence.
The results of the Thermo–Calc calculations indicated precipitation of the phases that are anodic with respect to the αAl matrix and located in the interdendritic regions. Based on the nature of the precipitates and their location, the Al-2.18Mg-1.92Li alloy shows a tendency towards intergranular degradation. To increase the Al-2.18Mg-1.92Li alloy microstructure stability in the corrosive environment, solution hardening was used. By dissolving all the precipitated phases and enriching the αAl matrix with Mg and Li, higher microstructure stability was expected. Although solution hardened led to the homogenization in grain morphology, the microstructure analysis indicated the presence of the δ phase located inside the αAl grains.
The applied methods of electrochemical measurements recorded negative corrosion potential indicating the instability of both samples and their dissolution during testing. The Time dependence of open circuit potential measurements for the sample in the as-cast condition revealed less negative corrosion potential and higher resistance to microstructure degradation. The Tafel polarization curves indicated higher corrosion potential, current density, anode slope, cathode slope, and corrosion rate for the solution-hardened sample. The higher current density and anode slope are consequences of the αAl matrix dissolution. The higher cathode slope is attributed to the testing solution reduction and local increase in pH value. The local increase in the pH value of the testing solution led to the spontaneous passivation of the sample.
The macrostructural analysis of the exposed surface of both samples indicates cavity formation. The cavity formation is enabled by surface passive film dissolution due to the high acidity of the testing solution (0.4 pH). In the as-cast sample, the degradation progressed by the dissolution of the β and T phase precipitates located between the branches of the αAl dendritic network. In the solution-hardened sample, degradation is manifested as intergranular involving the grain boundaries and the αAl grains. The cavity formation in the αAl grains is caused by the δ phase precipitates.


