
Thermal Properties, Isothermal Decomposition by Direct Analysis in Real-Time-of-Flight Mass Spectrometry and Non Isothermal Crystallization Kinetics of Poly(Ethylene-co-Vinyl Alcohol)/Poly(ε-Caprolactone) Blend

 ,
,  ,
,  ,
,
Abstract
1. Introduction
2. Materials and Methods
2.1. Materials
2.2. Blend Preparation
2.3. Characterization
3. Results
3.1. Miscibility
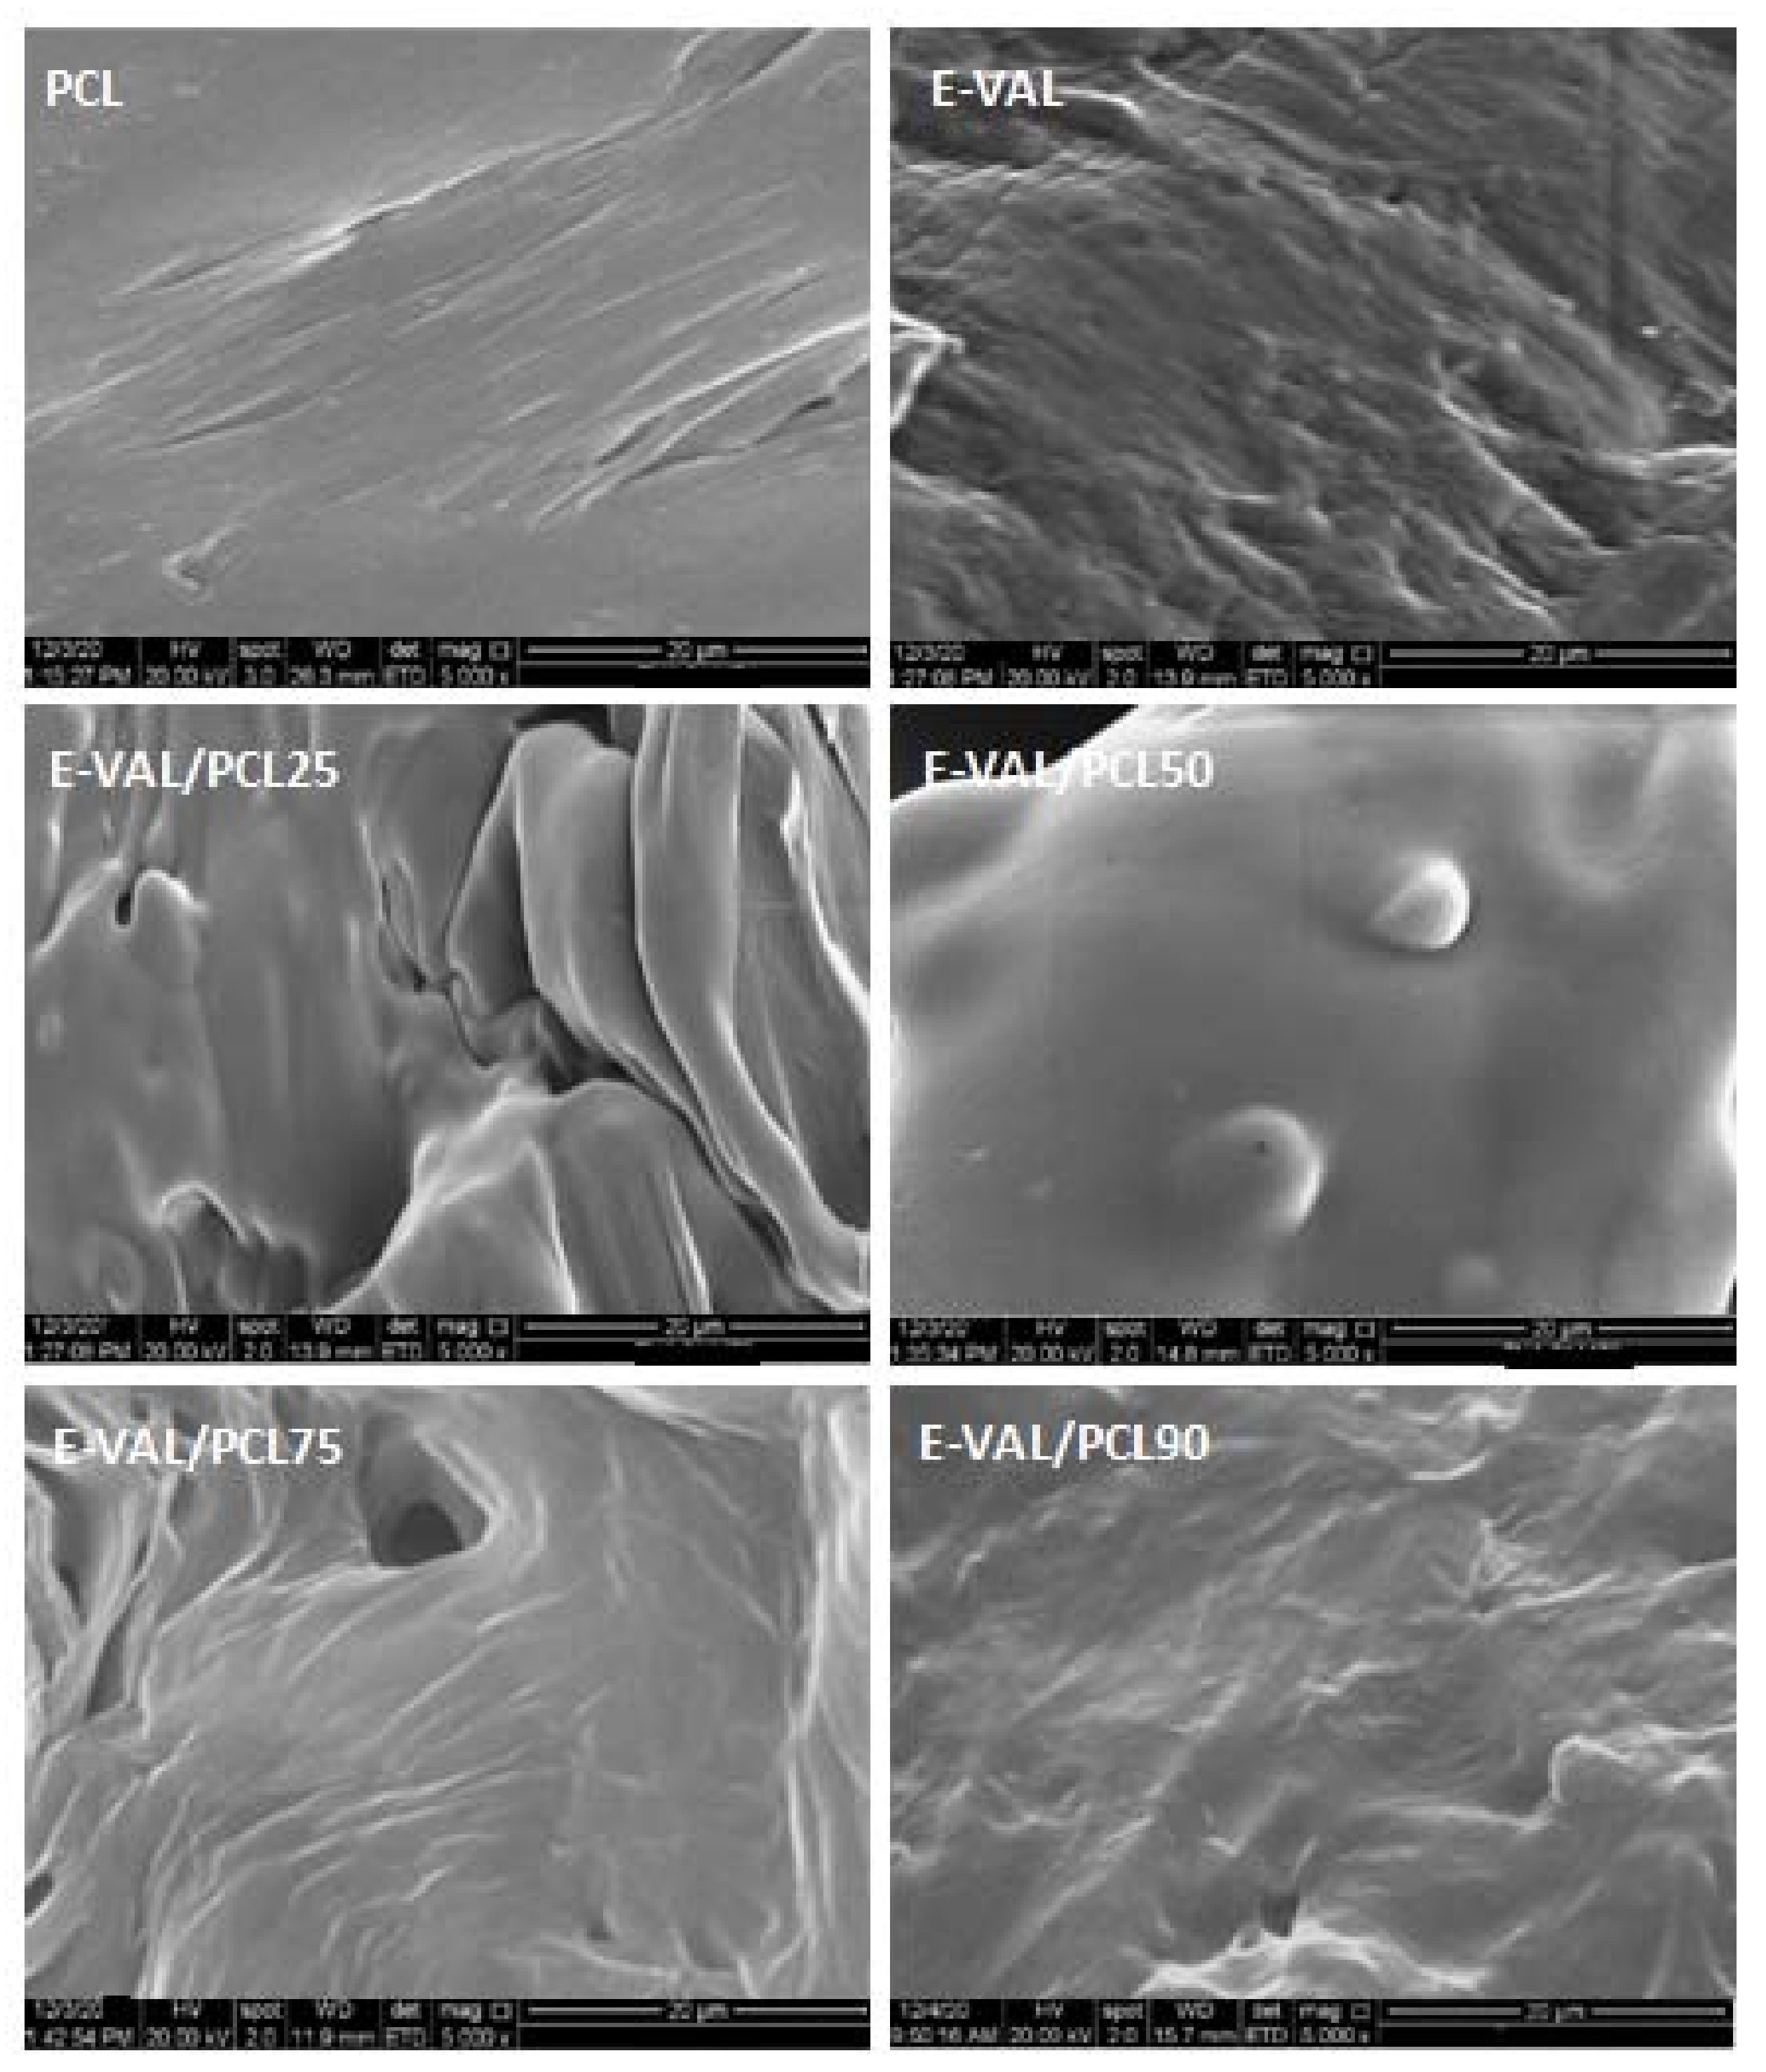
3.2. SEM Analysis
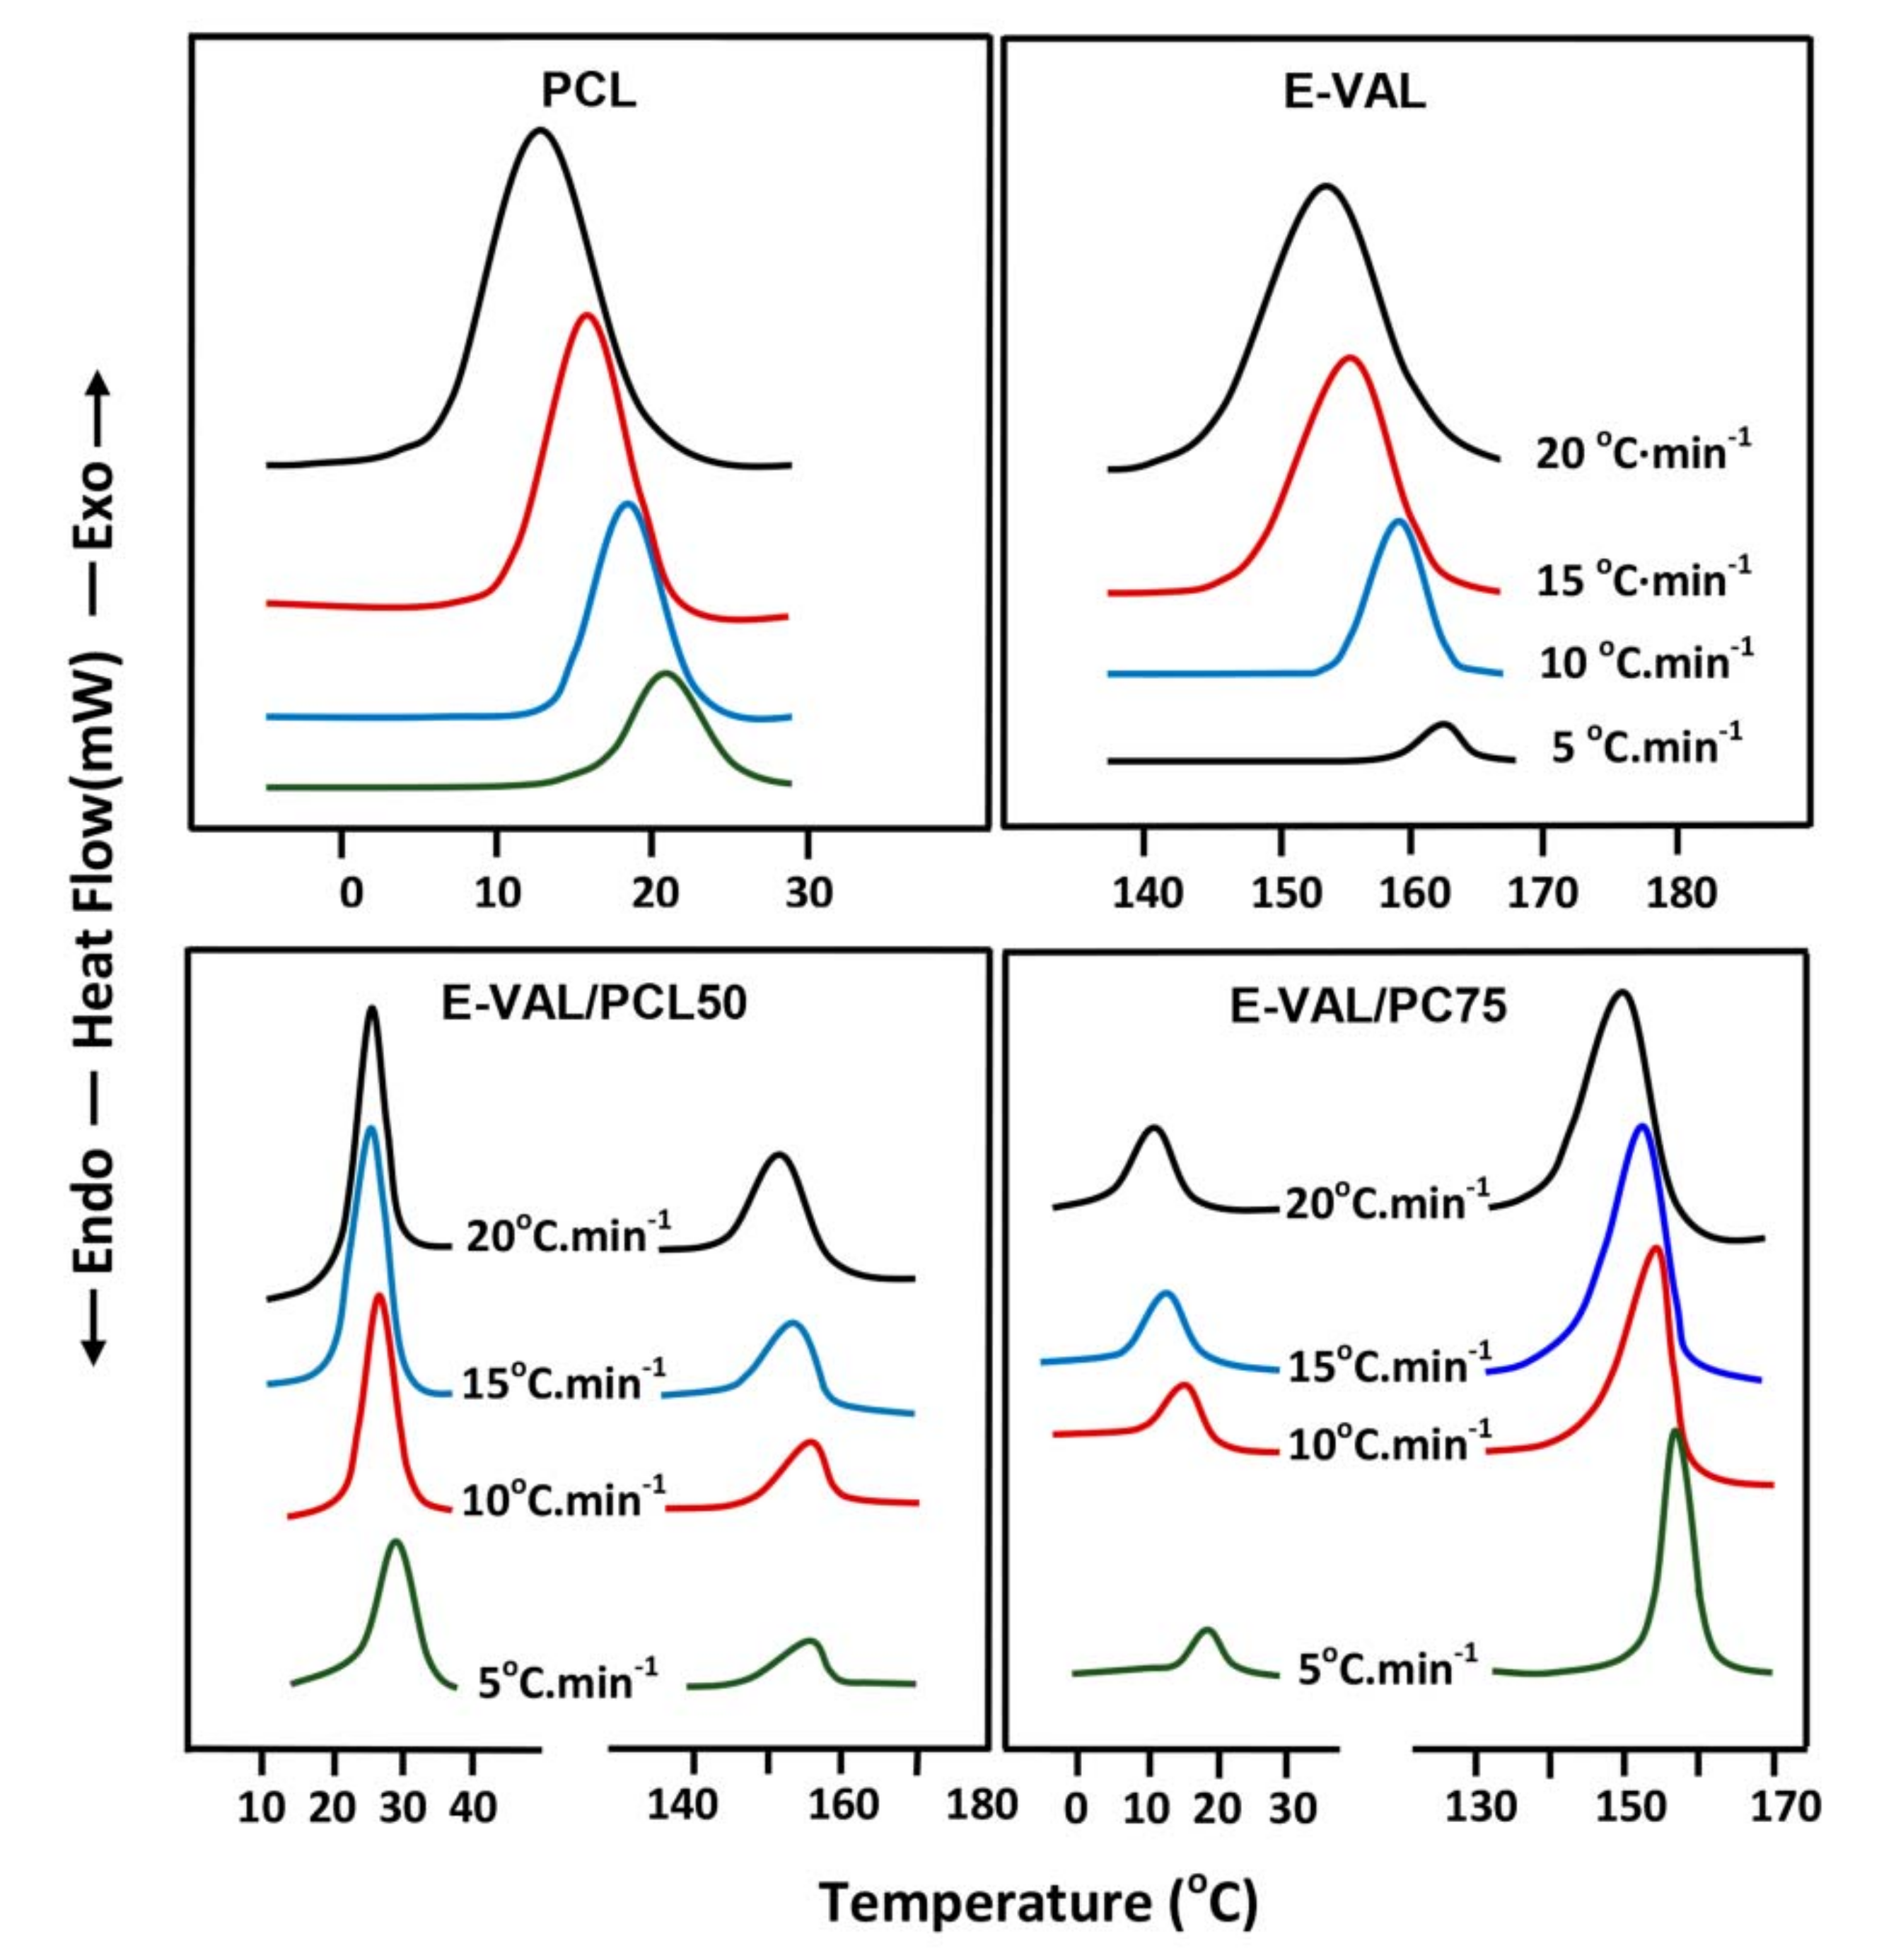
3.3. DSC Analysis
3.3.1. Glass Transition and Melting Temperature
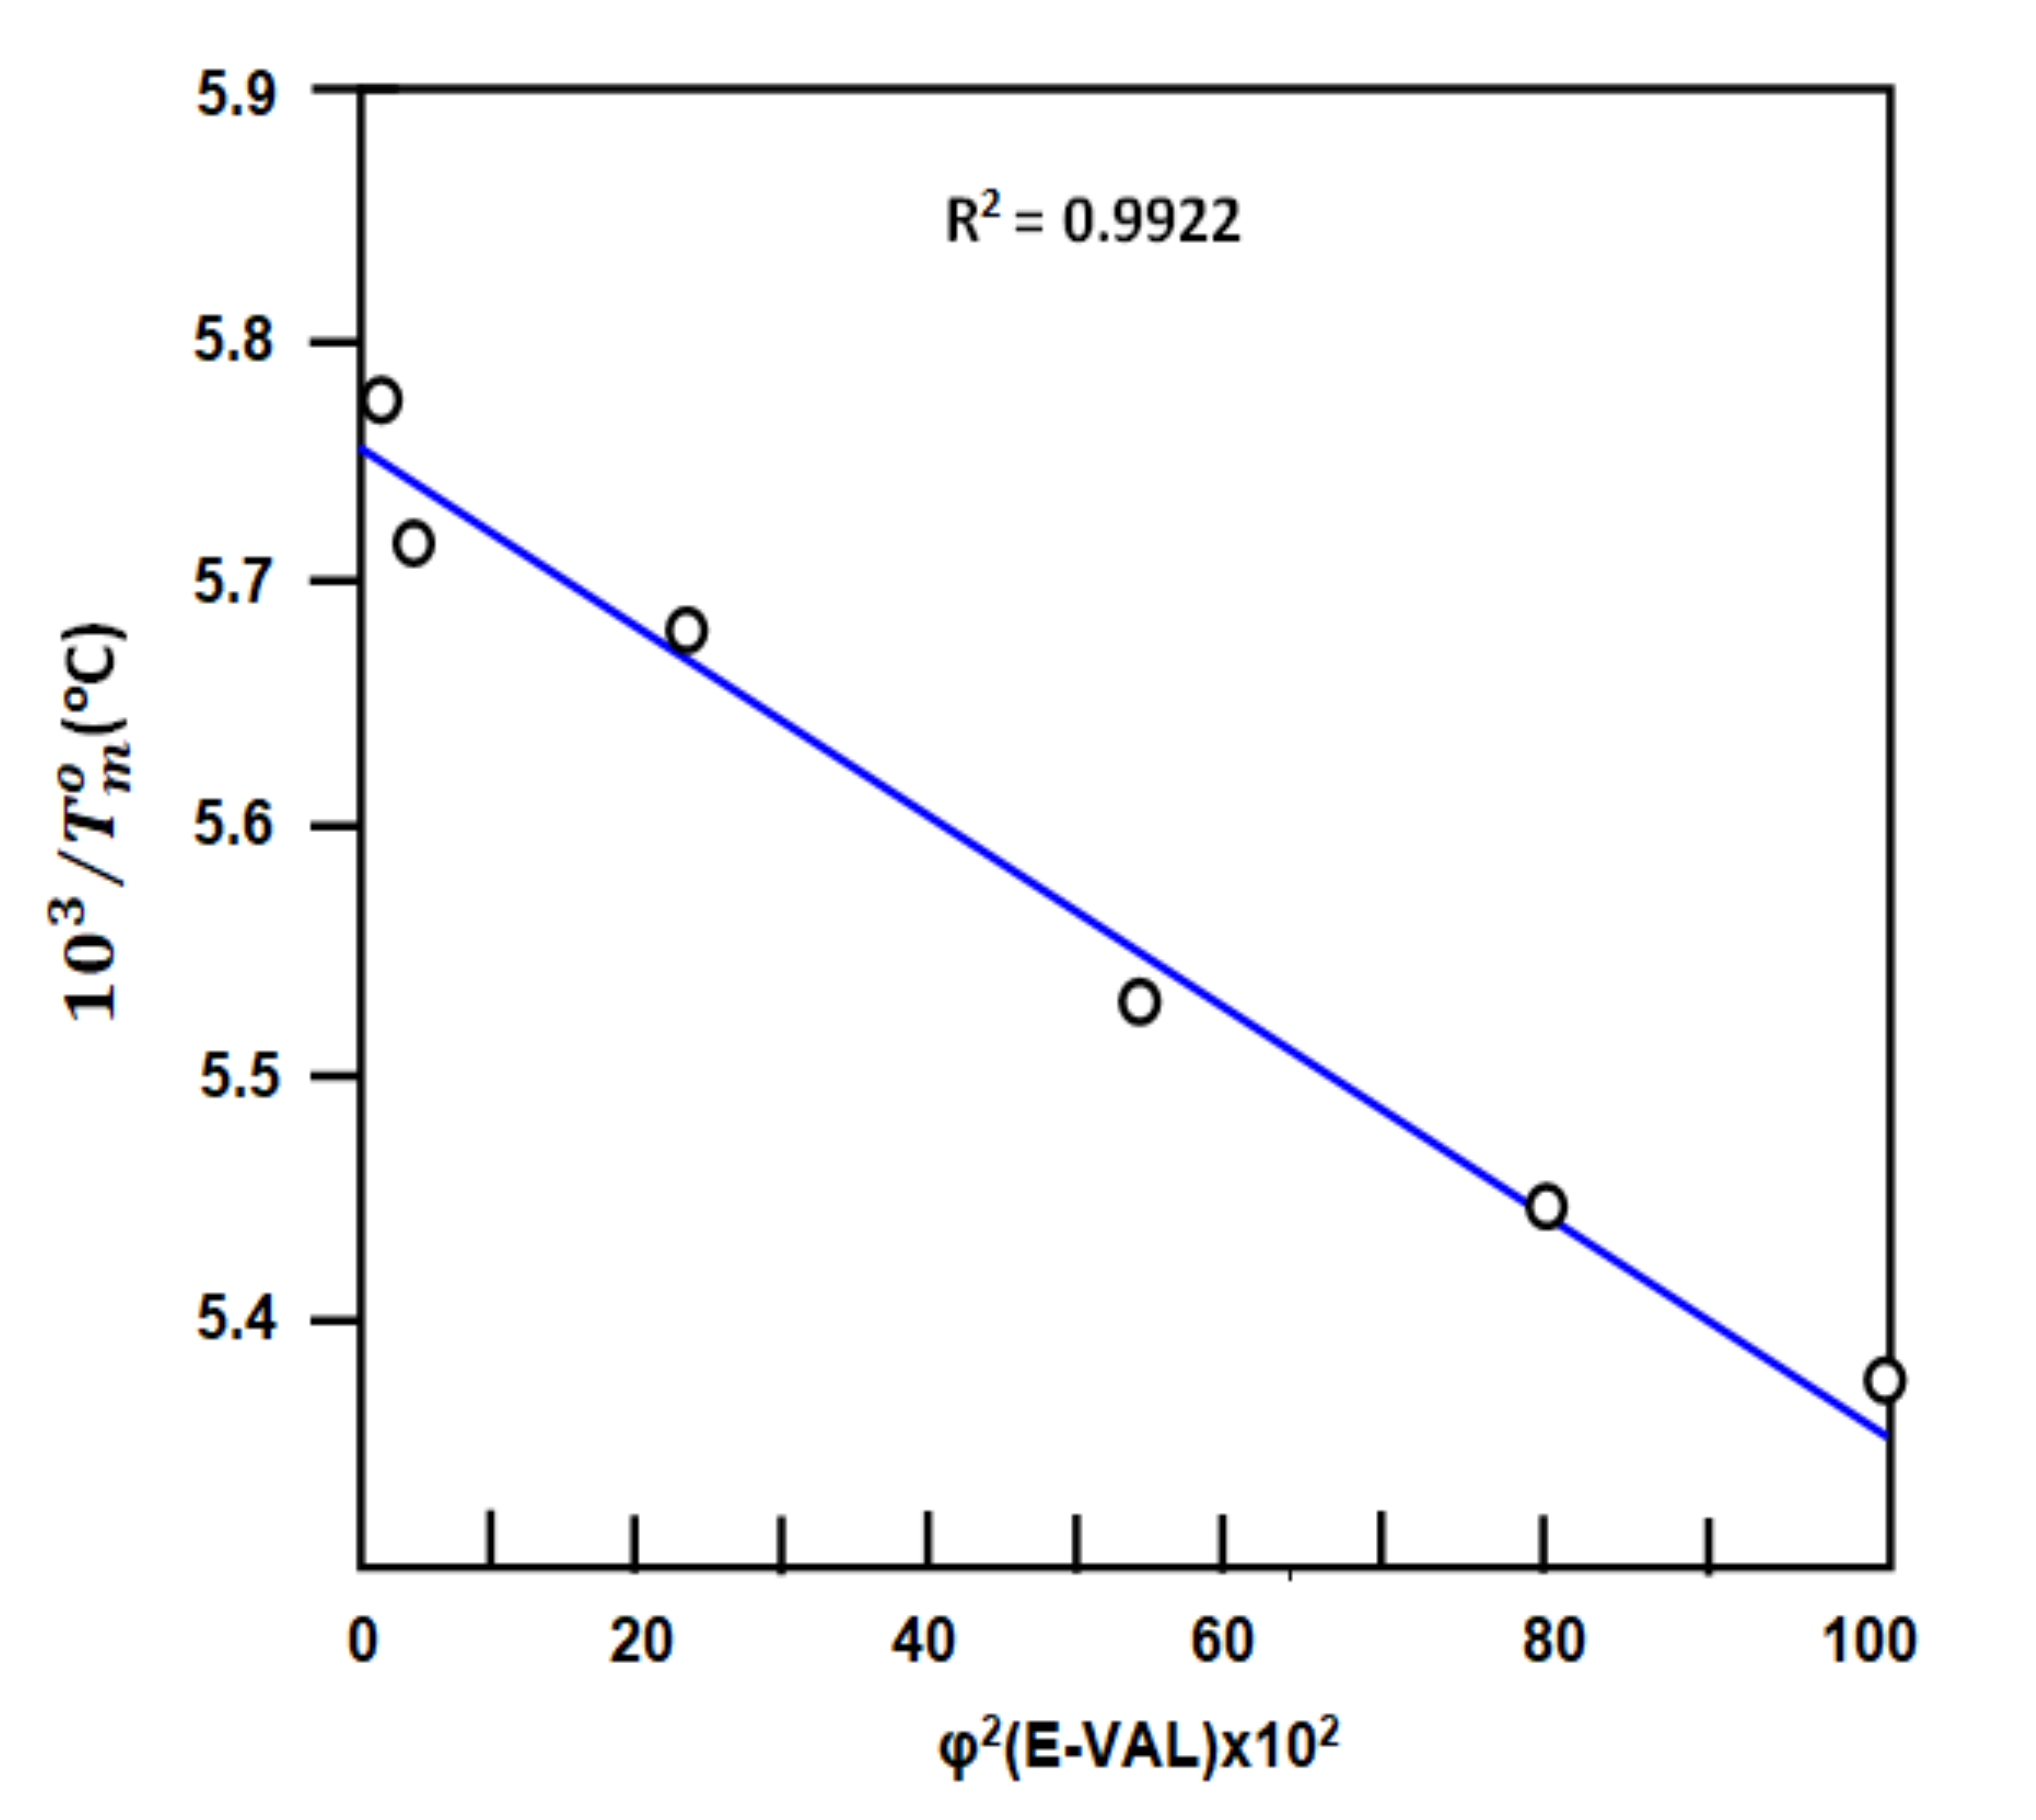
3.3.2. Flory Interaction Parameter
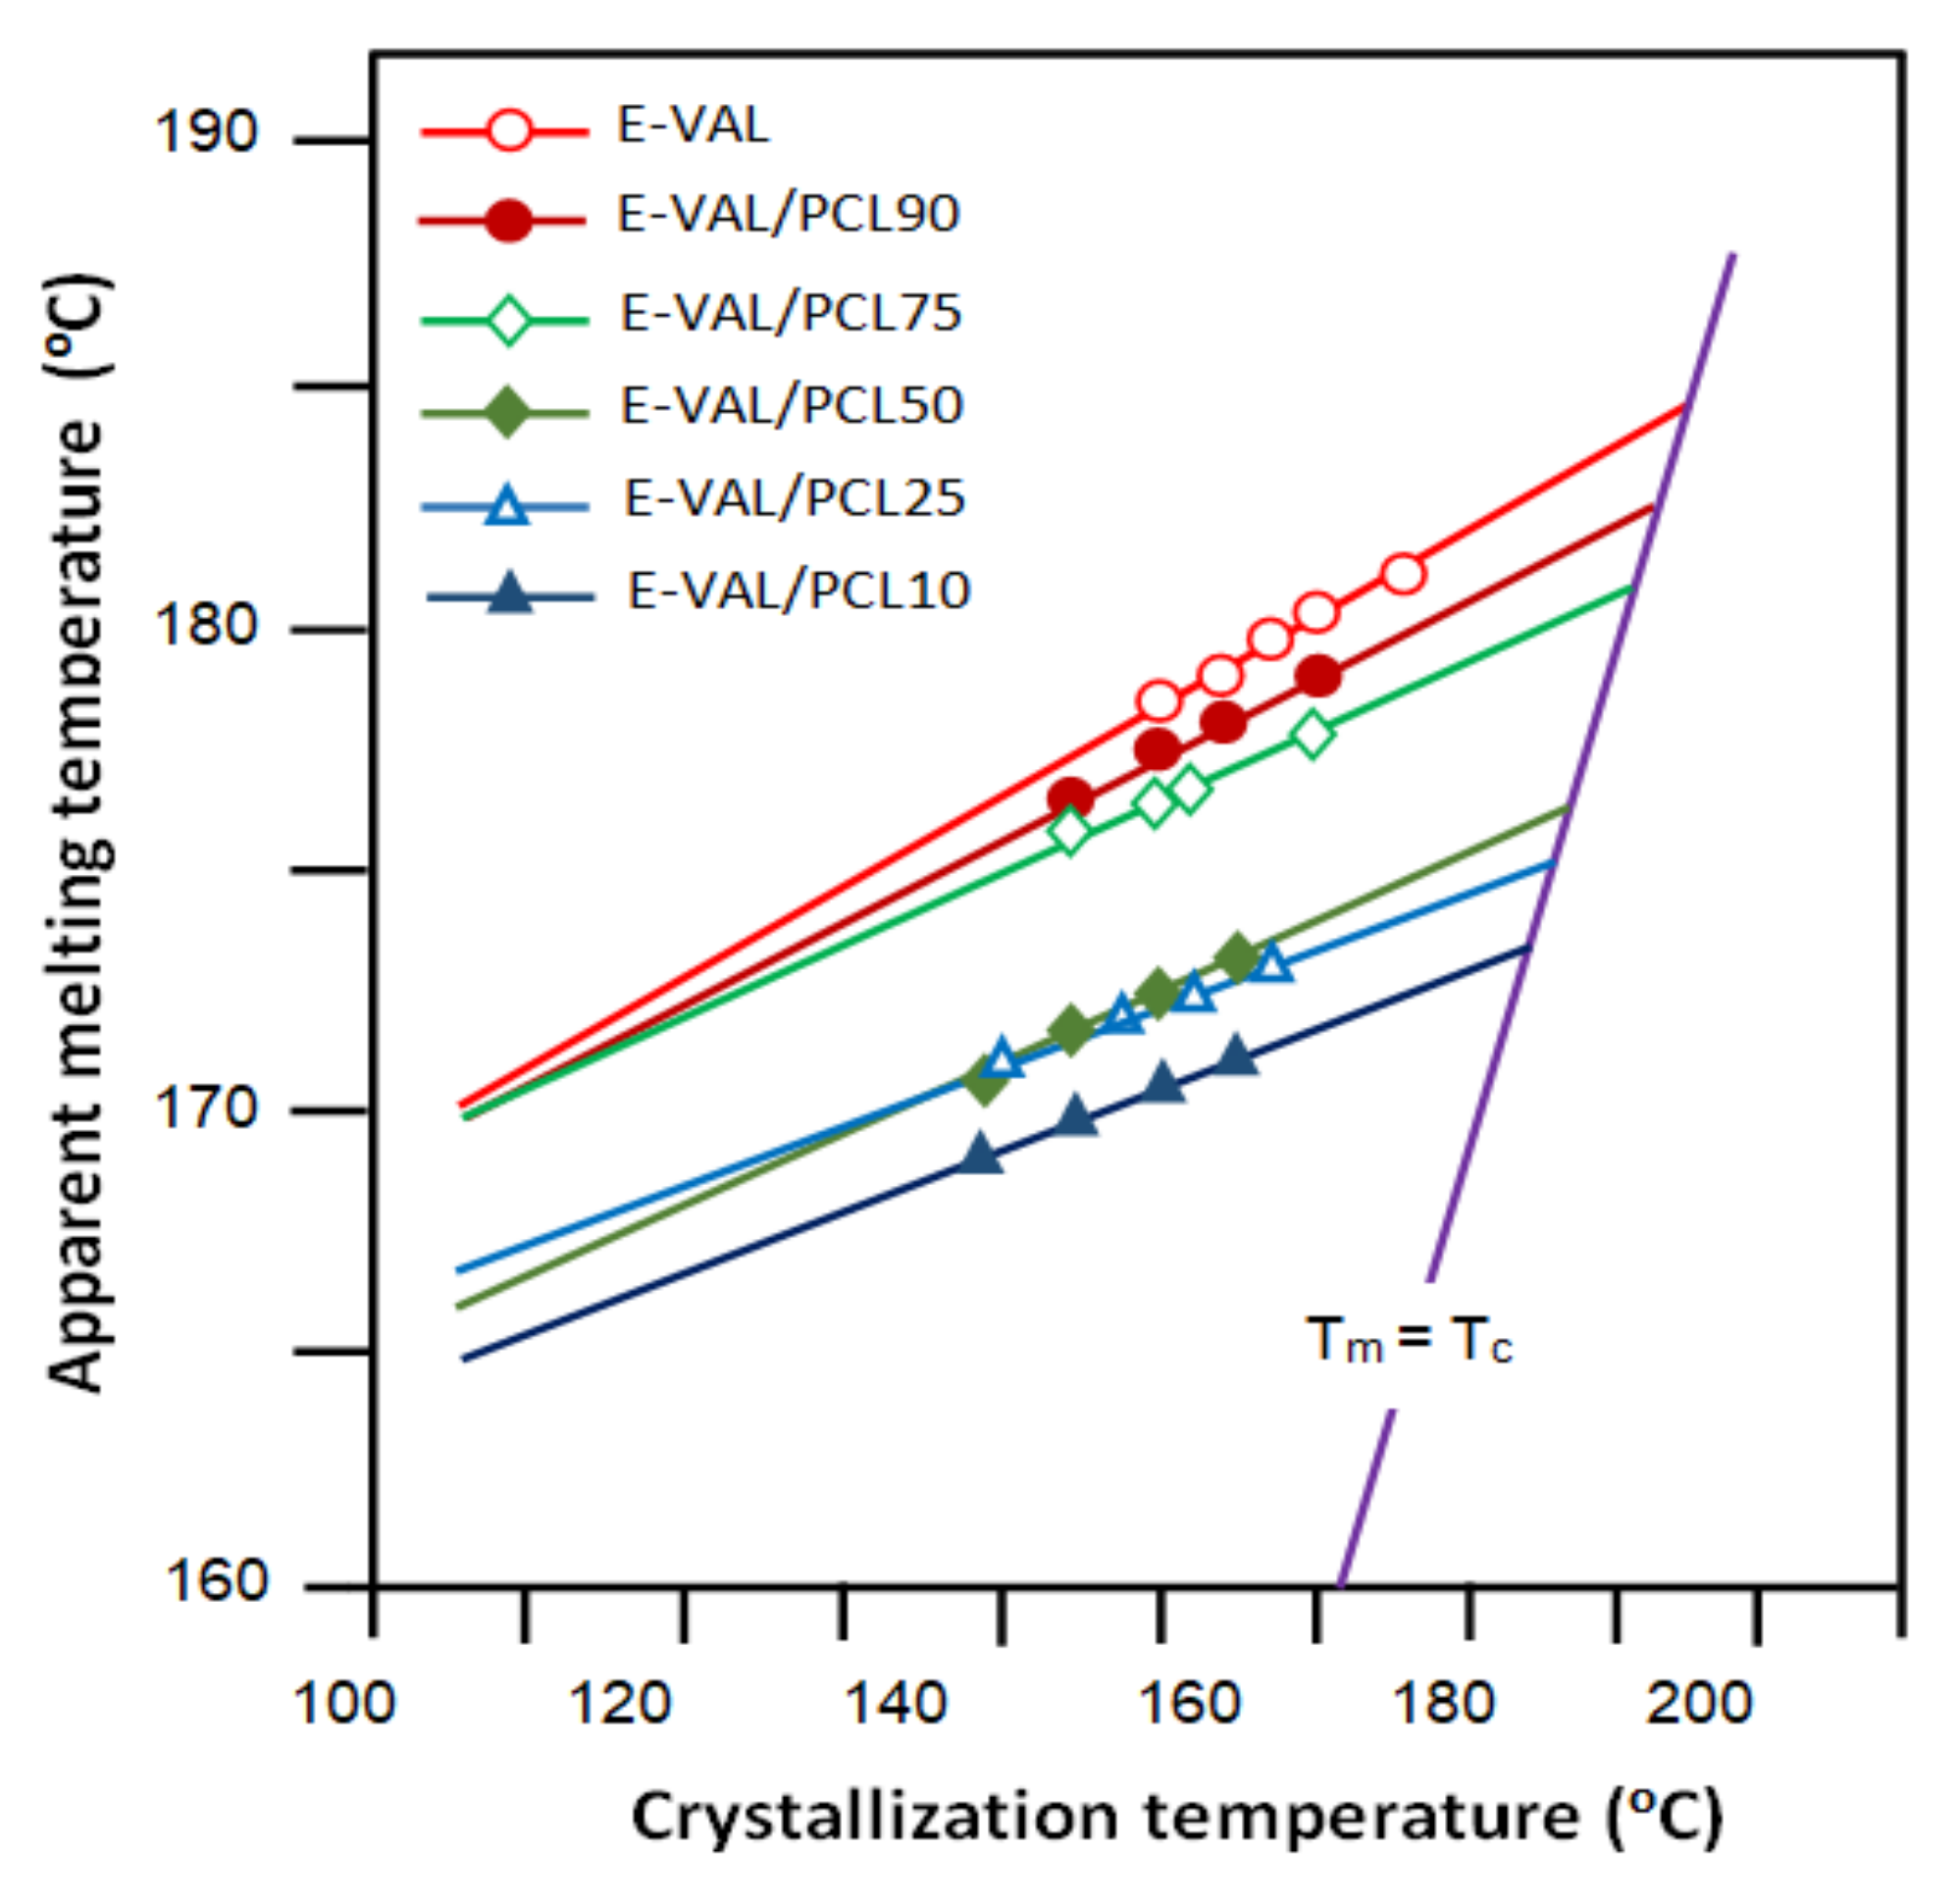
3.3.3. Crystallization Temperature
3.4. XRD Analysis
3.5. Thermal Stability
3.5.1. TGA Analysis
3.5.2. DART-ToF-MS Analysis
3.6. Non-Isothermal Crystallization Kinetics
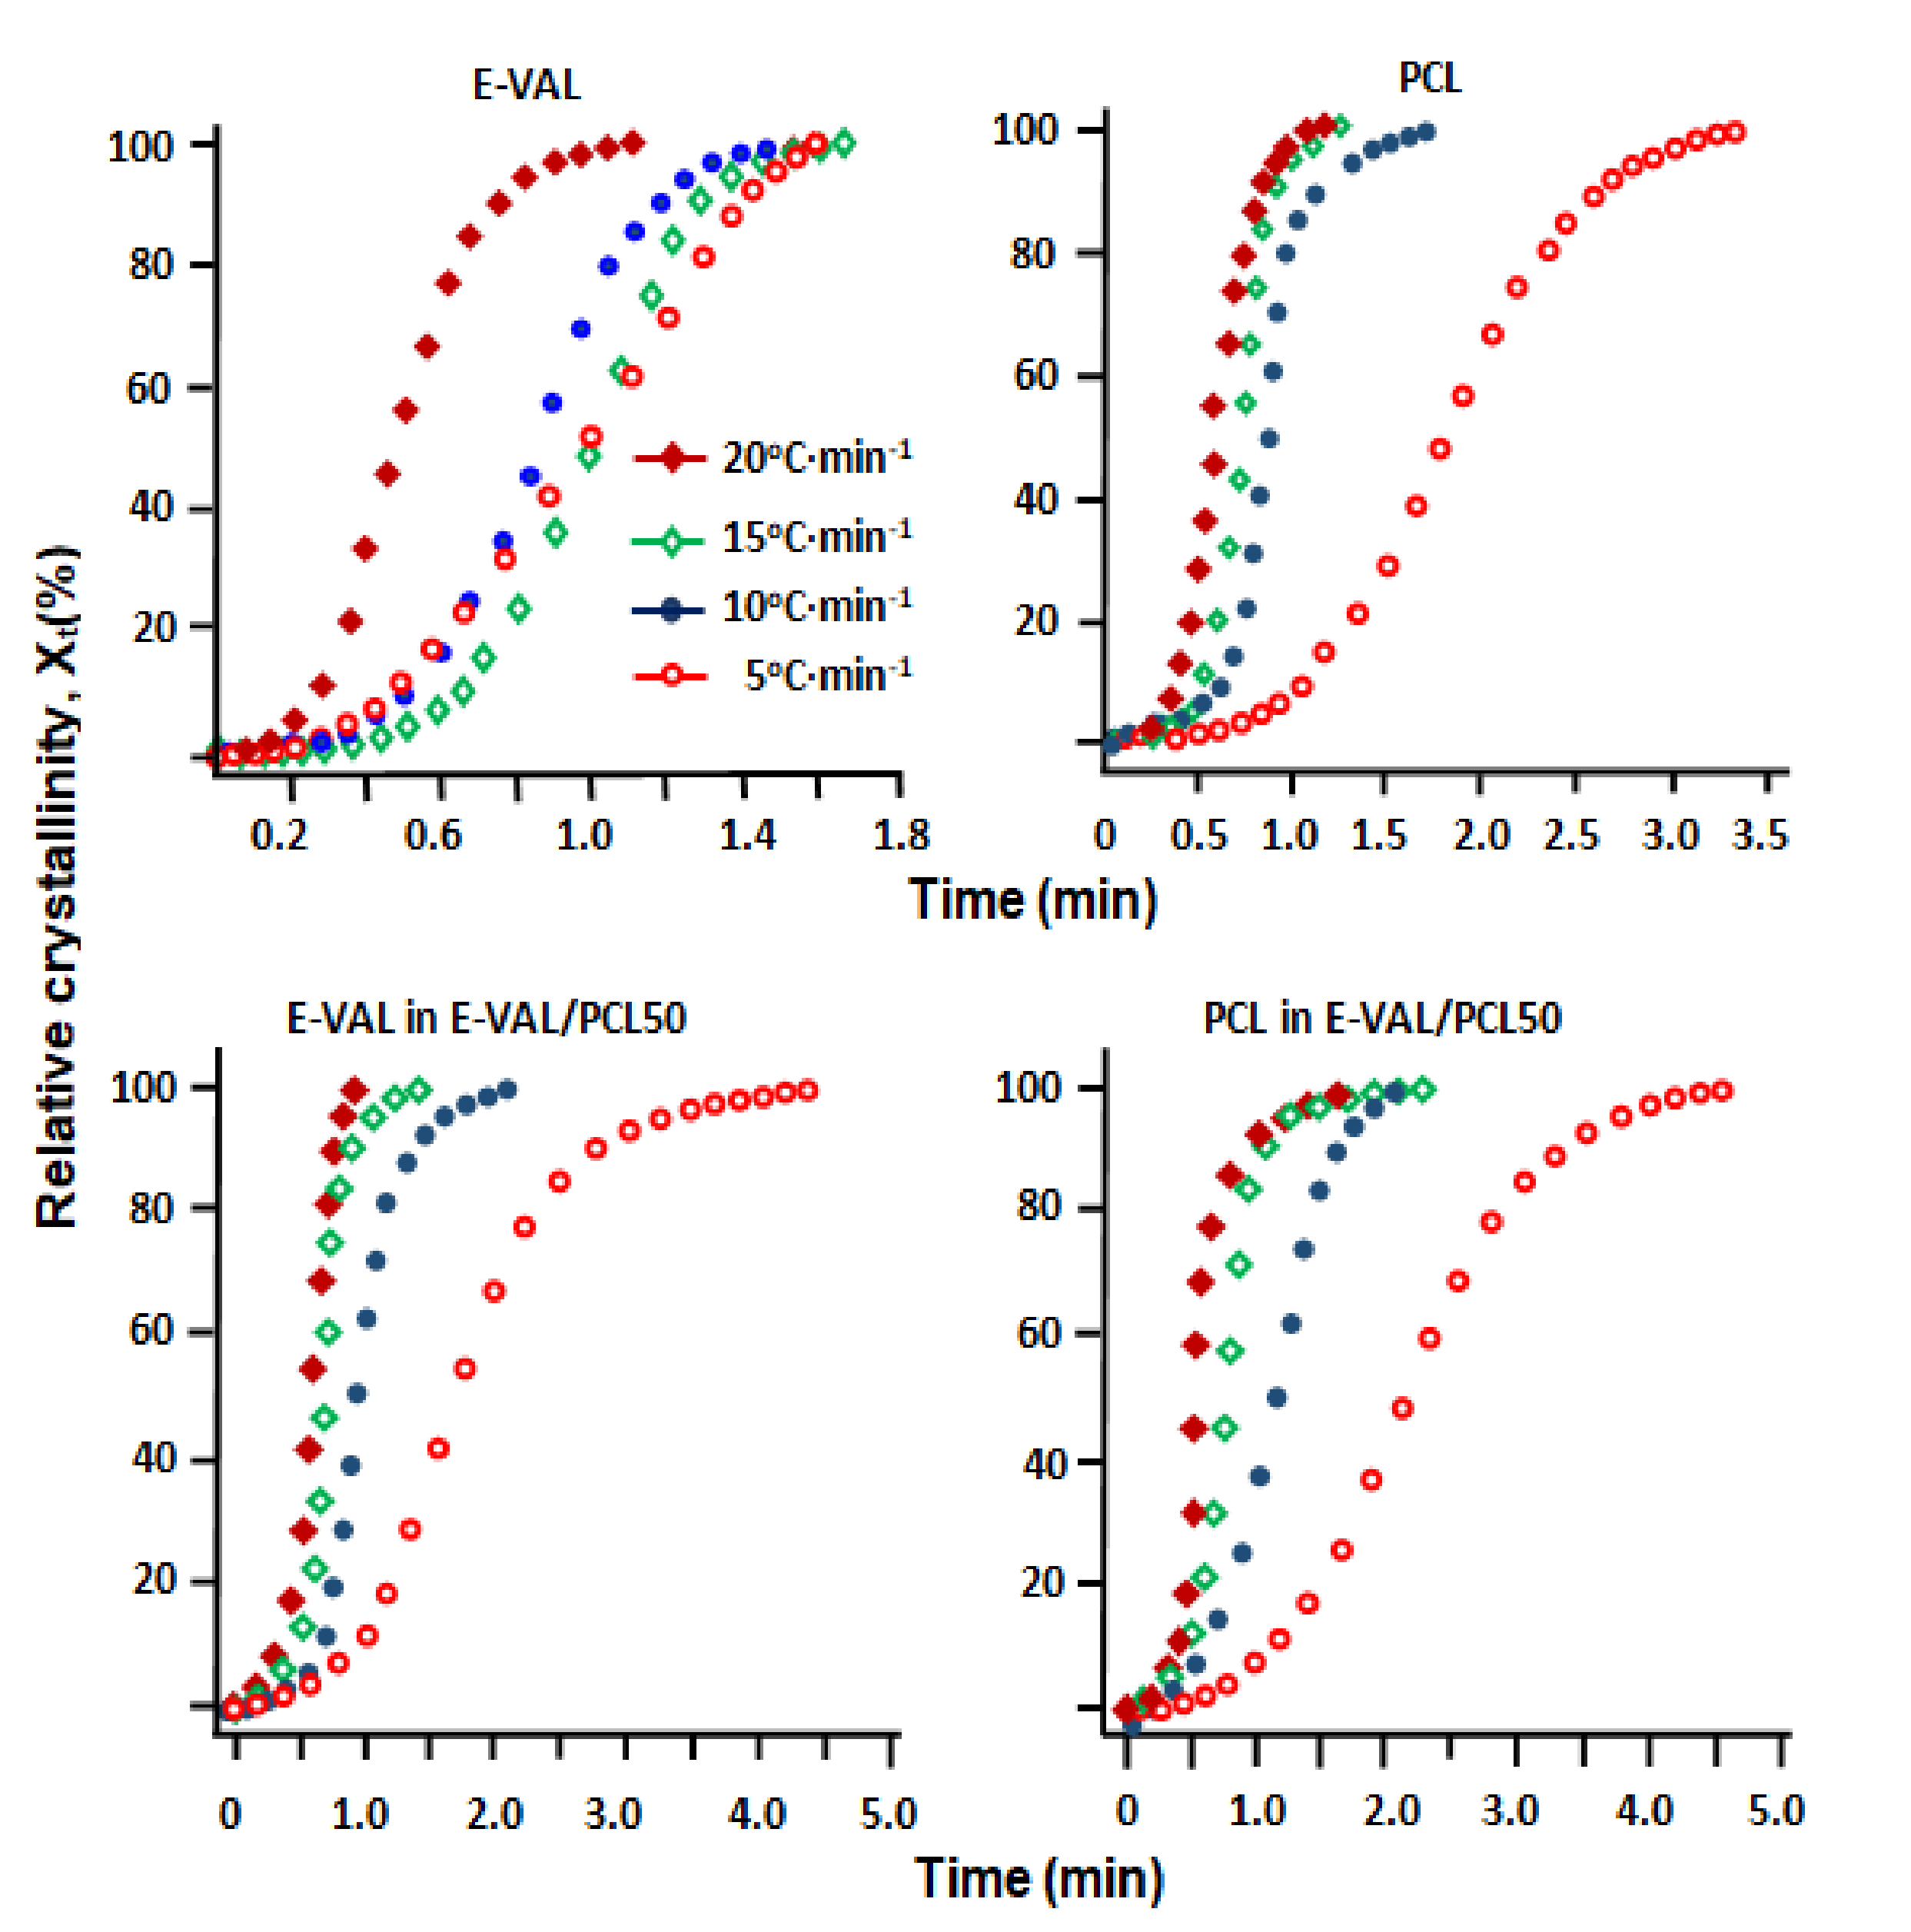
3.6.1. The Relative Degree of Crystallization
3.6.2. Half-Time of the Crystallization
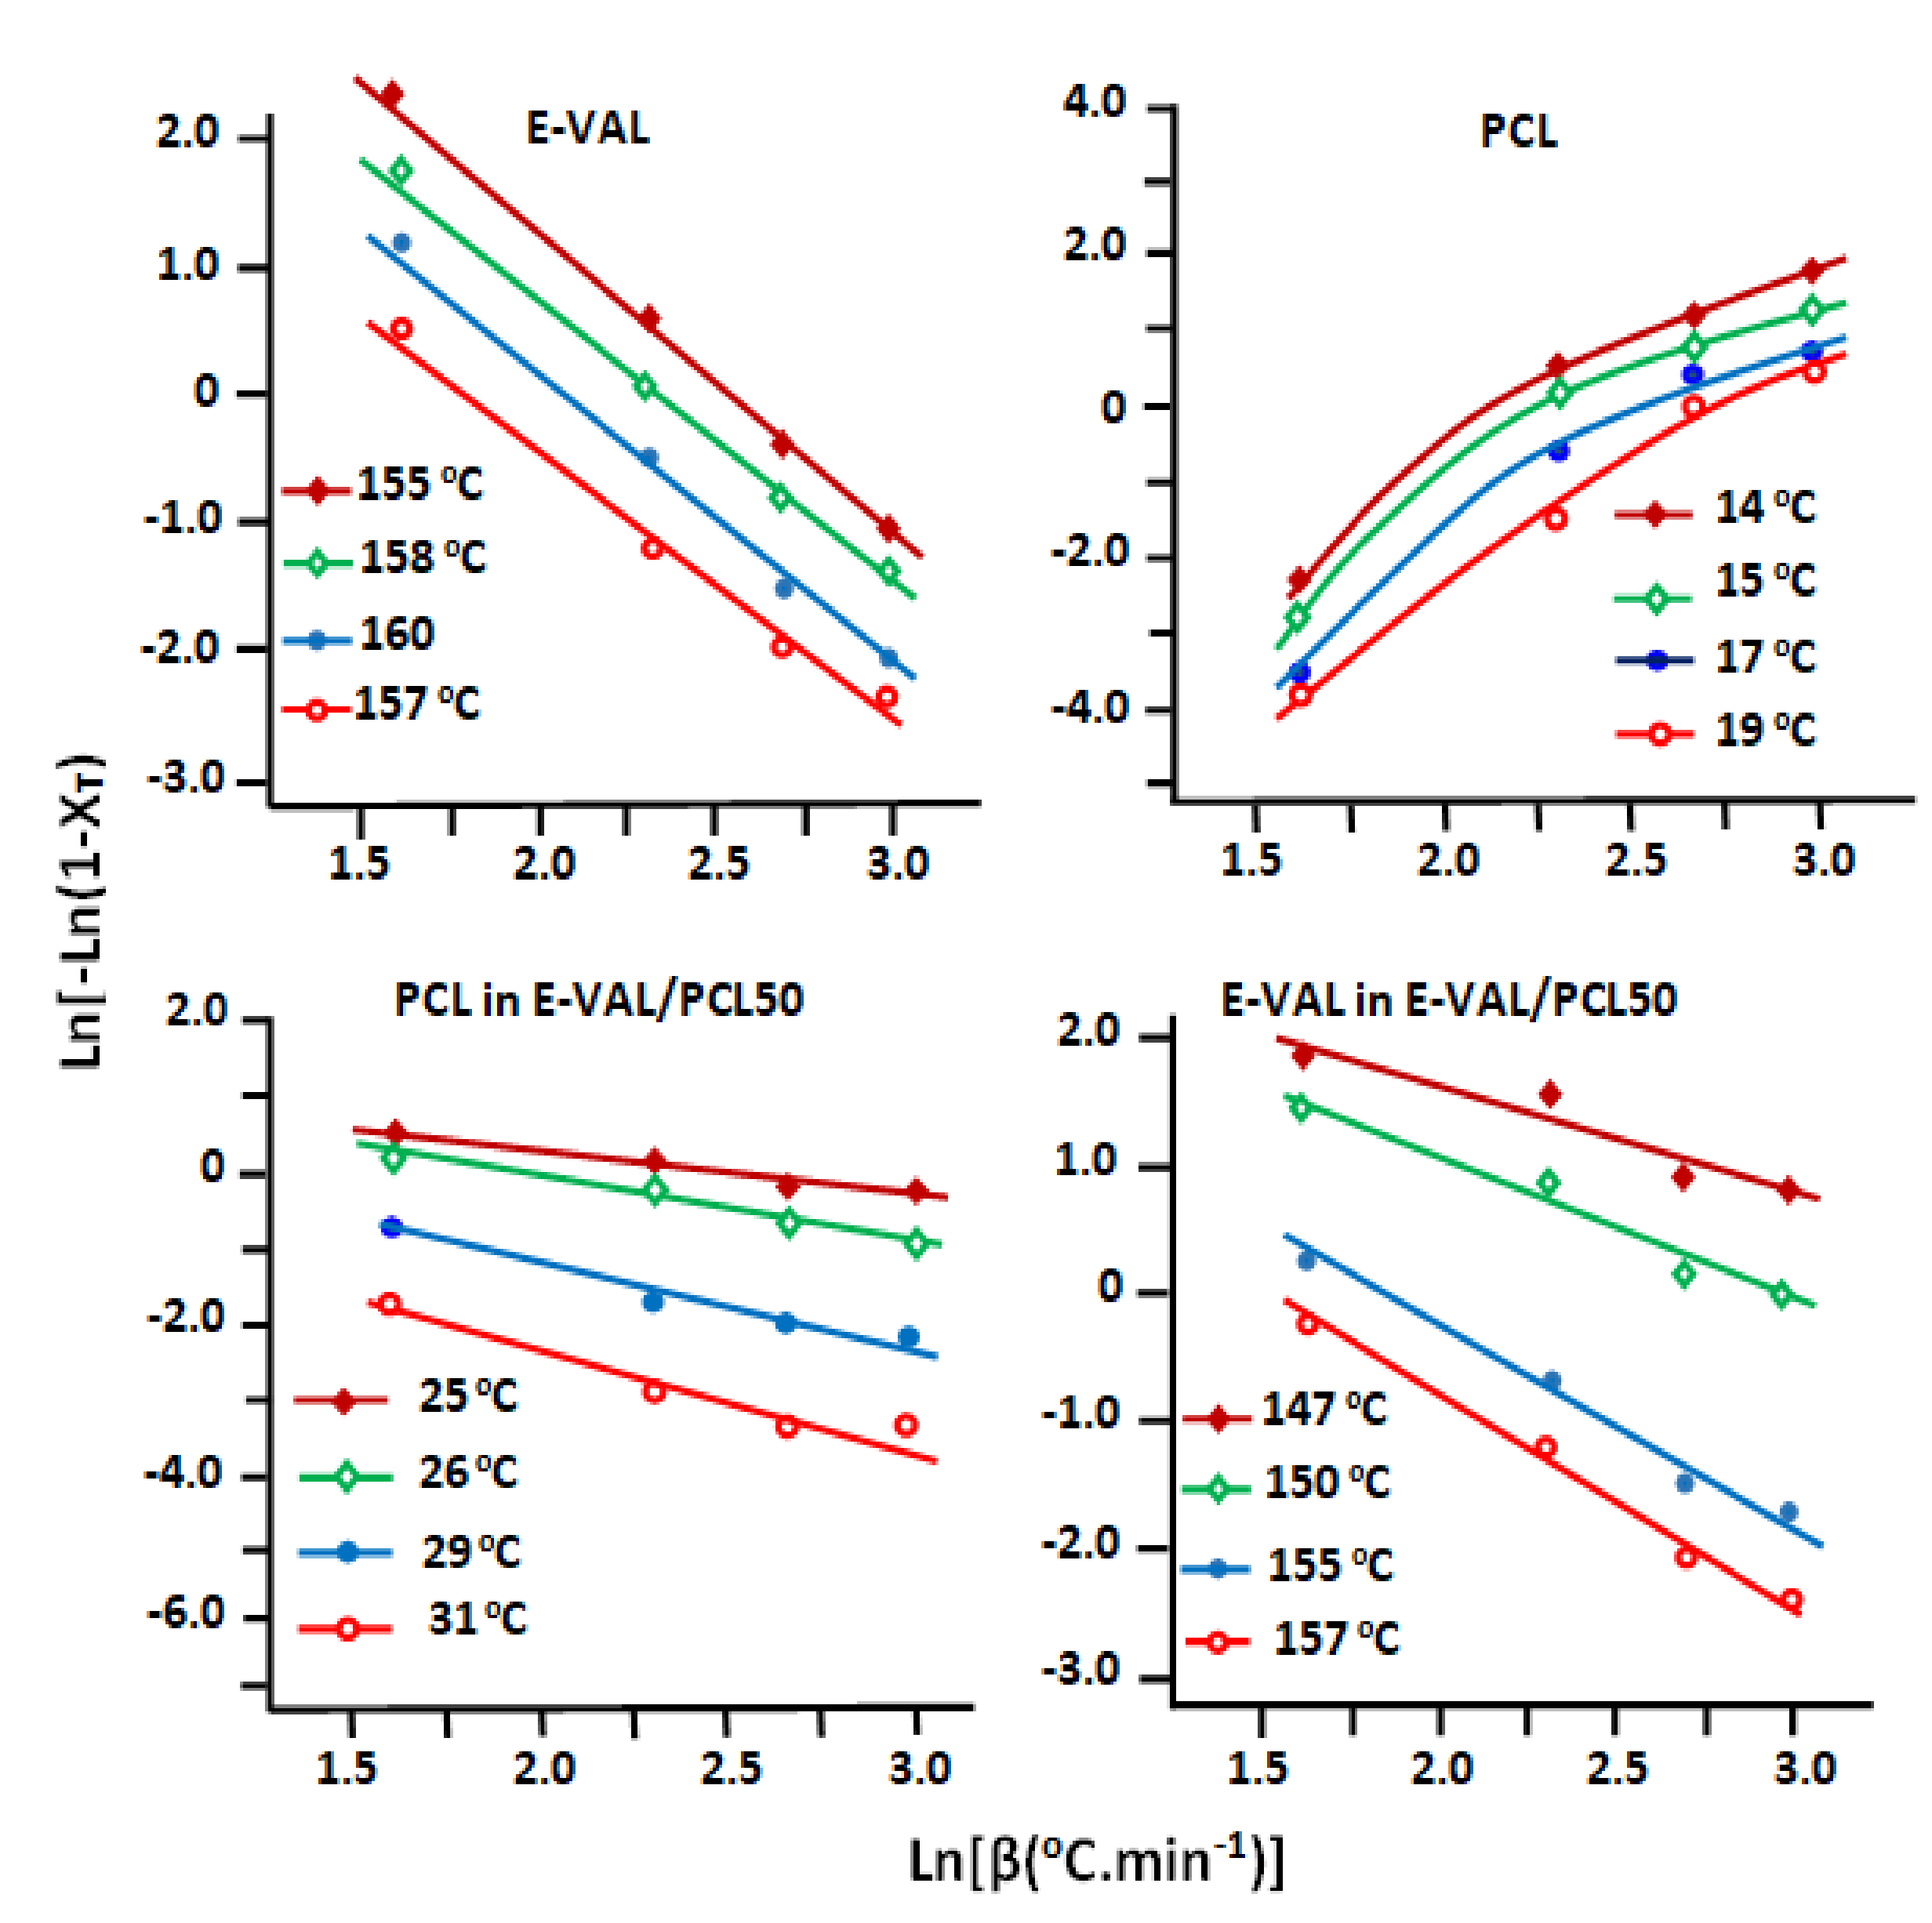
3.6.3. Ozawa Parameters
3.6.4. Crystallization Activation Energy (Ec)
4. Conclusions
Author Contributions
Funding
Informed Consent Statement
Data Availability Statement
Conflicts of Interest
References
- Feng, C.; Li, Y.; Yang, D.; Hu, J.; Zhang, X.; Huang, X. Well-defined graft copolymers: From controlled synthesis to multipurpose applications. Chem. Soc. Rev. 2011, 40, 1282–1295. [Google Scholar] [CrossRef]
- Nomura, N.; Akita, A.; Ishii, R.; Mizuno, M. Random Copolymerization of ε-Caprolactone with Lactide Using a Homosalen-Al Complex. J. Am. Chem. Soc. 2010, 132, 1750–1751. [Google Scholar] [CrossRef] [PubMed]
- McGrath, J.E.; McGrath, J.E. Block Copolymers: Overview and Critical Survey; Academic Press: Cambridge, MA, USA, 1977. [Google Scholar]
- Ceresa, R.J. Block and graft copolymers. AIChE J. 1962, 9, 715–718. [Google Scholar]
- van Eerdenbrugh, B.; Taylor, L.S. Molecular weight effects on the miscibility behavior of dextran and maltodextrin with poly (vinylpyrrolidone). Pharm. Res. 2012, 29, 2754–2765. [Google Scholar] [CrossRef]
- Utracki, L. Economics of polymer blends. Polym. Eng. Sci. 1982, 22, 1166–1175. [Google Scholar] [CrossRef]
- Marco, C.; Fatou, J.; Gomez, M.; Tanaka, H.; Tonelli, A. Molecular weight effect on the miscibility of poly (ethylene oxide) and isotactic poly (methyl methacrylate) in their blends. Macromolecules 1990, 23, 2183–2188. [Google Scholar] [CrossRef]
- Lam, C.X.; Savalani, M.M.; Teoh, S.-H.; Hutmacher, D.W. Dynamics of in vitro polymer degradation of polycaprolactone-based scaffolds: Accelerated versus simulated physiological conditions. Biomed. Mater. 2008, 3, 034108. [Google Scholar] [CrossRef] [PubMed]
- Albertsson, A.-C.; Varma, I.K. Recent developments in ring opening polymerization of lactones for biomedical applications. Biomacromolecules 2003, 4, 1466–1486. [Google Scholar] [CrossRef]
- Augustine, R.; Kalarikkal, N.; Thomas, S. Advancement of wound care from grafts to bioengineered smart skin substitutes. Prog. Biomater. 2014, 3, 103–113. [Google Scholar] [CrossRef] [PubMed]
- Holländer, J.; Genina, N.; Jukarainen, H.; Khajeheian, M.; Rosling, A.; Mäkilä, E.; Sandler, N. Three-dimensional printed PCL-based implantable prototypes of medical devices for controlled drug delivery. J. Pharm. Sci. 2016, 105, 2665–2676. [Google Scholar] [CrossRef] [PubMed]
- Boia, R.; Dias, P.A.; Martins, J.M.; Galindo-Romero, C.; Aires, I.D.; Vidal-Sanz, M.; Agudo-Barriuso, M.; de Sousa, H.C.; Ambrósio, A.F.; Braga, M.E. Porous poly (ε-caprolactone) implants: A novel strategy for efficient intraocular drug delivery. J. Control. Release 2019, 316, 331–348. [Google Scholar] [CrossRef] [PubMed]
- Silva-Cunha, A.; Fialho, S.L.; Naud, M.-C.; Behar-Cohen, F. Poly-ε-caprolactone intravitreous devices: An in vivo study. Investig. Ophthalmol. Vis. Sci. 2009, 50, 2312–2318. [Google Scholar] [CrossRef]
- Stewart, S.A.; Domínguez-Robles, J.; McIlorum, V.J.; Gonzalez, Z.; Utomo, E.; Mancuso, E.; Lamprou, D.A.; Donnelly, R.F.; Larranñeta, E. Poly (caprolactone)-Based Coatings on 3D-Printed Biodegradable Implants: A Novel Strategy to Prolong Delivery of Hydrophilic Drugs. Mol. Pharm. 2020, 17, 3487–3500. [Google Scholar] [CrossRef]
- Luciani, A.; Coccoli, V.; Orsi, S.; Ambrosio, L.; Netti, P.A. PCL microspheres based functional scaffolds by bottom-up approach with predefined microstructural properties and release profiles. Biomaterials 2008, 29, 4800–4807. [Google Scholar] [CrossRef]
- Lee, K.; Kim, H.; Khil, M.; Ra, Y.; Lee, D. Characterization of nano-structured poly (ε-caprolactone) nonwoven mats via electrospinning. Polymer 2003, 44, 1287–1294. [Google Scholar] [CrossRef]
- de Biotecnología, G. Poly (vinylalcohol-co-ethylene) biodegradation on semi solid fermentation by Phanerochaete chrysosporium. Acta Farm. Bonaer. 2004, 23, 123–128. [Google Scholar]
- Kueng, W.; Silber, E.; Eppenberger, U. Quantification of cells cultured on 96-well plates. Anal. Biochem. 1989, 182, 16–19. [Google Scholar] [CrossRef]
- Matsumura, K.; Hyon, S.H.; Nakajima, N.; Peng, C.; Tsutsumi, S. Surface modification of poly (ethylene-co-vinyl alcohol)(EVA). Part I. Introduction of carboxyl groups and immobilization of collagen. J. Biomed. Mater. Res. 2000, 50, 512–517. [Google Scholar] [CrossRef]
- Ino, J.M.; Chevallier, P.; Letourneur, D.; Mantovani, D.; Le Visage, C. Plasma functionalization of poly (vinyl alcohol) hydrogel for cell adhesion enhancement. Biomatter 2013, 3, e25414. [Google Scholar] [CrossRef] [PubMed]
- Mandelkern, L. Crystallization of Polymers: Volume 2, Kinetics and Mechanisms; Cambridge University Press: Cambridge, UK, 2004. [Google Scholar]
- Bartczak, Z. Deformation of semicrystalline polymers—The contribution of crystalline and amorphous phases. Polimery 2017, 62, 787–799. [Google Scholar] [CrossRef]
- Luo, D.-J.; Shao, H.-J.; Wei, F.-J.; Zhang, K.-Z.; Cui, Z.-Y.; Yu, J.; Qin, S.-H. Morphology and Isothermal Crystallization Kinetics of Polypropylene/Poly (ethylene-co-vinyl alcohol) Blends. Int. Polym. Process. 2019, 34, 195–208. [Google Scholar] [CrossRef]
- Peppas, N.A.; Hansen, P.J. Crystallization kinetics of poly (vinyl alcohol). J. Appl. Polym. Sci. 1982, 27, 4787–4797. [Google Scholar] [CrossRef]
- Pereira, F.M.; Canevarolo, S.V.; Chinelatto, M.A. Isothermal crystallization kinetics of biodegradable poly (lactic acid)/poly (ε-caprolactone) blends compatibilized with low-molecular weight block copolymers. Polym. Eng. Sci. 2019, 59, E161–E169. [Google Scholar] [CrossRef]
- Choi, J.; Chun, S.W.; Kwak, S.Y. Non-Isothermal Crystallization of Hyperbranched Poly (ε-caprolactone) s and Their Linear Counterpart. Macromol. Chem. Phys. 2006, 207, 1166–1173. [Google Scholar] [CrossRef]
- Long, Y.; Shanks, R.A.; Stachurski, Z.H. Kinetics of polymer crystallisation. Prog. Polym. Sci. 1995, 20, 651–701. [Google Scholar] [CrossRef]
- Tadmor, Z.; Gogos, C.G. Principles of Polymer Processing; John Wiley & Sons: Hoboken, NJ, USA, 2013. [Google Scholar]
- Jeziorny, A. Parameters characterizing the kinetics of the non-isothermal crystallization of poly (ethylene terephthalate) determined by DSC. Polymer 1978, 19, 1142–1144. [Google Scholar] [CrossRef]
- Ziabicki, A. Crystallization of polymers in variable external conditions. Colloid Polym. Sci. 1996, 274, 705–716. [Google Scholar] [CrossRef]
- Ozawa, T. Kinetics of non-isothermal crystallization. Polymer 1971, 12, 150–158. [Google Scholar] [CrossRef]
- van Berkel, J.G.l. On the Physical Properties of Poly (Ethylene 2, 5-Furandicarboxylate); Université Côte d’Azur: Nice, France, 2018. [Google Scholar]
- Alghamdi, A.A.; Alattas, H.; Saeed, W.S.; Al-Odayni, A.-B.; Alrahlah, A.; Aouak, T. Preparation and Characterization of Poly (ethylene-co-vinyl alcohol)/poly (ε-caprolactone) Blend for Bioscaffolding Applications. Int. J. Mol. Sci. 2020, 21, 5881. [Google Scholar] [CrossRef]
- Qiu, Z.; Ikehara, T.; Nishi, T. Miscibility and crystallization in crystalline/crystalline blends of poly (butylene succinate)/poly (ethylene oxide). Polymer 2003, 44, 2799–2806. [Google Scholar] [CrossRef]
- de Lima, J.A.; Felisberti, M.I. Poly (ethylene-co-vinyl alcohol) and poly (methyl methacrylate) blends: Phase behavior and morphology. Eur. Polym. J. 2008, 44, 1140–1148. [Google Scholar] [CrossRef]
- Flory, P.J. Thermodynamics of high polymer solutions. J. Chem. Phys. 1941, 9, 660. [Google Scholar] [CrossRef]
- Huggins, M.L. Solutions of long chain compounds. J. Chem. Phys. 1941, 9, 440. [Google Scholar] [CrossRef]
- Hoffman, J.D.; Weeks, J.J. X-ray study of isothermal thickening of lamellae in bulk polyethylene at the crystallization temperature. J. Chem. Phys. 1965, 42, 4301–4302. [Google Scholar] [CrossRef]
- Alvarez, V.A.; Kenny, J.M.; Vázquez, A. Isothermal crystallization of poly (vinyl alcohol-co-ethylene). J. Appl. Polym. Sci. 2003, 89, 1071–1077. [Google Scholar] [CrossRef]
- Nishi, T.; Wang, T. Melting point depression and kinetic effects of cooling on crystallization in poly (vinylidene fluoride)-poly (methyl methacrylate) mixtures. Macromolecules 1975, 8, 909–915. [Google Scholar] [CrossRef]
- Lee, J.-C.; Tazawa, H.; Ikehara, T.; Nishi, T. Miscibility and Crystallization Behavior of Poly (butylene succinate) and Poly (vinylidene fluoride) Blends. Polym. J. 1998, 30, 327–339. [Google Scholar] [CrossRef][Green Version]
- She, H.; Xiao, X.; Liu, R. Preparation and characterization of polycaprolactone-chitosan composites for tissue engineering applications. J. Mater. Sci. 2007, 42, 8113–8119. [Google Scholar] [CrossRef]
- Hu, Y.; Sato, H.; Zhang, J.; Noda, I.; Ozaki, Y. Crystallization behavior of poly (l-lactic acid) affected by the addition of a small amount of poly (3-hydroxybutyrate). Polymer 2008, 49, 4204–4210. [Google Scholar] [CrossRef]
- Oyama, H.T. Super-tough poly (lactic acid) materials: Reactive blending with ethylene copolymer. Polymer 2009, 50, 747–751. [Google Scholar] [CrossRef]
- Nagata, M.; Yamamoto, Y. Synthesis and characterization of photocrosslinked poly (ε-caprolactone) s showing shape-memory properties. J. Polym. Sci. Part A Polym. Chem. 2009, 47, 2422–2433. [Google Scholar] [CrossRef]
- Hsu, W.P. Reexamination of the miscibility of stereoregular poly (methyl methacrylate) with poly (vinyl phenol). J. Appl. Polym. Sci. 2002, 83, 1425–1431. [Google Scholar] [CrossRef]
- Alvarez, V.A.; Stefani, P.M.; Vázquez, A. Non-isothermal crystallization of polyvinylalcohol-co-ethylene. J. Therm. Anal. Calorim. 2005, 79, 187–193. [Google Scholar] [CrossRef]
- Guadagno, L.; Naddeo, C.; Vittoria, V.; Camino, G.; Cagnani, C. Chemical and morphologial modifications of irradiated linear low density polyethylene (LLDPE). Polym. Degrad. Stab. 2001, 72, 175–186. [Google Scholar] [CrossRef]
- Baji, A.; Wong, S.C.; Liu, T.; Li, T.; Srivatsan, T. Morphological and X-ray diffraction studies of crystalline hydroxyapatite-reinforced polycaprolactone. J. Biomed. Mater. Res. Part B Appl. Biomater. 2007, 81, 343–350. [Google Scholar] [CrossRef] [PubMed]
- Nanaki, S.G.; Papageorgiou, G.Z.; Bikiaris, D.N. Crystallization of novel poly (ε-caprolactone)-block-poly (propylene adipate) copolymers. J. Therm. Anal. Calorim. 2012, 108, 633–645. [Google Scholar] [CrossRef]
- Alvarez, V.; Ruseckaite, R.; Vázquez, A. Kinetic analysis of thermal degradation in poly (ethylene-vinyl alcohol) copolymers. J. Appl. Polym. Sci. 2003, 90, 3157–3163. [Google Scholar] [CrossRef]
- Tsuchiya, Y.; Sumi, K. Thermal decomposition products of polyethylene. J. Polym. Sci. Part A 1 Polym. Chem. 1968, 6, 415–424. [Google Scholar] [CrossRef]
- Holland, B.; Hay, J. The thermal degradation of poly (vinyl alcohol). Polymer 2001, 42, 6775–6783. [Google Scholar] [CrossRef]
- Persenaire, O.; Alexandre, M.; Degée, P.; Dubois, P. Mechanisms and kinetics of thermal degradation of poly (ε-caprolactone). Biomacromolecules 2001, 2, 288–294. [Google Scholar] [CrossRef]
- Vogel, C.; Siesler, H.W. Thermal Degradation of Poly (ε-caprolactone), Poly (L-lactic acid) and their Blends with Poly (3-hydroxy-butyrate) Studied by TGA/FT-IR Spectroscopy. Macromol. Symp. 2008, 265, 183–194. [Google Scholar] [CrossRef]
- Jiang, W.; Qiao, X.; Sun, K. Mechanical and thermal properties of thermoplastic acetylated starch/poly (ethylene-co-vinyl alcohol) blends. Carbohydr. Polym. 2006, 65, 139–143. [Google Scholar] [CrossRef]
- Guo, Q.; Groeninckx, G. Crystallization kinetics of poly (ε-caprolactone) in miscible thermosetting polymer blends of epoxy resin and poly (ε-caprolactone). Polymer 2001, 42, 8647–8655. [Google Scholar] [CrossRef]
- Hammami, A.; Spruiell, J.E.; Mehrotra, A.K. Quiescent nonisothermal crystallization kinetics of isotactic polypropylenes. Polym. Eng. Sci. 1995, 35, 797–804. [Google Scholar] [CrossRef]
- Huang, Y.; Liu, H.; He, P.; Yuan, L.; Xiong, H.; Xu, Y.; Yu, Y. Nonisothermal crystallization kinetics of modified bamboo fiber/PCL composites. J. Appl. Polym. Sci. 2010, 116, 2119–2125. [Google Scholar] [CrossRef]
- Zhu, B.-D.; Zhang, J.-Y.; Lin, C.-H.; Chen, H.-L.; Wang, J. Nonisothermal crystallization kinetics of ethylene vinyl alcohol copolymer with poly (oxypropylene) diamine intercalated montmorrilonite. J. Macromolecul. Sci. Part B 2018, 57, 333–347. [Google Scholar] [CrossRef]
- Avrami, M. Kinetics of phase change. I General theory. J. Chem. Phys. 1939, 7, 1103–1112. [Google Scholar] [CrossRef]
- Wang, Y.; Rodriguez-Perez, M.A.; Reis, R.L.; Mano, J.F. Thermal and thermomechanical behaviour of polycaprolactone and starch/polycaprolactone blends for biomedical applications. Macromol. Mater. Eng. 2005, 290, 792–801. [Google Scholar] [CrossRef]
- Huang, H.; Gu, L.; Ozaki, Y. Non-isothermal crystallization and thermal transitions of a biodegradable, partially hydrolyzed poly (vinyl alcohol). Polymer 2006, 47, 3935–3945. [Google Scholar] [CrossRef]
- Kalkar, A.; Deshpande, A. Kinetics of isothermal and non-isothermal crystallization of poly (butylene terephthalate)/liquid crystalline polymer blends. Polym. Eng. Sci. 2001, 41, 1597–1615. [Google Scholar] [CrossRef]
- Kissinger, H.E. Variation of peak temperature with heating rate in differential thermal analysis. J. Res. Natl. Bur. Stand. 1956, 57, 217–221. [Google Scholar] [CrossRef]
- Amin, A.; Sarkar, R.; Moorefield, C.N.; Newkome, G.R. Preparation of different dendritic-layered silicate nanocomposites. Polym. Eng. Sci. 2013, 53, 2166–2174. [Google Scholar] [CrossRef]
- Yang, Z.; Peng, H.; Wang, W.; Liu, T. Crystallization behavior of poly (ε-caprolactone)/layered double hydroxide nanocomposites. J. Appl. Polym. Sci. 2010, 116, 2658–2667. [Google Scholar] [CrossRef]


| Sample | E-VAL:PCL (wt%) | E-VAL (g) | PCL (g) |
|---|---|---|---|
| E-VAL | 100:0 | 10.0 | 0 |
| E-VAL/PCL90 | 90:10 | 9.0 | 1.0 |
| E-VAL/PCL75 | 75:25 | 7.5 | 2.5 |
| E-VAL/PCL50 | 50:50 | 5.0 | 5.0 |
| E-VAL/PCL25 | 25:75 | 2.5 | 7.5 |
| E-VAL/PCL10 | 10:90 | 1.0 | 9.0 |
| PCL | 0:100 | 0 | 10 |
| Blend System | PCL | E-VAL | |||
|---|---|---|---|---|---|
| Tg (oC) | Tmap (oC) | ∆Hm (J∙g−1) | Tmap (oC) | ∆Hm (J∙g−1) | |
| E-VAL | 60 | - | - | 183 | 73.70 |
| E-VAL/PCL90 | 39 | 52 | 8.34 | 180 | 47.83 |
| E-VAL/PCL75 | 17 | 56 | 14.18 | 178 | 31.32 |
| E-VAL/PCL50 | −12 | 67 | 45.46 | 177 | 27.02 |
| E-VAL/PCL25 | −33 | 65 | 69.19 | 175 | 24.57 |
| E-VAL/PCL10 | −53 | 64 | 73.12 | 167 | 19.65 |
| PCL | −59 | 62 | 75.1 | - | - |
| System | Tc (oC) | η | |||
|---|---|---|---|---|---|
| E-VAL | 1.0 | 100 | 186 | 157 | 0.24 |
| E-VAL/PCL90 | 0.895 | 80.10 | 183 | 154 | 0.17 |
| E-VAL/PCL75 | 0.740 | 54.76 | 181 | 152 | 0.14 |
| E-VAL/PCL50 | 0.487 | 23.72 | 176 | 150 | 0.14 |
| E-VAL/PCL25 | 0.210 | 4.41 | 175 | 148 | 0.11 |
| E-VAL/PCL10 | 0.095 | 0.90 | 173 | 145 | 0.11 |
| System E-VAL/PCL | PE-VAL | PCL | ||||
|---|---|---|---|---|---|---|
| Tc (oC) | ∆Hc (J/g) | Xc (%) | Tc (oC) | ∆Hc (J/g) | Xc (%) | |
| E-VAL | 157 | −54.18 | 48.20 | - | - | - |
| E-VAL/PCL90 | 148 | −52.11 | 42.56 | 18 | −5.76 | 5.22 |
| E-VAL/PCL75 | 152 | −26.32 | 34.22 | 23 | −10.08 | 9.65 |
| E-VAL/PCL50 | 152 | −23.09 | 28.34 | 22 | −17.27 | 15.02 |
| E-VAL/PCL25 | 154 | −12.50 | 23.08 | 24 | −25.91 | 22.10 |
| E-VAL/PCL10 | 154 | −10.21 | 15.21 | 25 | −39.59 | 33.50 |
| PCL | - | - | - | 26 | −65.54 | 52.30 |
| No | Experimental Mass | Calculated Mass | Formula |
|---|---|---|---|
| 1 | 195.12201 | 195.12183 | C8H18O5 |
| 2 | 223.09488 | 223.09703 | C12H15O4 |
| 3 | 235.20339 | 235.20619 | C16H27O |
| 4 | 256.17643 | 256.17869 | C13H24N2O3 |
| 5 | 344.23557 | 344.23112 | C17H32N2O5 |
| 6 | 388.25476 | 388.25734 | C19H36N2O6 |
| No | Experimental Mass | Calculated Mass | Formula |
|---|---|---|---|
| 1 | 129.08866 | 129.09155 | C7H12O2 |
| 2 | 143.10588 | 143.10720 | C8H14O2 |
| 3 | 198.16233 | 198.16198 | C12H21O2 |
| 4 | 223.09488 | 223.09703 | C12H15O4 |
| 5 | 235.20927 | 235.20619 | C16H27O |
| 6 | 285.20753 | 285.20658 | C16H29O4 |
| 7 | 341.23820 | 341.23280 | C19H33O5 |
| No | Experimental Mass | Calculated Mass | Formula |
|---|---|---|---|
| 1 | 115.07872 | 115.07590 | C6H11O2 (monomer) |
| 2 | 151.09929 | 151.09971 | C9H13NO |
| 3 | 195.12345 | 195.12325 | C8H19O5 |
| 4 | 212.15016 | 212.14979 | C7H16N8 |
| 5 | 239.14970 | 239.14946 | C10H23O6 |
| 6 | 256.17762 | 256.17735 | C11H22N5O2 |
| 7 | 283.17585 | 283.17568 | C12H27O7 |
| 8 | 299.18481 | 299.18585 | C16H27O5 |
| 9 | 327.20244 | 327.20189 | C14H31O8 |
| 10 | 343.21010 | 343.21206 | C18H31O6 |
| Samples | β (oC.min−1) | Tc (oC) | t1/2 (min) | ||
|---|---|---|---|---|---|
| PCL | E-VAL | PCL | E-VAL | ||
| PCL | 5 | 21 | - | 1.8 | - |
| 10 | 19 | - | 0.8 | - | |
| 15 | 16 | - | 0.7 | - | |
| 20 | 10 | - | 0.6 | - | |
| E-VAL/PCL10 | 5 | 30 | 157 | 1.8 | 2.4 |
| 10 | 27 | 156 | 0.8 | 1.2 | |
| 15 | 26 | 153 | 0.5 | 0.8 | |
| 20 | 25 | 152 | 0.5 | 0.5 | |
| E-VAL/PCL25 | 5 | 30 | 156 | 2.0 | 2.2 |
| 10 | 28 | 154 | 1.0 | 1.1. | |
| 15 | 26 | 152 | 0.7 | 1.0 | |
| 20 | 25 | 151 | 0.6 | 0.8 | |
| E-VAL/PCL50 | 5 | 30 | 154 | 2.2 | 1.7 |
| 10 | 28 | 155 | 1.2 | 0.9 | |
| 15 | 27 | 153 | 0.8 | 0.7 | |
| 20 | 25 | 152 | 0.5 | 0.6 | |
| E-VAL/PCL75 | 5 | 19 | 157 | 1.2 | 2.6 |
| 10 | 16 | 154 | 0.8 | 1.9 | |
| 15 | 13 | 152 | 0.6 | 1.4 | |
| 20 | 11 | 150 | 0.5 | 1.2 | |
| E-VAL/PCL90 | 5 | 161 | 1.0 | 1.6 | |
| 10 | 159 | 0.7 | 1.3 | ||
| 15 | 158 | 0.6 | 1.1 | ||
| 20 | 157 | 0.5 | 0.8 | ||
| E-VAL | 5 | - | 155 | - | 1.0 |
| 10 | - | 152 | - | 0.9 | |
| 15 | - | 150 | - | 1.0 | |
| 20 | - | 148 | - | 0.5 | |
| Sample | Tc (oC) | m | kT | |||
|---|---|---|---|---|---|---|
| PCL | E-VAL | PCL | E-VAL | PCL | E-VAL | |
| PCL | 14 | - | 1.73 | - | 3.7 × 10⁻³ | - |
| 15 | - | 1.60 | - | 4.4 × 10⁻³ | - | |
| 17 | - | 1.87 | - | 7.4 × 10⁻³ | - | |
| 19 | - | 2.67 | - | 1.9 × 10⁻³ | - | |
| E-VAL/PCL10 | 16 | 145 | 1.45 | 0.72 | 1.5 × 10⁻³ | 18.91 |
| 18 | 150 | 1.46 | 0.74 | 1.4 × 10⁻³ | 13.46 | |
| 20 | 155 | 1.72 | 0.75 | 1.1 × 10⁻³ | 10.17 | |
| 22 | 160 | 2.39 | 0.82 | 1.0 × 10⁻³ | 5.99 | |
| E-VAL/PCL25 | 19 | 146 | 1.17 | 0.96 | 7.1 × 10⁻² | 9.47 |
| 21 | 151 | 1.32 | 1.21 | 1.1 × 10⁻² | 6.56 | |
| 23 | 155 | 1.53 | 1.26 | 1.9 × 10⁻³ | 4.64 | |
| 25 | 158 | 2.10 | 1.31 | 6.6 × 10⁻⁴ | 3.05 | |
| E-VAL/PCL50 | 25 | 147 | 0.60 | 1.21 | 1.4 × 10⁻¹ | 0.17 |
| 27 | 153 | 1.0 | 1.23 | 2.0 × 10⁻² | 0.14 | |
| 28 | 155 | 1.2 | 1.62 | 2.7 × 10⁻³ | 0.04 | |
| 31 | 157 | 1.5 | 1.80 | 2,8 × 10⁻⁴ | 0.06 | |
| E-VAL/PCL75 | 23 | 155 | 0.54 | 0.87 | 4.6 × 10⁻² | 0.37 |
| 25 | 157 | 0.83 | 1.10 | 7.1 × 10⁻³ | 0.19 | |
| 27 | 160 | 0.94 | 1.20 | 3.4 × 10⁻³ | 0.10 | |
| 30 | 162 | 1.21 | 1.52 | 3.2 × 10⁻³ | 0.04 | |
| E-VAL | - | 148 | - | 1.97 | - | 1.8 × 10⁻² |
| - | 150 | - | 2.12 | - | 94.63 | |
| - | 152 | - | 2.21 | - | 86.48 | |
| - | 155 | - | 2.33 | - | 84.77 | |
| Sample | Ea (kJ.mol−1) | |
|---|---|---|
| PCL | E-VAL | |
| PCL | −120.0 | - |
| E-VAL/PCL10 | −241.1 | −295.2 |
| E-VAL/PCL25 | −262.7 | −275.2 |
| E-VAL/PCL50 | −291.0 | −266.2 |
| E-VAL/PCL75 | −144.7 | −206.4 |
| E-VAL/PCL90 | −132.3 | −194.2 |
| E-VAL | - | −180.8 |
Publisher’s Note: MDPI stays neutral with regard to jurisdictional claims in published maps and institutional affiliations. |
© 2021 by the authors. Licensee MDPI, Basel, Switzerland. This article is an open access article distributed under the terms and conditions of the Creative Commons Attribution (CC BY) license (http://creativecommons.org/licenses/by/4.0/).
Share and Cite
Alghamdi, A.A.; Alattas, H.; Saeed, W.S.; Al-Odayni, A.-B.; Ahmed, A.Y.B.H.; Al-Owais, A.A.; Aouak, T. Thermal Properties, Isothermal Decomposition by Direct Analysis in Real-Time-of-Flight Mass Spectrometry and Non Isothermal Crystallization Kinetics of Poly(Ethylene-co-Vinyl Alcohol)/Poly(ε-Caprolactone) Blend. Crystals 2021, 11, 292. https://doi.org/10.3390/cryst11030292
Alghamdi AA, Alattas H, Saeed WS, Al-Odayni A-B, Ahmed AYBH, Al-Owais AA, Aouak T. Thermal Properties, Isothermal Decomposition by Direct Analysis in Real-Time-of-Flight Mass Spectrometry and Non Isothermal Crystallization Kinetics of Poly(Ethylene-co-Vinyl Alcohol)/Poly(ε-Caprolactone) Blend. Crystals. 2021; 11(3):292. https://doi.org/10.3390/cryst11030292
Chicago/Turabian StyleAlghamdi, Abdulaziz Ali, Hussain Alattas, Waseem Sharaf Saeed, Abdel-Basit Al-Odayni, Ahmed Yacine Badjah Hadj Ahmed, Ahmad Abdulaziz Al-Owais, and Taieb Aouak. 2021. "Thermal Properties, Isothermal Decomposition by Direct Analysis in Real-Time-of-Flight Mass Spectrometry and Non Isothermal Crystallization Kinetics of Poly(Ethylene-co-Vinyl Alcohol)/Poly(ε-Caprolactone) Blend" Crystals 11, no. 3: 292. https://doi.org/10.3390/cryst11030292
APA StyleAlghamdi, A. A., Alattas, H., Saeed, W. S., Al-Odayni, A.-B., Ahmed, A. Y. B. H., Al-Owais, A. A., & Aouak, T. (2021). Thermal Properties, Isothermal Decomposition by Direct Analysis in Real-Time-of-Flight Mass Spectrometry and Non Isothermal Crystallization Kinetics of Poly(Ethylene-co-Vinyl Alcohol)/Poly(ε-Caprolactone) Blend. Crystals, 11(3), 292. https://doi.org/10.3390/cryst11030292