Abstract
Metal-ligand complexes have attracted major interest due to their potential medical applications as anticancer agents. The work described in the current article aimed to synthesize, spectroscopic, thermal, and biological studies of some metal-diimine complexes. A diimine ligand, namely 2-{[2-(4-chlorophenyl)-2-hydroxyvinyl]-hydrazonomethyl}phenol (diim) was prepared via the reaction of p-chlorophenacyl bromide with hydrazine hydrate in ethanol, then condensation was completed with 2-hydroxybenzaldehyde in acetic acid. The Co(II), Ni(II), Cu(II), and Zn(II) complexes were prepared with a metal:ligand stoichiometric ratio of (2:1). 1H-NMR, UV-Vis, FTIR spectroscopic data, molar conductivity measurements, and microanalytical data (carbon, hydrogen, nitrogen, and halogen) were used for characterization of the formed ligand and its metal complexes. It was found that the diimine ligand act as tetradentate fashion. The non-electrolytic character for all the complexes was proved by molar conductivity. The first metal atom of the synthesized binuclear diimine complexes coordinates with the nitrogen of hydrazine group and oxygen of OH group. While, the second metal atom coordinates with the other nitrogen atom of the hydrazine group and oxygen of phenolic group. All the synthesized metal complexes have a six-coordinated except for Zn(II) has four-coordinated. Thermogravimetric analysis and its differential analysis were done to discuss the thermal degradation of the free ligand and its metal complexes. Molecular docking calculation showed that the diimine ligand is a good inhibitor for breast cancer 3hb5 and 4o1v kidney cancer proteins. Additionally, these compounds were evaluated as antibacterial and antifungal agents.
1. Introduction
Hydrazone compounds include a C=N bond, in which the nitrogen atom has lone pair of electrons (Scheme 1). It can be concluded that nitrogen atoms have nucleophilic character (Figure 1) [1]. These compounds are relevant to ketones and aldehydes as they have a R1R2C=NNH2 structure [2,3,4,5]. According to a literature survey, hydrazones and their derivatives have various pharmacological and biological activities [6,7], as well as significant utility for synthesizing heterocyclic compounds [8]. Hydrazones can be classified in two ways: (a) as monohydrazones, dihydrazones and trihydrazone according to the number of hydrazone groups (Figure 2) or (b) as bi-, tri-, tetra-, penta-, hexa-, and octa-dentate according to the number of functional groups that can participate in complexation reactions [9]. The metal complexation between hydrazones and different metal ions is dependent on the nature of the metal ion, the basicity of the medium during the reaction, the anion of the salt, and the bonding position of hydrazone compounds [9]. It can be concluded that hydrazones can react as ketones (Scheme 2 path a) or enols (Scheme 2 path b) [10]. The capability of Schiff base ligands to act as chelates and their ability to coordinate with various metal ions through the nitrogen of the imine group and the oxygen of the carbonyl group has made them critical reagents in the coordination chemistry area [11]. These transition metal Schiff base complexes display diverse structural features and, in some instances, exhibit interesting antifungal, antibacterial, catalytic, and luminescence properties [12,13,14]. The existence of various binding positions in Schiff base ligands makes them good chelators that enhance the luminescence behavior for their formed complexes, especially the binuclear ones [15,16]. Until now, to the best of our knowledge no work on the condensation process of 2-hydroxybenzaldehyde and 1-(4-chlorophenyl)-2-hydrazinoethanol has been reported. Therefore, our study described in this article aimed to synthesize, spectroscopically characterize, and perform structural, thermogravimetric, and antimicrobial studies of a few binuclear complexes of Co(II), Ni(II), Cu(II), and Zn(II) with the tetradentate Schiff base ligand 2-{[2-(4-chlorophenyl)-2-hydroxyvinyl]-hydrazonomethyl}-phenol.
Scheme 1.
General formation and formula of hydrazines.
Figure 1.
The structural and functional diversity of the hrdrazone group.
Figure 2.
Structure representation of mono-(a), di-(b) and tri-(c) hydrazone ligands.
Scheme 2.
The bonding of hydrazone ligands with transition metals (a) enolic, (b) ketonic.
2. Experimental
2.1. Materials and Instruments
Chemicals were previously checked to verify their purity and analytical grade. A 4010 conductivity meter (Jenway, Staffordshire, UK) was used to measure the conductance of complex solutions (10−3 mol/cm3 in DMF). The percentage of metal in the synthesized metal complexes was determined using the gravimetric method by oxidizing it to the most stable form. A Sherwood Scientific (Cambridge, UK) balance was used in magnetic measurements. A Bruker FT-IR spectrophotometer (BRUKER, Billerica, Massachusetts, USA) was used to record infrared spectra at the range of (4000–400 cm−1). Electronic spectra were recoded using a Unicam UV2UV/Vis spectrophotometer (Thermo Fisher, Waltham, Massachusetts, USA), 1H-NMR spectra were recorded using a 300 MHz Mercury VX-300 NMR spectrometer (Varian, Crawley, UK), and thermal studies were carried out using a TG/DTG–50H thermo-gravimetric analyzer (Shimadzu, Kyoto, Japan) The elemental analyses were perfoemd on a EL III elemental analyzer (Eltra GmbH, Haan, Germany).
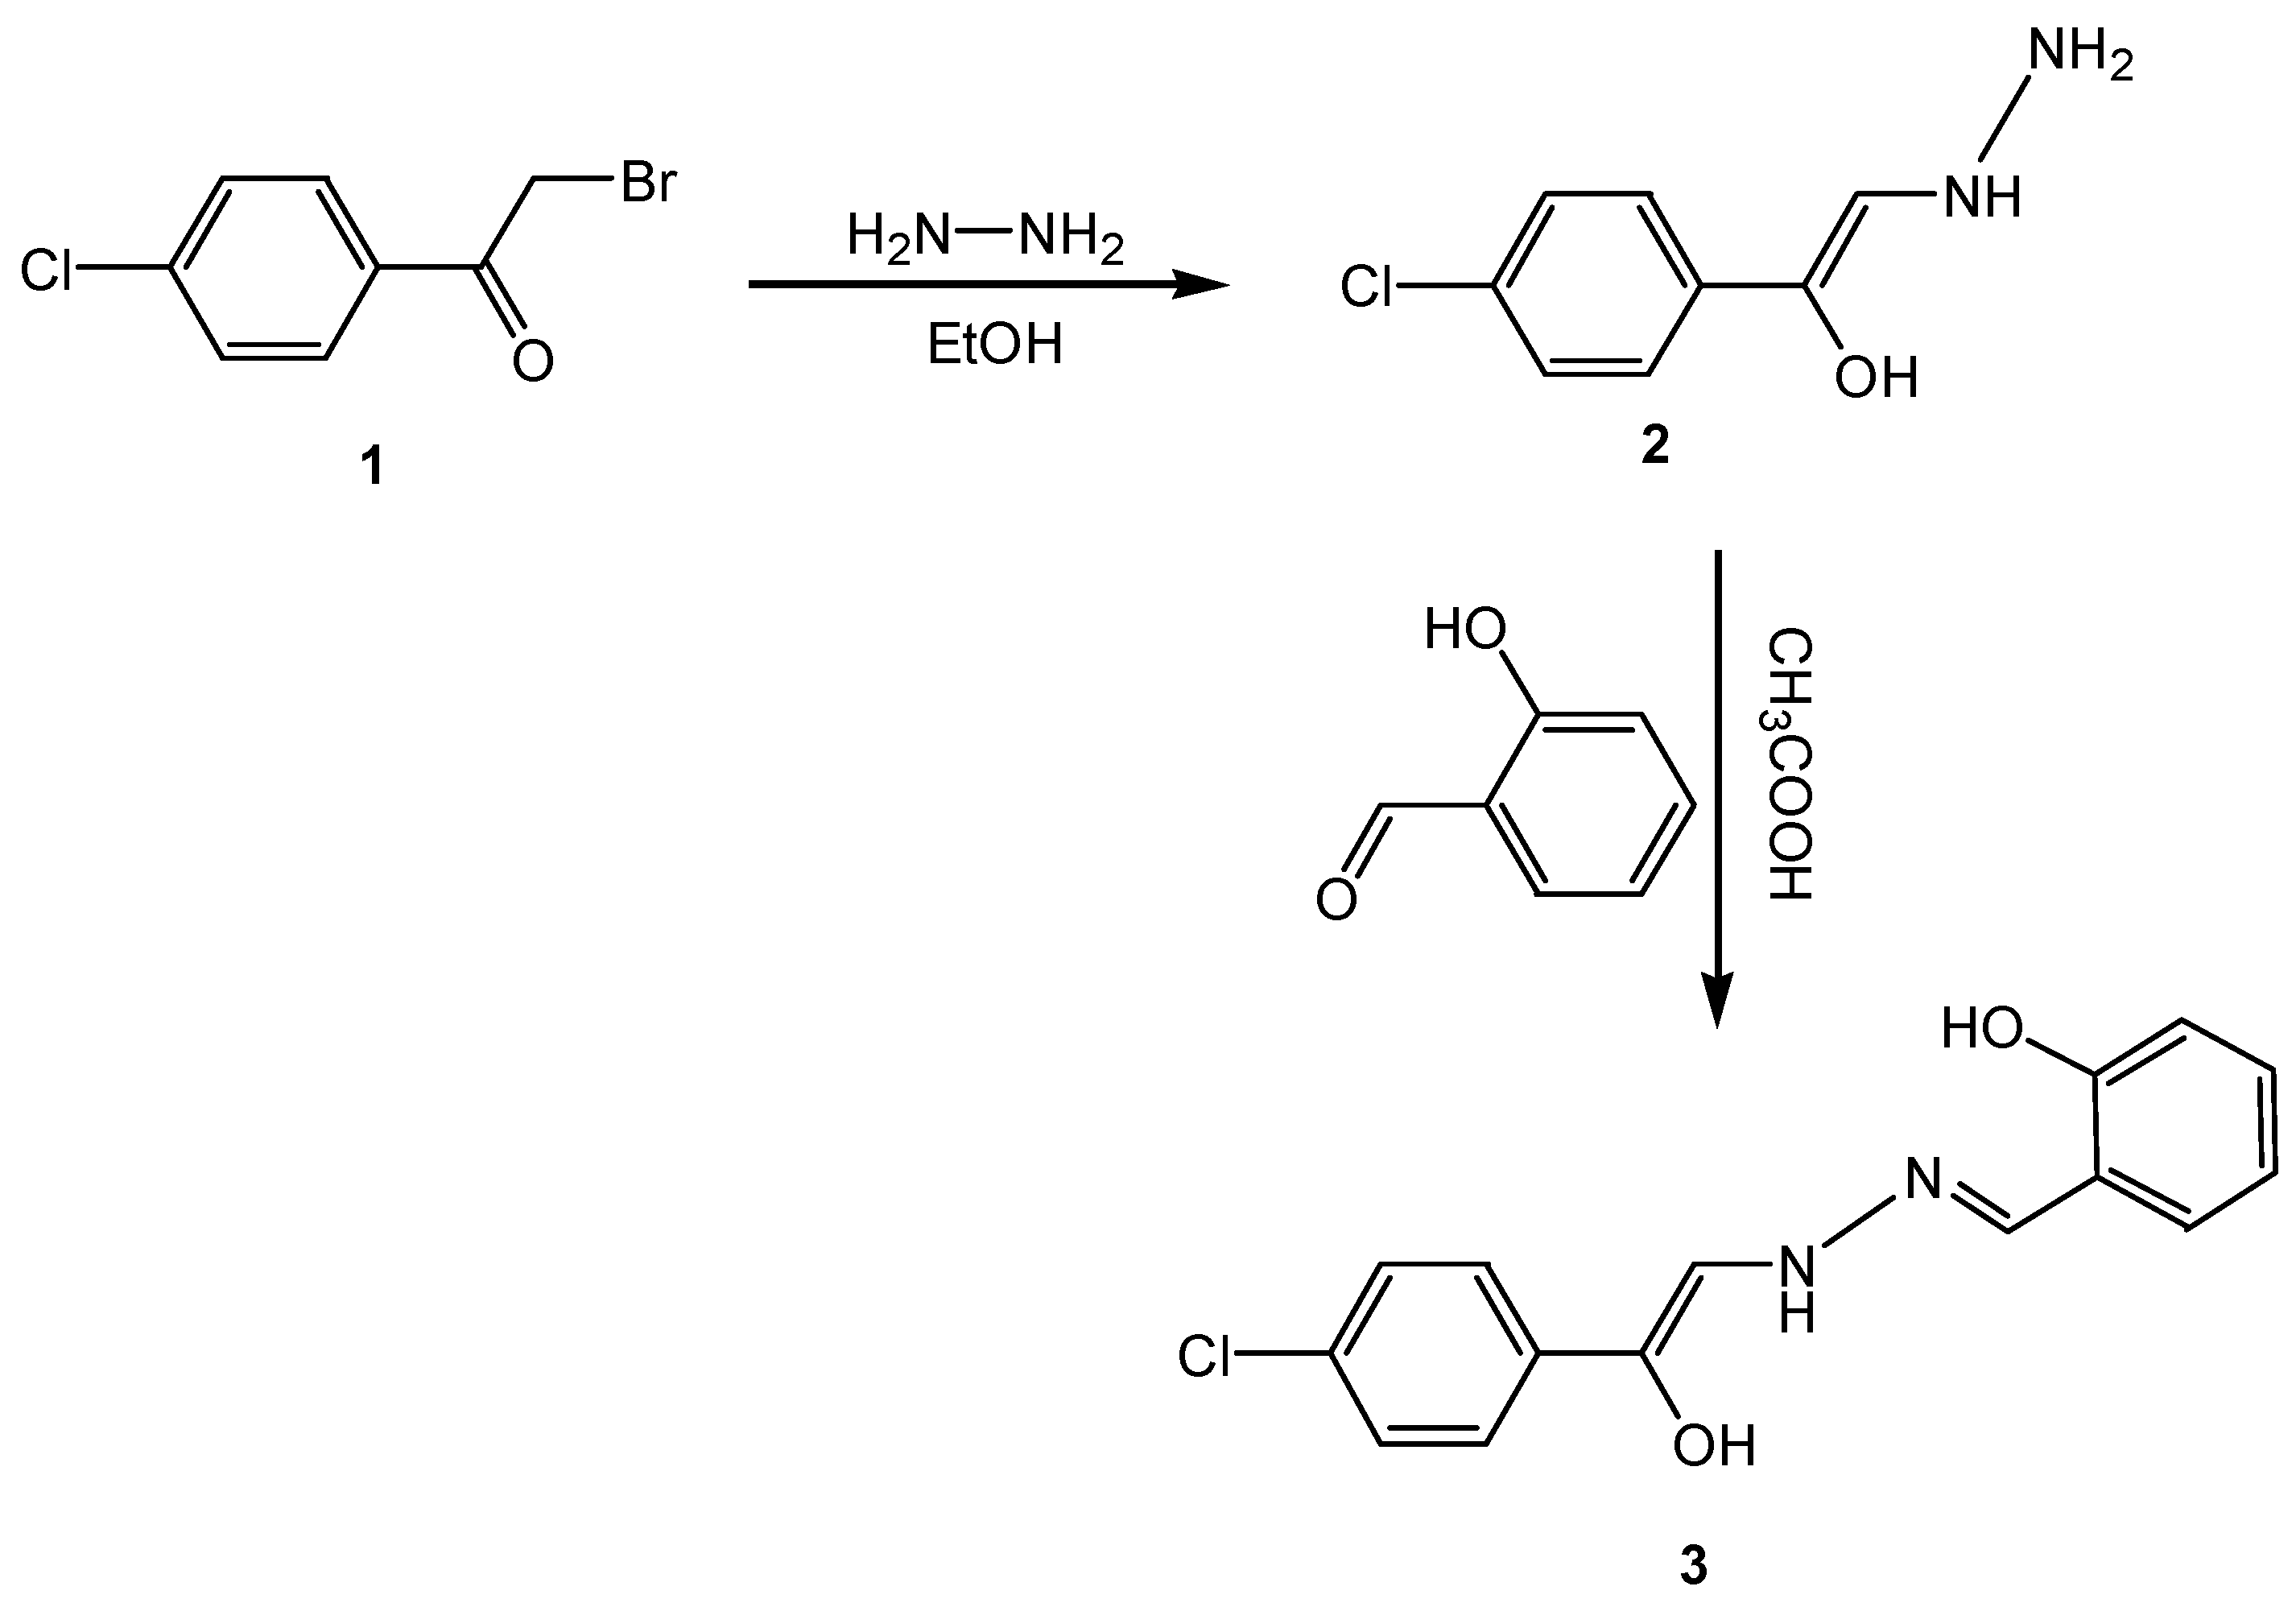
2.2. Synthesis of diim Ligand
The ligand 2-{[2-(4-chlorophenyl)-2-hydroxyvinyl]-hydrazonomethyl}-phenol (3) was synthesized in two steps. The first step, reaction of p-chlorophenacyl bromide (1) with hydrazine hydrate in ethanol gave 1-(4-chlorophenyl)-2-hydrazinoethenol (2). The second step, condensation of hydrazine derivative (2) with 2-hydroxybenzaldehyde in acetic acid under reflux produced the diimine ligand 3 (Scheme 3).
Scheme 3.
Synthesis of diim ligand 3.
1-(4-chlorophenyl)-2-hydrazinoethenol (2)
An equimolar solution of p-chlorophenacyl bromide (0.01 M) and hydrazine hydrate (0.01 M) prepared in 50 mL of ethanol was refluxed for 2 h. After that, the mixture was left to cool down and then neutralized with dilute acetic acid. The resulting compound resulted was filtered off, washed with water then recrystallized from ethanol to provide compound 2. Melting point 98 oC; IR (KBr) cm−1 = 3350–3050 (br–OH), 3320,3117 (NH2), 3230 (NH), 1615, 1605, 1550 (C=C), and 1017 (C–O); 1H-NMR (DMSO-d6) δ: 3.21 (d,2H,NH2), 4.2 (q,1H,NH), 7.28–7.44 (m,2H,Ar–H), 7.31(d,1H,CH) and 14.07 (s,1H,OH) ppm.
2-{[2-(4-chlorophenyl)-2-hydroxyvinyl]-hydrazonomethyl}-phenol (3)
A solution prepared in 30 mL of acetic acid from a mixture of hydrazine derivative 2 (0.01 M) and 2-hydroxybenzaldehyde was heated under reflux for 2 h, then left to cool down and poured into water. The resulting solid was separated and recrystallized from ethanol to give compound 3. M.P = 155 °C; IR (KBr) cm−1 3449 (br–OH), 3046 (NH), 1622 (C=N), 1575, 1486 (C=C), 1390 and 1271 (C–O). 1H-NMR (DMSO-d6) δ: 6.997 (s, 1H, CH=N), 7.38–7.65 (m, 8H, 2Ar–H), 9.01 (s, 1H, OH) and 11.16 (s, 1H, NH) ppm. The suggested structural formula for the ligand (diim) was verified by its mass spectrum (Figure 3). The following peaks were recorded (m/z+) 288, 238, 181, 71, and 43 that correspond to [C15H13N2O2Cl]+, [C15H14N2O]+, [C10H16N2O]+, [C3H8N2]+ and [C2H5N]+ ions, respectively, confirming the proposed molecular structure and formula.
Figure 3.
Mass spectrum fragmentation of the diim ligand.
2.3. Synthesis of solid Co(II), Ni(II), Cu(II), and Zn(II) diim Complexes
A hot solution of diim ligand (1 mmol) was prepared in 30 mL of ethanol containing a few drops of concentrated NH4OH. Then 2 mmol solutions of the metal(II) salts CoCl2·6H2O, NiCl2·6H2O, CuCl2·2H2O or ZnCl2 were prepared in 20 mL of ethanol. Each metal solution was added gradually to the former prepared solution. Ammonia solution was used to neutralize the formed mixtures (pH = 8–9), which was then refluxed and well stirred for 2 h at 75 °C, then evaporated to half its initial volume. The resulting complex was left to cool down until the next day, then separated and washed with a mixture of methanol and diethyl ether. Next, recrystallization was done from methanol and the products were dried using anhydrous CaCl2. Thin-layer chromatography (TLC) was done to confirm the purity.
2.4. Antibacterial and Antifungal Activities
The free diim ligand and its metal complexes were dissolved in dimethylsulfoxide (DMSO) to prepare 10 mg/mL solutions, which were used to measure the inhibition zone to determine the antibacterial activity of these compounds. This activity was determined by the agar well diffusion method and the experiments were repeated three times to be sure of the results. Bacillus subtilis and Staphylococcus aureus were used as examples of Gram-positive bacteria, while, E. coli and Proteus vulgaris were used as Gram-negative bacteria. The antifungal activity of the compound was measured against Aspergillus flavus and Candida albicans. The fungal plates were prepared by growing 5 mL of Sabouraud dextrose broth until 105 CFU/mL cells were achieved. A sample of 10 mg/mL was prepared in DMSO, so it was used as standard. Ketoconazole was used as antifungal standard drug.
3. Results and Discussion
3.1. Elemental Analyses and Physical Properties
The complexes of Co(II), Ni(II), Cu(II), and Zn(II) with 2-{[2-(4-chlorophenyl)-2-hydroxyvinyl]-hydrazonomethyl}phenol (diim) did not react with the atmosphere and were only dissolved in DMSO and DMF. The conductivity of the complexes measured using a DMSO solution displayed a lower value than the free diim ligand (7 μS) which means that all the complexes are characteristically non-electrolytic and that the outer sphere of the coordination is free of anions [17]. The physicochemical analyses results of the diim free ligand and its metal complexes were tabulated and formulated as seen in Table 1. The colored solid synthesized complexes have formulas [Co2(diim)(H2O)4(NH3)2(Cl)2] (I), [Ni2(diim)(H2O)2(NH3)4(Cl)2].3H2O (II), [Cu2(diim)(H2O)4(NH3)2(Cl)2] (III), and [Zn2(diim)(NH3)2(Cl)2].2H2O (IV) (Figure 4).
Table 1.
Physicochemical data for the diim free ligand and its metal complexes.
Figure 4.
Proposed structures of 2:1 diim complexes.
3.2. Infrared Spectral Studies
The infrared spectra of the diim free ligand and its diim complexes were recorded (Figure 5a,b). It is noted that there are several distinguishing vibration bands that refer to phenolic (Ar–OH), ketone (C=O), azomethine (C=N), phenolic (C-O), and carbon halogen bond (C-Cl) functional groups at the frequencies 3449, 3046, 1678, 1622, (1390 & 1271), and 971 cm−1, respectively. The essential vibration bands of the diim ligand and its corresponding Co(II), Ni(II), Cu(II), and Zn(II) complexes are summarized in Table 2. The medium-strong peak (1678 cm−1) of the carbonyl group found in the free diim ligand disappeared after complexation. This result can be attributed to the tautomerism change of diim ligand from its keto to its enol form in alkaline media through the chelation process (Scheme 4). In the case of the free diim ligand, the very strong peak at 1622 cm−1 refers to C=N stretching frequency of the group of azomethine [18]. This stretching absorption band is shifted to a lower frequency (1604–1611 cm−1) in its prepared metal complexes. This result suggests the coordination of the azomethine C=N group by a lone pair of electrons on its nitrogen towards the center metal ions. The peak of the phenolic –OH group is shifted to higher frequencies than observed the spectrum of the diim ligand (3449 cm−1). This is because of the hydrogen bond formed among the phenolic oxygen and the nitrogens of azomethine groups (Scheme 4). Regarding the spectra of synthesized complexes I–IV, the broad bands within the 3421–3449 cm−1 range are assigned to the presence of coordinated and uncoordinated water molecules [18]. Average weak absorption peaks found in the range 832–750 cm−1 refer to bending vibrations δ(H2O) emphasizing the existence of coordinated water. The 1390 and 1271 cm−1 peaks found in the diim ligand spectra refer to ν(C–O) stretching vibrations of the phenolic group. In the case of the vibrational spectra of the metal complexes, these bands disappear or are offset to lower frequencies (1311–1319 and 1150–1153 cm−1) because of the participation of the phenolic oxygens in the coordination of metal ions. In the diim complexes, new peaks appeared at ~ 3025 cm−1 that can be referred to the υ(NH) of −NH3 group confirming the participation of the lone pair of the nitrogen in the −NH3 group of the atom in the coordination reactions. In the spectra of the metal complexes, average vibration peaks are found at a range of 600–518 cm−1 and 466–452 cm−1 that can be assigned to the vibrational motions for ν(M−O) and ν(M−N) bands, proving the participation of oxygen and nitrogen atoms of the phenolic, hydroxyl, azomethine, hydrazino groups in coordinating with the metal [18].
Figure 5.
(a) Infrared spectrum of diim free ligand and (b). Infrared spectra of I: Co(II), II: Ni(II), III: Cu(II) and IV: Zn(II) diim complexes.
Table 2.
Data for infrared spectral bands (cm−1) for diim ligand and its metal complexes.
Scheme 4.
Tautomerism exchange of the diim ligand keto-enol form in alkaline media.
3.3. Electronic, Magnetic, and Mass Spectral Studies
At wavelengths within the range of 300–800 nm, the electronic absorption spectra of diim free ligand and its metal complexes were performed in a DMSO solution (Figure 6). The free diim ligand electronic spectra showed two peaks at 300 and 355 nm corresponding to π−π* and n−π* electronic transitions [19,20,21].
Figure 6.
UV-Vis spectra of diim free ligand and its Co(II), Ni(II), Cu(III) and Zn(II) complexes.
The Co(II) complex showed three main bands at 300, 355, and 450 nm in its UV-Vis absorption spectrum. The first absorption peak referred to the intra-ligand transition of the organic moiety. The second and third electronic transitions referred to 4T1g→4T1g(P) and 4T1g (F)→4T2g(F), respectively [20,21]. The octahedral geometry of the Co(II) complex was confirmed from the UV-Vis spectrum and the recorded value of its magnetic moment which is 5.10 B.M [20]. The magnetic moment value at room temperature of the cobalt(II) complex is 5.10 B.M which is lower than 5.39 B.M due to anti-ferromagnetic interaction between two Co ions, which confirmed the binuclear nature of the complex. The molecular ion peak of the Co(II) complex was observed at m/z = 581, confirming the molecular weight. The mass fragmentation spectrum can be seen in Figure S1.
The electronic spectrum of the Ni(II) complex was found to have four electronic transition peaks at 300, 368, 399, and 410 nm. The first and second peak may be assigned to ligand-to-metal charge-transfer transitions, while the next two transition bands refer to d-d transitions of 3A2g (F)→3T1g (P) and 3A2g→3T1g (F), respectively. The value of Ni(II) complex magnetic moment was recorded at 2.74 B.M. From these results, the octahedral geometry was confirmed [20,21]. The low magnetic moment value at 2.74 B.M rather than the expected experimental value (3.32 B.M) was attributed to anti-ferromagnetic interaction between two Ni ions, which confirmed the binuclear nature of the complex. The mass spectrum of the nickel(II) complex shows its molecular ion peak at m/z = 633, which is consistent with the proposed molecular weight (Figure S2).
The electronic UV-spectrum of the Cu(II) complex displayed four electronic peaks at 300, 365, 395, and 425 nm. The first two absorption peaks refer to ligand-to-metal charge-transfer transitions. The second two absorption peaks point to 2Eg→2T2g d–d transitions due to a distorted octahedral geometrical structure of the Cu(II)-complex [20,21]. The Cu(II) complex has a magnetic moment of 1.66 B.M., confirming the deformed octahedral geometry [21]. The magnetic moment value at room temperature of the copper(II) complex is 1.66 B.M, which is lower than 1.96 B.M (ther expected experimental value) due to anti-ferromagnetic interactions between two copper ions, which confirmed the binuclear nature of the complex. The mass spectrum of the copper(II) complex shows a molecular ion peak at m/z = 591, which is consistent with the proposed molecular weight (Figure S3).
The conductivity, microanalytical, and magnetic moment data of the Zn(II) complex spectrum proved its diamagnetic behavior and tetrahedral geometry [20,21]. The molecular ion peak of the Zn(II) complex was observed at m/z = 558, confirming the molecular weight. The mass fragmentation spectrum can be seen in Figure S4.
3.4. 1H-NMR Spectra Studies
1H-NMR spectra for the studied ligand (diim) and its diamagnetic Zn(II) complex were recorded in DMSO. The studied ligand (diim) shows the following chemical shifts: δ: 6.997 (s, 1H, CH=N), 7.38–7.65 (m, 8H, 2Ar–H), 9.01 (s, 1H, OH) and 11.16 (s, 1H, NH) ppm. In the case of Zn(II) complex nearly all the peaks became weaker and were shifted to downfield positions: δ: 3.36 (s, 2H, H2O), and 7.39–7.71 (m, 8H, 2Ar–H) ppm. The HC=N azomethine, −NH, and –OH groups protons disappeared after complexation, confirms the coordination site around the Zn(II) metal ions. A new peak was noticed at 3.36 ppm referring to the protons of water molecules coordinating with the metal ions. The predicted structural formula of the Zn(II) confirming its tetrahedral geometry as shown in Figure 6.
3.5. Thermo Gravimetric Studies
TG and DrTGA thermal decomposition curves of free diim ligand and its metal complexes [Co(II), Ni(II), Cu(II), and Zn(II)] under N2 atmosphere with a rate of heating 10 °C/min were assigned (Figure 7a–e) and are summarized in Table 3.


Figure 7.
TGA-DrTGA curves of (a) diim free ligand, (b) cobalt(II) complex, (c) nickel(II) complex, (d) copper(II) complex and (e) zinc(II) complex.
Table 3.
Thermo gravimetric data of the diim ligand and its metal complexes.
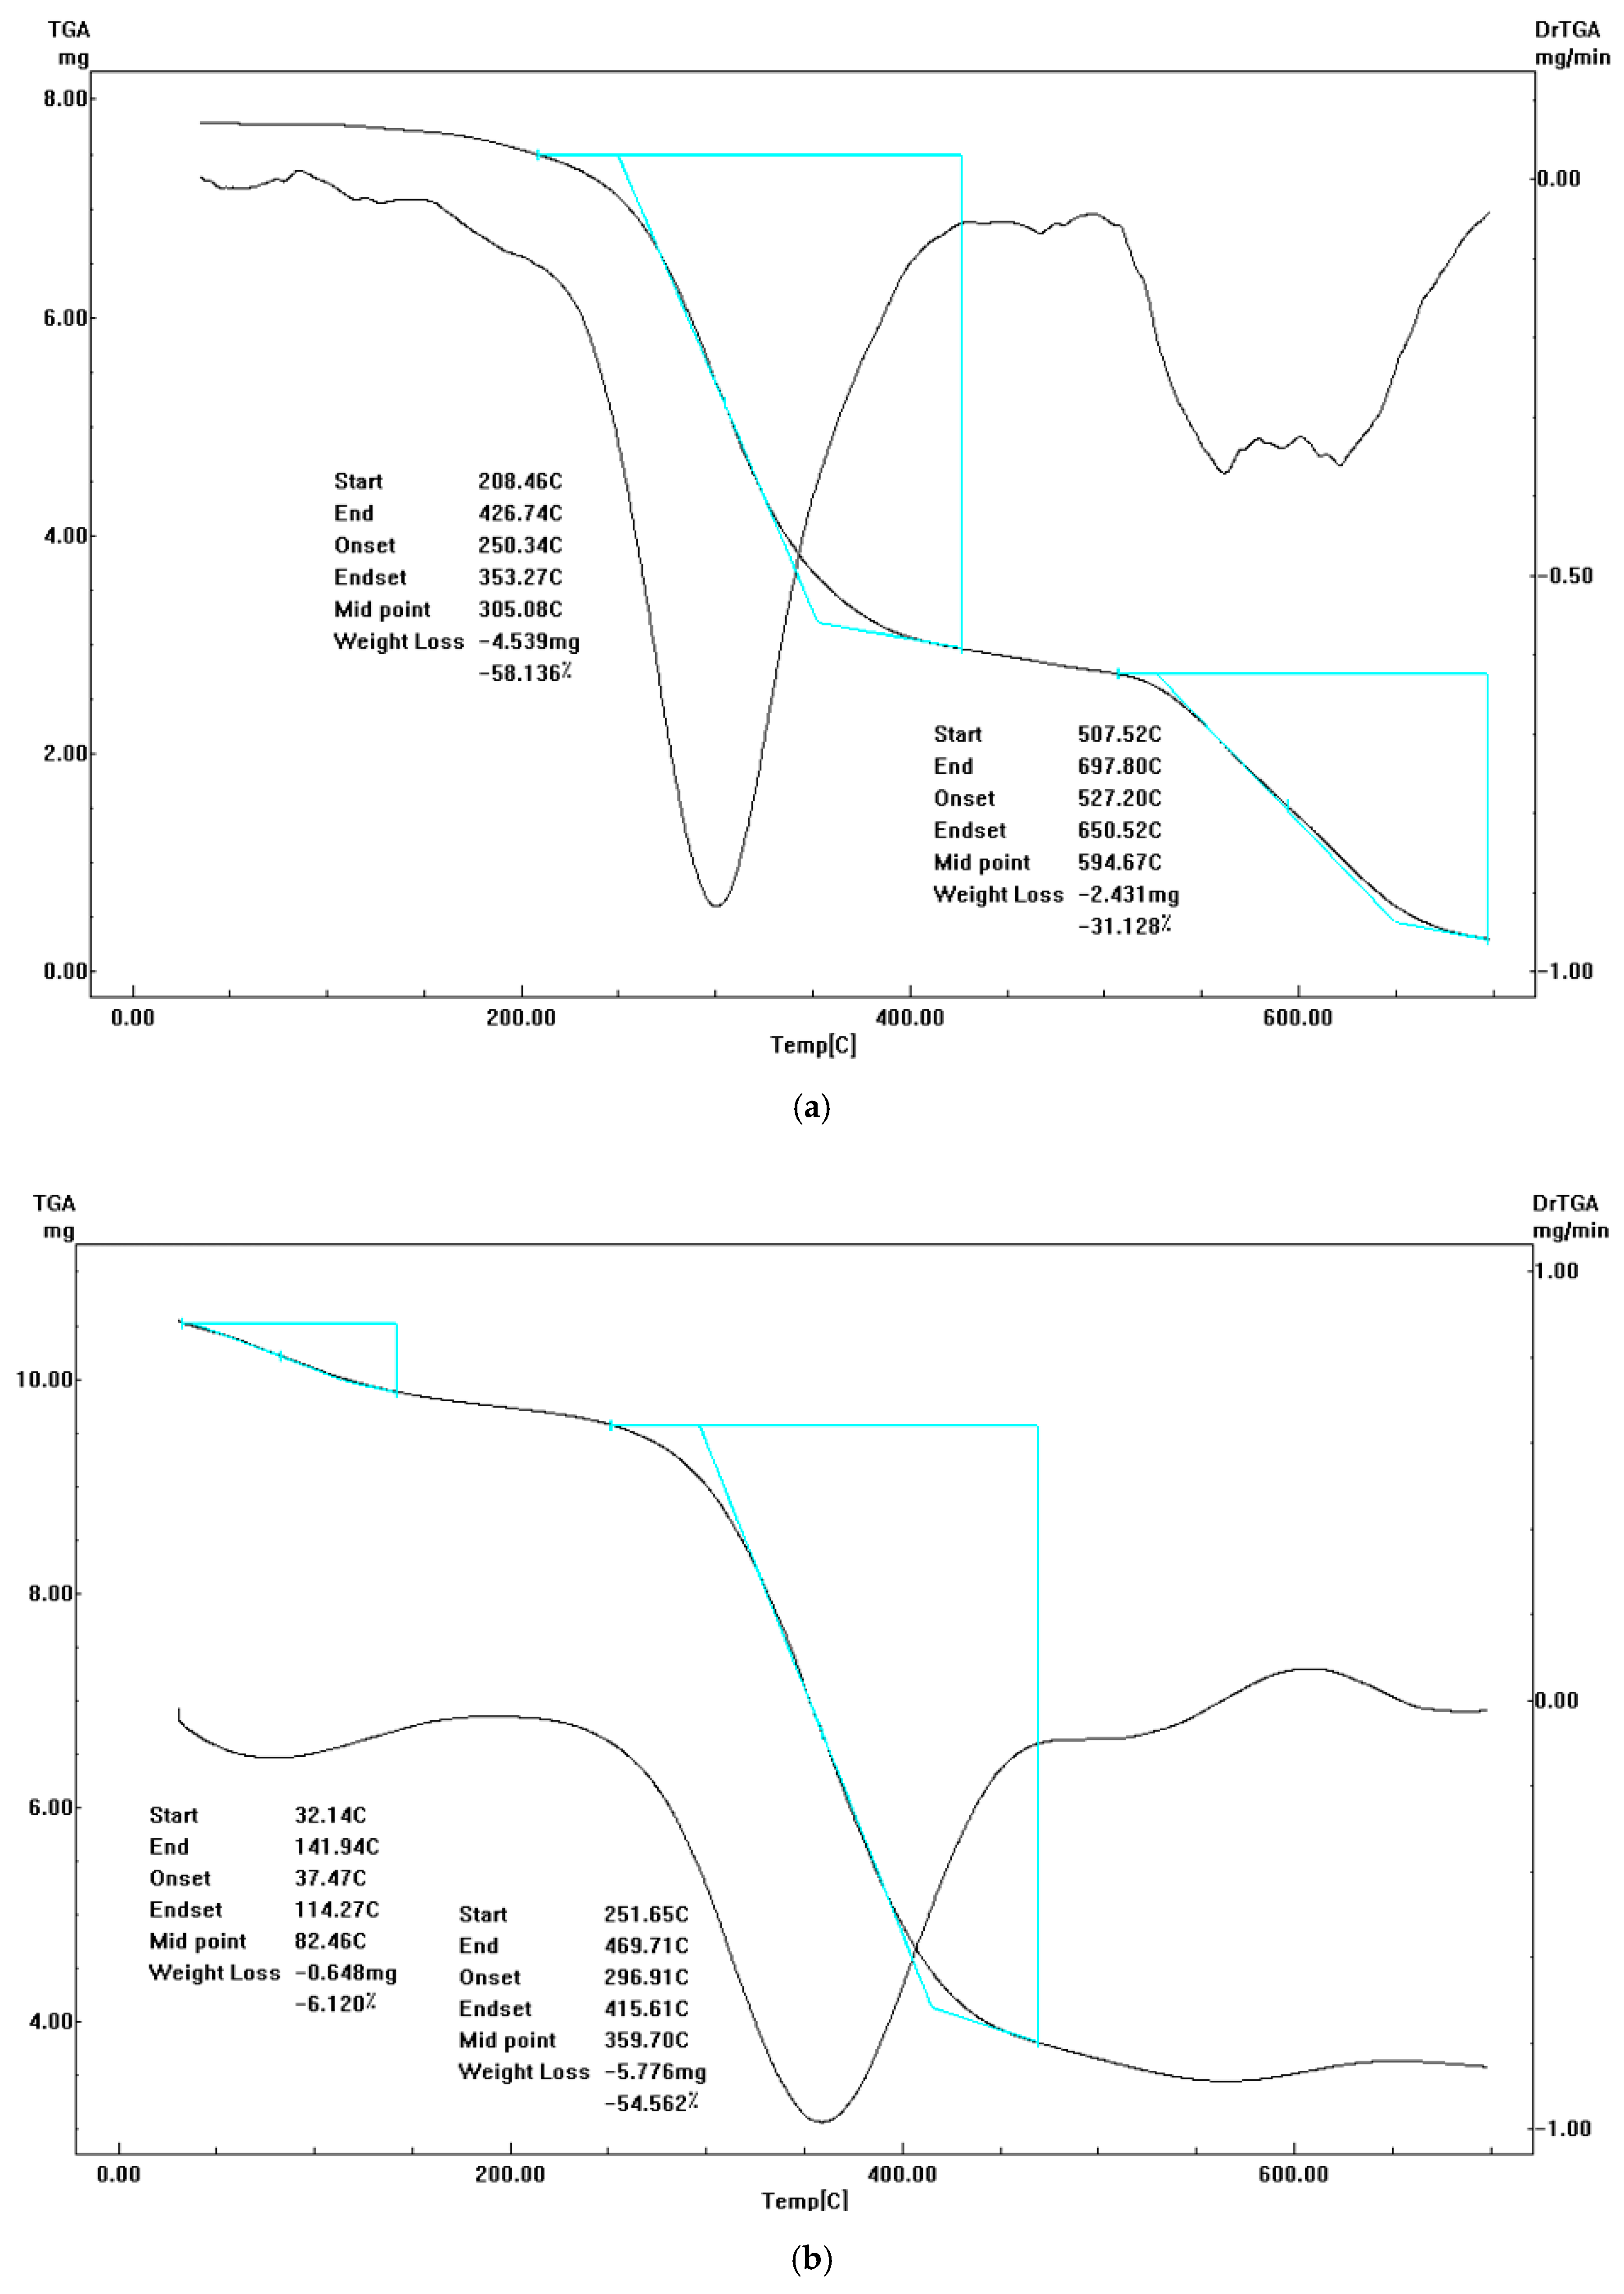
3.5.1. Diim Free Ligand
The melting point of diim ligand was at 155 °C. Next, it undergoes concurrent degradation. It is found that the ligand decomposition takes place in three main degradation steps. The first degradation phase occurs in the 49–220 °C temperature range with an observed weight loss equal to 6.25% (calc.= 5.89%). The second and third degradation phases happen in the 220–425 °C (obs.= 53.75%, calc.= 55.5%) and 425–700 °C temperature range (obs.= 32.5%, calc.= 30.3%), respectively. Remaining residue up to 700 °C was accompanied by a 7.5% loss in weight (calc.= 8.32%). All the thermal fragments in the three stages are organic moieties, which were converted into gaseous phases.
3.5.2. Cobalt(II) Complex I
From the thermal degradation curve of Co(II) complex it was found that it decomposes as follows: The first decomposition phase occurs in the 38–163 °C temperature range with a 6.7% observed mass loss (calc.= 6.2%) attributable to the loss of coordinated H2O. The second degradation phase takes place in the 163–470 °C temperature range with mass a mass loss of 57.1% (observed, calc.= 55.9%) due to chloride, ammonia, nitrogen oxide, and acetylene gas molecule losses, while the third step takes place in the 470–565 °C temperature range with an observed loss in weight of 4.8% (calc.= 5.8%) that refers to 2 ammonia gas molecule losses. The final residue was pure cobalt metal produced from the reduction of cobalt carbonate to cobalt(II) oxide and it remained stable up to 700 °C.
3.5.3. Nickel(II) Complex II
The Ni(II) complex undergoes three main thermal degradation phases. The first step in the decomposition has a mass loss of 7% (calc.= 6.3%) referring to the loss of two uncoordinated water molecules and two hydrogen gas molecules within the 38–168 °C temperature range. The second degradation phase within the 168–449 °C temperature range with a 57.1% observed loss in weight (calc.= 55.9%) points to chloride, ammonia, water, nitrogen oxide, nitrogen gas and hydrogen gas molecule losses. The final step in the decomposition process was a 29.3% mass loss (calc.= 28.8%) corresponding to the loss of seven acetylene gas molecules. 2NiO molecules are the final residue whent eh complex is heated to 700 °C.
3.5.4. Copper(II) Complex III
The thermal degradation of Cu(II) the complex occurs in three decomposition phases with DTGmax = 85 (40–170 °C), 250 (170–349.5 °C) and 530 (349.5–587 °C). The first phase with an observed mass loss of 6% (calc.= 6.1%) correspond to the loss of two water molecules with a temperature maximum DTGmax = 85 °C. The second and third degradation phases with mass losses (obs.= 94%, calc.= 99.9%) suggesting the loss of five water molecules, ammonia gas, chloride, nitrogen, hydrogen, carbon oxide, acetylene, and nitrogen oxide gas molecules occur at the maximum temperatures of 250 and 530 °C. CuO is the final residue.
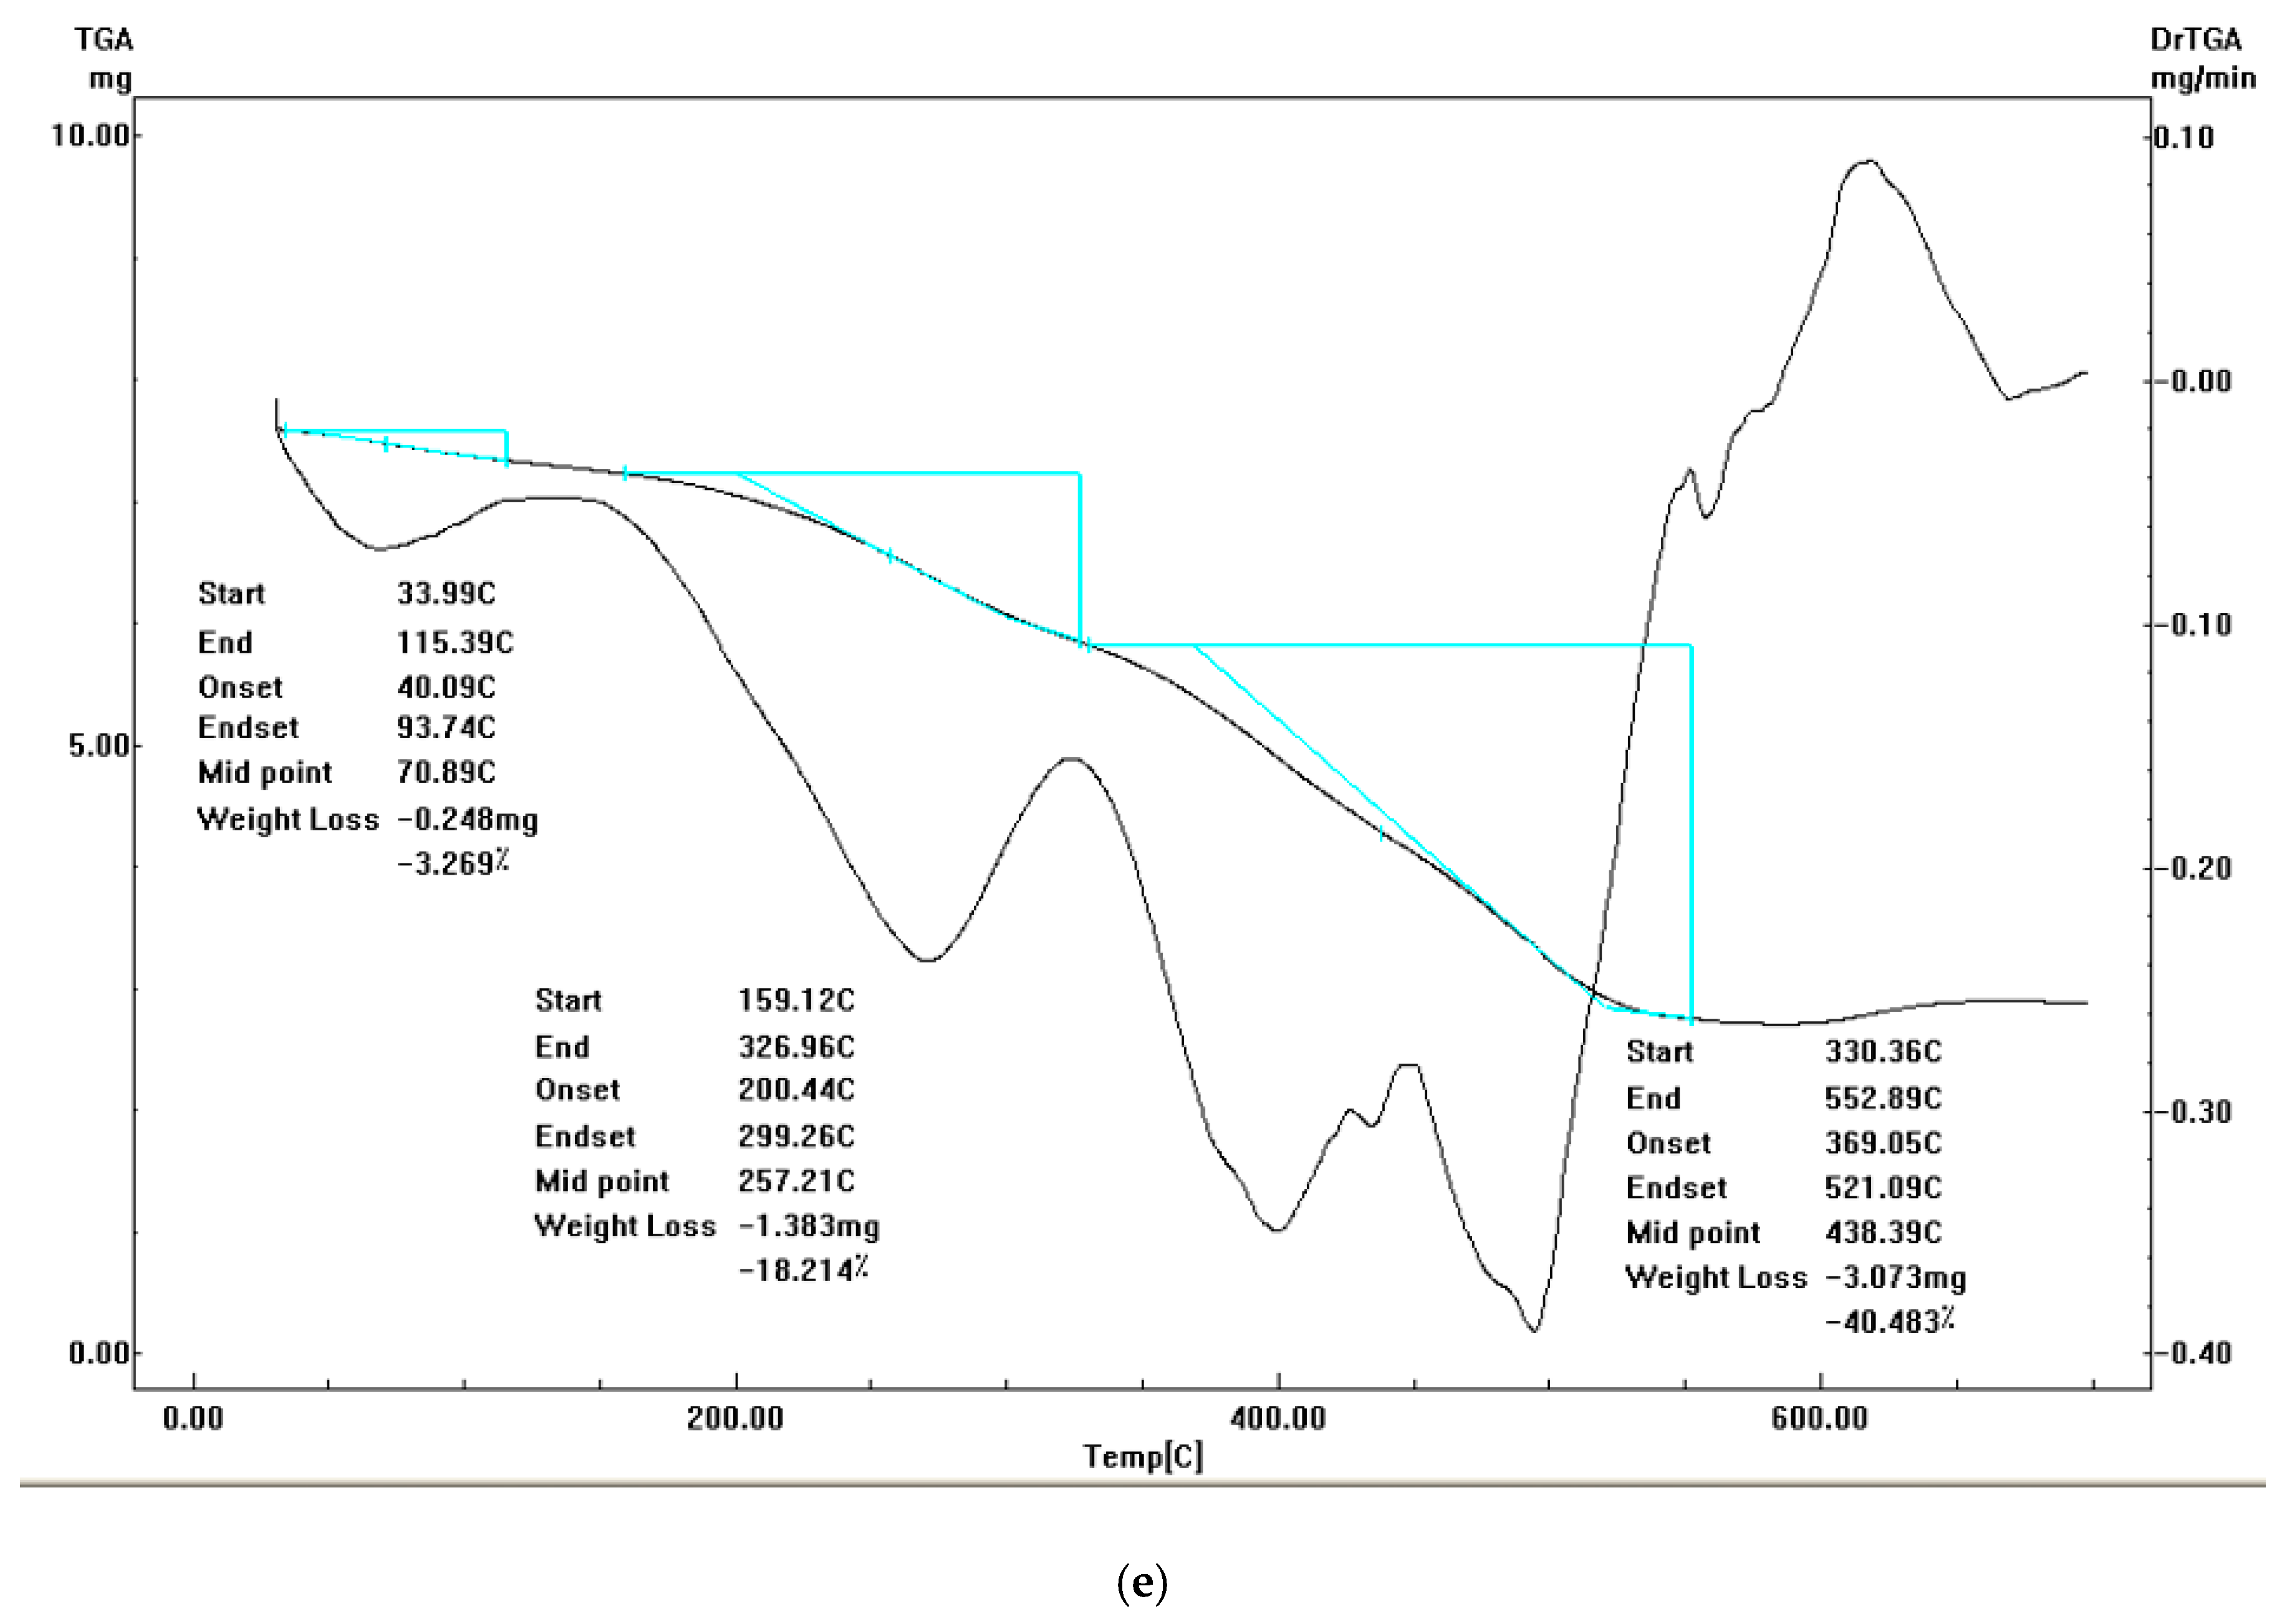
3.5.5. Zinc(II) Complex IV
In the Zn(II) complex, thermal decomposition takes place in three main stages with DTGmax = 62 (39–180 °C), 265 (180–335 °C), 440 (180–335 °C) and 440 (335–552 °C), respectively. The first degradation phase with a 6.7% observed loss in weight (calc.= 6.7%) is due to the loss of nitrogen oxide and hydrogen molecules with a temperature maximum DTGmax = 62 °C. The second thermal decomposition with a 14.7% loss in weight (calc= 14.4%) coincides with the loss of three acetylene molecules in the 180–335 °C temperature range. The final degradation phase with an observed mass loss of 40% (calc.= 41.1%) corresponds to the loss of two acetylene, ammonia, nitrogen, and chlorine gas molecules in the 180–335 °C range. The residual product is 2ZnO up to 700 °C.
3.6. Kinetic Thermodynamic Parameters
From Arrhenius plots between the rate of decomposition (ln K) and 1/T, kinetic values like the activation energy (E*) were computed. The Coats–Redfern and Horowitz–Metzger equations were utilized to calculate other thermodynamic parameters such as the free energy ΔG*, the enthalpy ΔH*, and the entropy ΔS* of the process [22,23]. Since ΔG*, ΔH*, and ΔS* are relevant to the greatest ratios, they are computed by the peak temperature Ts (Table 4). The activated prepared metal complexes were found to be more orderly structured than reactants and this was proved by the negative value of ΔS* [24].
Table 4.
Coats–Redfern (CR) and Horowitz–Metzger (HM) calculations for the MTSC and its metal complexes.
3.7. Biological Assessments
From the data summarized in Table 5, we can conclude that diim metal complexes, especially the Cu(II) and Zn(II) ones, showed a potentially increase in antibacterial effect against B. subtilis, S. aureus, and E. coli compared to the diim ligand. On other hand, there was no antimicrobial effects for the diim ligand or its metal complexes towards the Gram positive bacterium Proteus vulgaris or towards the fungi Aspergillus flavus and Candida albicans.
Table 5.
Biological evaluations for diim ligand and its metal complexes at 10 mg.
In related investigations, almost all metal complexes show increased antibacterial effects compared to Schiff base ligands. These improvements are aacribed to the more prominent lipophilic nature of the complexes, which encourages the infiltration through the lipid layer as described previously [25]. Moreover, several reports mention the promising bacteriostatic and bactericidal effect of Cu(II) and Zn(II) complexes against a wide range of bacteria [26,27].
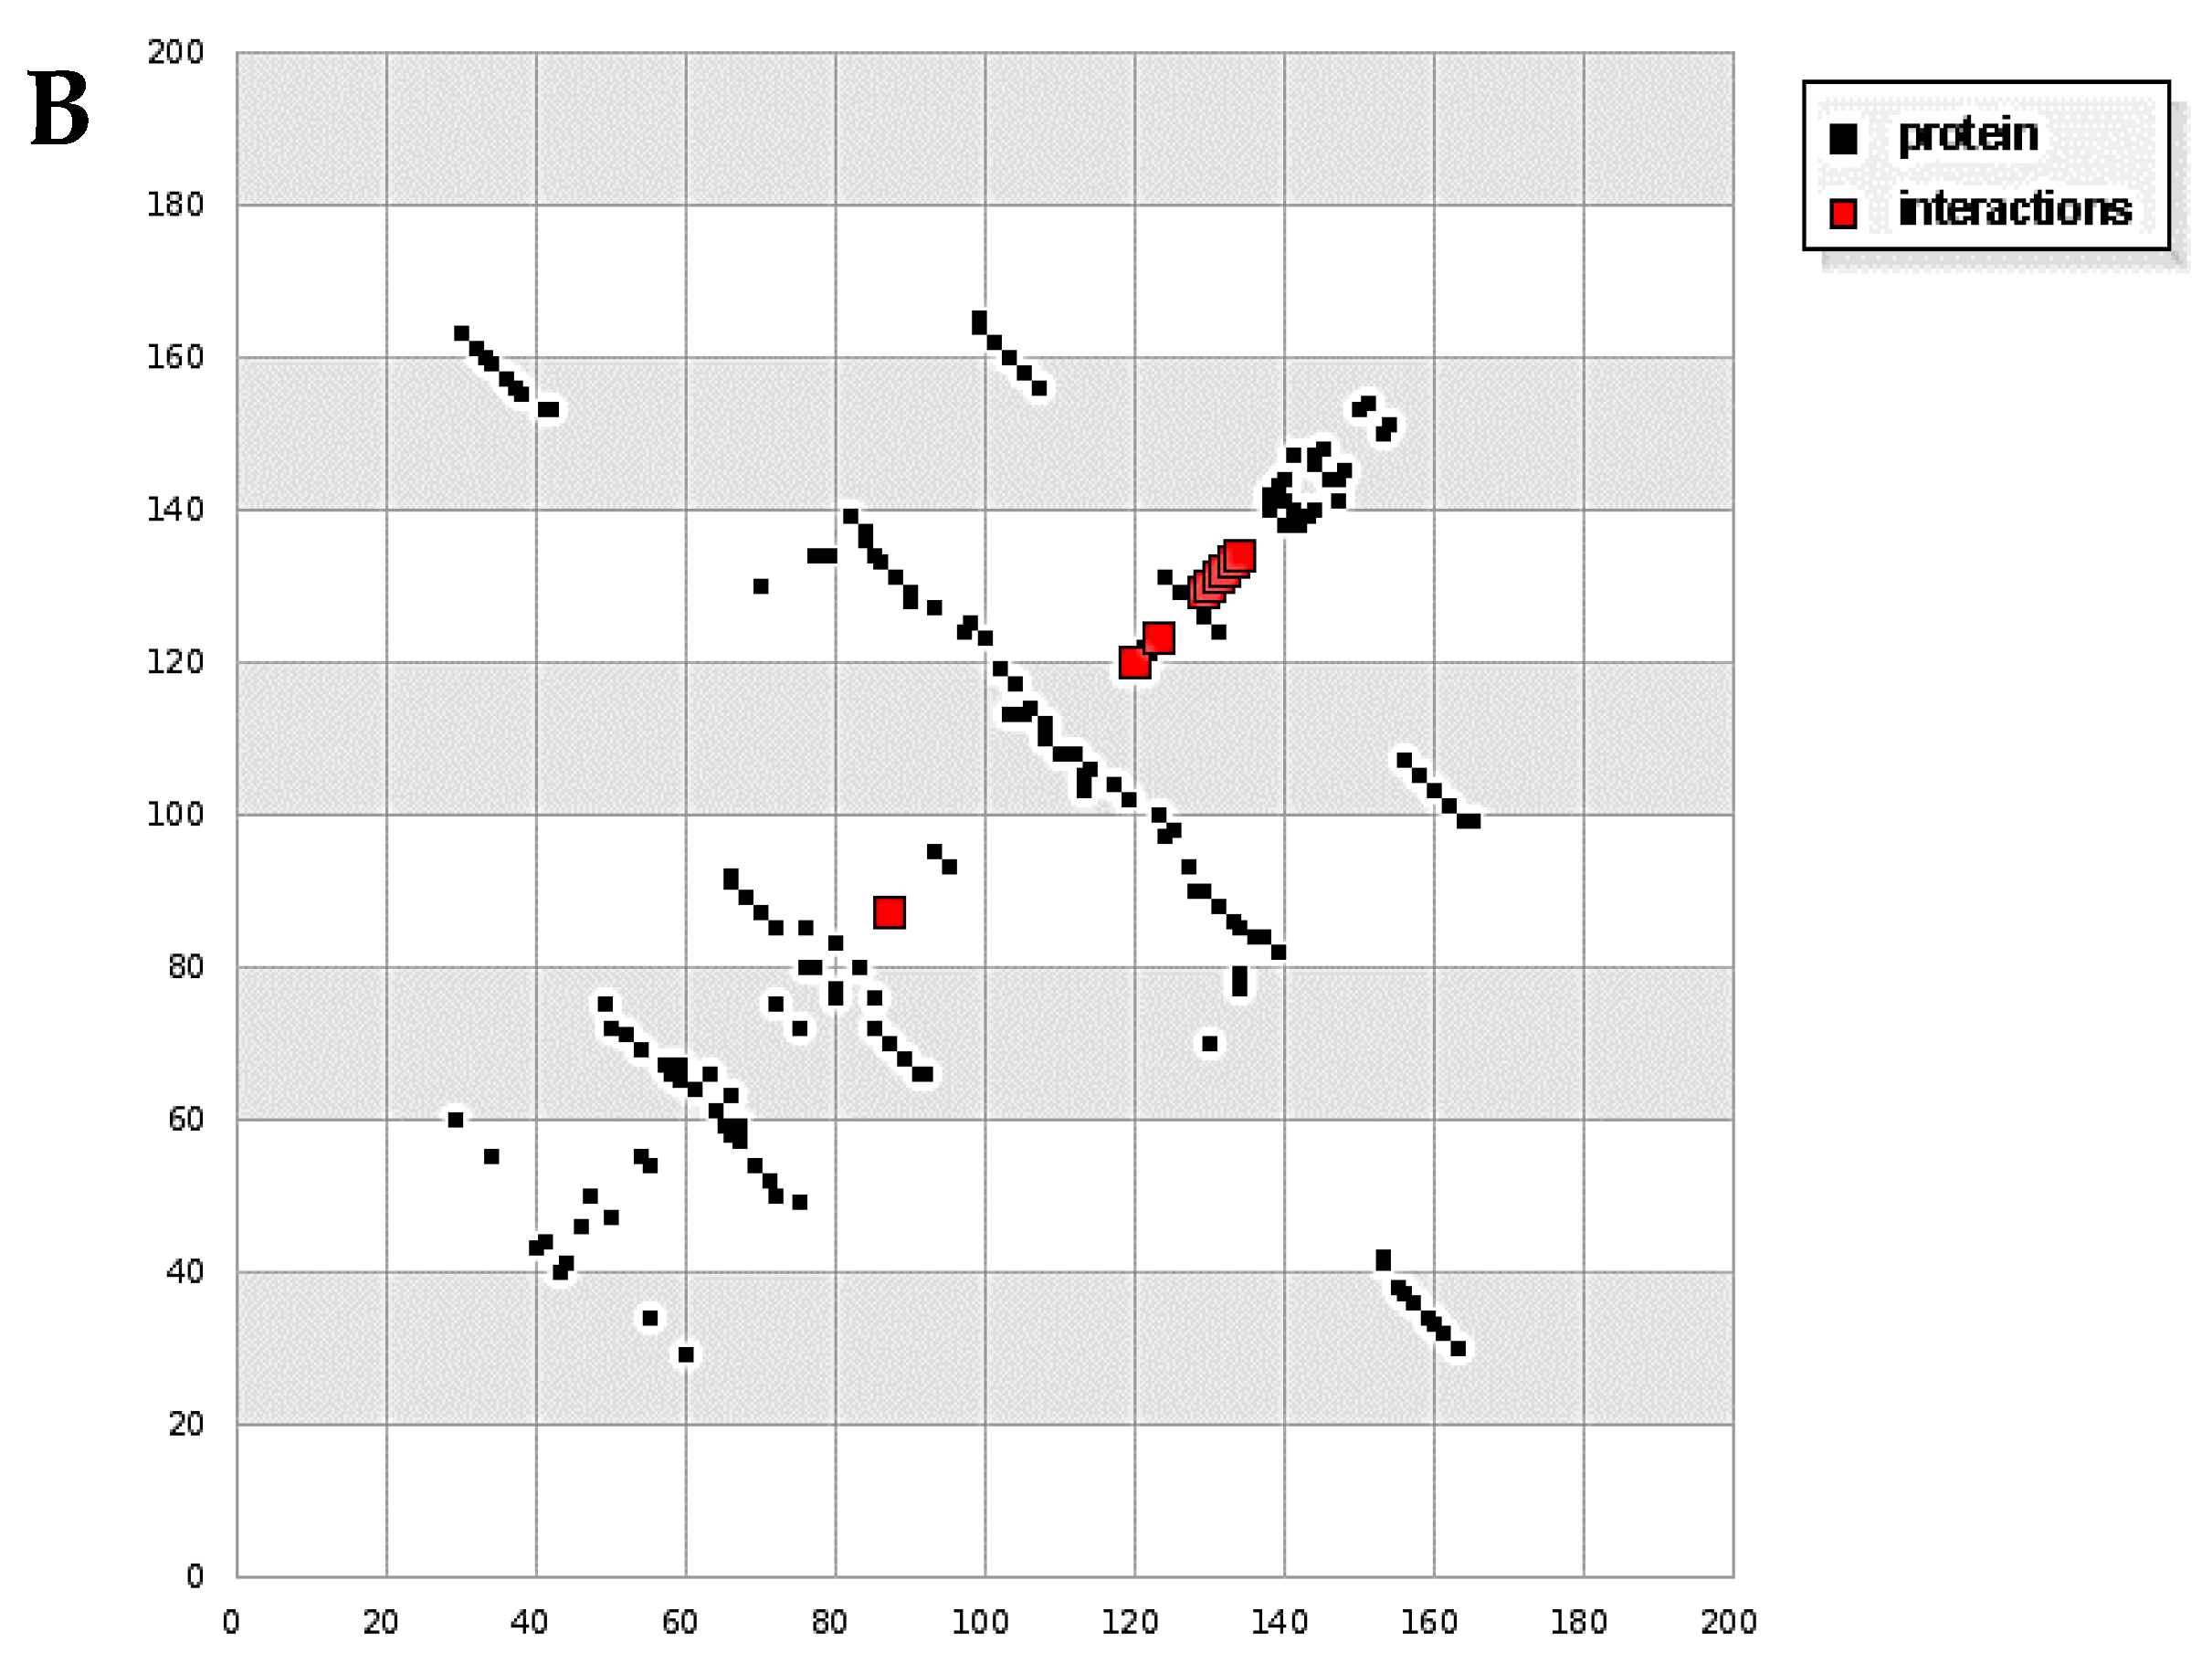
3.8. Molecular Docking
Docking calculations were done for a diim protein model after merging the non-polar hydrogen atoms, defining rotatable bonds, adding Gasteiger charges, and other analytical parameters with the assistance of the AutoDock tools [28,29]. The docking simulation was accomplished by the Solis and Wets local search method and a Lamarckian genetic algorithm [30]. The docking survey output has been carried between the 3hb5-oxidoreductase (breast cancer) protein and 4o1v-protein binding (kidney cancer) against the diim free ligand. The results are summarized in Table 6. Diim free ligand displayed good binding interactions with the amino acids of the protein molecules with binding reaction energy values of −7.23 and −2.87 kcal mol−1 for the 3hb5-oxidoreductase protein (Figure 8A) and 4o1v-protein (Figure 8B), respectively. It can be concluded that the free diim ligand can bind with active positions in 3hb5-oxidoreductase protein and 4o1v-protein and has a great binding affinity towards them.
Table 6.
Docking calculations for the diim free ligand.

Figure 8.
(A) HB plot of diim ligand against 3hb5-oxidoreductase protein and (B) HB plot of diim ligand against 4o1v-protein binding.
4. Conclusions
In this study, four different metal [Cu(II), Ni(II), Zn(II), and Co(II) ] complexes of diim ligand in a (2:1) metal to ligand ratio were prepared and characterized. The free ligand and its metal complexes were studied by various methods such as elemental analysis, electronic spectroscopy, FTIR, 1H-NMR, and mass spectroscopy. From the FTIR spectra, it was found that the coordination process took place via the nitrogen atom of the azomethine group and the oxygen atom of the hydroxyl group for the first metal ion, while, the second one formed a coordination bond with the oxygen atom of the phenol group and the other nitrogen atom of azomethine group forming binuclear (2:1) complexes. All complexes display an octahedral geometry except for Zn(II) which has a tetrahedral configuration. Thermal degradation for the free ligand and its metal complexes was studied by (TG/DrTGA) analysis in a nitrogen atmosphere. The conductivity values verified the nonelectrolyte behavior of all the complexes. The antibacterial effects of the diim metal complexes, especially the Cu(II) and Zn(II) ones, exhibit a potential antibacterial effect against B. subtilis, S. aureus, and E. coli higher than that of the diim ligand. Finally, from a molecular docking study, the diim ligand can bind with the active positions of the breast cancer 3hb5-oxidoreductase protein and the kidney cancer 4o1v-protein and means it has a great binding affinity towards them.
Supplementary Materials
The following are available online at https://www.mdpi.com/2073-4352/11/3/300/s1, Figure S1: Mass spectrum fragmentations of cobalt(II) complex; Figure S2: Mass spectrum fragmentations of nickel(II) complex; Figure S3: Mass spectrum fragmentations of copper(II) complex; Figure S4: ass spectrum fragmentations of Zink(II) complex.
Author Contributions
Conceptualization, A.A.M.B., I.M.E.-D. and M.S.R.; methodology, A.A.M.B., N.H., R.Z. and M.S.R.; software, N.H. and R.Z.; validation, A.G., W.F.A. and M.S.R.; formal analysis, A.G., W.F.A., A.A.M.B., A.M.N. and I.M.E.-D.; investigation, A.G., W.F.A., R.Z. and M.S.R.; resources, A.A.M.B., I.M.E.-D., N.H. and M.S.R.; data curation, N.H., R.Z. and M.S.R.; writing—original draft preparation, A.G., A.A.M.B., I.M.E.-D. and M.S.R.; writing—review and editing, A.G., A.M.N. and M.S.R.; visualization, W.F.A. and R.Z.; supervision, M.S.R.; project administration, A.G.; funding acquisition, A.G. and W.F.A. All authors have read and agreed to the published version of the manuscript.
Funding
This research was funded by Taif University Researchers Supporting Project number (TURSP-2020/39), Taif University, Taif, Saudi Arabia.
Institutional Review Board Statement
The experiment did not require ethical approval.
Informed Consent Statement
Not applicable.
Data Availability Statement
The data used to support the findings of this study are included within the article.
Acknowledgments
The authors’ appreciate Taif University Researchers Supporting Project number (TURSP-2020/39), Taif University, Taif, Saudi Arabia.
Conflicts of Interest
The authors declare no conflict of interest.
References
- Verma, G.; Marella, A.; Shaquiquzzaman, M.; Akhtar, M.; Ali, M.R.; Alam, M.M. A review exploring biological activities of hydrazones. J. Pharm. Bioallied. Sci. 2014, 6, 69–80. [Google Scholar] [PubMed]
- Uppal, G.; Bala, S.; Kamboj, S.; Saini, M. Therapeutic review exploring antimicrobial potential of hydrazones as promising lead. Der Pharma Chem. 2011, 3, 250–268. [Google Scholar]
- Rollas, S.; Küçükgüzel, S.G. Biological Activities of Hydrazone Derivatives. Molecules 2007, 12, 1910–1939. [Google Scholar] [CrossRef]
- Narang, R.; Narasimhan, B.; Sharma, S. A review on biological activities and chemical synthesis of hydrazide derivatives. Curr. Med. Chem. 2012, 19, 569–612. [Google Scholar] [CrossRef] [PubMed]
- Negi, V.J.; Sharma, A.K.; Negi, J.S.; Ra, V. Biological activities of hydrazone derivatives in the new millennium. Int. J. Pharm. Chem. 2012, 4, 100–109. [Google Scholar] [CrossRef]
- Belskaya, N.P.; Dehaen, W.; Bakulev, V.A. Synthesis and properties of hydrazones bearing amide, thioamide and amidine functions. Arch. Org. Chem. 2010, 1, 275–332. [Google Scholar] [CrossRef]
- Xavier, A.J.; Thakur, M.; Marie, J.M. Synthesis and spectral characterisation of hydrazone based 14-membered octaaza macrocyclic Ni(II) complexes. J. Chem. Pharm. Res. 2012, 4, 986–990. [Google Scholar]
- Banerjee, S.; Mondal, S.; Chakraborty, W.; Sen, S.; Gachhui, R.; Butcher, R.J. Syntheses, X-ray crystal structures, DNA binding, oxidative cleavage activities and antimicrobial studies of two Cu (II) hydrazone complexes. Polyhedron 2009, 28, 2785–2793. [Google Scholar] [CrossRef]
- Shakdofa, M.; Shtaiwi, M.; Morsy, N.M.; Abdel-Rassel, T.M.A. Metal complexes of hydrazones and their biological, analytical and catalytic applications: A review. Main Group Chem. 2014, 13, 187–218. [Google Scholar] [CrossRef]
- Issa, Y.M.; Issa, R.M.; El-Latif, S.A.A.; El-Salam, H.A.A. Structural Studies of Cu(II) Chelates with Some Arylidene Derivatives of Benzilic Hydrazide. Mon. Fur Chem. 1998, 129, 19–29. [Google Scholar] [CrossRef]
- Sharma, A.; Mehta, T.; Shah, M.K. Synthesis and spectral studies of transition metal complexes supported by NO-bidentate Schiff-Base ligand. Der Chem. Sin. 2013, 4, 141–146. [Google Scholar]
- Kumar, R.; Singh, K.; Srivastava, R.; Kamalasanan, M.N. Advanced Nanomaterials and Emerging Engineering Technologies (ICANMEET). In Proceedings of the 2013 International Conference, Chennai, India, 24–26 July 2013; pp. 520–523. [Google Scholar]
- Kim, S.M.; Kim, J.S.; Sin, D.M.; Kim, Y.G.; Ha, Y.G. Synthesis and application of the novel azomethine metal complexes for the organic electroluminescent devices. Bull. Korean Chem. Soc. 2001, 22, 743–747. [Google Scholar]
- Bushuev, M.B.; Selivanov, B.A.; Pervukhina, N.V.; Naumov, D.Y.; Rakhmanova, M.I.; Sheludyakova, L.A.; Tikhonov, A.Y.; Larionov, S.V. Luminescent zinc (II) and cadmium (II) complexes based on 2-(4, 5-dimethyl-1 H-imidazol-2-yl) pyridine and 2-(1-hydroxy-4, 5-dimethyl-1 H-imidazol-2-yl) pyridine. Russ. J. Gen. Chem. 2012, 82, 1859–1868. [Google Scholar] [CrossRef]
- Yang, C.L.; Luo, J.X.; Ma, J.Y.; Lu, M.G.; Liang, L.Y.; Tong, B.H. Synthesis and photoluminescent properties of four novel trinuclear europium complexes based on two tris-β-diketones ligands. Dyes Pigm. 2012, 92, 696–704. [Google Scholar] [CrossRef]
- Chattopadhyay, T.; Mukherjee, M.; Banu, K.S.; Banerjee, A.; Suresh, E.; Zangrando, E.; Das, D. Mono-and dinuclear Zn (II) complexes of Schiff-base ligands: Syntheses, characterization and studies of photoluminescence. J. Coord. Chem. 2009, 62, 967–979. [Google Scholar] [CrossRef]
- El-Habeeb, A.A.; Refat, M.S. Synthesis, structure interpretation, antimicrobial and anticancer studies of tranexamic acid complexes towards Ga (III), W (VI), Y (III) and Si (IV) metal ions. J. Mol. Struct. 2019, 1175, 65–72. [Google Scholar] [CrossRef]
- Nakamoto, K. Infrared and Raman Spectra of Inorganic and Coordination Compounds: Part A: Theory and Applications in Inorganic Chemistry, 6th ed.; Wiley: New York, NY, USA, 2008. [Google Scholar]
- Chandra, S.; Gupta, K. Twelve-, fourteen- and sixteen-membered macrocyclic ligands and a study of the effect of ring size on ligand field strength. Trans. Met. Chem. 2002, 27, 329–332. [Google Scholar] [CrossRef]
- Lever, A.B.P. Crystal Field Spectra. In Inorganic Electronic Spectroscopy, 1st ed.; Elsevier: Amsterdam, The Netherlands, 1968. [Google Scholar]
- Lever, A.B.P. Inorganic Electronic Spectroscopy, 2nd ed.; Elsevier: Amsterdam, The Netherlands, 1984. [Google Scholar]
- Coats, A.W.; Redfern, J.P. Kinetic Parameters from Thermogravimetric Data. Nature 1964, 201, 68–69. [Google Scholar] [CrossRef]
- Horowitz, H.W.; Metzger, G. A new analysis of thermogravimetric traces. Anal. Chem. 1963, 35, 1464. [Google Scholar] [CrossRef]
- Chourasia, P.; Suryesh, K.K.; Mishra, A.P. Synthesis and structural investigation of some mixed-ligand selenito complexes of cobalt (II). Proc. Indian Acad. Sci. 1993, 105, 173–189. [Google Scholar]
- Claudel, M.; Schwarte, J.V.; Fromm, K.M. New Antimicrobial Strategies Based on Metal Complexes. Chemistry 2020, 2, 849–899. [Google Scholar] [CrossRef]
- Zalevskaya, O.; Gur’eva, Y.; Kutchin, A.; Hansford, K.A. Antimicrobial and Antifungal Activities of Terpene-Derived Palladium Complexes. Antibiotics 2020, 9, 277. [Google Scholar] [CrossRef] [PubMed]
- Sheikhshoaie, I.; Lotfi, N.; Sieler, J.; Krautscheid, H.; Khaleghi, M. Synthesis, structures and antimicrobial activities of nickel (II) and zinc (II) diaminomaleonitrile-based complexes. Transit. Met. Chem. 2018, 43, 555–562. [Google Scholar] [CrossRef]
- Bikadi, Z.; Hazai, E. Application of the PM6 semi-empirical method to modeling proteins enhances docking accuracy of AutoDock. J. Cheminformatics 2009, 1, 15. [Google Scholar] [CrossRef] [PubMed]
- Morris, G.M.; Goodsell, D.S.; Halliday, R.S.; Huey, R.; Hart, W.E.; Belew, R.K.; Olson, A.J. Automated docking using a Lamarckian genetic algorithm and an empirical binding free energy function. J. Comput. Chem. 1998, 19, 1639–1662. [Google Scholar] [CrossRef]
- Solis, F.J.; Wets, R.J.B. Minimization by random search techniques. Math. Oper. Res. 1981, 6, 19–30. [Google Scholar] [CrossRef]
Publisher’s Note: MDPI stays neutral with regard to jurisdictional claims in published maps and institutional affiliations. |
© 2021 by the authors. Licensee MDPI, Basel, Switzerland. This article is an open access article distributed under the terms and conditions of the Creative Commons Attribution (CC BY) license (http://creativecommons.org/licenses/by/4.0/).