Abstract
In the paper, an X-ray spectroscopy-based approach on laser pulse temporal profile characterization is described. The structure of dielectronic satellites to H-like Lyα lines strongly depends on a plasma electron density, so it can be applied for diagnostics. These spectral lines are mainly emitted during initial stage of laser plasma expansion. It means that plasma parameters obtained via them characterizes matter conditions in a region surrounding a spot of laser-matter interaction. In the case when a laser contrast is high enough, the radiation interacts with cold matter, which had not been preliminary perturbed by a laser prepulse, and the satellites structure shape corresponding to high densities should be observed. It allows us to consider the satellites as a diagnostic tool for the laser temporal profile quality. In the paper dependencies of the dielectronic satellites structure on electron densities obtained from detailed kinetic calculations in the wide range of plasma parameter for different elements are under discussion. Fundamental theoretical aspects of plasma diagnostic based on the feature of satellite structures shape in hot dense plasma, which led to development of the proposed method, are also explained.
1. Introduction
Interaction of high intensity laser radiation with matter in different states is a widely used method of investigation in the field of plasma physics. Correct interpretation of the data obtained during such experiments can be implemented only in the case when laser parameters are accurately monitored. Permanent increase in achievable laser intensity has made a laser contrast value K an especially important experimental parameter. In a maximally wide sense of meaning, the parameter K can be defined as a ratio of laser pulse peak intensity and intensity of the pedestal foregoing the main peak. Even for quite high values K ~1010 (or even higher) the prepulse intensity is ~1012 W/cm2 (or higher) for the laser pulses with intensities of ~1022 W/cm2, which, for example, can be generated by the PW-class facilities, for example, the J-KAREN-P laser [1]. Such intensity of the undesirable radiation exceeds the plasma creating threshold and as a result the main pulse interacts with the perturbed matter which can affect dramatically investigated phenomena. For example, in [2], it was clearly shown that spectra of radiation emitted by Ar ions during laser-Ar-cluster-interaction differs significantly for K = 105 and 1010 cases. For the latter case, the prepulse does not destroy cluster completely so the main pulse can interact with the cluster quasi-solid matter. The hyper satellite structure in a region of characteristic Kα emission is observed in the spectra. In [3] it is demonstrated that a laser-based source of highly charged moderate-Z ions can be created only with high-contrast laser pulses. Presence of quite a high prepulse significantly decreases the average degree of ionization in irradiated solid-state target. Investigations of high-order harmonic generation during solid-density plasma surfaces interaction described in [4] show that the use of plasma mirrors (a widely known way to improve the contrast, for details see [5]) allows us to improve the efficiency of the coherent wake emission mechanism [6]. For this reason, it is crucially important to have an opportunity to monitor a temporal profile of laser pulses applied for experiments. It can be done preliminarily via such techniques as third-order autocorrelation [7] or third-order cross-correlation [8]. Nowadays, systems providing such measurements are commercially available. For example, a third-order cross-correlator Sequoia by Amplitude [9] can be mentioned. The results obtained with this equipment for the J-KAREN-P facility can be found, for example in [1]. Nevertheless, it is a well-known experimental fact that parameters of pulses generated by laser system are sensitive to a variety of external factors and sometimes their values can change significantly from shot to shot. Therefore, it cannot be claimed that, measured once, the temporal profile has the same shape for each laser pulse generated during an experiment. For this reason, several approaches exist for in-situ measurements of the laser pulse profile on the femtosecond scale [10,11]. However, it is still challenging to implement a contrast diagnostic at high intensities. Additionally, it cannot be ensured that the low-power measurement results are representative for the full-energy pulses.
In the paper we suggest an X-ray spectroscopy method of indirect on-shot characterization of the laser pulse temporal profile. It is based on analysis of highly charged He-like ions spectral lines forming a group of satellites to a main line (Lyα) of a H-like ion (of the same element) resonance series. These satellites are emitted during the very first moments of a laser pulse interaction with a target. It means that their shape is determined by matter properties (especially by the electron density Ne) within a focal spot. According to carried out calculations, this group of lines has a specific shape only when Ne is close (10% or higher) to a solid-state value. Thus, observation of such shape in the spectra can be considered as an evidence of interaction between laser radiation and matter weakly perturbed by a laser prepulse.
2. General Descriptions of Dielectronic Satellites (DS)
X-ray spectroscopy is a widely used method for plasma diagnostics. It is based on an obvious fact that plasma emission spectra (spectral lines intensities and their ratios, peak shape including peaks width and their shape generally) depend on plasma parameters (electron temperature Te and Ne). During the last few decades, a huge variety of different X-ray spectroscopy approaches suitable for plasma diagnostics in different experimental cases were developed. A significant number of them is associated with experiments on interaction of high-intensity laser pulses with matter in different states [12,13,14,15].
Very often a spectrum emitted by plasma of highly charged ions (mostly H-, He-, Li-like) considered as a subject for plasma X-ray spectroscopy analysis. The most informative part of it is a wavelength region containing resonance lines both H-like (2p3/2(1/2) → 1s1/2 transitions—Lyα doublet) and He-like (1s2p 1P1 →1s2 1S0–Heα line; 1s2p 3P1–> 1s2 1S0 Heinter line) ions of an investigated element (Figure 1).
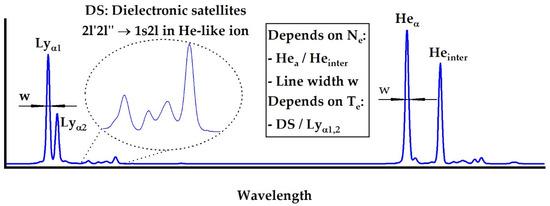
Figure 1.
Schematic drawing of Lyα-to-Heα range of highly charged ions plasma radiation which is usually analyzed for plasma parameters diagnostics. Heinter is an intercombination line corresponding to the transition 1s2p 3P1–> 1s2 1S0.
The listed lines together have a significant diagnostics potential for Ne determination. Heα and Heinter are quite sensitive to this parameter. The width of the lines, in addition, also depends on Ne due to the Stark broadening effect. Additionally, near the Lyα lines there is a group of peaks with longer wavelengths, which are called dielectronic satellites (referred to below as “DS”). The origin of these lines is associated with decay of double excited (autoionizing) levels in He-like ions: nln’l’ → 1sn’l’, which are populated by the dielectronic recombination process only. Sometimes, transition from autoionizing states are referred as «screened» transitions, because it can be considered as resonance transition nl → 1s occuring within a field of an additional electron partially screening the nucleus field. The similar type transitions (and spectral lines corresponding to them) should occur for Li-, Be-like ions and ions of lower charge states. However, already for the He-like ions, part of them overlaps with Heinter and with a spectral line corresponding to the forbidden transition HeF: 1s2s 3S1–> 1s2 1S0. In the paper, only the DS originating from transitions in He-like ions are discussed.
The DS group of lines provides a highly effective method for Te diagnostics. Both autoionization and resonance (of H-like ions) energy levels populations are determined by processes associated with transitions from the ground state of an H-like ion. As a result, intensity ratios of the resonance (Lyα) and satellite lines do not depend on plasma state of ionization. Moreover, a ratio of the most intensive satellite 2p2 1D2–1s2p 1P1 and the Lyα line does not depend on the plasma electron density for Ne < = 1024 cm−3, which make it very convenient for its electron temperature measurements.
3. Specific Features of Using Dielectronic Satellites (DS) Plasma Parameters Diagnostics
Very often, measurement schemes implemented for X-ray spectroscopy purposes provide only time-integrated plasma spectrum. It means that the recorded signal is a sum of contributions made by plasma regions separated in space and time with different values of Ne and Te. Different parts of it (different spectral lines) contains information about different stages of plasma evolution. Sometimes, it is quite hard to distinguish their contributions because they emit in the same wavelength region. The issue can be half-way avoided by using spectrometers with spatial resolution like described in [16]. It can be implemented only for the case when the provided resolution value is better than the interaction zone size, which is hardly achievable for the modern focusing systems, which are able to gather a beam into a spot with diameter of 2–4 µm. Ultrafast X-ray streak cameras can be also applied to provide temporal profile of the plasma radiation spectra, as it is described in [17]. However, experimental schemes including such devices implies quite high energy of an incident laser pulse to provide a significant level of plasma emissivity and as a result a sufficient signal-to-noise ratio value. Moreover, time resolution achieved even by the best modern devices is still worse than duration of the processes occurring at the first stages of femtosecond laser plasma evolution.
Another issue is a distortion of resonance spectral line profiles by a process of plasma self-absorption. It can significantly change the shape of an investigated line, especially for Ne close to solid state values. In Figure 2, such changes are demonstrated for the Si Lyα line as a function of the plasma size.
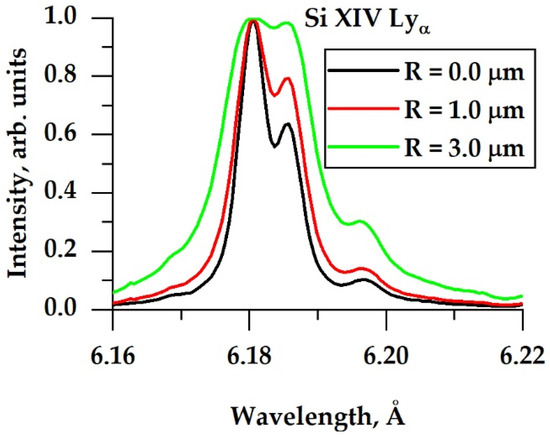
Figure 2.
Optical thickness influence on the shape of Lyα line emitted by H-like Si XIV ions. All the curves were calculated theoretically for Ne = 5 × 1021 cm−3 and Te = 330 eV in assumption that the plasma is a sphere with radius R. Peak maxima were normalized to 1.
The relative intensity of DS as a tool for Ne diagnostics provides a unique opportunity to avoid both mentioned problems. The process of dielectronic recombination populating autoionizing states (decay of which results in DS emission) associated with transfer of energy from plasma free electrons to ions, so its rate αDR decreases when Te becomes lower [18,19], which occurs during plasma expansion. It means that the DS lines are effectively emitted only when Te is high enough. Duration of this period (counted from the moment when the main pulse reached a target) is significantly shorter than for a period during which the resonance lines emission takes place. Thus, the plasma parameters obtained via DS are much more related to the initial than any other stages of plasma expansion. Experimental evidence of this fact was observed, for example, during experiments aimed at creation of high-aspect ratio plasma jets by irradiation of Teflon targets by laser pulses of moderate intensity described in [20,21]. Emission corresponding to DS originating by transitions in He-like fluorine ions was observed in spatially resolved spectra only on distances less than 1 mm far from the irradiated surface, whereas resonance lines were emitted from regions located several millimeters (up to ten) in a direction of the plasma flow direction.
It should be also noted that αDR is directly proportional to the temperature within a limited temperature range. For quite hot plasma the rate decreases, when Te becomes higher. In other words, the dependency has a maximum, but it is reached for quite high temperatures. For example, for plasma of Mg ions the value is 500 eV, but already for Si it is about 1 keV, which is quite a challenge to achieve in laser-matter interaction experiments. The exact dependencies of αDR on Ne for H-like ions of different elements with Z up to 36 (Kr) are given in [18,22].
The second advantage of the DS originates from the fact that, even for quite high values of plasma linear size, it remains optically thin for them. For this reason, in some cases (dense, middle-temperature plasma) their intensity becomes even higher than for the resonance ones, as it was experimentally demonstrated for example in [23].
4. Dependence of Dielectronic Satellites (DS) Shape on Electron Density Ne
The DS is formed by transitions listed in Table 1. Its shape for three significantly different values of Ne is shown in Figure 3. For diagnostics purposes it is proposed to analyze the relative intensities of two spectral lines sub-groups labeled in Figure 3 as “1” and “2”. The group “2” includes only one line sometimes mentioned in literature as j-satellite.

Table 1.
Transitions forming the spectral peaks 1 and 2 (Figure 2) applied for Ne diagnostics.
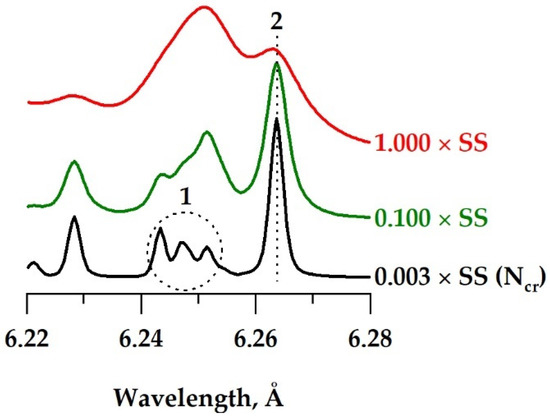
Figure 3.
Theoretically calculated shapes of the Lyα DS group for different values of Ne calculated for plasma of highly charges Si ions with fixed Te = 500 eV. SS is for solid-state value, which for Si equals ~6 × 1023 cm−3. Ncr = 1.8 × 1021 cm−3 is the critical density for λ = 800 nm. A ratio of the peak group “1” integrated intensity and the intensity of the peak “2” depends on Ne. The curves are offset along Y axis for convenience.
The chosen Ne values correspond to three well recognized preplasma formation conditions. When the laser contrast is high enough and, as a result, a preplasma generation threshold is not reached, matter in a point of interaction is not preliminary perturbed. Its Ne corresponds to a solid-state (SS) value. The red curve in Figure 3 corresponds to such situation. It is clearly seen that in that case a maximum intensity of the peak “1” is higher than for peak “2” (referred below as “inverse structure”). For Ne of an order of magnitude lower than the solid-state value the situation is completely different (green line). The peak “2” is more intensive for this case and the width of all lines is significantly narrower due to weaker influence of the Stark broadening. Such shape can also be considered as an evidence of a quite good contrast, because it is corresponding to Ne about 30 times higher than the critical density (Ncr) for radiation produced by Ti:Sa lasers value (1.8 × 1021 cm−3 for λ = 800 nm).
In the case of low contrast, a preplasma is created by the undesirable prepulses and the main pulse interacts with it instead of unperturbed matter. In that case, the laser pulse cannot pass a surface of the critical density, so it interacts with the matter with Ne ≤ Ncr, which results in DS shape shown by the black line in Figure 3. The peaks “1” and “2” are completely resolved. Moreover, the peak “1” partially splits into three different peaks, which are formed mainly by transitions 9, 8 and 4 in Table 1. Additionally, it should be noted that the “distribution” of intensities within the peak “1” changes itself following Ne. For both cases of “high” (close to solid-state value) and critical Ne the peak “1” has appeared asymmetrical. For the latter case, the maximum is located on a short-wavelength wing of the peak and it shifts to an opposite side with the density increase. That corresponds to redistribution of the intensities between two subgroups of lines forming the peak “1”: transitions 3–6 and 7–9 (Table 1).
All the DS shapes shown in Figure 3 and described above were observed for different experimental conditions implemented for example in [24,25]. The spectra obtained in these works with crystal-based x- ray spectrometers are shown in Figure 4.
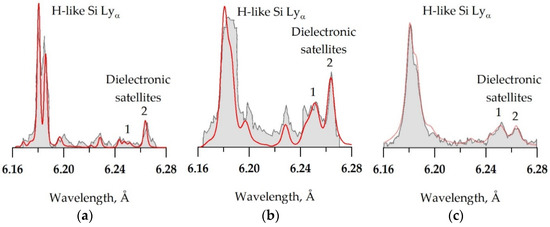
Figure 4.
Emission spectra of laser-produced Si plasma created during irradiation of Si foil by: (a) 2 ns Nd laser pulses with I = 5 × 10¹⁴ W/cm2 [24]; (b) 300 fs XeCl laser pulses with I = 4 × 10¹⁸ W/cm2 [24]. The spectrum (c) was registered during irradiation of SiO2 aerogel targets by 50 fs pulses of Ti:Sapphire laser with intensity of ~1017 [25]. Red curves for all the figures are theoretical spectra calculated for: (a) Te = 400 eV; Ne = 1.2 × 1021 cm−3; (b) Te = 225 eV; Ne = 1 × 1023 cm−3; (c) Te = 325 eV; Ne = 2.4 × 1024 cm−3.
“Long” nanosecond pulses for which the spectrum shown in Figure 4a was obtained provide a plasma with density ~Ncr. As a result, the DS shape like shown by the black line in Figure 3 is observed. In opposite to that the spectrum registered for “short” 300 fs (Figure 4b) pulse demonstrates completely different distribution of intensity within the peak “1”. Its “center of mass” is shifted to longer wavelengths as for the green line in Figure 3. The most interesting case is shown in Figure 4c. As one can see the peak “1” of DS has intensity which is higher than for the peak “2”. For plasma of considered above Si and some other elements such shape can be observed only for Ne values close to or higher than the solid-density value.
A dependence of a ratio χ = I1/ I2, where I1 and I2 are integral intensities of the peaks “1” and “2”, on Ne is demonstrated in Figure 5 for three different temperatures for plasma containing He-like Na, Si and S ions. All the calculations presented in the figures were carried out via collisional-radiative spectral analysis code PrismSPECT [26].
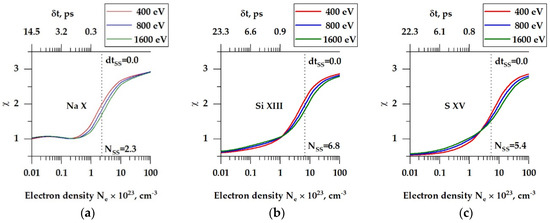
Figure 5.
Dependency of intensity ratio χ on Ne theoretically calculated for three different Te for plasma of the following elements: (a)—Na, (b)—Si, (c)—S. Roman numbers near the element symbols equal to q + 1, where q is an electric charge (measured in the electron charge value units) of a given ion. The indicated NSS value calculated as for ion concentration , where are volumetric mass density and molar mass correspondingly and is the Avogadro number. q equals 9, 12, 14 for He-like ions of Na, Si and S correspondingly. The top horizontal axis (δt, ps) is a delay between a moment of preplasma creation by an undesirable laser prepulse and main pulse if the given Ne (corresponding value on the bottom horizontal axis) was obtained via the DS.
As one can see, the ratio weakly depends on Te in the range 1021 ≤ Ne ≤ 1025 cm−3 and can be effectively applied if the spectral resolution of at least λ/δλ ~ 103 is provided. Such value is necessary to resolve peaks corresponding to indicated spectral lines subgroups.
The other feature of the obtained dependencies is shifting of the density value for which the ratio χ exceeds 1. For plasma of Na ions, it occurs for Ne ~4 × 1022 cm−3 and also the whole range of densities exists (from 4 × 1022 cm−3 down to at least 1 × 1021 cm−3 and even lower, but not shown on the figure) for which the ratio ~1. For Si and S ions the densities of exceeding 1 are ~8 × 1022 cm−3 and ~1 × 1023 cm−3 correspondingly. It means that it becomes closer and closer to a solid-state density value for a given element and from some Z begins to exceed it. For plasma of such elements even for a case of the ideal temporal contrast, when undesirable prepulses are absent completely the “inversed structure” of DS is not observed. This fact is demonstrated by the Figure 6, where the DS shape is shown for Ti plasma of two densities. It is clearly seen that the general shape of the spectra is quite similar for the cases when Ne = NSS and Ne = 0.3 NSS.
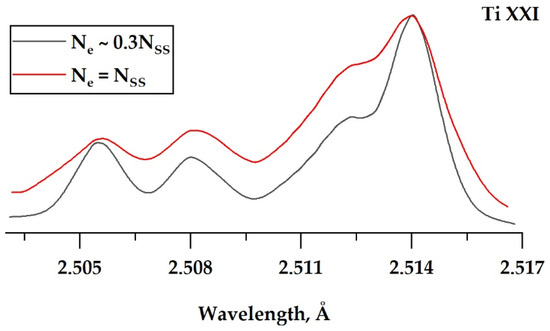
Figure 6.
Shape of DS corresponding to transitions in He-like Ti XXI ion theoretically calculated for Ne = 4 × 23 cm−3 (0.3 NSS) and Ne ~1.3 × 1024 (NSS).
5. Delay between the Main Pulse and a Moment of Preplasma Threshold Exceeding
Thus, if an experimental opportunity of in-situ (for each laser shot) registration of Lyα dielectronic satellites spectra emitted by a laser plasma is implemented, it becomes possible to estimate the quality of the pulse temporal profile. It is especially important to stress here that the described approach cannot be considered as a way of direct laser contrast measurements. Fine structure of an ultrashort laser pulse temporal profile is quite complicated and includes at least five different types of prepulses: “long” ASE (amplified spontaneous emission) determined by duration of active medium pumping, “short” ASE (determined by optical shutters speed), ultrashort (Δτ ~ 10 ns) prepulse (by optical shutters contrast), pedestal of the main pulse due to phase and spectral distortions and ultrashort prepulses arising in plane-parallel elements of an optical path. It is quite difficult to distinguish their influence by means of X-ray spectroscopy methods. However, the rough estimations can be done. It can be assumed that from the moment , when the preplasma creation threshold was exceeded, a uniform expansion of the plasma within a cone with an angle (Figure 7) begins. During a period δt from the beginning the plasma expands to a volume V:
where the second part of the sum is a volume of a truncated cone. For the certain case is a radius of a focal spot, is a speed of expansion, and is an initial volume of matter, which was ionized by a laser prepulse. It can be estimated as in assumptions that the energy was fully absorbed by a skin layer of thickness .
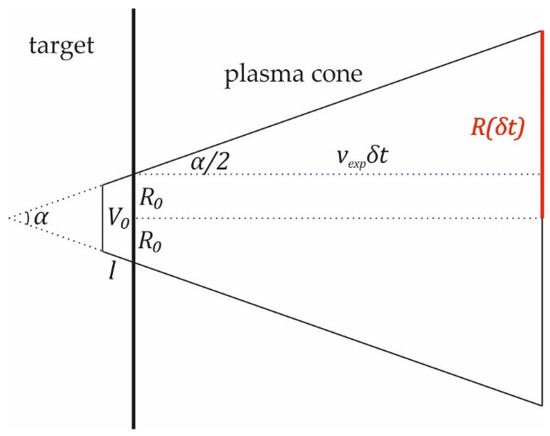
Figure 7.
Schematic drawing of the plasma expansion process (side view).
Ne values obtained via DS can be expressed by the following expression:
where is an assumed average degree of ionization, - is ion solid state density for a given element. As a result, values of Ne axis in Figure 5 can be recalculated to , i.e., the delay between the moment of preplasma formation and main pulse). It was done for the following parameter values: = 5 µm, = 5 × 107 cm/s, = 100 nm and = 90°. These values were chosen as a basic estimation of the considered parameters. In a general case, they should be calculated in accordance with a theoretical model, which is most suitable for the implemented experimental conditions. For example, the ion sound speed (where is the ion mass) is a widely used estimation for . The skin layer width is determined as , where is the speed of light and is a plasma frequency calculated for the critical value of Ne. More accurate estimations of can be provided on the basis of laser ablation models like described in [27].
The results of recalculation are shown as the second (top) horizontal axis. As one can see, an order of obtained values is in picoseconds range. It means that the described estimate for the delay is valid only for “short” (femtosecond and picosecond) laser pulses. In case of nanosecond pulses, significant hydrodynamic expansion of the plasma takes place during irradiation itself. Therefore, it is impossible to distinguish if low densities are observed only due to this process or due to prepulse influence as well.
6. Conclusions
Thus, dielectronic satellites shape can be applied to characterize a temporal profile of ultrashort (femtosecond and picosecond scale of durations) intensive laser pulses. Its analysis allows not only to understand if the preplasma creation threshold was exceeded by any of undesirable prepulses, but also to give a rough estimation for the delay between this moment and the main pulse. During irradiation of targets made of elements with 10 ≤ Z ≤ 20 the laser pulse contrast can be characterized generally without any detailed spectrum analysis. The situation when a satellite with the longest wavelength (2 in Figure 3) is not the most intensive among the DS lines corresponds to a case when prepulse intensity does not exceed the preplasma creation threshold or the delay is relatively short. For heavier elements, dielectronic satellites still can be applied for diagnostics of Ne in the laser-matter interaction point, but in that case their shape should be analyzed in detail and compared to results of plasma kinetics calculations.
Author Contributions
Conceptualization, S.N.R., I.Y.S. and S.A.P.; funding acquisition, H.K., A.S.P. and S.A.P.; methodology, S.N.R. and I.Y.S.; project administration, H.K. and S.A.P.; supervision, H.K. and S.A.P.; visualization, M.D.M.; writing—original draft, S.N.R., A.S.M., M.A.A. and M.V.S.; writing—review and editing, I.Y.S., T.A.P., Y.F., H.K., A.S.P. and S.A.P. All authors have read and agreed to the published version of the manuscript.
Funding
The study was done under financial support of Russian Foundation for Basic Research (grant# 18-29-21013) and in the frame of the State Assignment to JIHT RAS (topic #075-00892-20-00). T.A.P, H.K., and A.S.P. are supported by JSPS JP 19H00669, Y.F. is supported by JSPS JP 19H00668. H.K., Y.F. and A.S.P. are supported by the QST Director Fund 20.
Institutional Review Board Statement
Not applicable.
Conflicts of Interest
The authors declare no conflict of interest.
References
- Kiriyama, H.; Pirozhkov, A.S.; Nishiuchi, M.; Fukuda, Y.; Ogura, K.; Sagisaka, A.; Miyasaka, Y.; Mori, M.; Sakaki, H.; Dover, N.P.; et al. High-contrast high-intensity repetitive petawatt laser. Opt. Lett. 2018, 43, 2595. [Google Scholar] [CrossRef] [PubMed]
- Faenov, A.Y.; Skobelev, I.Y.; Pikuz, T.A.; Pikuz, S.A.; Fortov, V.E.; Fukuda, Y.; Hayashi, Y.; Pirozhkov, A.; Kotaki, H.; Shimomura, T.; et al. X-ray spectroscopy diagnoses of clusters surviving under prepulses of ultra-intense femtosecond laser pulse irradiation. Laser Part. Beams 2012, 30, 481–488. [Google Scholar] [CrossRef]
- Faenov, A.Y.; Alkhimova, M.A.; Pikuz, T.A.; Skobelev, I.Y.; Nishiuchi, M.; Sakaki, H.; Pirozhkov, A.S.; Sagisaka, A.; Dover, N.P.; Kondo, K.; et al. The effect of laser contrast on generation of highly charged Fe ions by ultra-intense femtosecond laser pulses. Appl. Phys. B 2017, 123, 197. [Google Scholar] [CrossRef]
- Gao, J.; Liu, F.; Ge, X.; Deng, Y.; Zhang, G.; Fang, Y.; Wei, W.; Yang, S.; Yuan, X.; Chen, C.; et al. Influence of laser contrast on high-order harmonic generation from solid-density plasma surfaces. Chinese Opt. Lett. 2017, 15, 081902. [Google Scholar] [CrossRef]
- Doumy, G.; Quéré, F.; Gobert, O.; Perdrix, M.; Martin, P.; Audebert, P.; Gauthier, J.C.; Geindre, J.-P.; Wittmann, T. Complete characterization of a plasma mirror for the production of high-contrast ultraintense laser pulses. Phys. Rev. E 2004, 69, 026402. [Google Scholar] [CrossRef] [PubMed]
- Quéré, F.; Thaury, C.; Monot, P.; Dobosz, S.; Martin, P.; Geindre, J.-P.; Audebert, P. Coherent Wake Emission of High-Order Harmonics from Overdense Plasmas. Phys. Rev. Lett. 2006, 96, 125004. [Google Scholar] [CrossRef]
- Langlois, P.; Ippen, E.P. Measurement of pulse asymmetry by three-photon-absorption autocorrelation in a GaAsP photodiode. Opt. Lett. 1999, 24, 1868. [Google Scholar] [CrossRef]
- Kon, A.; Nishiuchi, M.; Kiriyama, H.; Ogura, K.; Sakaki, H.; Fukuda, Y.; Kando, M.; Kondo, K. Single shot third-order cross-correlator for ultra-high intensity laser. In Proceedings of the 2015 11th Conference on Lasers and Electro-Optics Pacific Rim (CLEO-PR), Busan, Korea, 24–28 August 2015; pp. 1–2. [Google Scholar]
- Amplitude Sequoia. Available online: https://amplitude-laser.com/add_ons/metrology/sequoia (accessed on 7 December 2020).
- Leshchenko, V.E.; Kessel, A.; Jahn, O.; Krüger, M.; Münzer, A.; Trushin, S.A.; Veisz, L.; Major, Z.; Karsch, S. On-target temporal characterization of optical pulses at relativistic intensity. Light Sci. Appl. 2019, 8, 96. [Google Scholar] [CrossRef]
- Crespo, H.M.; Witting, T.; Canhota, M.; Miranda, M.; Tisch, J.W.G. In situ temporal measurement of ultrashort laser pulses at full power during high-intensity laser–matter interactions. Optica 2020, 7, 995. [Google Scholar] [CrossRef]
- Faenov, A.Y.; Oks, E.; Dalimier, E.; Skobelev, I.Y.; Pikuz, S.A.; Pikuz, T.A.; Zhvaniya, I.A.; Fukuda, Y.; Andreev, A.; Koga, J.; et al. X-ray spectral diagnostics of laser harmonic generation in the interaction of relativistic femtosecond laser pulses with clusters. Quantum Electron. 2016, 46, 338–341. [Google Scholar] [CrossRef]
- Ryazantsev, S.N.; Skobelev, I.Y.; Faenov, A.Y.; Pikuz, T.A.; Higginson, D.P.; Chen, S.N.; Revet, G.; Béard, J.; Portugall, O.; Soloviev, A.A.; et al. Diagnostics of laser-produced plasmas based on the analysis of intensity ratios of He-like ions X-ray emission. Phys. Plasmas 2016, 23, 123301. [Google Scholar] [CrossRef]
- Skobelev, I.Y.; Ryazantsev, S.N.; Arich, D.D.; Bratchenko, P.S.; Faenov, A.Y.; Pikuz, T.A.; Durey, P.; Doehl, L.; Farley, D.; Baird, C.D.; et al. X-ray absorption spectroscopy study of energy transport in foil targets heated by petawatt laser pulses. Photonics Res. 2018, 6, 234. [Google Scholar] [CrossRef]
- Oks, E.; Dalimier, E.; Faenov, A.Y.; Angelo, P.; Pikuz, S.A.; Pikuz, T.A.; Skobelev, I.Y.; Ryazanzev, S.N.; Durey, P.; Doehl, L.; et al. In-depth study of intra-Stark spectroscopy in the x-ray range in relativistic laser–plasma interactions. J. Phys. B At. Mol. Opt. Phys. 2017, 50, 245006. [Google Scholar] [CrossRef]
- Faenov, A.Y.; Pikuz, S.A.; Erko, A.I.; Bryunetkin, B.A.; Dyakin, V.M.; Ivanenkov, G.V.; Mingaleev, A.R.; Pikuz, T.A.; Romanova, V.M.; Shelkovenko, T.A. High-Performance X-Ray Spectroscopic Devices for Plasma Microsources Investigations. Phys. Scr. 1994, 50, 333–338. [Google Scholar] [CrossRef]
- Bonté, C.; Harmand, M.; Dorchies, F.; Magnan, S.; Pitre, V.; Kieffer, J.-C.; Audebert, P.; Geindre, J.-P. High dynamic range streak camera for subpicosecond time-resolved x-ray spectroscopy. Rev. Sci. Instrum. 2007, 78, 043503. [Google Scholar] [CrossRef]
- Gu, M.F. Dielectronic Recombination Rate Coefficients for H-like through Ne-like Isosequences of Mg, Si, S, Ar, Ca, Fe, and Ni. Astrophys. J. 2003, 590, 1131–1140. [Google Scholar] [CrossRef]
- Badnell, N.R. Dielectronic Recombination. In Proceedings of the Spectroscopic Challenges of Photoionized Plasmas, ASP Conference Series; Ferland, G., Savin, D.W., Eds.; Astronomical Society of the Pacific: San Francisco, CA, USA, 2001; Volume 247, p. 37. [Google Scholar]
- Ryazantsev, S.N.; Skobelev, I.Y.; Faenov, A.Y.; Pikuz, T.A.; Grum-Grzhimailo, A.N.; Pikuz, S.A. X-ray spectroscopy diagnostics of a recombining plasma in laboratory astrophysics studies. JETP Lett. 2015, 102, 707–712. [Google Scholar] [CrossRef]
- Filippov, E.D.; Skobelev, I.Y.; Revet, G.; Chen, S.N.; Khiar, B.; Ciardi, A.; Khaghani, D.; Higginson, D.P.; Pikuz, S.A.; Fuchs, J. X-ray spectroscopy evidence for plasma shell formation in experiments modeling accretion columns in young stars. Matter Radiat. Extrem. 2019, 4, 064402. [Google Scholar] [CrossRef]
- McLaughlin, D.J.; Hahn, Y. Dielectronic recombination rate coefficients for Fe23+ ion. J. Quant. Spectrosc. Radiat. Transf. 1982, 28, 343–353. [Google Scholar] [CrossRef]
- Rosmey, F.B.; Faenov, A.Y.; Pikuz, T.A.; Skobelev, I.Y.; Stepanov, A.E.; Starostin, A.N.; Rerikh, V.S.; Makhrov, V.A.; Flora, F.; Bollanti, S.; et al. Dominant role of dielectronic satellites in the radiation spectra of a laser plasma near the target surface. J. Exp. Theor. Phys. Lett. 1997, 65, 708–713. [Google Scholar] [CrossRef]
- Faenov, A.Y.; Skobelev, I.Y.; Pikuz, S.A.; Kyrala, G.A.; Fulton, R.D.; Abdallah, J.; Kilcrease, D.P. High-resolution x-ray spectroscopy of a subpicosecond-laser-produced silicon plasma. Phys. Rev. A 1995, 51, 3529–3533. [Google Scholar] [CrossRef] [PubMed]
- Faenov, A.Y.; Pikuz, T.A.; Skobelev, I.Y.; Magunov, A.I.; Efremov, V.P.; Servol, M.; Quéré, F.; Bougeard, M.; Monot, P.; Martin, P.; et al. X-ray spectroscopic observations of a superdense plasma in nanoparticles irradiated by superintense femtosecond laser radiation. J. Exp. Theor. Phys. Lett. 2004, 80, 730–733. [Google Scholar] [CrossRef]
- Macfarlane, J.J.; Golovkin, I.E.; Woodruff, P.R.; Welch, D.R.; Oliver, B.V.; Melhorn, T.A.; Campbell, R.B. Simulation of the Ionization Dynamics of Aluminum Irradiated by Intense Short-Pulse Lasers. In Proceedings of the Inertial Fusion Sciences and Applications 2003 (IFSA 2003): State of the Art 2003; Hammel, B.A., Meyerhofer, D.D., Meyer-ter-Vehn, J., Azechi, H., Eds.; American Nuclear Society: La Grange Park, IL, USA, 2004; p. 457. [Google Scholar]
- Gamaly, E.G.; Rode, A.V.; Luther-Davies, B.; Tikhonchuk, V.T. Ablation of solids by femtosecond lasers: Ablation mechanism and ablation thresholds for metals and dielectrics. Phys. Plasmas 2002, 9, 949. [Google Scholar] [CrossRef]
Publisher’s Note: MDPI stays neutral with regard to jurisdictional claims in published maps and institutional affiliations. |
© 2021 by the authors. Licensee MDPI, Basel, Switzerland. This article is an open access article distributed under the terms and conditions of the Creative Commons Attribution (CC BY) license (http://creativecommons.org/licenses/by/4.0/).