
Two-Dimensional Composite Acoustic Metamaterials of Rectangular Unit Cell from Pentamode to Band Gap


Abstract
1. Introduction
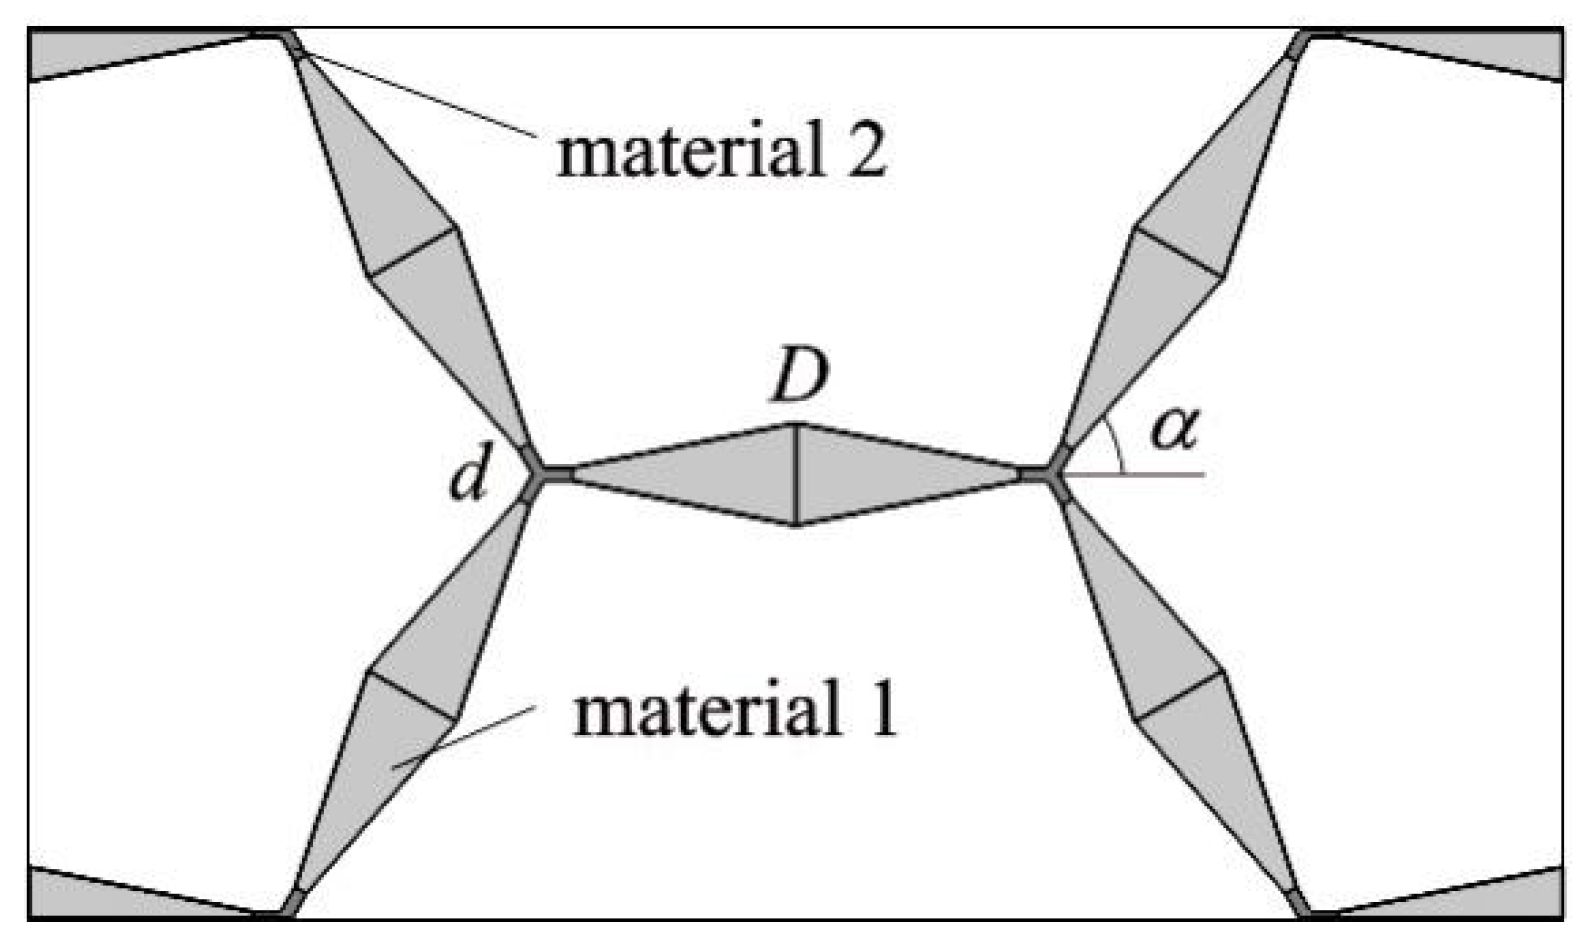
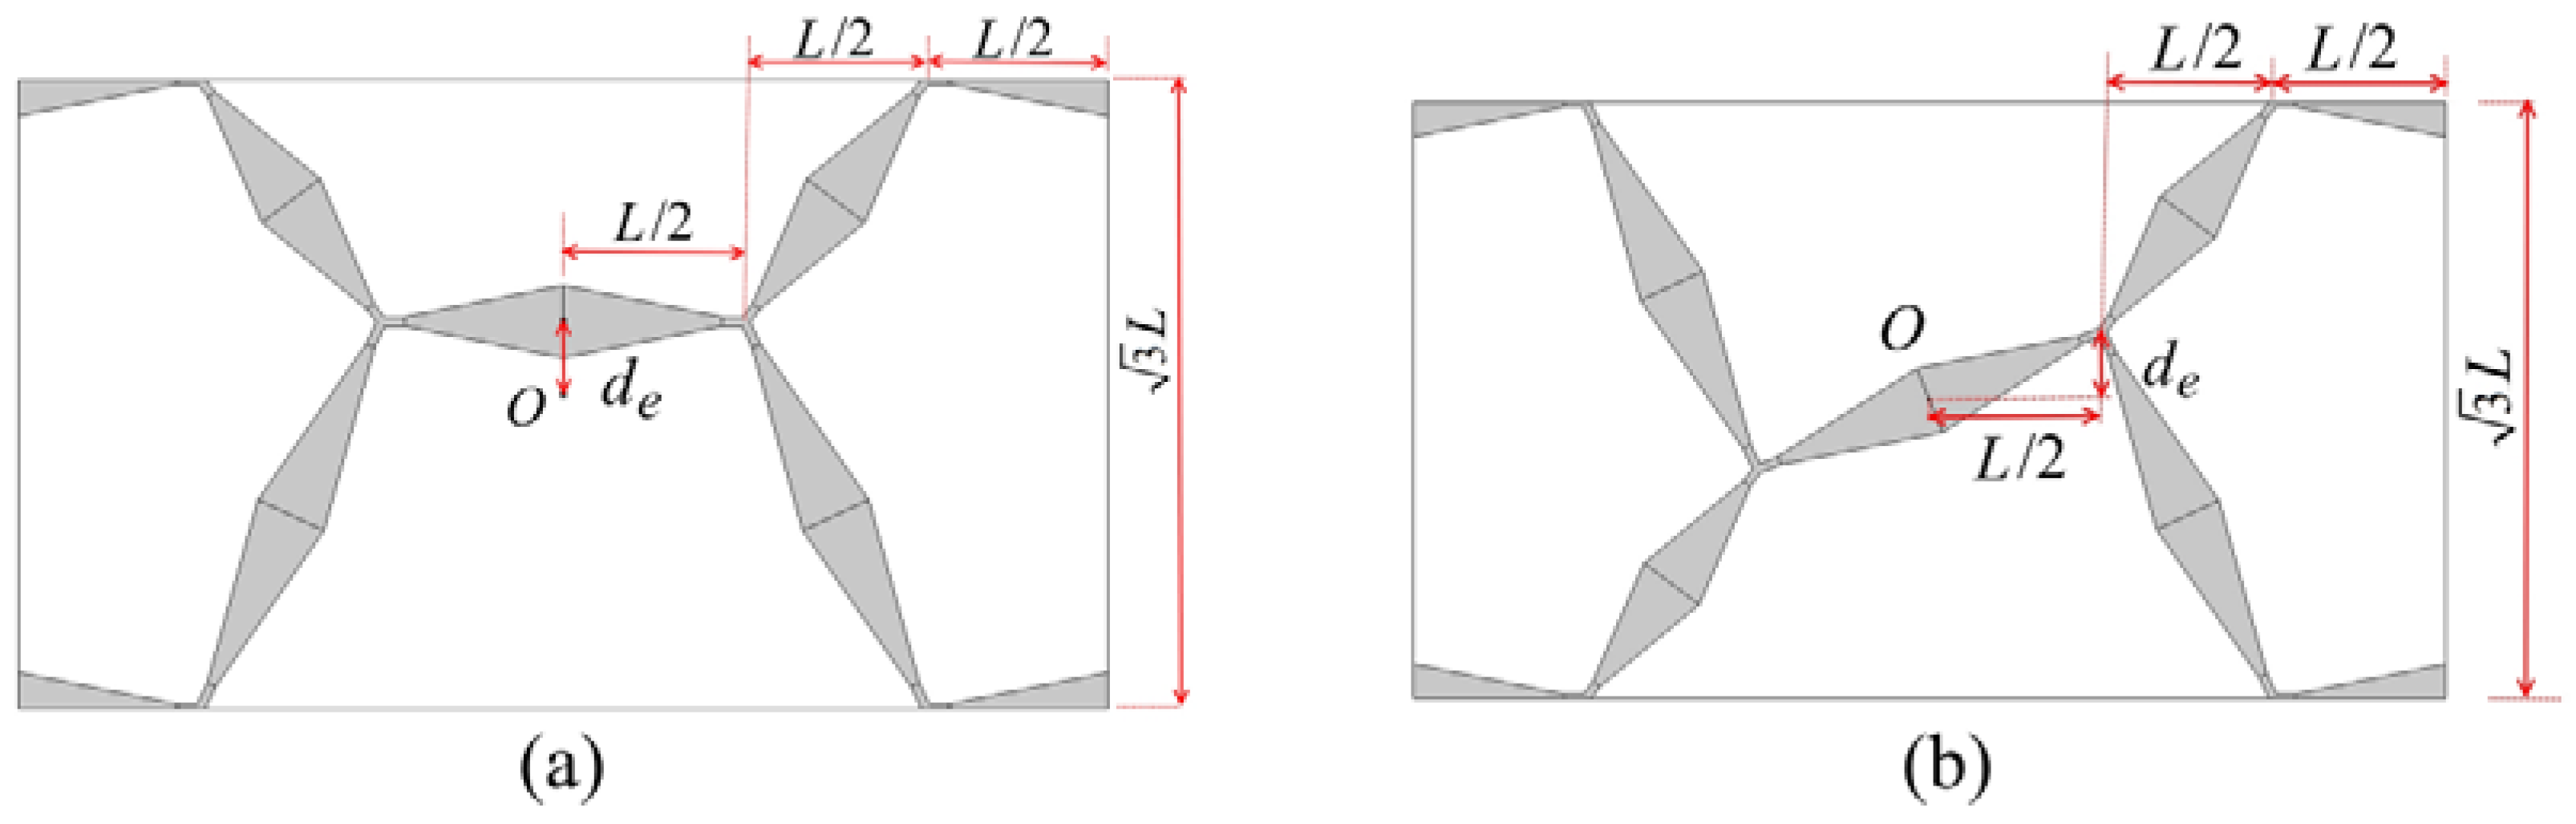
2. Geometric Models
3. Properties of Models with Uniform Arms
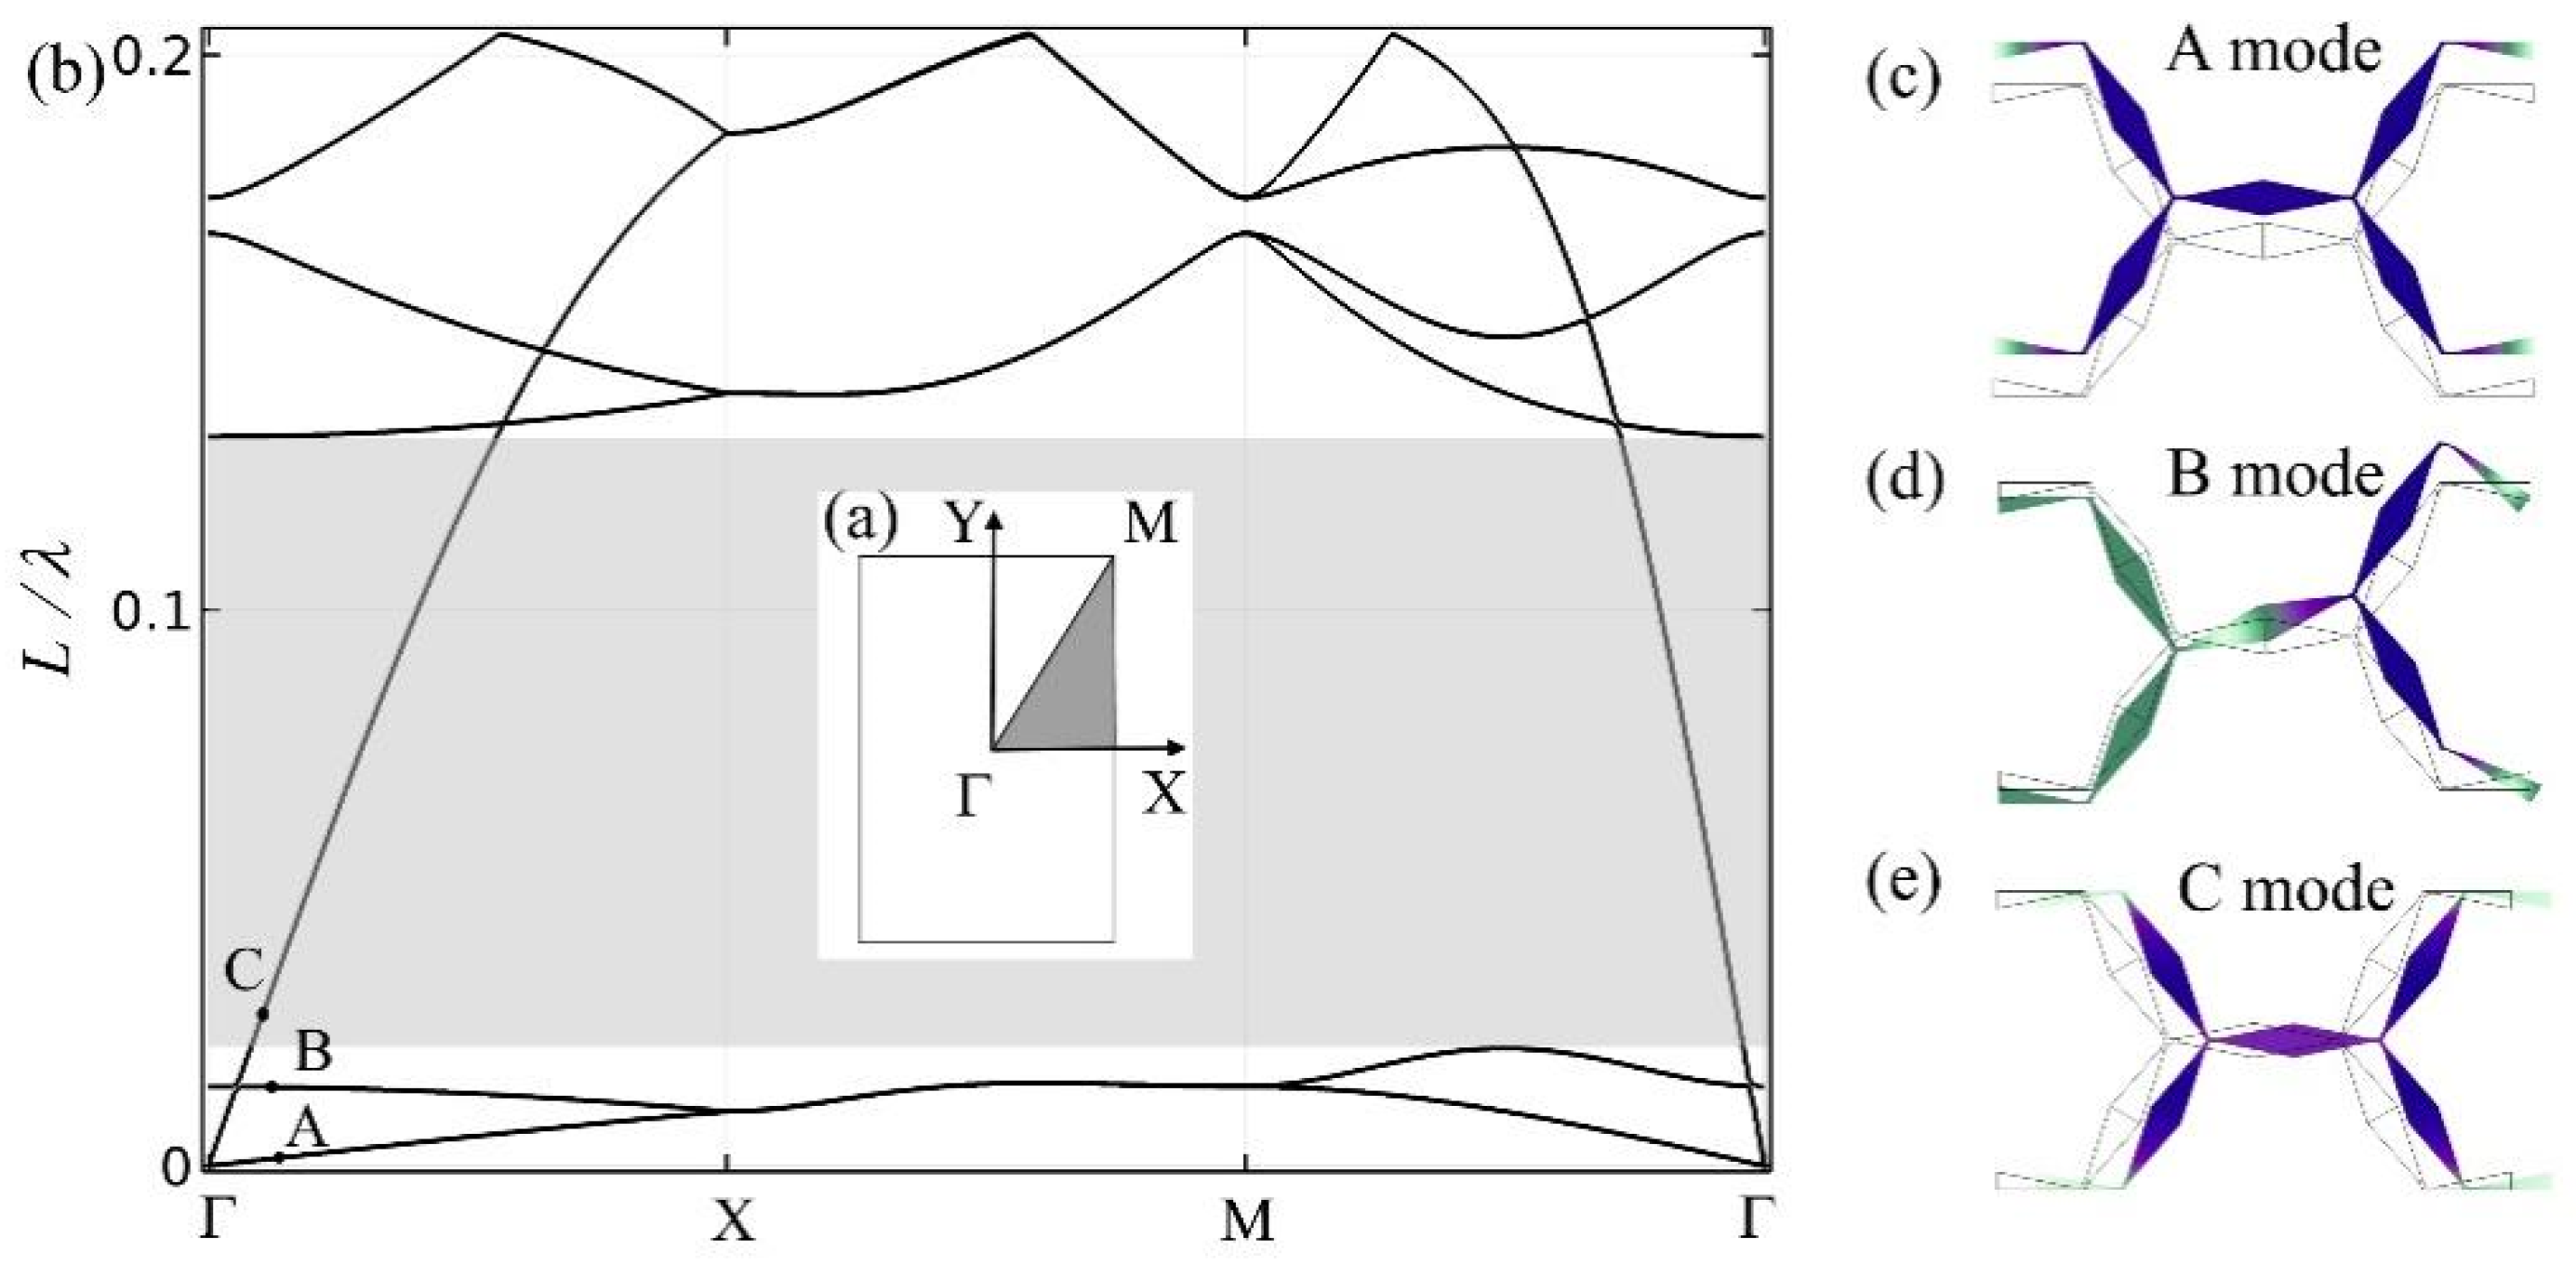
3.1. Phononic Band Structures
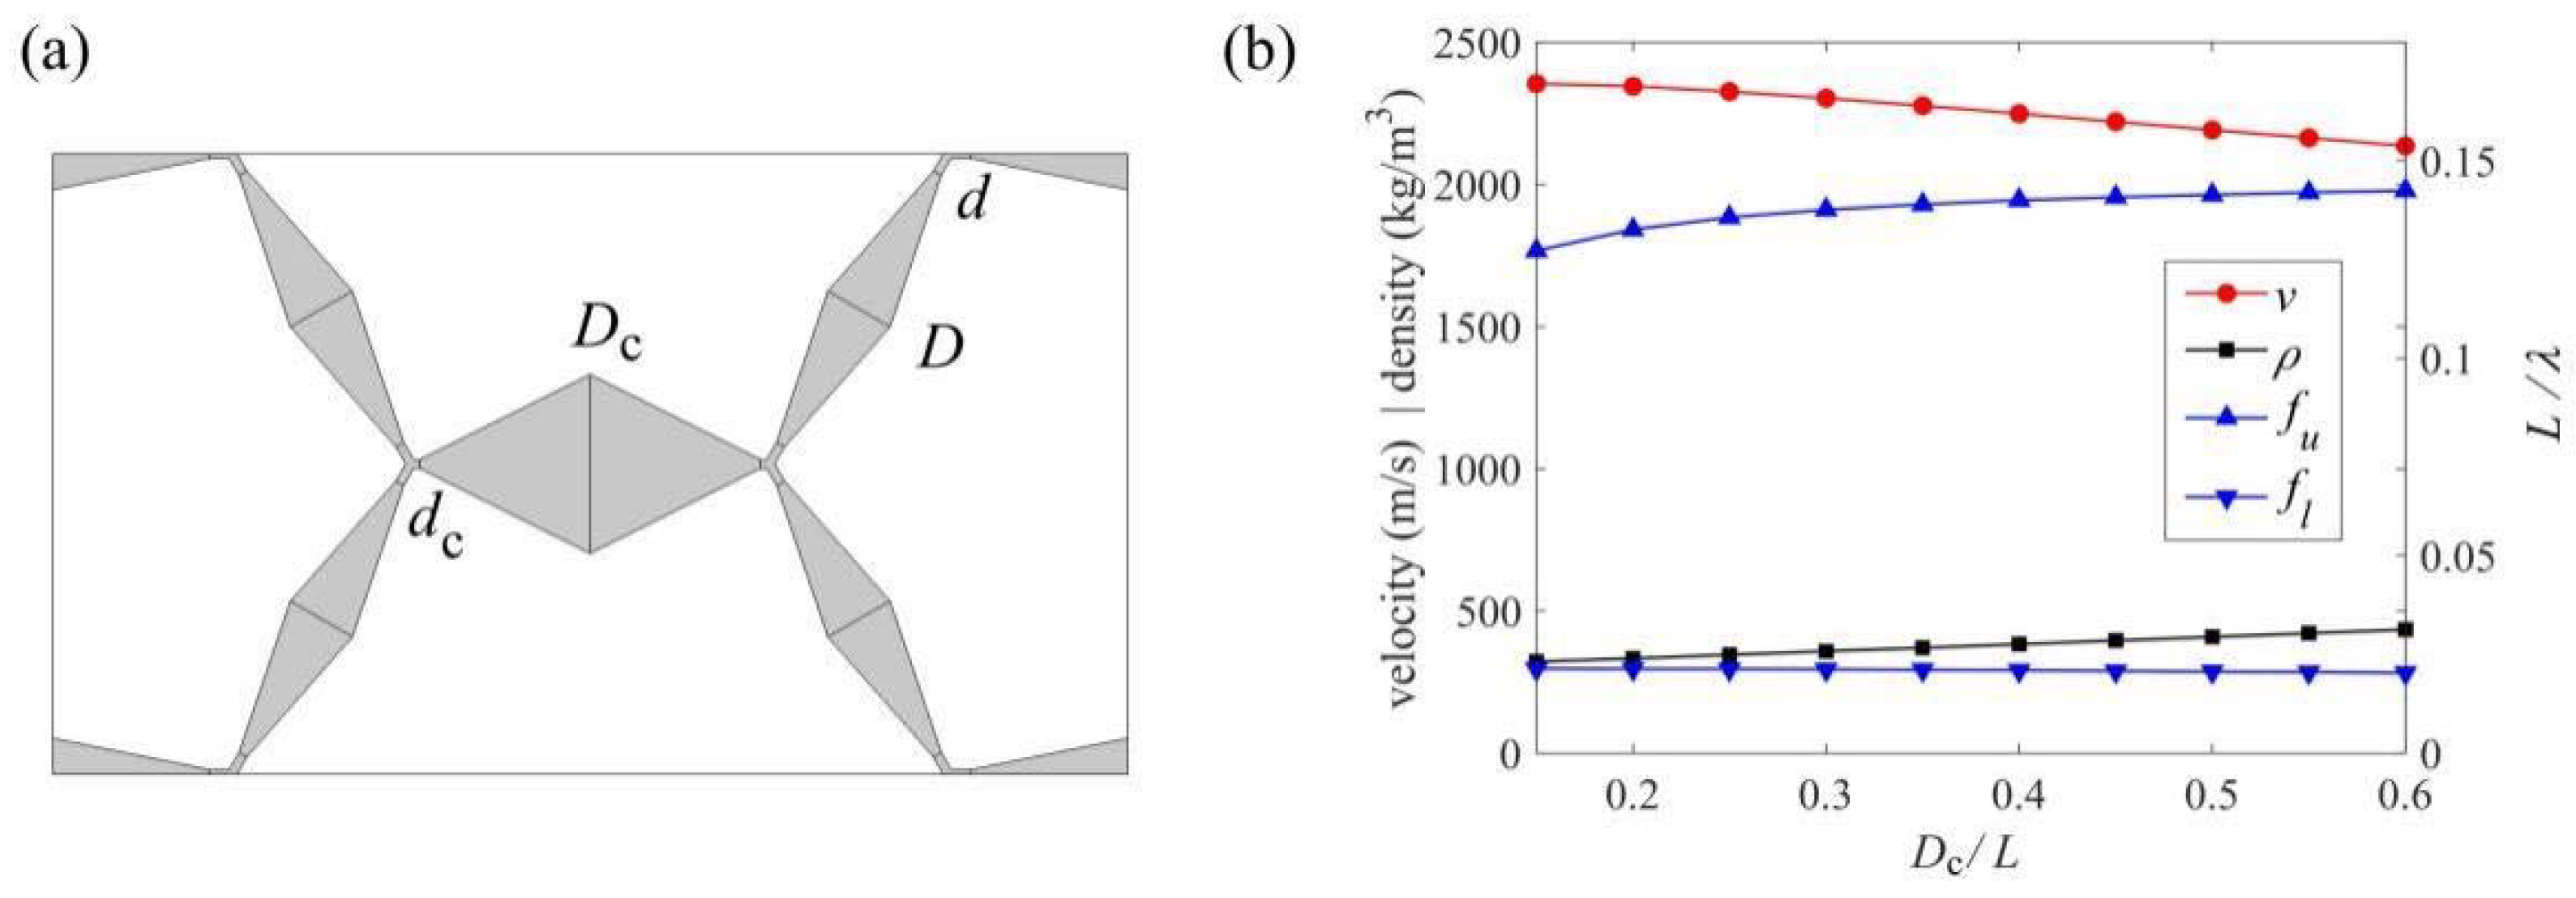
3.2. Effective Velocities and Pentamode Bands with d and D
3.3. Anisotropy
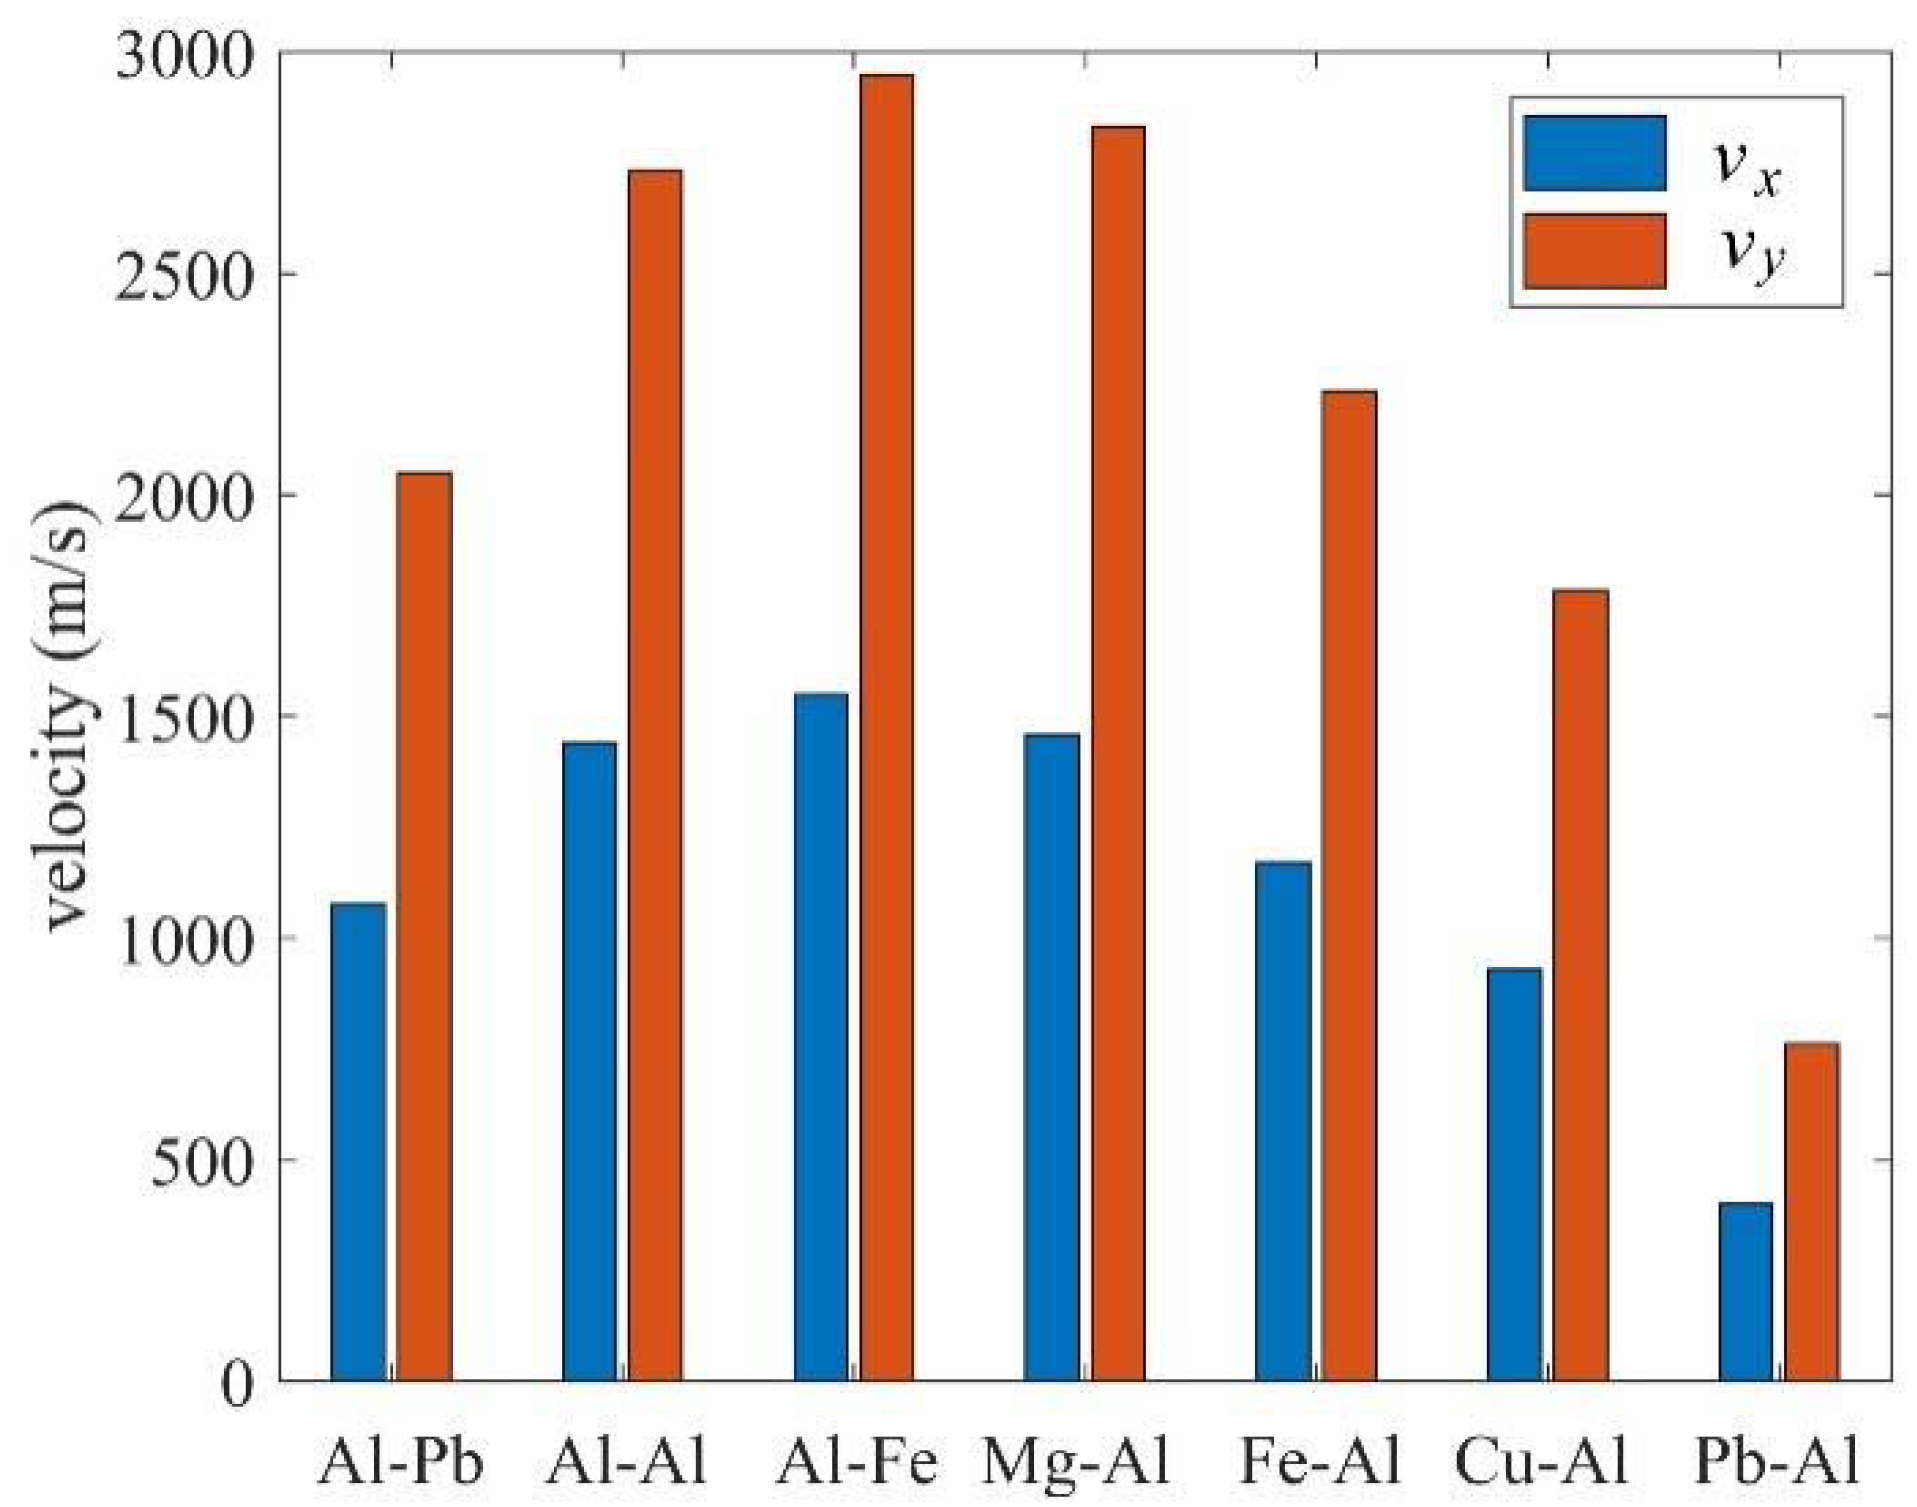
3.4. Effects of Materials
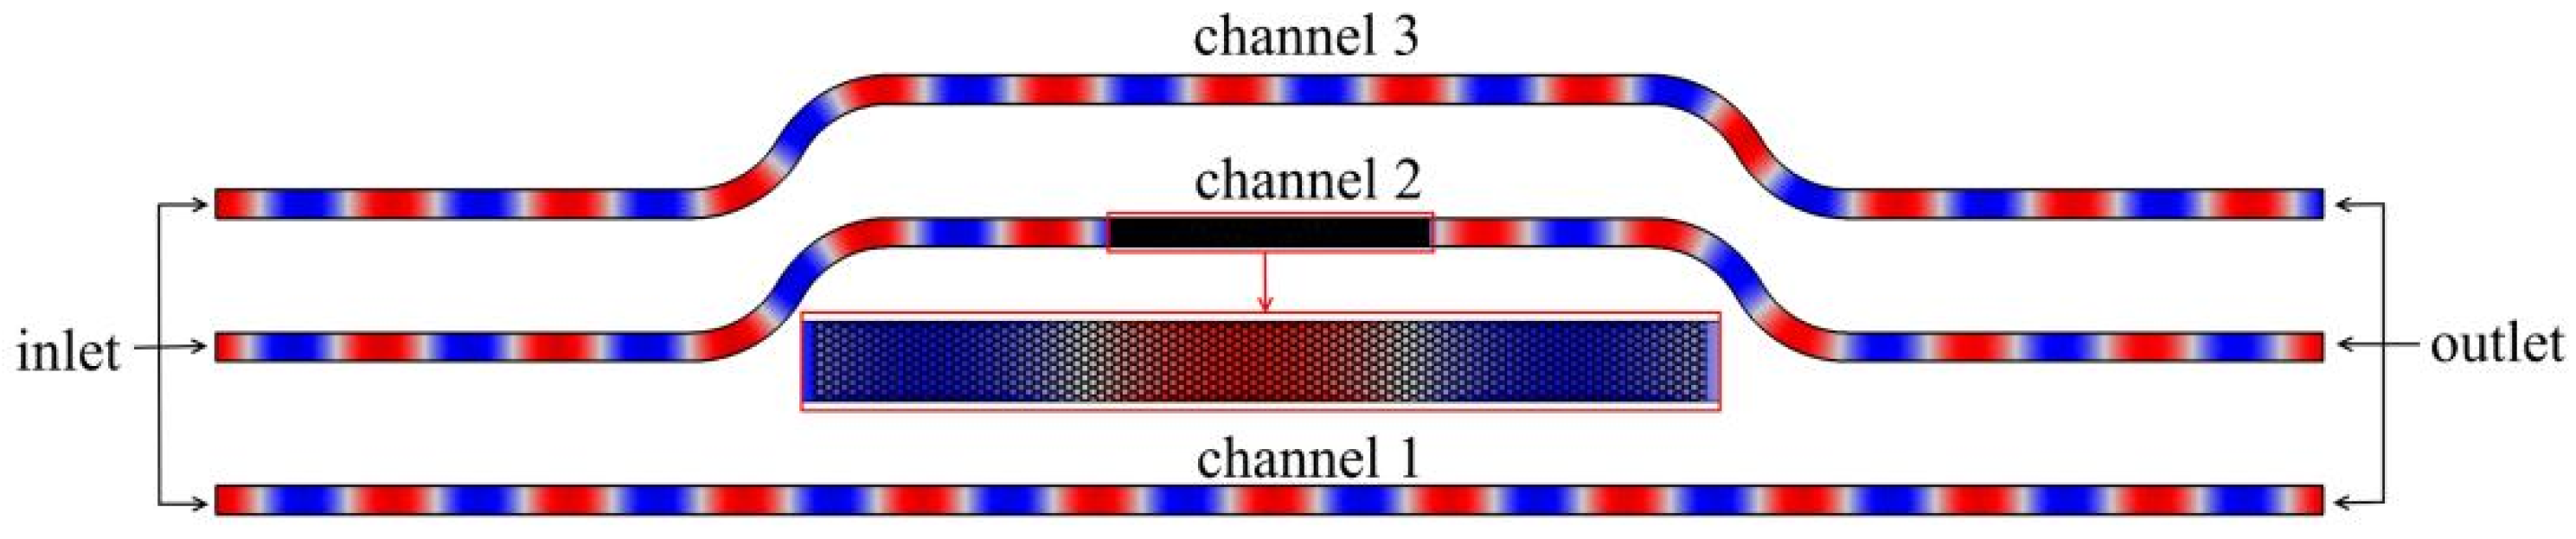
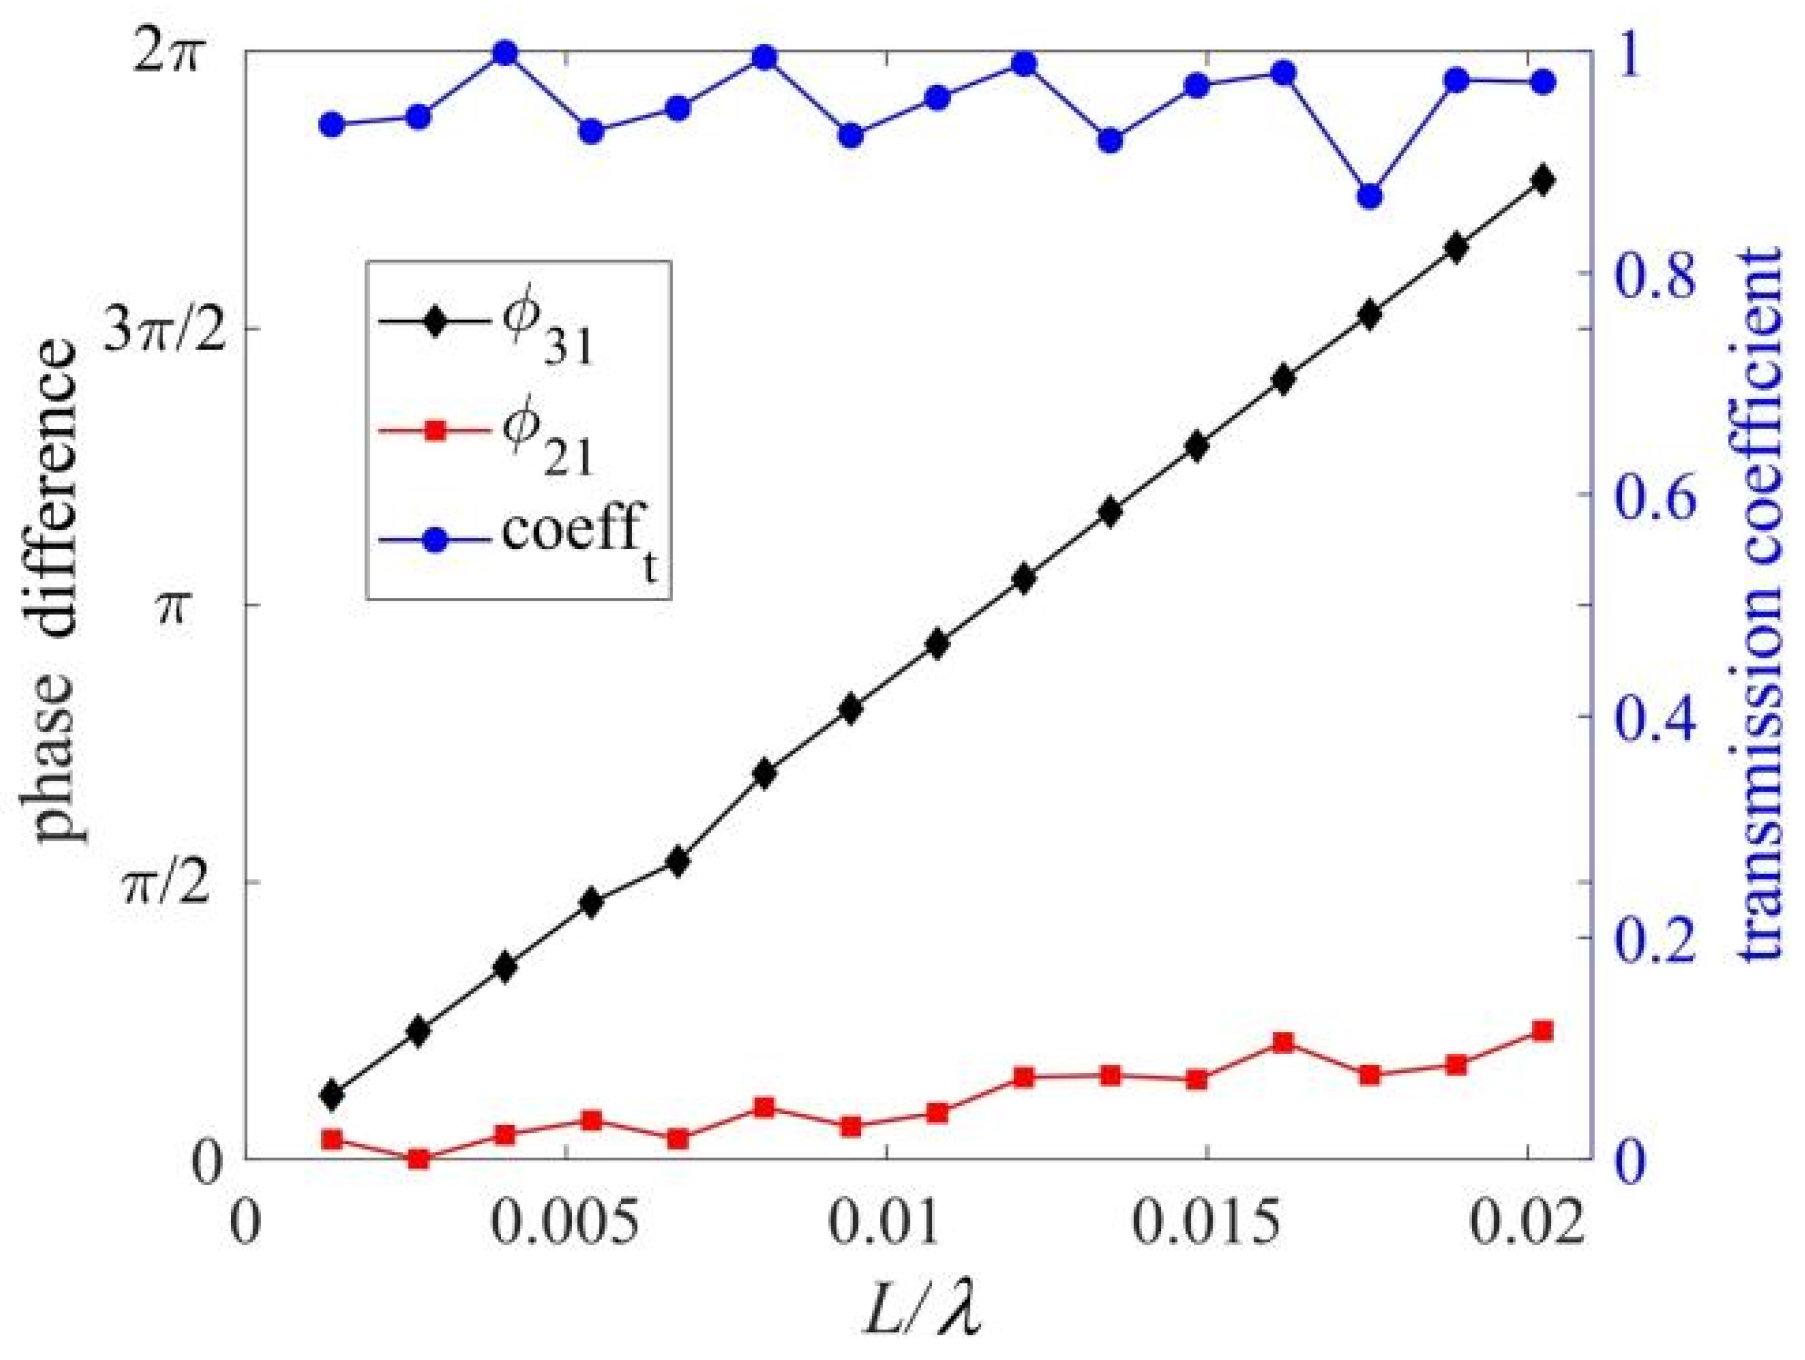
3.5. Simulation of an Application Example
4. Properties of Models with Non-Uniform Arms
4.1. Changing Dimensions of the Centre Arm
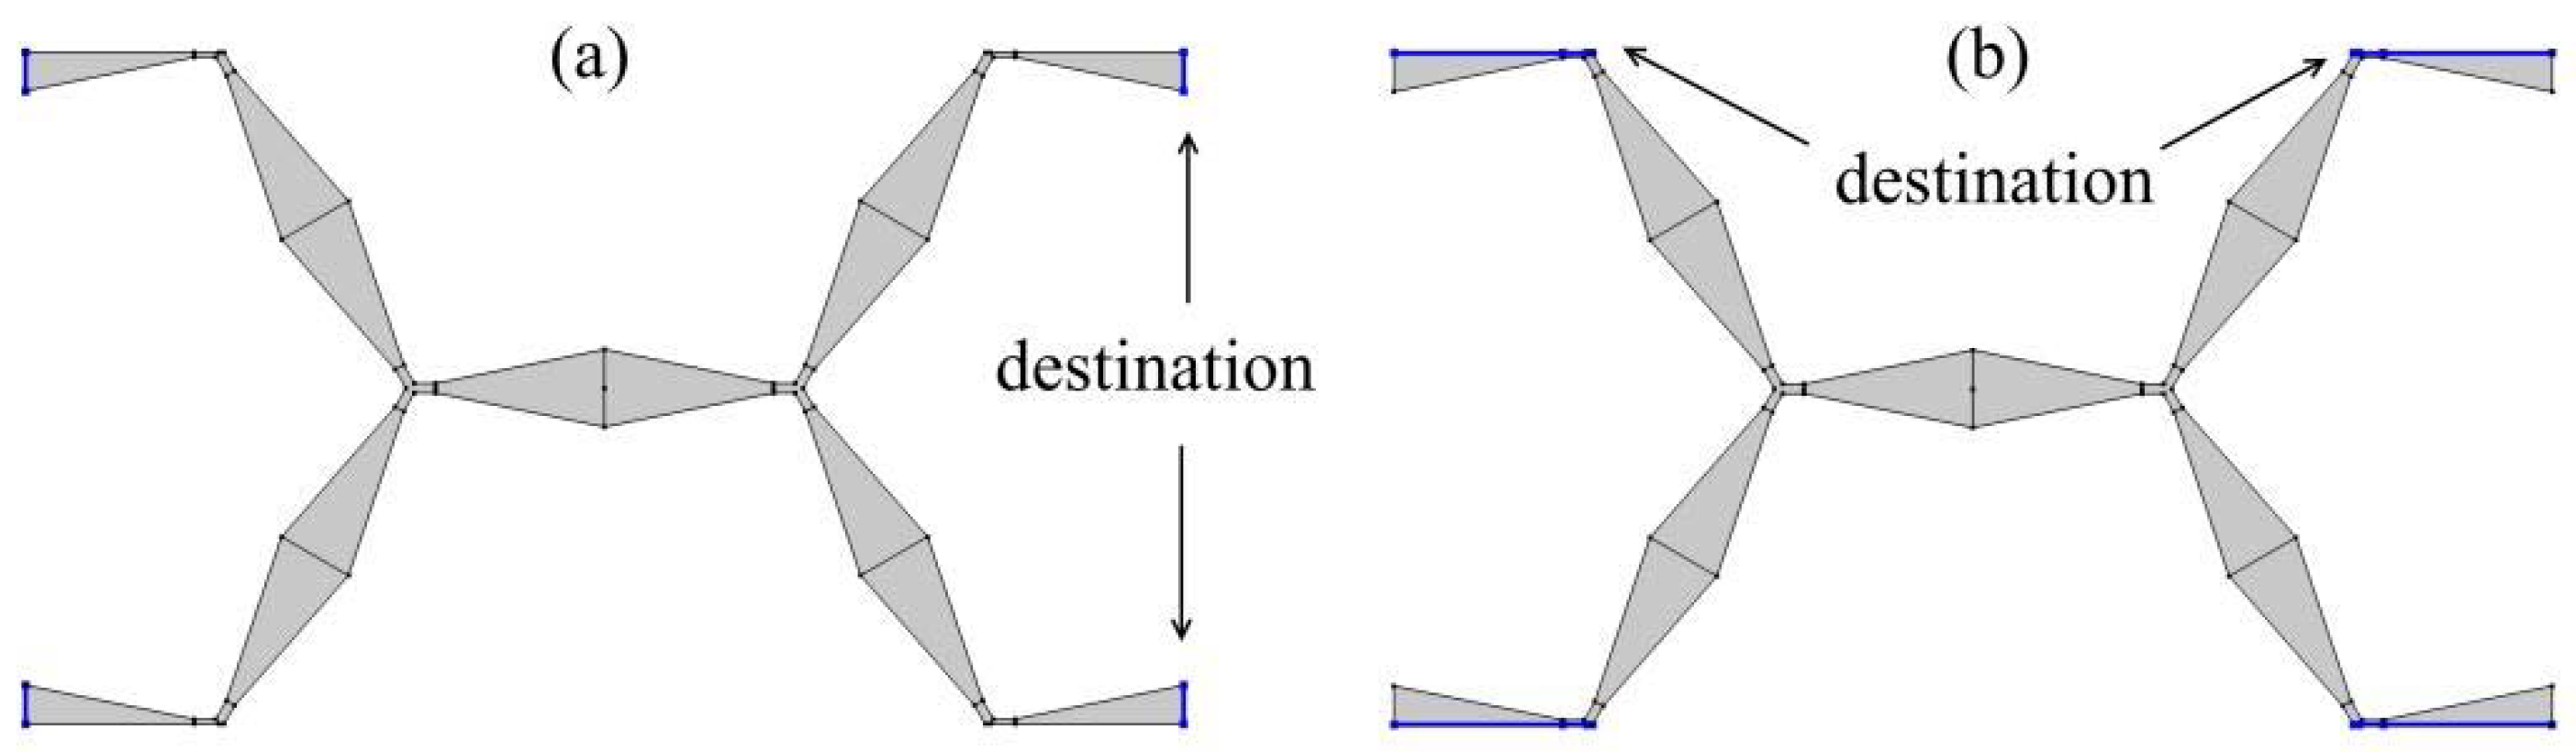
4.2. Moving the Two Connection Points in the Same Direction
4.3. Moving the Two Connection Points in Opposite Directions
4.4. Simulation of Examples
5. Conclusions
Author Contributions
Funding
Data Availability Statement
Acknowledgments
Conflicts of Interest
References
- Cummer, S.A.; Christensen, J.; Alù, A. Controlling sound with acoustic metamaterials. Nat. Rev. Mater. 2016, 1, 1–13. [Google Scholar] [CrossRef]
- Milton, G.W.; Cherkaev, A.V. Which elasticity tensors are realizable? J. Eng. Mater. Technol. 1995, 117, 483–493. [Google Scholar] [CrossRef]
- Norris, A.N. Acoustic cloaking theory. Proc. R. Soc. A Math. Phys. Eng. Sci. 2008, 464, 2411–2434. [Google Scholar] [CrossRef]
- Martin, A.; Kadic, M.; Schittny, R.; Bückmann, T.; Wegener, M. Phonon band structures of three-dimensional pentamode metamaterials. Phys. Rev. B 2012, 86, 155116. [Google Scholar] [CrossRef]
- Kadic, M.; Bückmann, T.; Schittny, R.; Wegener, M. On anisotropic versions of three-dimensional pentamode metamaterials. New J. Phys. 2013, 15, 023029. [Google Scholar] [CrossRef]
- Cai, C.; Guo, R.; Wang, X.; Sun, F.; Wang, Z.; Xu, Z. Effect of anisotropy on phononic band structure and figure of merit of pentamode metamaterials. J. Appl. Phys. 2020, 127, 124903. [Google Scholar] [CrossRef]
- Huang, Y.; Lu, X.; Liang, G.; Xu, Z. Comparative study of the pentamodal property of four potential pentamode microstructures. J. Appl. Phys. 2017, 121, 125110. [Google Scholar] [CrossRef]
- Li, Q.; Vipperman, J. Three-dimensional pentamode acoustic metamaterials with hexagonal unit cells. J. Acoust. Soc. Am. 2019, 145, 1372–1377. [Google Scholar] [CrossRef]
- Wang, G.; Jin, L.; Zhang, L.; Xu, Z. Phonon band structures of the three dimensional latticed pentamode metamaterials. AIP Adv. 2017, 7, 025309. [Google Scholar] [CrossRef]
- Huang, Y.; Lu, X.; Liang, G.; Xu, Z. Pentamodal property and acoustic band gaps of pentamode metamaterials with different cross-section shapes. Phys. Lett. A 2016, 380, 1334–1338. [Google Scholar] [CrossRef]
- Cai, C.; Wang, Z.; Li, Q.; Xu, Z.; Tian, X. Pentamode metamaterials with asymmetric double-cone elements. J. Phys. D Appl. Phys. 2015, 48, 175103. [Google Scholar] [CrossRef]
- Wang, Z.; Cai, C.; Li, Q.; Li, J.; Xu, Z. Pentamode metamaterials with tunable acoustics band gaps and large figures of merit. J. Appl. Phys. 2016, 120, 024903. [Google Scholar] [CrossRef]
- Wang, Z.; Chu, Y.; Cai, C.; Liu, G.; Wang, M.R. Composite pentamode metamaterials with low frequency locally resonant Characteristics. J. Appl. Phys. 2017, 122, 025114. [Google Scholar] [CrossRef]
- Li, Q.; Zhang, M. Composite hexagonal pentamode acoustic metamaterials with tailored properties. J. Phys. Condes. Matter 2020, 32, 475701. [Google Scholar] [CrossRef]
- Kadic, M.; Bückmann, T.; Schittny, R.; Gumbsch, P.; Wegener, M. Pentamode metamaterials with independently tailored bulk modulus and mass density. Phys. Rev. Appl. 2014, 2, 054007. [Google Scholar] [CrossRef]
- Amendola, A.; Carpentieri, G.; Feo, L.; Fraternali, F. Bending dominated response of layered mechanical metamaterials alternating pentamode lattices and confinement plates. Compos. Struct. 2016, 157, 71–77. [Google Scholar] [CrossRef]
- Krushynska, A.O.; Galich, P.; Bosia, F.; Pugno, N.M.; Rudykh, S. Hybrid metamaterials combining pentamode lattices and phononic plates. Appl. Phys. Lett. 2018, 113, 201901. [Google Scholar] [CrossRef]
- Hedayati, R.; Leeflang, A.M.; Zadpoor, A.A. Additively manufactured metallic pentamode meta-materials. Appl. Phys. Lett. 2017, 110, 091905. [Google Scholar] [CrossRef]
- Mohammadi, K.; Movahhedy, M.R.; Shishkovsky, I.; Hedayati, R. Hybrid anisotropic pentamode mechanical metamaterial produced by additive manufacturing technique. Appl. Phys. Lett. 2020, 117, 061901. [Google Scholar] [CrossRef]
- Kadic, M.; Bückmann, T.; Stenger, N.; Thiel, M.; Wegener, M. On the practicability of pentamode mechanical metamaterials. Appl. Phys. Lett. 2012, 100, 191901. [Google Scholar] [CrossRef]
- Cai, X.; Wang, L.; Zhao, Z.; Zhao, A.; Zhang, X.; Wu, T.; Chen, H. The mechanical and acoustic properties of two-dimensional pentamode metamaterials with different structural parameters. Appl. Phys. Lett. 2016, 109, 131904. [Google Scholar] [CrossRef]
- Zhang, L.; Song, B.; Zhao, A.; Liu, R.; Yang, L.; Shi, Y. Study on mechanical properties of honeycomb pentamode structures fabricated by laser additive manufacturing: Numerical simulation and experimental verification. Compos. Struct. 2019, 226, 111199. [Google Scholar] [CrossRef]
- Zhao, A.; Zhao, Z.; Zhang, X.; Cai, X.; Wang, L.; Wu, T.; Chen, H. Design and experimental verification of a water-like pentamode material. Appl. Phys. Lett. 2017, 110, 011907. [Google Scholar] [CrossRef]
- Layman, C.N.; Naify, C.J.; Martin, T.P.; Calvo, D.C.; Orris, G.J. Highly anisotropic elements for acoustic pentamode applications. Phys. Rev. Lett. 2013, 111, 024302. [Google Scholar] [CrossRef] [PubMed]
- Dong, H.W.; Zhao, S.D.; Miao, X.B.; Shen, C.; Zhang, X.; Zhao, Z.; Zhang, C.; Wang, Y.S.; Cheng, L. Customized broadband pentamode metamaterials by topology optimization. J. Mech. Phys. Solids 2021, 152, 104407. [Google Scholar] [CrossRef]
- Zhao, A.; Zhang, X.; Yu, W.; Zhao, Z.; Cai, X.; Chen, H. Design and simulation of broadband multiphase pentamode metamaterials. Appl. Phys. Lett. 2021, 118, 224103. [Google Scholar] [CrossRef]
- Su, X.; Norris, A.N.; Cushing, C.W.; Haberman, M.R.; Wilson, P.S. Broadband focusing of underwater sound using a transparent pentamode lens. J. Acoust. Soc. Am. 2017, 141, 4408–4417. [Google Scholar] [CrossRef]
- Zhang, L.; Song, B.; Liu, R.; Zhao, A.; Zhang, J.; Zhuo, L.; Tang, G.; Shi, Y. Effects of structural parameters on the Poisson’s ratio and compressive modulus of 2D pentamode structures fabricated by selective laser melting. Engineering 2020, 6, 56–67. [Google Scholar] [CrossRef]
- Tian, Y.; Wei, Q.; Cheng, Y.; Xu, Z.; Liu, X. Broadband manipulation of acoustic wavefronts by pentamode metasurface. Appl. Phys. Lett. 2015, 107, 221906. [Google Scholar] [CrossRef]
- Chu, Y.; Wang, Z.; Xu, Z. Broadband high-efficiency controllable asymmetric propagation by pentamode acoustic metasurface. Phys. Lett. A 2020, 384, 126230. [Google Scholar] [CrossRef]
- Chen, J.; Liu, J.; Liu, X. Broadband underwater acoustic carpet cloak based on pentamode materials under normal incidence. AIP Adv. 2018, 8, 085024. [Google Scholar] [CrossRef]
- Chen, Y.; Liu, X.; Hu, G. Latticed pentamode acoustic cloak. Sci. Rep. 2015, 5, 15745. [Google Scholar] [CrossRef] [PubMed]
- Sun, Z.; Jia, H.; Chen, Y.; Wang, Z.; Yang, J. Design of an underwater acoustic bend by pentamode metafluid. J. Acoust. Soc. Am. 2018, 143, 1029–1034. [Google Scholar] [CrossRef]
- Lu, Z.M.; Cai, L.; Wen, J.H.; Chen, X. Physically realizable broadband acoustic metamaterials with anisotropic density. Chin. Phys. Lett. 2019, 36, 024301. [Google Scholar] [CrossRef]
- Sun, Z.; Shi, Y.; Sun, X.; Jia, H.; Jin, Z.; Deng, K.; Yang, J. Underwater acoustic multiplexing communication by pentamode metasurface. J. Phys. D Appl. Phys. 2021, 54, 205303. [Google Scholar] [CrossRef]
- Hladky-Hennion, A.C.; Vasseur, J.O.; Haw, G.; Croënne, C.; Haumesser, L.; Norris, A.N. Negative refraction of acoustic waves using a foam-like metallic structure. Appl. Phys. Lett. 2013, 102, 144103. [Google Scholar] [CrossRef]
- Liu, Z.; Zhang, X.; Mao, Y.; Zhu, Y.Y.; Yang, Z.; Chan, C.T.; Sheng, P. Locally resonant sonic materials. Science 2000, 289, 1734–1736. [Google Scholar] [CrossRef]
- Fang, N.; Xi, D.; Xu, J.; Ambati, M.; Srituravanich, W.; Sun, C.; Zhang, X. Ultrasonic metamaterials with negative modulus. Nat. Mater. 2006, 5, 452–456. [Google Scholar] [CrossRef]
- Sharma, G.S.; Skvortsov, A.; MacGillivray, I.; Kessissoglou, N. Sound scattering by a bubble metasurface. Phys. Rev. B 2020, 102, 214308. [Google Scholar] [CrossRef]
- Skvortsov, A.; Sharma, G.S.; MacGillivray, I.; Kessissoglou, N. Sound absorption by a metasurface comprising hard spheres in a soft medium. J. Acoust. Soc. Am. 2021, 150, 1448–1452. [Google Scholar] [CrossRef]
- Huang, Z.-G.; Su, C.-F. Band gap effects in a two-dimensional regular polygonal graphene-like structure. Cryst. Struct. Theory Appl. 2014, 3, 10–21. [Google Scholar] [CrossRef][Green Version]
- Cai, C.; Wang, Z.; Chu, Y.; Liu, G.; Xu, Z. The phononic band gaps of Bragg scattering and locally resonant pentamode metamaterials. J. Phys. D Appl. Phys. 2017, 50, 415105. [Google Scholar] [CrossRef]
- Cai, C.; Han, C.; Wu, J.; Wang, Z.; Zhang, Q. Tuning method of phononic band gaps of locally resonant pentamode metamaterials. J. Phys. D Appl. Phys. 2018, 52, 045601. [Google Scholar] [CrossRef]
- Axmann, W.; Kuchment, P. An efficient finite element method for computing spectra of photonic and acoustic band-gap materials—I. Scalar case. J. Comput. Phys. 1999, 150, 468–481. [Google Scholar] [CrossRef]
- Li, J.-B.; Wang, Y.-S.; Zhang, C. Dispersion relations of a periodic array of fluid-filled holes embedded in an elastic solid. J. Comput. Acoust. 2012, 20, 525–541. [Google Scholar] [CrossRef]
- Zheng, H.; Yang, Z.; Zhang, C.; Tyrer, M. A local radial basis function collocation method for band structure computation of phononic crystals with scatterers of arbitrary geometry. Appl. Math. Model. 2018, 60, 447–459. [Google Scholar] [CrossRef]
- Zheng, H.; Zhang, C.; Yang, Z. A local radial basis function collocation method for band structure computation of 3D phononic crystals. Appl. Math. Model. 2020, 77, 1954–1964. [Google Scholar] [CrossRef]
- Zheng, H.; Zhou, C.; Yan, D.-J.; Wang, Y.-S.; Zhang, C. A meshless collocation method for band structure simulation of nanoscale phononic crystals based on nonlocal elasticity theory. J. Comput. Phys. 2020, 408, 109268. [Google Scholar] [CrossRef]


Publisher’s Note: MDPI stays neutral with regard to jurisdictional claims in published maps and institutional affiliations. |
© 2021 by the authors. Licensee MDPI, Basel, Switzerland. This article is an open access article distributed under the terms and conditions of the Creative Commons Attribution (CC BY) license (https://creativecommons.org/licenses/by/4.0/).
Share and Cite
Li, Q.; Wu, K.; Zhang, M. Two-Dimensional Composite Acoustic Metamaterials of Rectangular Unit Cell from Pentamode to Band Gap. Crystals 2021, 11, 1457. https://doi.org/10.3390/cryst11121457
Li Q, Wu K, Zhang M. Two-Dimensional Composite Acoustic Metamaterials of Rectangular Unit Cell from Pentamode to Band Gap. Crystals. 2021; 11(12):1457. https://doi.org/10.3390/cryst11121457
Chicago/Turabian StyleLi, Qi, Ke Wu, and Mingquan Zhang. 2021. "Two-Dimensional Composite Acoustic Metamaterials of Rectangular Unit Cell from Pentamode to Band Gap" Crystals 11, no. 12: 1457. https://doi.org/10.3390/cryst11121457
APA StyleLi, Q., Wu, K., & Zhang, M. (2021). Two-Dimensional Composite Acoustic Metamaterials of Rectangular Unit Cell from Pentamode to Band Gap. Crystals, 11(12), 1457. https://doi.org/10.3390/cryst11121457