
Effect of Curing Conditions on the Strength Development of Alkali-Activated Mortar


Abstract
:1. Introduction
2. Experiment
2.1. Raw Materials and Specimen Preparation
2.1.1. Raw Materials
2.1.2. Specimen Preparation
2.2. Curing Condition
- ➢
- Standard curing (B): The specimens were placed in a 20 ± 5 °C environment for 24 h after casting, then they were demolded, numbered, and placed into a standard curing room (temperature = 20 ± 2 °C, relative humidity ≥ 95%) until a specified age;
- ➢
- Steam curing (Z): After casting, the specimens were directly steam cured at 60 °C (Z60) and 80 °C (Z80) until a specified age;
- ➢
- Oven curing (H): The specimens were first placed in an 80 °C steam curing box for 6 h to reach a certain strength and then demolded, numbered, and moved to the oven at 60 °C (H60) and 80 °C (H80) for curing until the test age.
2.3. Test Method
2.3.1. Strength Test
2.3.2. Fourier Transform Infrared Spectroscopy (FTIR)
2.3.3. Scanning Electron Microscopy-Electron Dispersive Spectrometry (SEM-EDS)
2.3.4. Brunner Emmet Teller (BET) Measurement
3. Results and Discussion
3.1. Strength Test
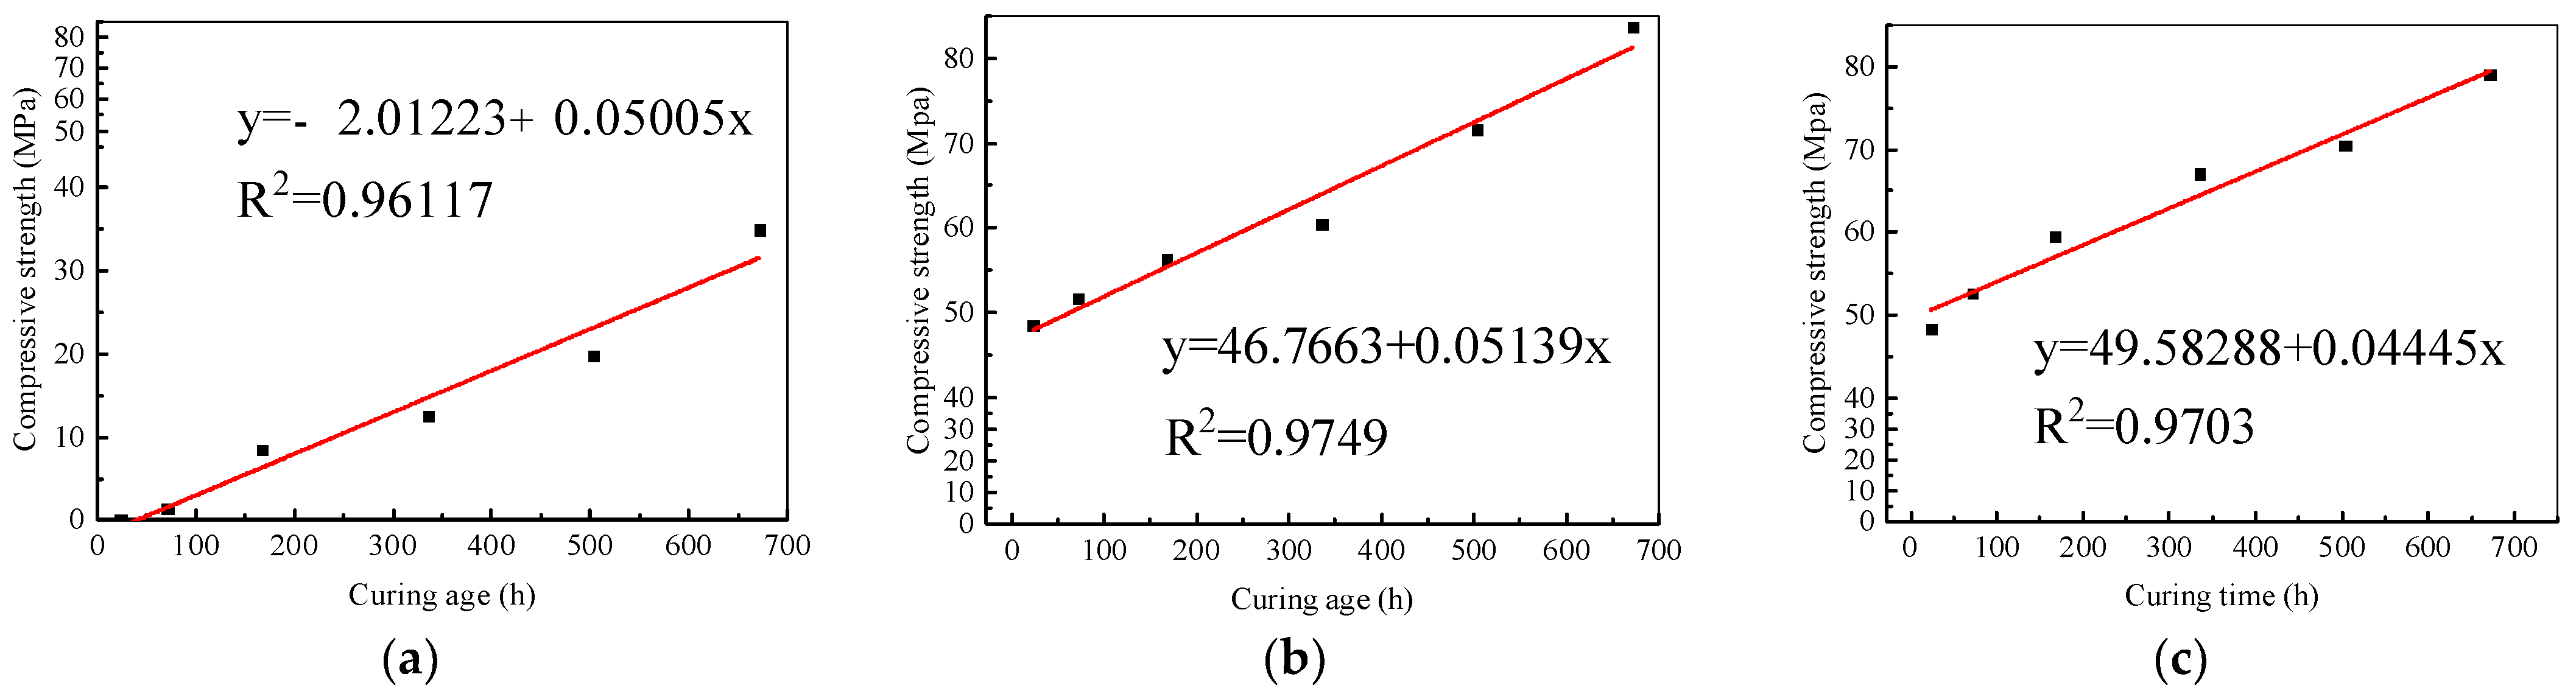
3.1.1. Standard Curing
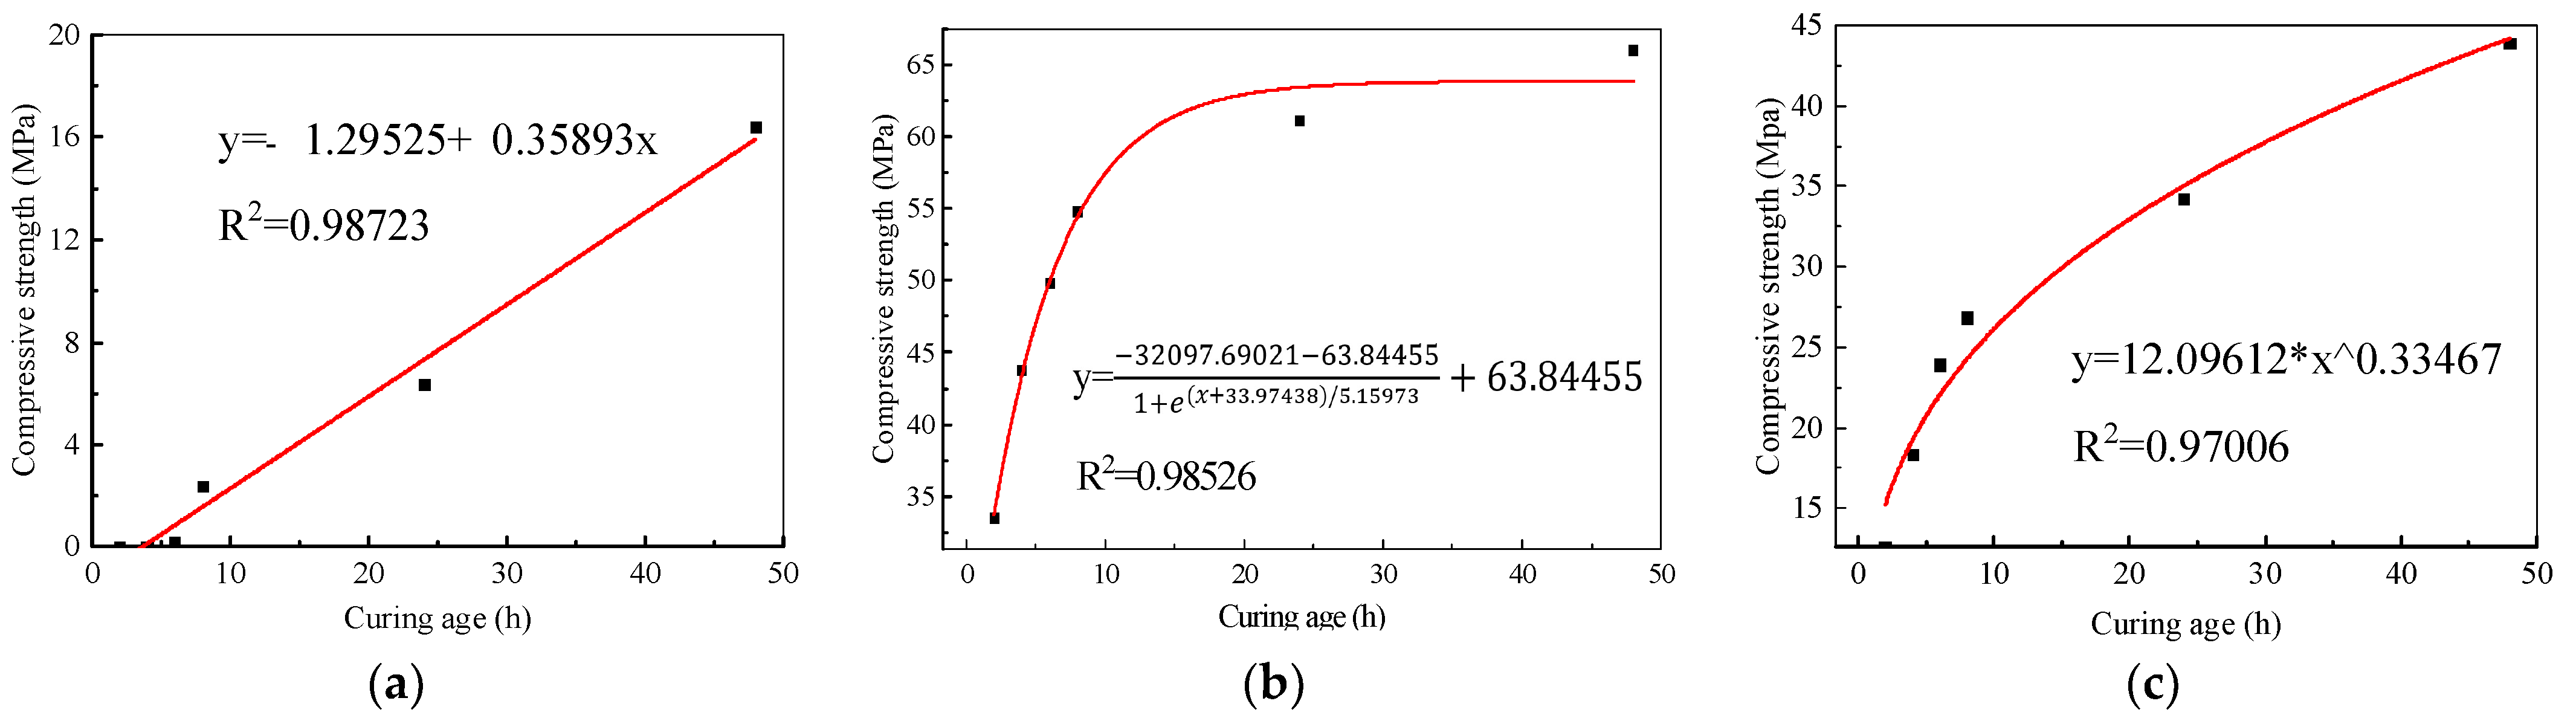
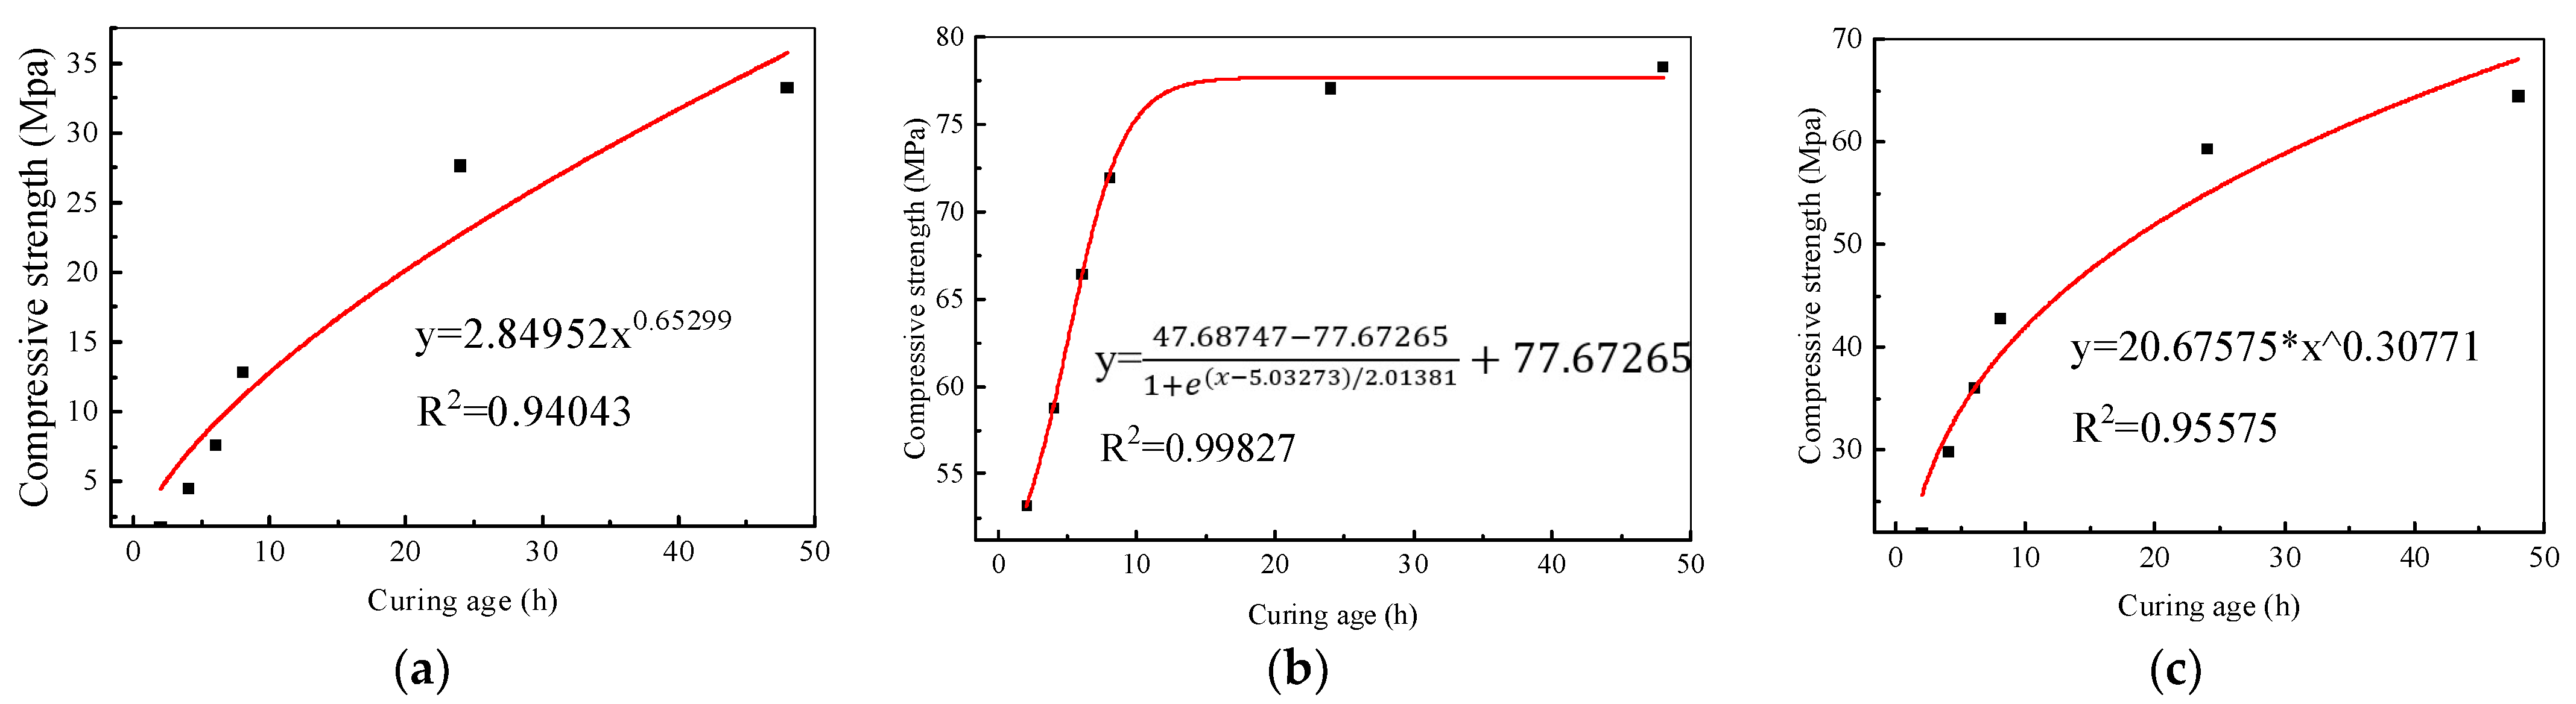
3.1.2. Steam Curing
3.1.3. Oven Curing
3.1.4. Strength Correlation between Standard Curing and Steam Curing
3.2. Microscopic Test
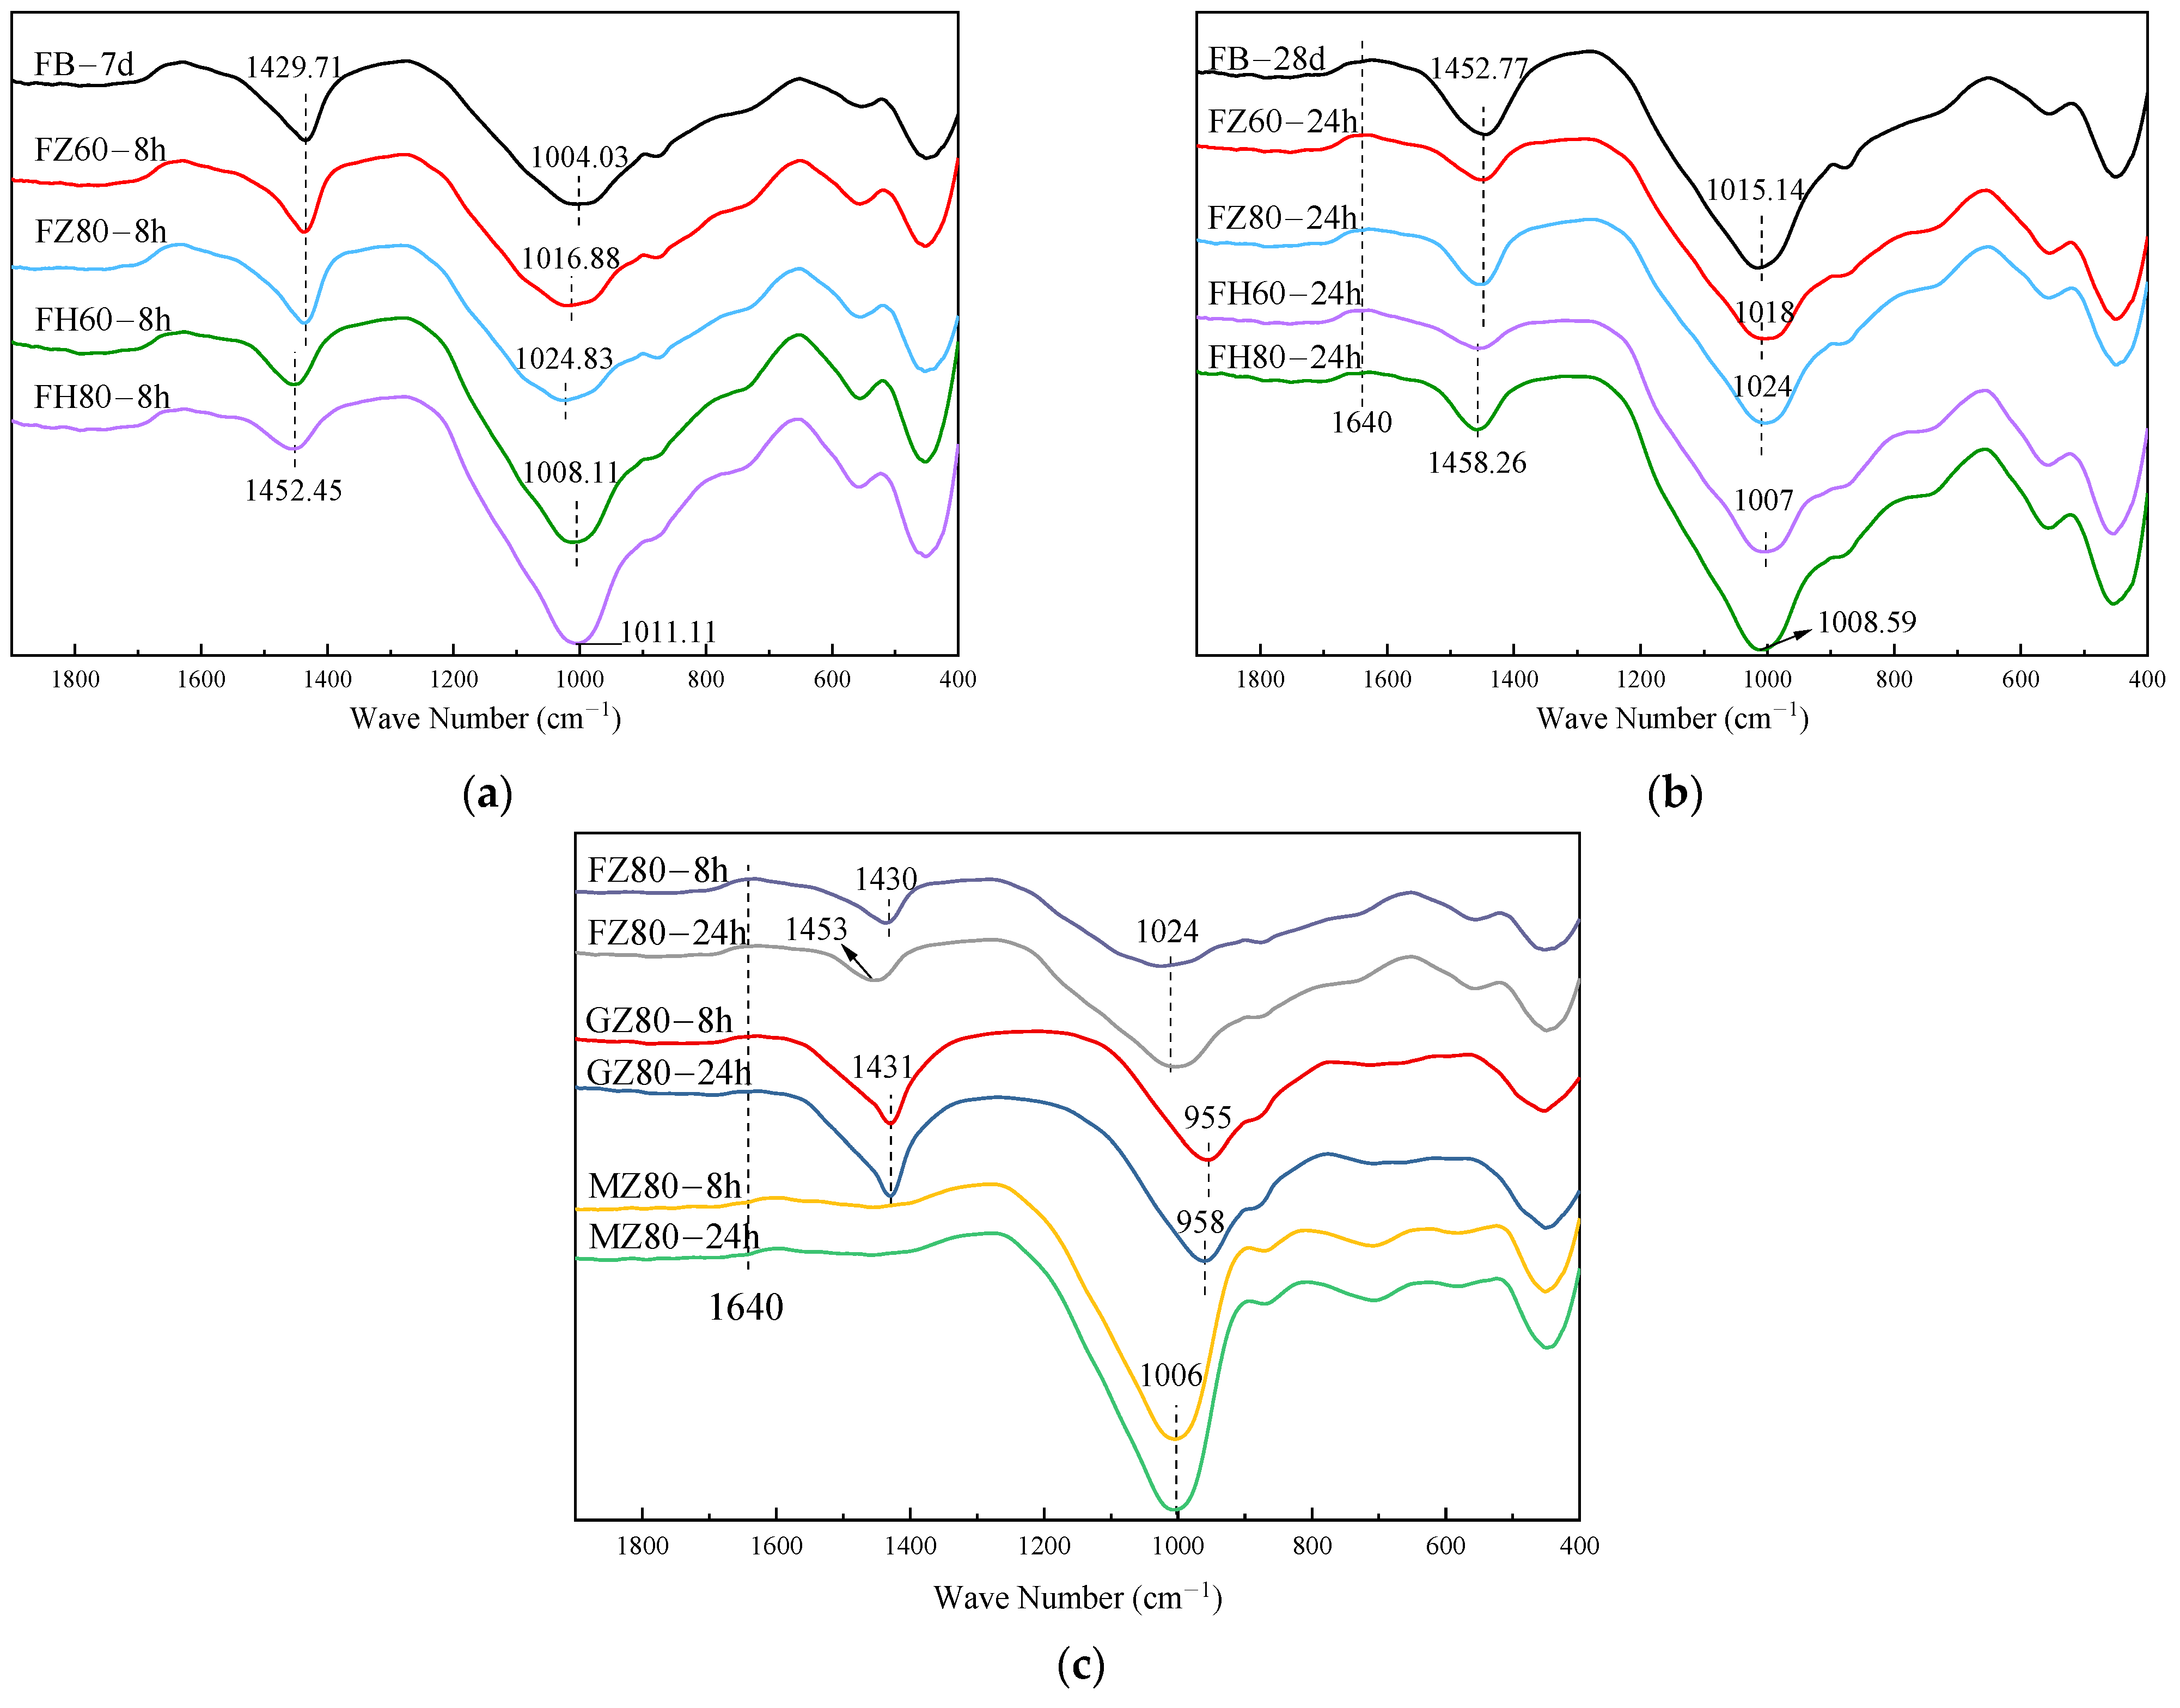
3.2.1. FTIR Test
3.2.2. SEM-EDS Test
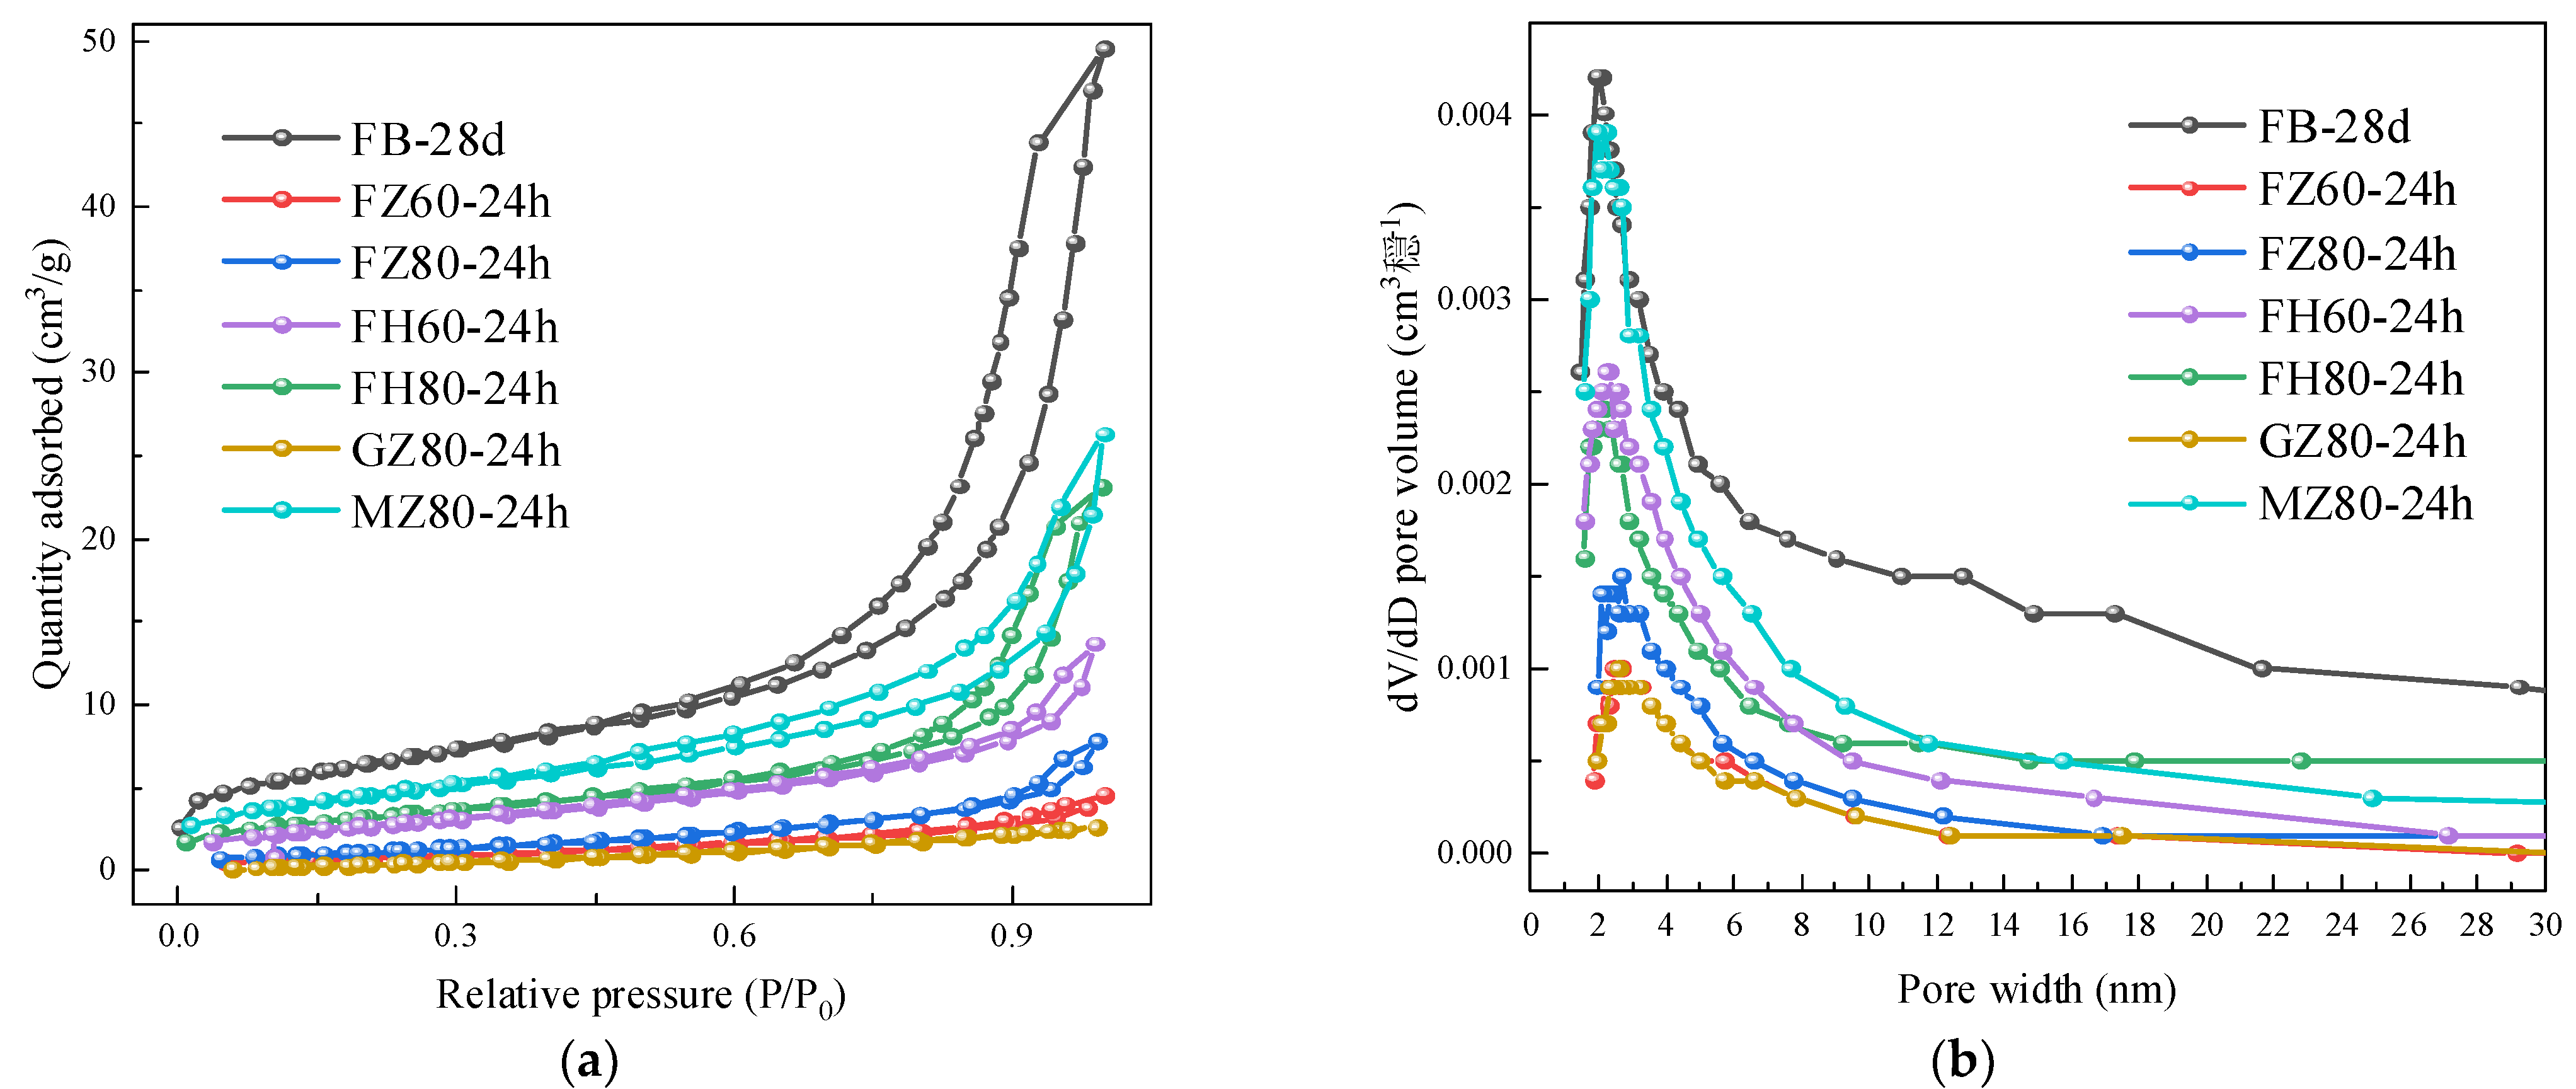
3.2.3. BET Test
4. Conclusions
- (1)
- Steam curing at 80 °C is more suitable for AAF mortar. Its compressive strength was only 1.3 MPa after 3 d standard curing, whereas it reached 1.8 MPa after 2 h steam curing at 80 °C, close to that under 60 °C steam curing for 8 h. In addition, oven curing for a certain period (48 h) had no adverse effect on the strength development of AAF mortar. Although its strength growth was not as high as that under steam curing at the same temperature, oven curing led to a larger volume density of N-A-S-H gel and better development of gel micropores.
- (2)
- For AAG mortar, the compressive strength increased linearly with time under the standard curing condition, and reached 48.0 MPa after only 1 d standard curing; moreover, it was as high as 83.6 MPa after 28 d. The strength of AAG under the steam curing condition developed according to a Boltzmann function with time, which increased rapidly in the first 8 h, and approached 28 d standard curing strength after 12 h, but grew little after about 15 h. Moreover, the strength development would be severely limited by steam curing at 60 °C. It even decreased under the oven curing condition due to the formation of microcracks due to temperature stress and chemical shrinkage.
- (3)
- The strength of AAM mortar under the steam curing condition developed according to an Allometric power function with time, which not only increased rapidly in the first 8 h, but also had substantial growth in the later period. Furthermore, the N-A-S-H gel formed in AAM had a higher polymerization degree, better micropore development, and denser structure compared to that in AAF. Standard curing is more suitable for AAM, and its compressive strength reached 31.7 MPa after less than 24 h. This, time was remarkably shortened compared with the other two alkali-activated mortars. However, there was a large decrease in the strength under oven curing condition.
Author Contributions
Funding
Conflicts of Interest
References
- Davidovits, J. Geopolymers and geopolymeric materials. J. Therm. Anal. Calorim. 1989, 35, 429–441. [Google Scholar] [CrossRef]
- Ma, C.-K.; Awang, A.Z.; Omar, W. Structural and material performance of geopolymer concrete: A review. Constr. Build. Mater. 2018, 186, 90–102. [Google Scholar] [CrossRef]
- Ruan, S.; Chen, S.; Zhu, X.; Zeng, Q.; Liu, Y.; Lai, J.; Yan, D. Matrix wettability and mechanical properties of geopolymer cement-polydimethylsiloxane (PDMS) hybrids. Cem. Concr. Compos. 2021, 124, 104268. [Google Scholar] [CrossRef]
- Zhang, M.; Zhao, M.; Zhang, G.; Mann, D.; Lumsden, K.; Tao, M. Durability of red mud-fly ash based geopolymer and leaching behavior of heavy metals in sulfuric acid solutions and deionized water. Constr. Build. Mater. 2016, 124, 373–382. [Google Scholar] [CrossRef] [Green Version]
- Sakulich, A.R.; Anderson, E.; Schauer, C.; Barsoum, M.W. Mechanical and microstructural characterization of an alkali-activated slag/limestone fine aggregate concrete. Constr. Build. Mater. 2009, 23, 2951–2957. [Google Scholar] [CrossRef]
- Ariffin, M.; Bhutta, M.; Hussin, M.; Tahir, M.M.; Aziah, N. Sulfuric acid resistance of blended ash geopolymer concrete. Constr. Build. Mater. 2013, 43, 80–86. [Google Scholar] [CrossRef]
- Gunasekara, C.; Law, D.; Setunge, S. Long term permeation properties of different fly ash geopolymer concretes. Constr. Build. Mater. 2016, 124, 352–362. [Google Scholar] [CrossRef]
- Turner, L.K.; Collins, F.G. Carbon dioxide equivalent (CO2-e) emissions: A comparison between geopolymer and OPC cement concrete. Constr. Build. Mater. 2013, 43, 125–130. [Google Scholar] [CrossRef]
- Neupane, K. Fly ash and GGBFS based powder-activated geopolymer binders: A viable sustainable alternative of portland cement in concrete industry. Mech. Mater. 2016, 103, 110–122. [Google Scholar] [CrossRef]
- Ng, C.; Alengaram, U.J.; Wong, L.S.; Mo, K.H.; Jumaat, M.Z.; Ramesh, S. A review on microstructural study and compressive strength of geopolymer mortar, paste and concrete. Constr. Build. Mater. 2018, 186, 550–576. [Google Scholar] [CrossRef]
- Li, P. On the relationship between ordinary concrete strength and age under the condition of standard curing. Water Conserv. Constr. Manag. 2017, 53–55. [Google Scholar] [CrossRef]
- Aldea, C.-M.; Young, F.; Wang, K.; Shah, S.P. Effects of curing conditions on properties of concrete using slag replacement. Cem. Concr. Res. 2000, 30, 465–472. [Google Scholar] [CrossRef]
- Wang, A.; Zhang, Y.; Zhang, Z.; Liu, K.; Ma, R.; Sun, D. Research progress of geopolymer cementitous material modification for improving durability of concrete. Mater. Rep. 2019, 33, 2552–2560. [Google Scholar] [CrossRef]
- Triwulan, M.; Ekaputri, J.J.; Priyanka, N.F. The Effect of temperature curing on geopolymer concrete. MATEC Web Conf. 2017, 97, 01005. [Google Scholar] [CrossRef] [Green Version]
- Xie, Z.; Li, X. Effect of curing temperature and curing time on compressive strength of fly ash geopolymer concrete. Concrete 2014, 55–58. [Google Scholar] [CrossRef]
- Hou, Y.; Wang, D.; Zhou, W. Study of Preparation of Fly Ash-Based Polymer and Its Performance. Coal Ash China 2009, 21, 3–5. [Google Scholar] [CrossRef]
- Naik, S.; Gadhiya, J.; Dhameliya, H. Effect of Duration and Temperature of Curing on Compressive Strength of Fly Ash Based Geopolymer Concrete. Int. J. Eng. Sci. Res. Technol. 2016, 5, 845–849. [Google Scholar] [CrossRef]
- Jamdade, P.K. Effect of temperature and time of curing on strength of fly ash based geopolymer concrete. Int. J. Inno. Res. Sci. Eng. Technol. 2016, 5, 9269–9274. [Google Scholar] [CrossRef]
- Byakodi, A.S.; Srinivas, N. Effect of curing temperature on compressive strength of geopolymer concrete. Int. J. Rec. Sci. Res. 2016, 7, 12377–12381. [Google Scholar]
- Zhang, Y.; Sun, W.; Sha, J.; Lin, W.; Zheng, K.; Liu, S. Preparation, properties and mechanism of fly ash based geopolymer concrete. J. Build. Mater. 2003, 6, 237–242. [Google Scholar] [CrossRef]
- Hake, S.; Damgir, R.; Patankar, S.V. Effect of temperature and curing type on geopolymer concrete. Int. J. Adv. Res. Sci. Eng. 2016, 5, 1534–1540. [Google Scholar]
- Ekaputri, J.J.; Mutiara, I.S.; Nurminarsih, S.; Van Chanh, N.; Maekawa, K.; Setiamarga, D.H.E. The effect of steam curing on chloride penetration in geopolymer concrete. MATEC Web Conf. 2017, 138, 01019. [Google Scholar] [CrossRef] [Green Version]
- Wang, Q.; Zhao, X.; Li, L.; Sui, Z. The influence of early stage curing systems on mechanical properties of slag-based geopolymer concrete. J. Wuhan Univ. Techno. 2009, 31, 27–30. [Google Scholar] [CrossRef]
- Ding, Q.; Jin, H.; Zhang, G.; Yang, J.; Yan, P.; Zhou, P. Effect of C3A content on microstructure of C3A-C3S paste. B Chin. Ceram. Soc. 2020, 39, 717–723. [Google Scholar] [CrossRef]
- Wang, A.; Wang, X.; Sun, D.; Zhu, Y.; Liu, K. Research progress on setting and hardening of geopolymers and their control. Mater. Rep. 2021, 1–17. [Google Scholar] [CrossRef]
- Peng, Y.; Guo, R.; Lin, Z.; Zhang, M. Review on influencing factors of mechanical properties of fly ash geopolymer. B. Chin. Ceram. Soc. 2021, 40, 858–866. [Google Scholar] [CrossRef]
- Jia, Y.; Zhang, Y.; Zhang, W. Preparation, properties and mechanism of slag based geopolymer. J. Wuhan Univ. Techno. 2009, 31, 120–125. [Google Scholar]
- Lo, Y.; Lee, H. Curing effects on carbonation of concrete using a phenolphthalein indicator and Fourier-transform infrared spectroscopy. Build. Environ. 2002, 37, 507–514. [Google Scholar] [CrossRef]
- Khan, H.A.; Castel, A.; Khan, M. Corrosion investigation of fly ash based geopolymer mortar in natural sewer environment and sulphuric acid solution. Corros. Sci. 2020, 168, 108586. [Google Scholar] [CrossRef]


| Composition wt% | SiO2 | Al2O3 | CaO | Fe2O3 | MgO | Na2O | K2O | SO3 |
|---|---|---|---|---|---|---|---|---|
| FA | 49.3 | 28.5 | 1.86 | 3.96 | 0.94 | 0.69 | 2.6 | 0.51 |
| GBFS | 29.8 | 13 | 38.7 | 0.3 | 7.71 | 0.35 | 0.39 | 2.3 |
| MK | 54.5 | 43.1 | - | 0.48 | 0.07 | 0.67 | 0.2 | 0.35 |
| No. | Steam Curing at 80 °C (h) | Strength (MPa) | Standard Curing (h) | Steam Curing at 60 °C (h) |
|---|---|---|---|---|
| AAF | 4 | 7.0 | 181 | 23 |
| 24 | 22.7 | 494 | 67 | |
| AAG | 4 | 58.9 | 236 | 11 |
| 24 | 77.7 | 603 | - | |
| AAM | 4 | 31.7 | <24 | 18 |
| 24 | 55.0 | 121 | 92 |
| Element Percentage/% | Spot 1 | Spot 2 | Spot 3 | Spot 4 | Spot 5 | Spot 6 |
|---|---|---|---|---|---|---|
| O | 43.76 | 48.84 | 46.78 | 42.84 | 29.57 | 39.46 |
| Na | 4.16 | 9.48 | 8.9 | 12.87 | 9.15 | 7.63 |
| Al | 18.16 | 16.55 | 16.18 | 16.08 | 5.68 | 22.31 |
| Si | 21.25 | 22.25 | 24.6 | 23.26 | 12.99 | 24.9 |
| Ca | 0.67 | 2.15 | 0.79 | 2.65 | 23.14 | - |
| No. | Specific Surface Area (m2/g) | Cumulative Pore Volume (mL/g) | Most Probable Aperture (nm) |
|---|---|---|---|
| FB-7 d | 2.8402 | 0.0071 | 3.5467 |
| FB-28 d | 22.5497 | 0.0765 | 2.0577 |
| FZ60-24 h | 2.8129 | 0.0070 | 2.5382 |
| FZ80-8 h | 1.5801 | 0.0044 | 2.9971 |
| FZ80-24 h | 4.3889 | 0.0120 | 2.4906 |
| FH60-24 h | 10.2894 | 0.0357 | 2.3356 |
| FH80-8 h | 11.7356 | 0.0316 | 2.5823 |
| FH80-24 h | 13.6304 | 0.0411 | 2.2366 |
| GZ80-24 h | 3.2026 | 0.0039 | 2.5459 |
| MZ80-24 h | 15.9604 | 0.0406 | 2.0807 |
Publisher’s Note: MDPI stays neutral with regard to jurisdictional claims in published maps and institutional affiliations. |
© 2021 by the authors. Licensee MDPI, Basel, Switzerland. This article is an open access article distributed under the terms and conditions of the Creative Commons Attribution (CC BY) license (https://creativecommons.org/licenses/by/4.0/).
Share and Cite
Kong, L.; Fan, Z.; Ma, W.; Lu, J.; Liu, Y. Effect of Curing Conditions on the Strength Development of Alkali-Activated Mortar. Crystals 2021, 11, 1455. https://doi.org/10.3390/cryst11121455
Kong L, Fan Z, Ma W, Lu J, Liu Y. Effect of Curing Conditions on the Strength Development of Alkali-Activated Mortar. Crystals. 2021; 11(12):1455. https://doi.org/10.3390/cryst11121455
Chicago/Turabian StyleKong, Lijuan, Zirui Fan, Wenchen Ma, Jiatao Lu, and Yazhou Liu. 2021. "Effect of Curing Conditions on the Strength Development of Alkali-Activated Mortar" Crystals 11, no. 12: 1455. https://doi.org/10.3390/cryst11121455
APA StyleKong, L., Fan, Z., Ma, W., Lu, J., & Liu, Y. (2021). Effect of Curing Conditions on the Strength Development of Alkali-Activated Mortar. Crystals, 11(12), 1455. https://doi.org/10.3390/cryst11121455