Article

Microstructure and Corrosion Resistance in Bimetal Materials of Q345 and 308 Steel Wire-Arc Additive Manufacturing

School of Materials Science and Engineering, Jiangsu University of Science and Technology, Zhenjiang 212003, China
*
Author to whom correspondence should be addressed.
Crystals 2021, 11(11), 1401; https://doi.org/10.3390/cryst11111401
Submission received: 2 October 2021 / Revised: 30 October 2021 / Accepted: 3 November 2021 / Published: 17 November 2021

Abstract

:
The microstructure and corrosion resistance of samples fabricated by Q345 and 308 bimetallic feedings using two kinds of processes of wire-arc additive manufacturing (WAAM) was observed and compared with that of sample manufactured by a single feeding wire of Q345 or 308. The results show that the interface between the Q345 and 308 had no defects and metallurgical bonding. The hardness of bimetal Q345/308 additive manufacturing samples was higher than that of Q345 or 308 single wire additive manufacturing. The sample made of Q345 single wire had serious electrochemical corrosion, while the sample made of 308 single wire had pitting corrosion. The pitting corrosion of the sample reinforced by bimetal Q345/308 feeding wires was improved.

1. Introduction

With the development of the manufacturing industry and the diversification of industrial demand, many changes have occurred in the market for materials. Parts need to work in corrosive, high temperature, and high-pressure harsh environments, resulting in a single material not meeting the environmental requirements. Structurally inhomogeneous materials and functionally graded materials that have combinations of characteristics or specific synergic effects are widely needed in different applications. These materials can be tailored according to the requirements for materials properties [1].
However, it is difficult to use traditional manufacturing methods to manufacture these materials, primarily to obtain complex shapes and flexible material layout. The emergence of additive manufacturing (AM) technology provides an excellent way of solving this problem [2,3]. AM is a new technology integrating advanced manufacturing, intelligent manufacturing, green manufacturing, and new materials. It does not need molds in the manufacturing process. The additive manufacturing parts only need a small amount of subsequent machining so that the process can save resources, reduce costs, and improve efficiency. According to the manufacturing heat source, metal additive manufacturing technologies can be divided into three categories: laser additive manufacturing technology, electron beam additive manufacturing technology, and arc additive manufacturing technology. A laser is used as the energy source in an AM system, and it has inferior energy efficiency (2–5%) [4]. The electron beam has a slightly higher energy efficiency (15–20%), but it requires a high vacuum working environment [5]. The gas metal arc welding (GMAW) and gas tungsten arc welding (GTAW) processes use an arc as a heat source. The energy efficiency of arc additives manufacturing processes is 90% under some circumstances [6,7]. It can fabricate dense metal components layer-by-layer, and it has the characteristics of high heat input, lower materials supply cost, fast forming speed, and higher deposition rate [8,9,10]. Among all additive manufacturing technologies, wire-arc additive manufacturing (WAAM) technology, taking the welding wires as the filling materials, is the most suitable for manufacturing large parts and complex components. It is easier to control the composition by feeding several wire feedings simultaneously and obtaining a series of various structures. However, due to the inherent characteristics of the GAMW-based process, the weld bead geometry within a weld pass is not uniform, particularly at the start and end portions, which will lead to uneven bead geometry, poor surface finish, and partial accuracy [11]. To obtain uniform interlayer size and appearance, the heat input should be easily controlled in the process of layer-by-layer deposition. During the GTAW-based WAAM process, heat input adjustment does not change arc length, and the deposition rate can be controlled independently by adjusting wire feed speed, which means that the two separate processes of energy input and materials input make WAAM control easier. In this work, a GTAW-based system was adopted.
Many researchers researched WAAM of dissimilar materials, mainly focusing on different types of stainless steel [12], stainless steel- and nickel-based materials [13], nickel-based materials, and copper alloys [14], Ti-TiAl [15], and so on. They mainly focus on the preparation process, microstructure, and mechanical properties. However, the literature about corrosion performance of dissimilar material fabricated by WAAM is numerous. Austenitic stainless steel has high strength and excellent corrosion resistance. It is predominantly used in the corrosion resistance part of structural materials. In this process, the connection between duplex stainless steel and dissimilar metals is involved. Although some researchers have studied the junction of duplex stainless steel with titanium alloy [16] and austenitic stainless steel [17], from the perspective of engineering practice demand, the future research focus will be the connection of duplex stainless steel and carbon steel.
In this work, feeding wires of Q345 and 308 were used to manufacture thin-walled parts by a GTAW-based additive manufacturing system. Different processes of Q345 and 308 feeding wire were used to fabricate Q345/308 bimetallic thin-walled components. Their microstructure and corrosion performance were compared and analyzed. This work can provide some experimental and theoretical basis for better understanding dissimilar material/bimetallic additive manufacturing.

2. Experimental Details

2.1. Materials

Q345 steel was the substrate, with a size of 200 mm × 100 mm × 12 mm. Q345 wire with 1.2 mm diameter and 308 wire with 1.0 mm diameter were used in experiments. Their composition is shown in Table 1. Before the experiment, the surface of the Q345 substrate was ground by a portable grinding machine to first remove oxidation film. Then the surface of the Q345 substrate was cleaned using acetone to deal with oil pollution impurity.

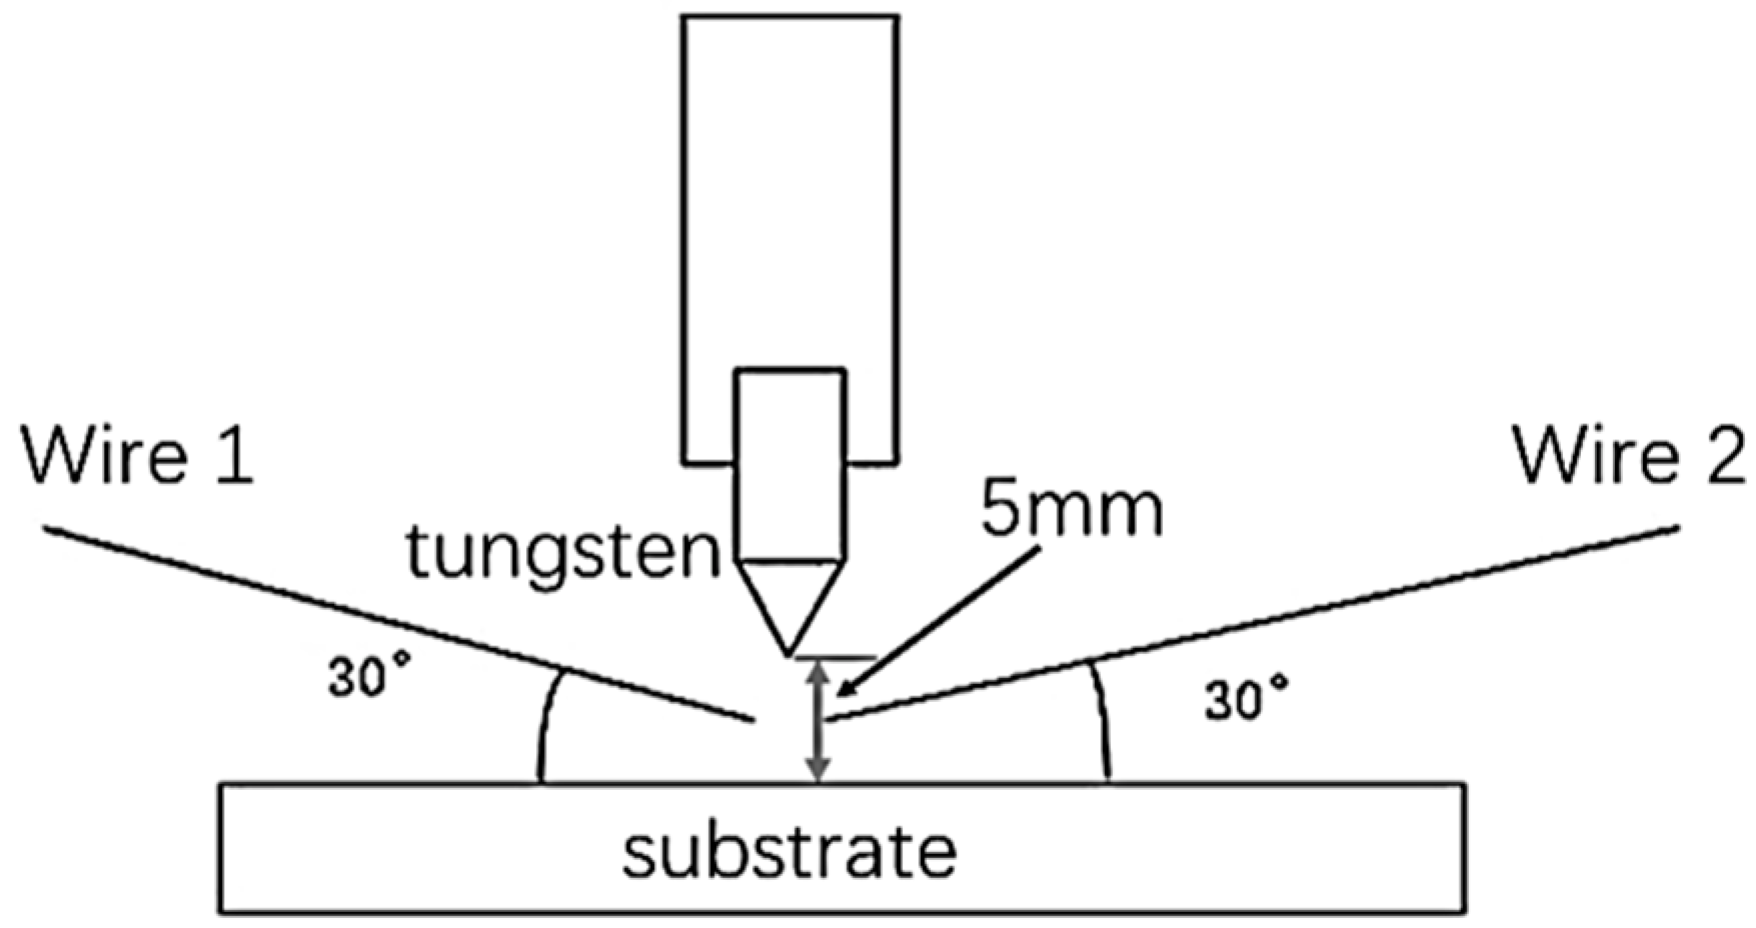
2.2. Experimental System and Process Parameters

The WAAM system comprised hot wire GTAW welding WSM-400, an automatic feeding wire machine (Model WF-007A), and a motion control platform. The position of the welding tungsten torch and wires is shown in Figure 1. The distance from sediments to the tungsten electrode was 5.0 mm. The cooling time interval between each deposit was 10.0 min. The protection of argon gas had a purity of 99.99% and a gas flow rate of 12.0 L·min−1. To compare and conduct the analysis, samples 1 and 2 were obtained by additive manufacturing with single feeding wire Q345 and 304, respectively. Sample 3 was obtained by horizontal parallel wire feeding of Q345 and 308, as shown in Figure 1. Sample 4 was obtained by depositing 308 feeding wire on the Q345 sedimentary layers, two kinds of wires interval deposition. The process parameters of additive manufacturing are shown in Table 2.

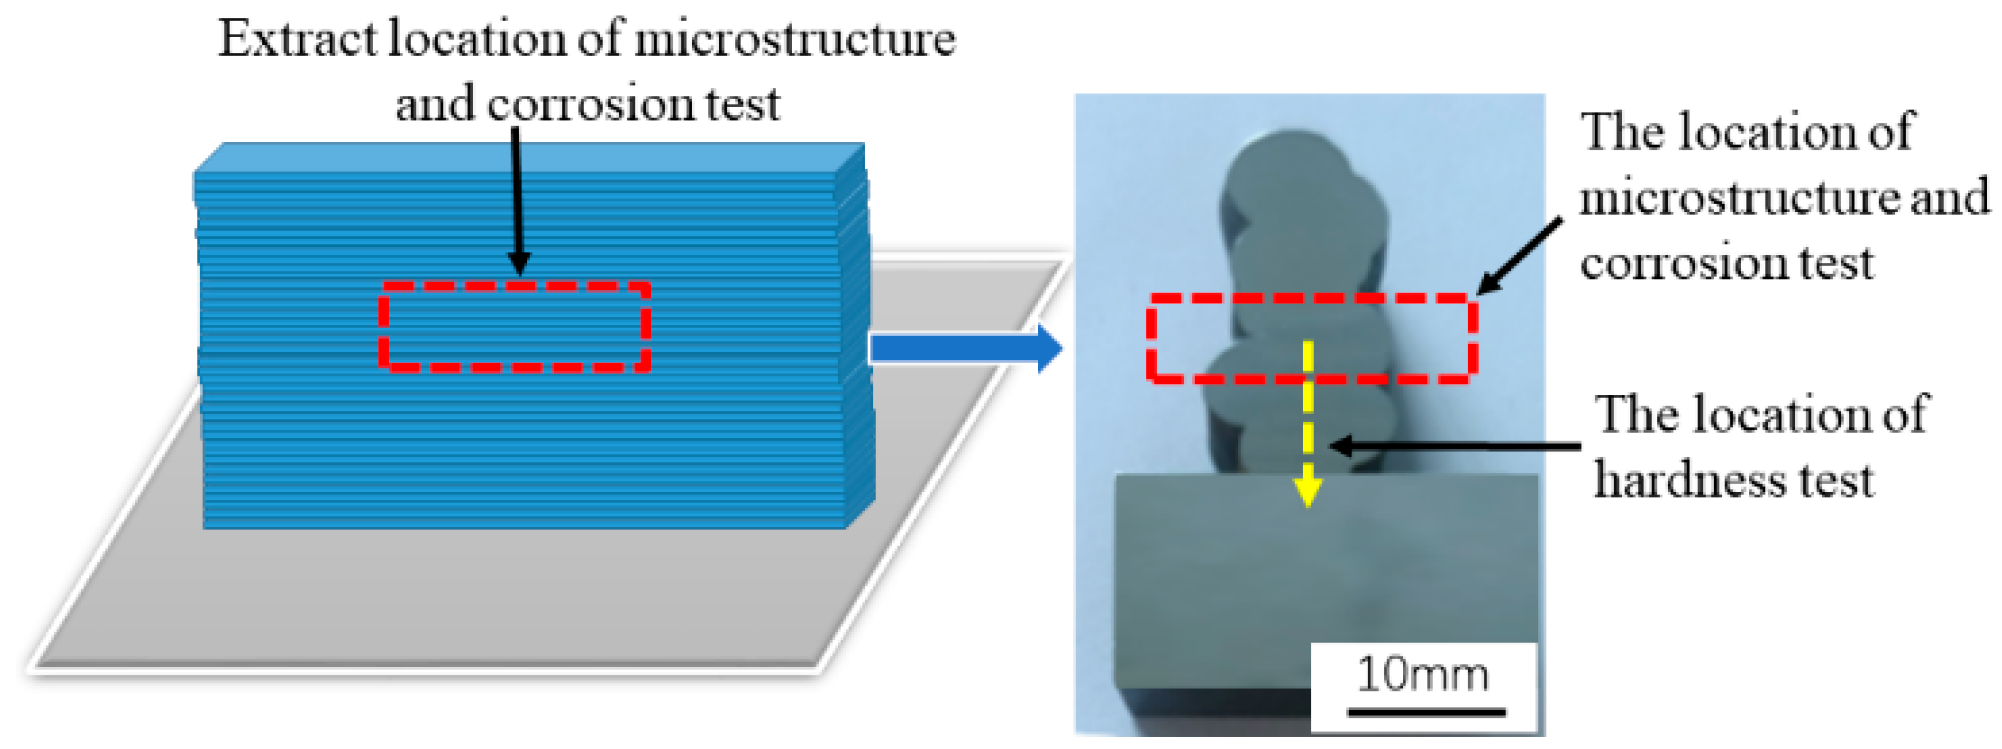
2.3. Microstructure Observation and Performance Test

The test samples were cut from the middle of additive manufactured parts and were wet ground sequentially with 1000 silicon carbide paper and then were mechanically polished to 1 μm for microstructure observation and hardness measurement. The extract locations of microstructure, hardness test, and corrosion test are shown in Figure 2.
An optical microscope (Nikon Epiphot 300 model, Tokyo, Japan) was used to observe the microstructures of samples. A DHV-1000 hardness tester (Shanghai Shangcai Tester Machine Co., LTD., Shanghai, China) was used to measure the hardness of samples every 0.5 mm, with a test load of 500 g and a dwell time of 15 s.
The electrochemical experiments were carried out at a Corr Test CS2350 electrochemical workstation. The experimental medium was 3.5% NaCl solution, and it was made of analytical reagent and distilled water. The solution temperature was maintained at 25 ± 1 °C. The electrochemical tests were performed by a three-electrode system. The auxiliary electrode was a Pt electrode, the reference electrode was a saturated calomel electrode, and square samples with the working area of 0.5 cm2, mechanically polished to 0.5μm, were the working electrodes. To achieve a steady state and gain open circuit potential (OCP), the working electrode (sample) had been tested over time during 30 min. When the polarization curve was tested, the scanning started at 0.5 V below the corrosion potential, and the scanning rate was 0.333 V/s. When the current density reached 20 mA/cm2, the test stopped. The scanning frequency range of electrochemical impedance spectroscopy (EIS) was from 10 mHz to 10 kHz, and the amplitude of the sinusoidal excitation signal was 10 mV. Each test was repeated three times for the reliability of the experimental data.

3. Results and Discussion

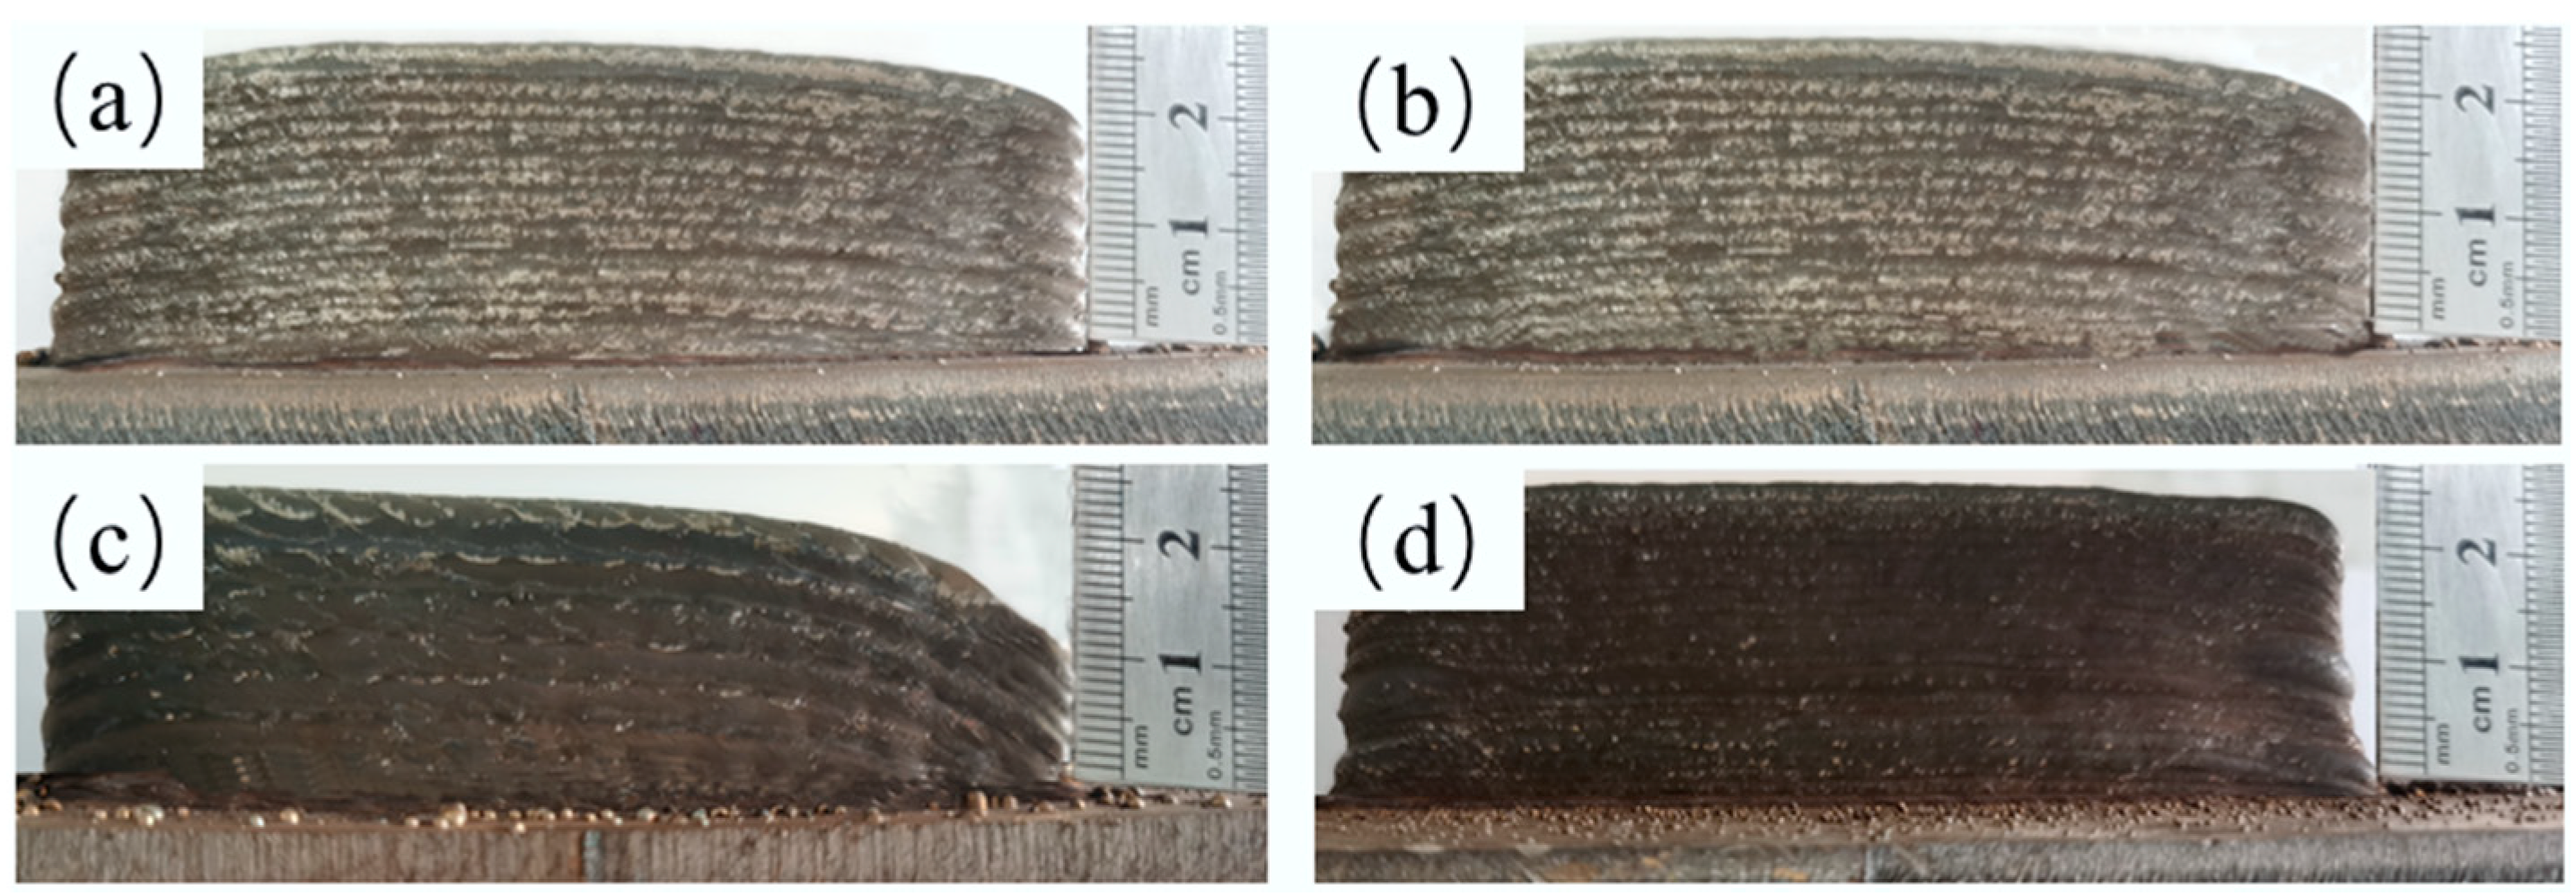
3.1. Macroscopic and Microstructure Observation

Figure 3 shows the macroscopic morphology of additive manufactured samples. The sedimentary structure of samples can be seen. Samples 1, 2, and 4 had a smooth and straight appearance. The height of the single layer deposit in sample 3 was higher, and sample 3 had a rougher surface related to its production process.
Figure 4 shows the microstructure of samples. Figure 4a,b shows the microstructure of Q345 and 308, respectively. The microstructure of Q345 wire-arc additive manufacture was primarily ferrite and pearlite. The microstructure of 308 wire-arc additive manufacturing was mainly γ austenite and δ-Fe ferrite. The growth direction of δ-Fe ferrite was parallel to the deposition direction—namely, the heat flow direction. The morphology of ferrite was dendritic and wormlike. This was consistent with the findings of S.Y. [18]. The dendrites solidified in the direction closest to the temperature gradient when the molten pool was solidified. The heat flow direction was mainly along the deposition direction when the layer was deposited. Therefore, the direction of the dendrite was parallel to the deposition direction [19,20]. Figure 4c shows the microstructure of double-wires additive manufacture sample 3. The two feeding wires fused together, and there was no interface between Q345 and 308 steel. When the two alloys with different compositions were mixed and remelted, the original equilibrium state of the alloy was disrupted. The system was chaotic, and many crystal nuclei were generated. Moreover, due to the rapid cooling rate, the crystal could not grow, which resulted in the fine microstructure and many sub-crystal boundaries. Figure 4d shows the microstructure of sample 4. The interface between Q345 and 308 stainless steel can be seen, and its microstructure was similar to those of Figure 4b,c. The microstructure of Q345 at the interface was a gross Widmannstetter structure, and the interface was metallurgical bonding.

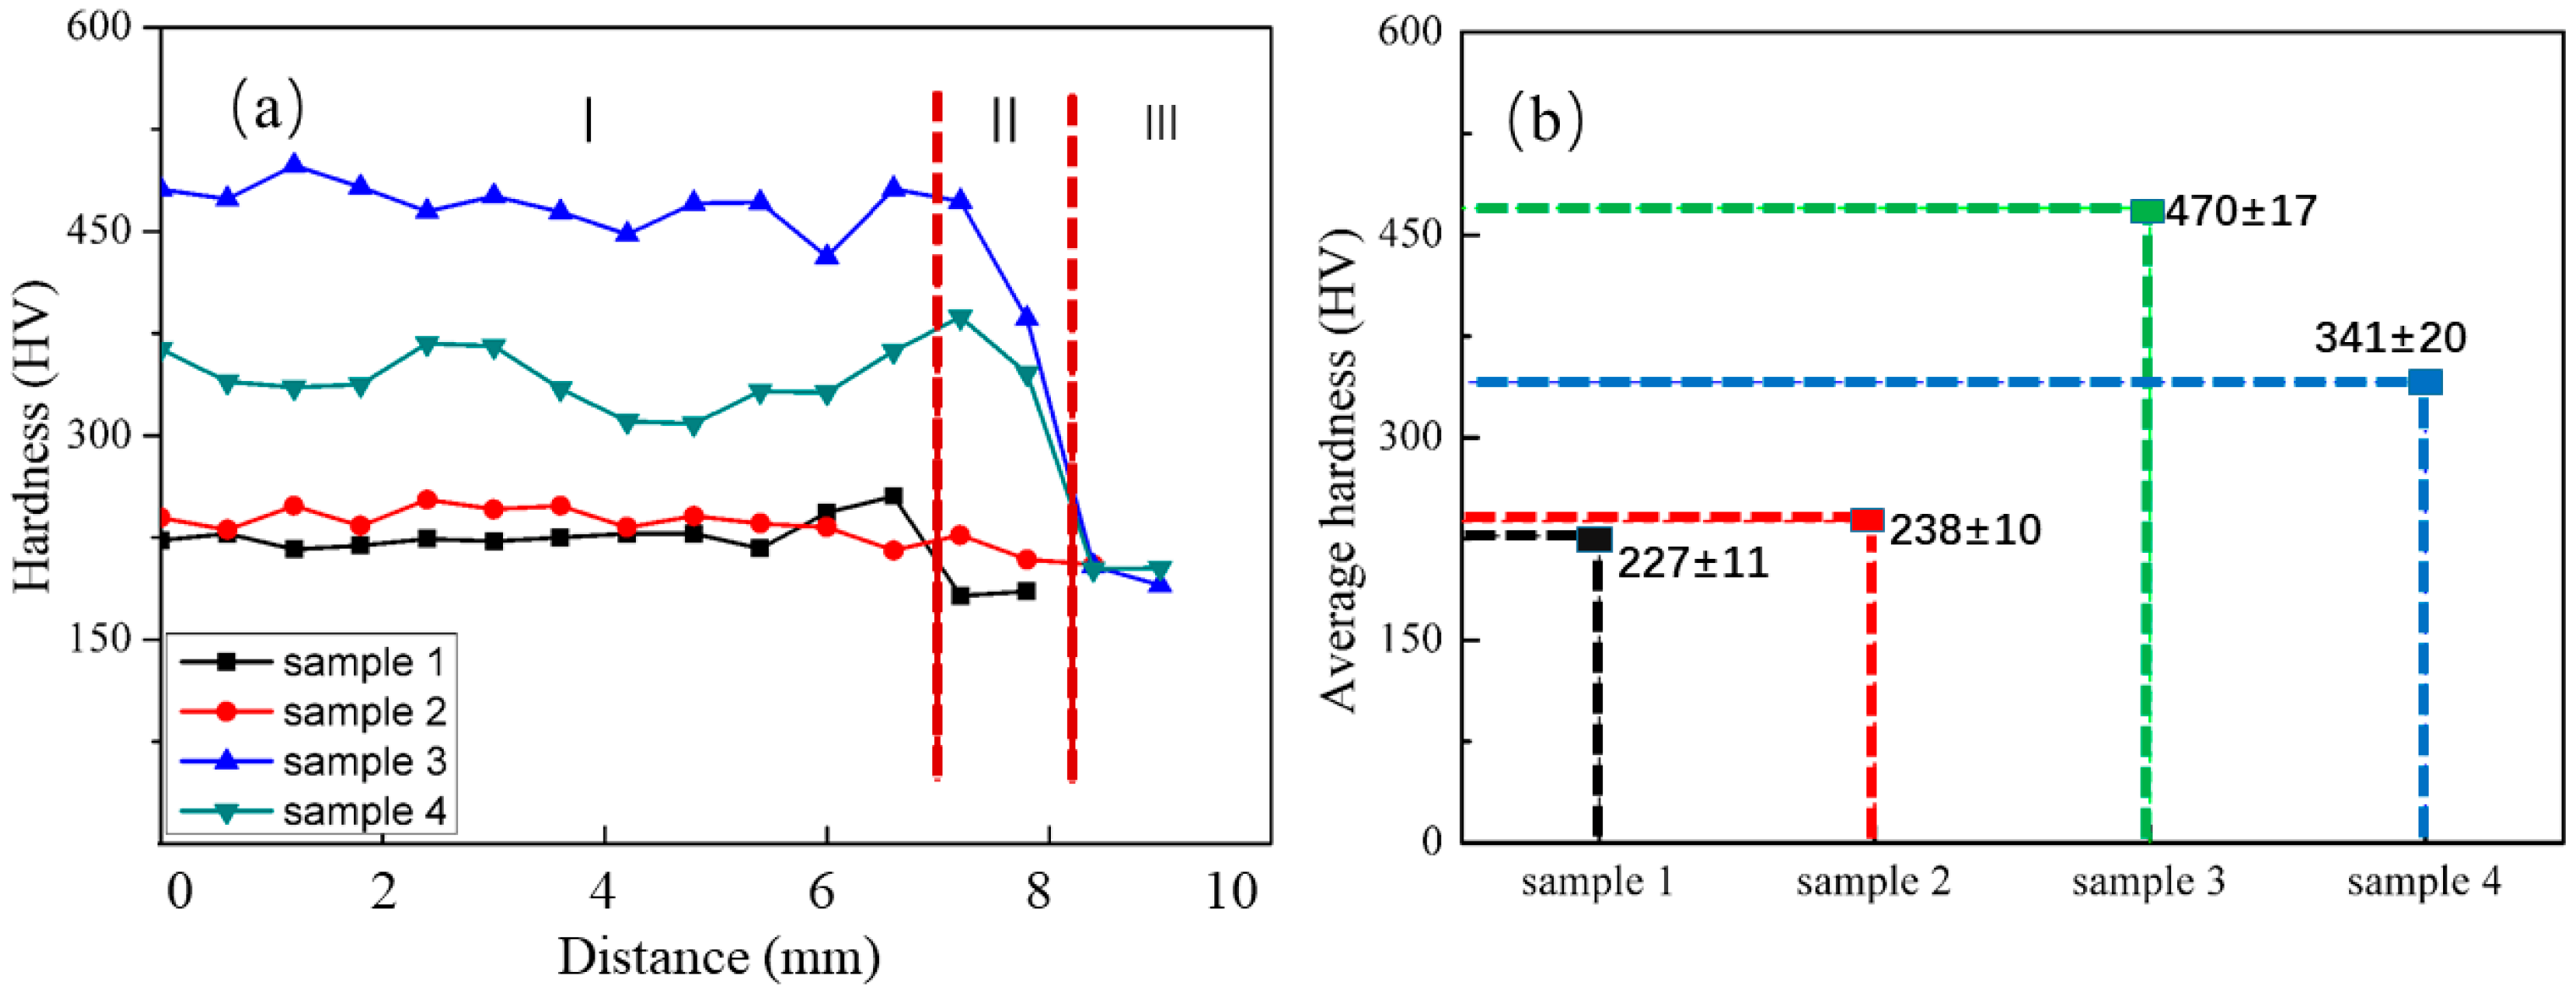
3.2. Hardness Analysis

Figure 5 shows the curves of hardness (Figure 5a) and average hardness (Figure 5b) of samples. Regions I, II, and III are the wire-arc additive manufacturing samples, heat-affected zone, and substrate, respectively. It can be seen that the I average hardness of sample 1 with Q345 was about 227 HV, and that of sample 2 with 308 was about 238 HV. However, the average hardness values of Q345/308 wire-arc additive manufacturing samples are higher than 470 HV. Figure 5b shows the average value of I regions for each wire-arc additive manufacturing sample. The average hardness value of the four samples are 227, 238, 470, and 341 HV, indicating that the double-wire additive manufacturing samples have a significant advantage over the single-wire arc manufactured samples in terms of hardness value. Combined with Figure 4c, it can be seen that the highest hardness of sample 3 is mainly due to the combined effect of fine grain refinement and subcrystal boundary strengthening. The hardness fluctuation of samples 3 and 4 may be due to the continuous heating of the deposition layer, which caused slight development of the delta ferrite phase due to the facilitation of solute elements redistribution during the additive manufacturing process [21].

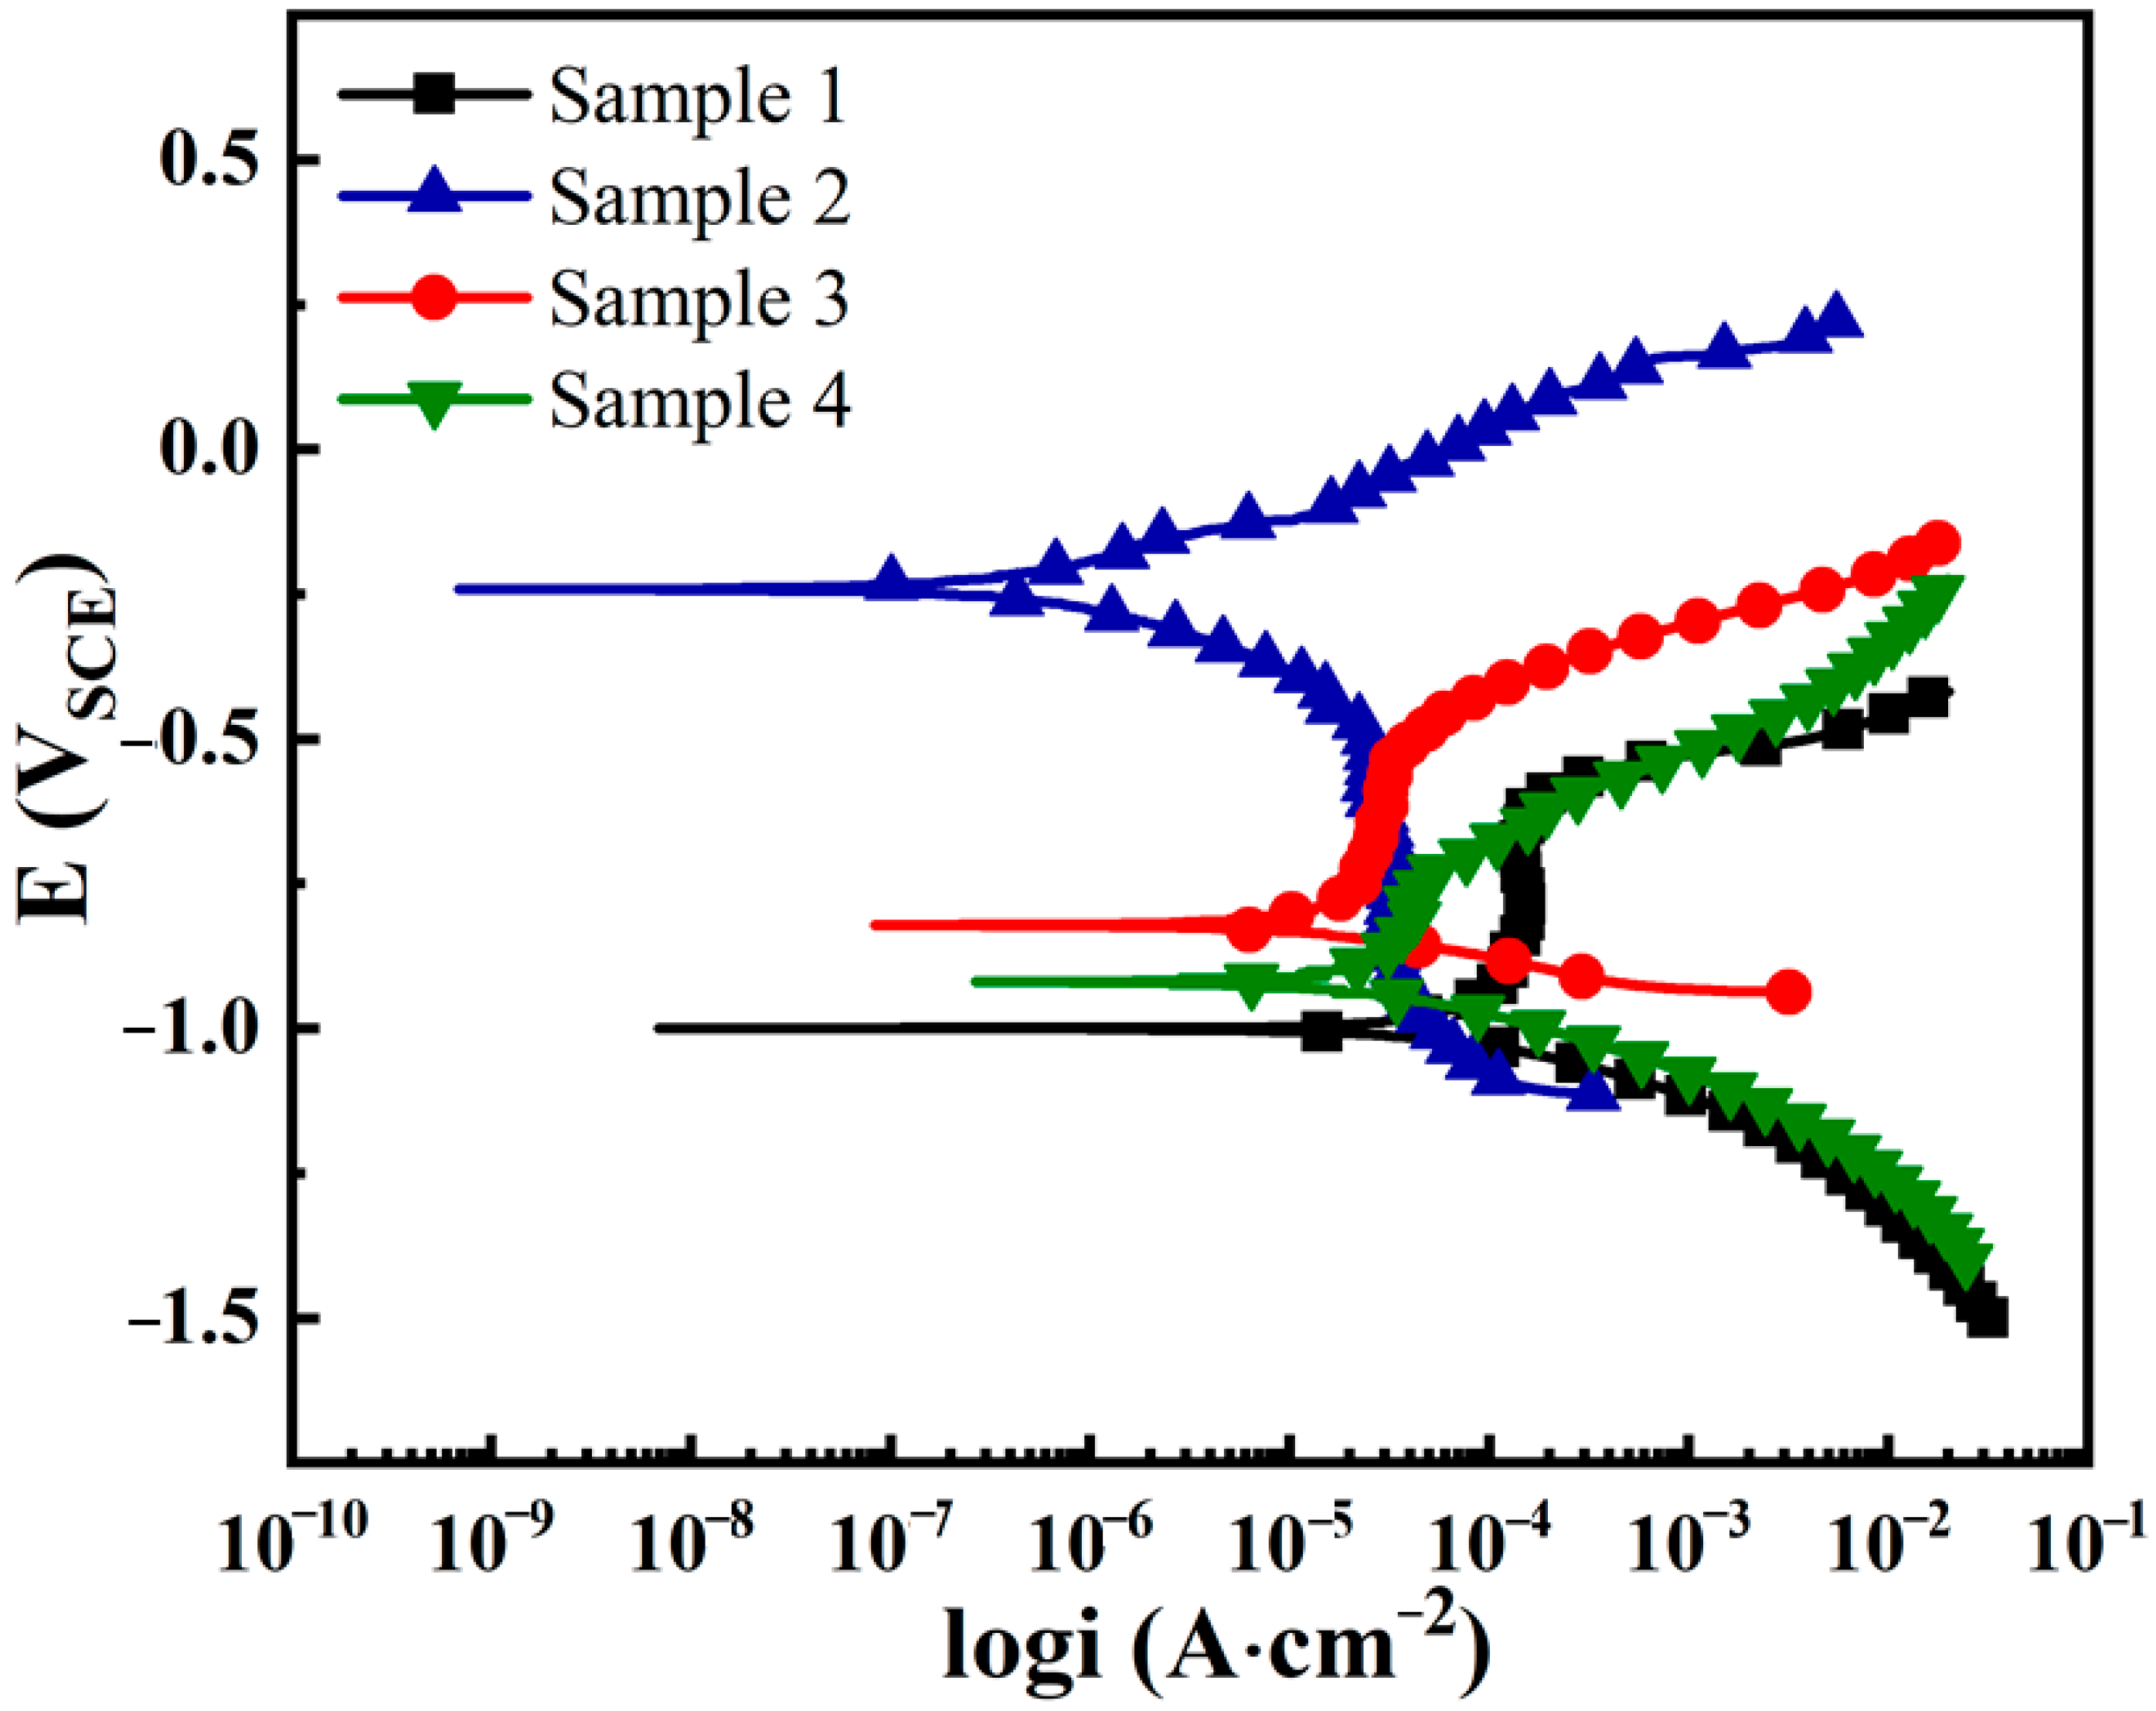
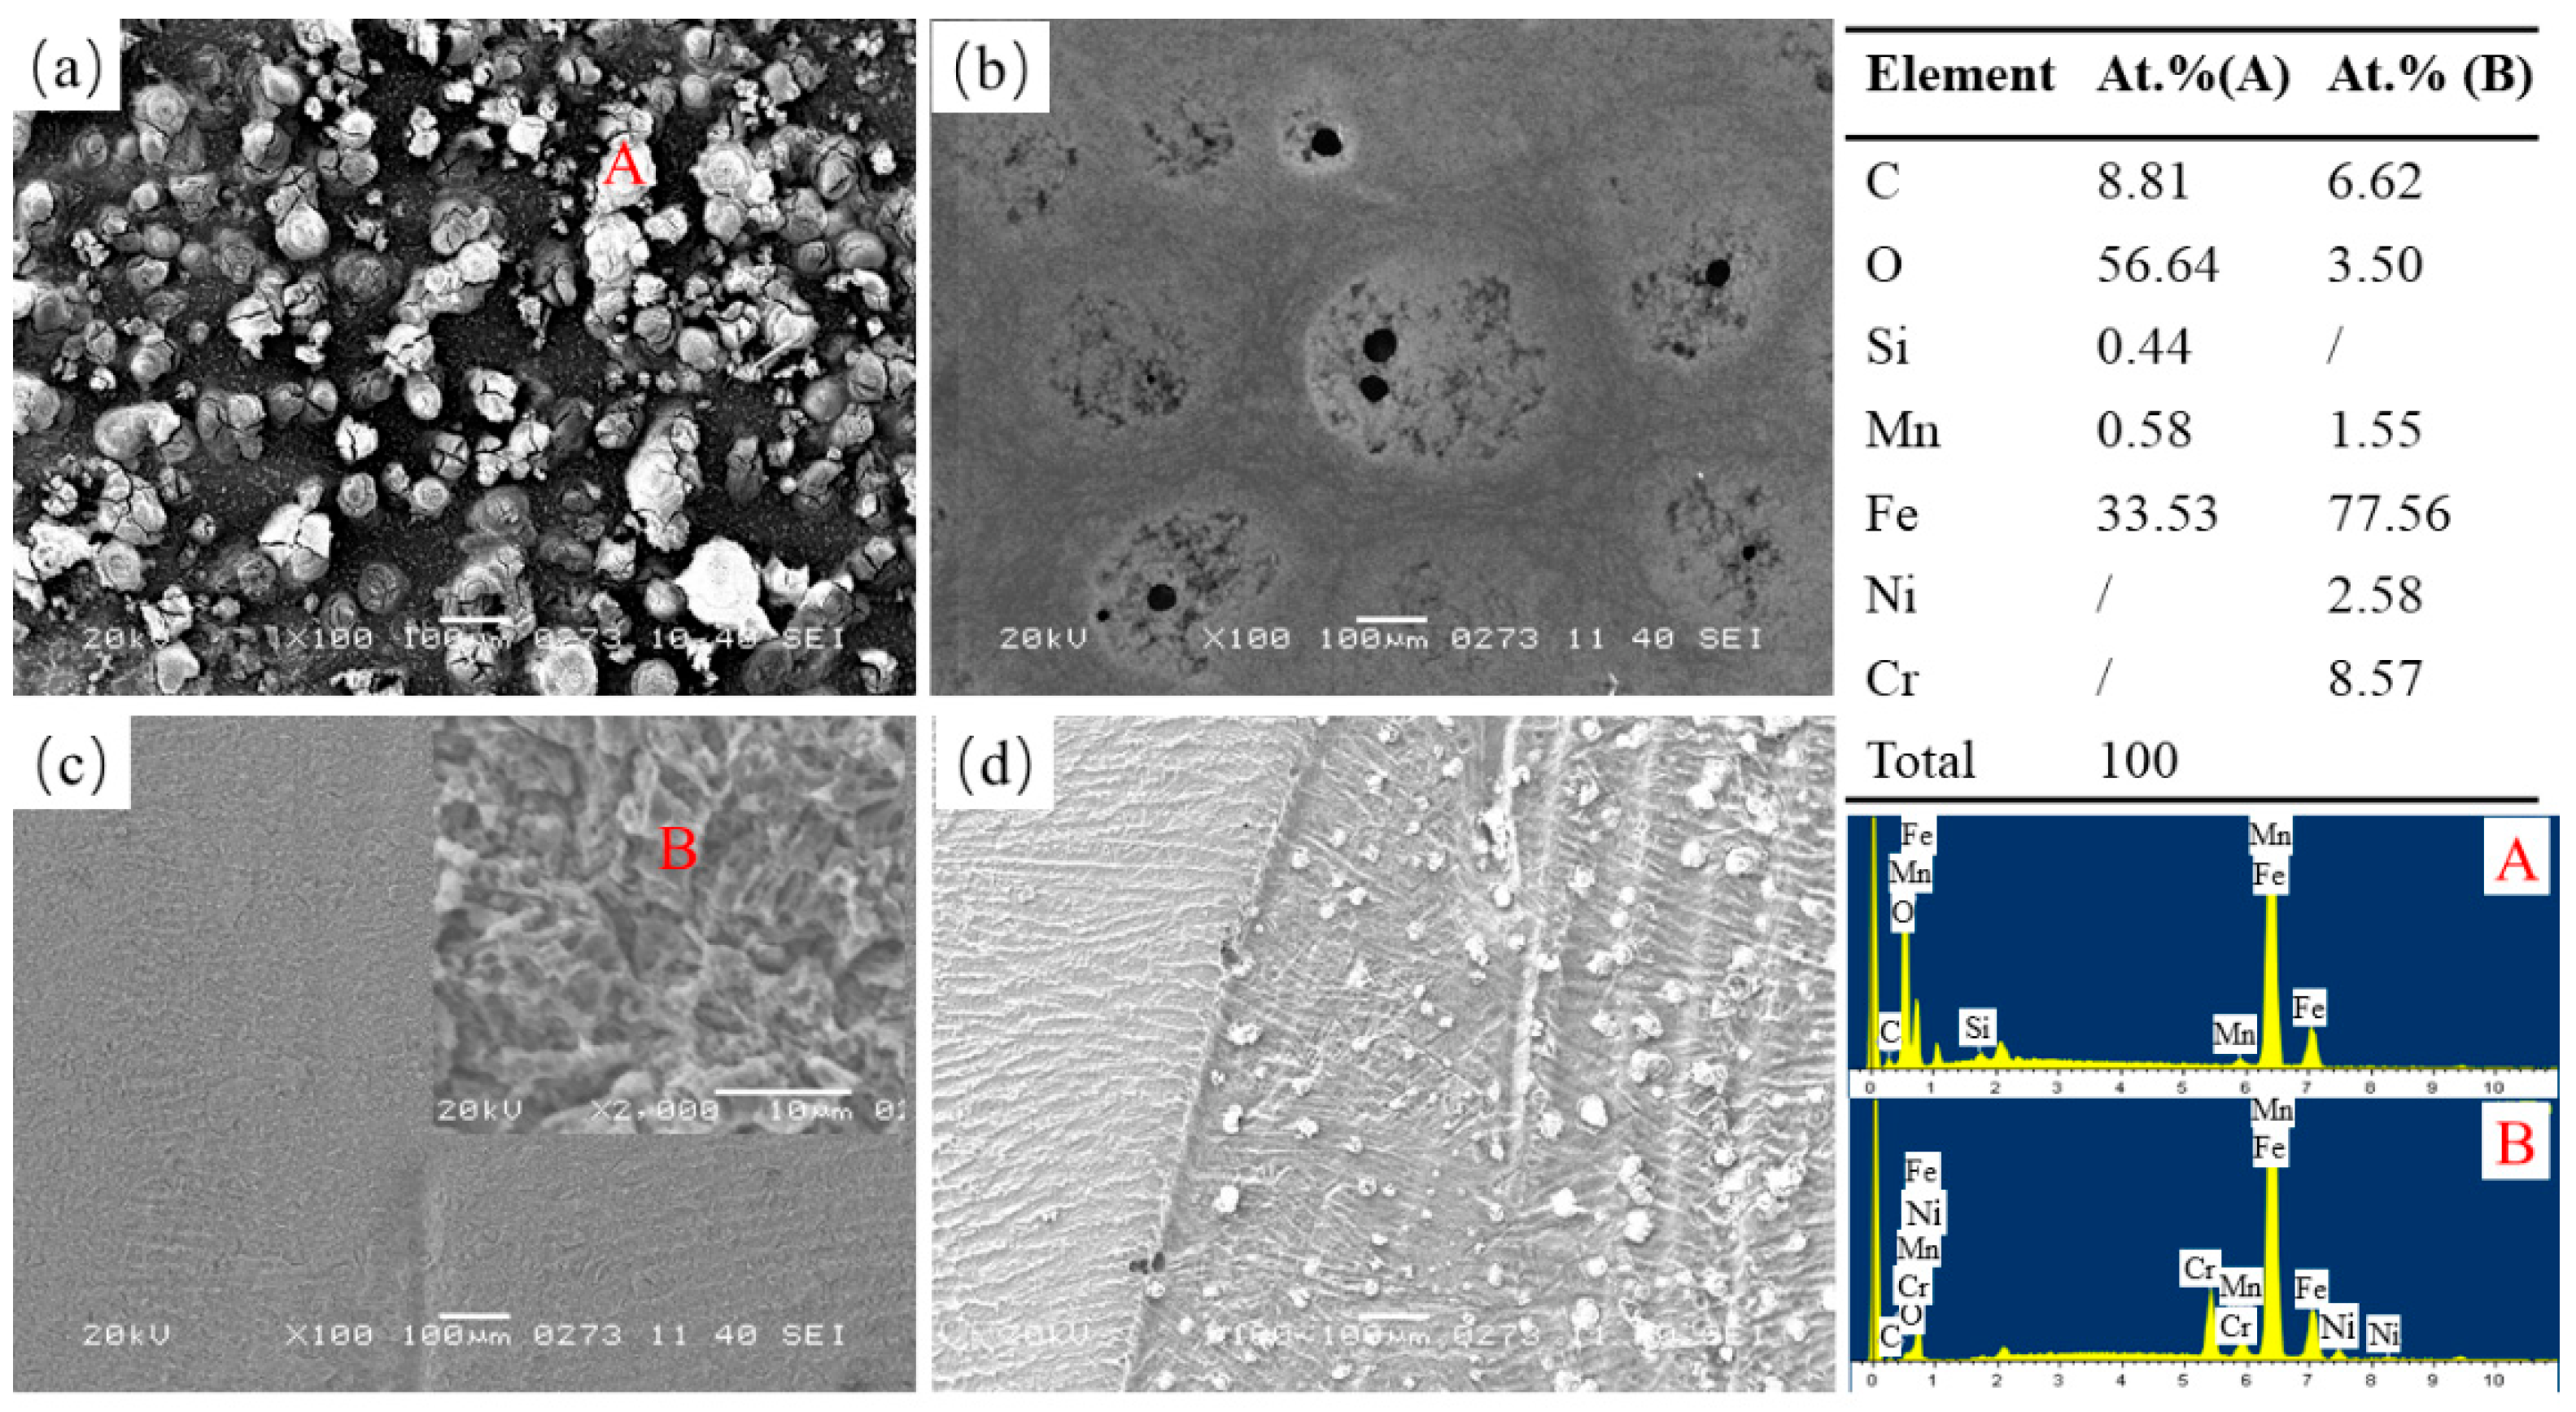
3.3. Corrosion Resistance

Figure 6 shows the open-circuit potential (OCP) curve of additive manufacturing samples in 3.5% wt.% NaCl solution. It can be seen that the OCP of sample 1 and sample 4 continuously shifted in the negative direction with an increasing immersion time and achieved its steady-state potential when the immersion time was 1200 s. This indicates that the working surface of samples was not a spontaneous passivation state but was an active state. The systems were stable after 1200 s. The OCP of sample 2 and sample 3 continuously shifted in the positive direction with an increasing immersion time, and the OCP obtained steady-state potential after about 1100 s. It suggested that the passive film formed spontaneously on the surface of samples 2 and 3. The steady state potentials of samples 1–4 were −0.7 V, −0.12 V, −0.29 V, and −0.56 V, respectively.
The potentiodynamic polarization curves of samples in 3.5 wt.% NaCl solution are shown in Figure 7. Corrosion potential (Ecorr) and corrosion current density (icorr) are listed in Table 3.
The order of Ecorr of samples from high to low was sample 2, 3, 4, and 1. The order of the icorr from small to large was the same as that of Ecorr from high to low. The corrosion potential of sample 2 was the highest, and the corrosion current density was the lowest, indicating that the corrosion resistance of sample 2 was the best. The listed data also showed that the corrosion resistance of sample 1 was the worst. The corrosion resistance of sample 3 and sample 4 manufactured by Q345 and 308 feeding wire was between sample 1 and sample 2. The corrosion resistance of sample 3 was better than sample 4 because the two kinds of feeding wire were completely fused, its microstructure was uniform, and there was no obvious interface.
Figure 8 shows the impedance spectra, which are presented in both Nyquist and Bode plots. Figure 8a,c correspond to the Nyquist plots of samples 1, 3, 4, and 2, respectively. The Nyquist plots revealed capacitive arc characteristics of the samples. The corrosion resistance of samples was related to the diameter of the semicircular arc. The larger the diameter was, the better the corrosion resistance of samples [22]. Figure 8a,b corresponds to the Nyquist and Bode plots of sample 1, 3, and 4, respectively. It seems sample 1 had the best corrosion resistance among the three samples, which is inconsistent with the results of potentiodynamic polarization. This needs to be combined with polarization curves and SEM analysis to be further discussed. The diameter of the capacitive semi-arc of sample 4 was lower than that of sample 3, indicating inferior protection provided by the passive film formed on sample 4 [23]. These results are consistent with the results of potentiodynamic polarization in Figure 7. Compared with Figure 8a, it can be seen in Figure 8c that the diameter of sample 2 had the largest semicircular arc among the four samples, which means that sample 2 had the best corrosion resistance. In the Bode diagram, sample 2 displays a high phase angle maximum, which indicates that the passive film formed on sample 2 had a better protective capability. Compared with the other three samples, sample 2 had the highest corrosion resistance. The finding is consistent with the results of potentiodynamic polarization.
Equivalent electrical circuits were employed to analyze the EIS data of the samples. Figure 9 shows the equivalent circuits (EC) of samples. The EC of sample 1, 3, and 4 were composed of a capacitor and an impedance, respectively. The EC of sample 2 had two capacitors, indicating that sample 2 had a larger capacitive arc and better corrosion resistance. This conclusion is consistent with the above analysis.
Table 4 lists the fitting values obtained from the proposed equivalent circuit model in Figure 9. In the equivalent circuit, Rs, Qdl/Cdl, Qa, Rct, Ra, and L are the solution resistance, the double layer capacitor, the membrane capacitance, the charge transfer resistance, the membrane resistance, and the inductance impedance, respectively. The factor n is a CPE power, and it is an adjustable parameter from 0.5 to 1. The Ra value of the corrosion product film formed in the corrosion process is related to the compactness of the corrosion product film. The larger the Ra value is, the thicker the corrosion product film is, the better the compactness is, the higher the protection degree of the material is, and the better the corrosion resistance of the material is [24]. The value of Ra in order from larger to smaller was samples 2, 1, 3, and 4, indicating that sample 2 had the best corrosion resistance among the four samples. This is consistent with the value of icorr obtained in Figure 7 and Table 3.
Figure 10 shows SEM images of corrosion products formed on the surface of samples after corrosion in 3.5% NaCl. From Figure 10a, it can be seen that there was a layer of corrosion product film on the surface of sample 1. According to EDS test results of point A in Figure 10a, it can be seen that the atomic ratio of Fe and O in the corrosion product was close to 2:3, which infers that the corrosion product was mainly Fe2O3. The corrosion product layer formed on sample 1 surface had shielding and blocking property that gave the sample 1 surface a more significant impedance. This is why sample 1 had a larger impedance arc. The impedance of the system increased with the increase in oxide film. Cui et al. observed similar results of impedance with oxide film [25].
Figure 10b shows that the corrosion in sample 2 of 308 stainless steel WAAM was mainly pitting corrosion and local corrosion in 3.5% NaCl solution because the chloride ion is sensitive to pitting corrosion. Figure 10c shows that the surface of sample 3 was smooth after electrochemical corrosion. After amplification, it can be seen that the corrosion cracked in the grain boundaries and that it was due to uniform corrosion. The EDS of the B point shows that there were Cr and Ni elements in sample 3. The corrosion morphology of sample 4 is shown in 10d; the side of 308 stainless steel was smooth, and there were granular corrosion products and corrosion cracks on the right. The preparation process determined this result. There was an obvious interface in the middle.
Figure 11 shows the distribution of elements near to the interface. The comparative analysis of Figure 11a,c shows that the content of Fe decreased after corrosion, which indicates that Fe was dissolved as an anode. Due to the structural fluctuation, energy fluctuation, and compositional fluctuation at the interface during the additive manufacturing process, Cr and Ni elements diffused from the 308 side onto the Q345 side [26,27,28], resulting in improved corrosion resistance on the Q345 side. The Cr element is the most critical and decisive alloying element in duplex stainless steel. It can form a dense and stable Cr2O3 film, which can prevent the infiltration corrosion of the medium on the metal matrix and play a role in the corrosion resistance of duplex stainless steel [29]. Cr and Ni can also improve the electrode potential and electrochemical corrosion resistance of iron-based solid solutions.
Through the above comprehensive analysis, the corrosion resistance of sample 2 was the best, followed by samples 3, 4, and 1.

4. Conclusions

(1)
The Q345/308 bimetallic material parts were fabricated by wire-arc additive manufacturing. Its microstructure depended on the process. When the feeding wire mode was horizontal parallel wire feeding, its microstructure was fine and had many sub-crystal boundaries, and there was no apparent interface between Q345 and 308. When the feeding wire mode was upper and lower interval wire feeding, it had an obvious interface. The average hardness of bimetal wire additive was higher than that of single wire-arc additive manufacturing.
(2)
The corrosion resistance of bimetal wire Q345/308 wire-arc additive manufacturing was better than that of Q345. Pitting corrosion had been improved with Q345 and 308 bimetallic additive manufacturing.

Author Contributions

Project administration, X.W.; data curation, Q.H.; formal analysis, X.S. and Z.T. All authors have read and agreed to the published version of the manuscript.

Funding

The National Science Foundation of China (Nos. 51675249), the Doctoral Research Fund of Jiangsu University of Science and Technology (Nos.1062931604) supported this research.

Institutional Review Board Statement

Not applicable.

Informed Consent Statement

Not applicable.

Data Availability Statement

The data used to support the findings of this study are available from the corresponding authors upon request.

Conflicts of Interest

The authors declare no conflict of interest.

References

  1. Loh, G.H.; Pei, E.; Harrison, D.; Monzon, M.D. An overview of functionally graded additive manufacturing. Addit. Manuf. 2018, 23, 34–44. [Google Scholar] [CrossRef] [Green Version]
  2. Monkova, K.; Zetkova, I.; Kučerova, L.; Zetek, M.; Monka, P.; Dana, M. Study of 3D printing direction and effects of heat treatment on mechanical properties of MS1 maraging steel. Arch. Appl. Mech. 2019, 89, 791–804. [Google Scholar] [CrossRef]
  3. Monkova, K.; Monka, P.P.; Tkac, J.; Vanca, J. A bending test of the additively produced porous sample. In Proceedings of the 5th International Conference on the Industry 4.0 Model for Advanced Manufacturing, Belgrade, Serbia, 1–4 June 2020; Lecture Notes in Mechanical Engineering. Springer: Cham, Switzerland, 2020. [Google Scholar] [CrossRef]
  4. Unocic, R.; DuPont, J. Process efficiency measurements in the laser engineered net shaping process. Metall. Mater. Trans. B 2004, 35, 143–152. [Google Scholar] [CrossRef]
  5. Rannar, L.E.; Glad, A.; Gustafson, C.G. Efficient cooling with tool inserts manufactured by electron beam melting. Rapid Prototyp. J. 2007, 13, 128–135. [Google Scholar] [CrossRef]
  6. DuPont, J.; Marder, A. Thermal efficiency of arc welding processes. Weld. J. Incl. Weld. Res. Suppl. 1995, 74, 406. [Google Scholar]
  7. Stenbacka, N. On arc efficiency in gas tungsten arc welding. Soldag. Inspeção 2013, 18, 380–390. [Google Scholar] [CrossRef] [Green Version]
  8. Ning, J.; Na, S.J.; Zhang, L.J.; Wang, X.; Long, J.; Cho, W.I. Improving thermal efficiency and stability of laser welding process for magnesium alloy by combining power modulation and subatmospheric pressure environment. J. Magnes. Alloy 2021, in press. [Google Scholar] [CrossRef]
  9. Hu, Q.X.; Miao, J.Y.; Wang, X.L.; Li, C.T.; Fang, K.W. Microstructure and Properties of ER50-6 Steel Fabricated by Wire Arc Additive Manufacturing. Scanning 2021, 2021, 7846116. [Google Scholar] [CrossRef]
  10. Ma, Y.; Cuiuri, D.; Li, H.; Pan, Z.; Shen, C. The effect of postproduction heat treatment on γ-TiAl alloys produced by the GTAW-based additive manufacturing process. Mater. Sci. Eng. A 2016, 657, 86–95. [Google Scholar] [CrossRef]
  11. Martina, F.; Mehnen, J.; Williams, S.W.; Colegrove, P.; Wang, F. Investigation of the benefits of plasma deposition for the additive layer manufacture of Ti-6Al-4V. J. Mater. Process. Technol. 2012, 212, 1377–1386. [Google Scholar] [CrossRef] [Green Version]
  12. Ozsoy, A.; Tureyen, E.B.; Baskan, M.; Yasa, E. Microstructure and mechanical properties of hybrid additive manufactured dissimilar 17-4 ph and 316l stainless steels. Mater. Today Commun. 2021, 28, 102561. [Google Scholar]
  13. Chen, N.N.; Khan, H.A.; Wan, Z.X.; Lipper, J.; Sun, H.; Shang, S.L.; Liu, Z.K.; Li, J.J. Microstructural characteristics and crack formation in additively manufactured bimetal material of 316l stainless steel and Inconel 625. Addit. Manuf. 2020, 32, 101037. [Google Scholar] [CrossRef]
  14. Ytab, C.; Jsab, C.; Sha, B.; Jian, G.; Yan, C. Effects of cold metal transfer mode on the reaction layer of wire and arc additive-manufactured Ti-6Al-4V/Al-6.25Cu dissimilar alloys—Sciencedirect. J. Mater. Sci. Technol. 2020, 74, 35–45. [Google Scholar]
  15. Ding, D.; Pan, Z.; Cuiuri, D.; Li, H. Wire-feed additive manufacturing of metal components: Technologies, developments and future interests. Int. J. Adv. Manuf. Technol. 2015, 81, 465–481. [Google Scholar]
  16. Hao, X.H.; Dong, H.G.; Yu, F.Y.; Li, P.; Yang, Z.L. Arc welding of titanium alloy to stainless steel with cu foil as interlayer and ni-based alloy as filler metal. J. Mater. Res. Technol. 2021, 13, 48–60. [Google Scholar] [CrossRef]
  17. Shamanian, M.; Eghlimi, A.; Eskandarian, M.; Szpunar, J.A. Interface microstructure across cladding of super duplex stainless steel with austenitic stainless steel buffer layer. Surf. Coat. Technol. 2014, 259, 532–542. [Google Scholar] [CrossRef]
  18. Tarasov, S.Y.; Filippov, A.V.; Shamarin, N.N.; Fortuna, S.V.; Maier, G.G.; Kolubae, E.A. Microstructural evolution and chemical corrosion of electron beamwire-feed additively manufactured AISI 308 stainless steel. J. Alloys Compd. 2019, 803, 364–370. [Google Scholar] [CrossRef]
  19. Kura, W.; Fisher, D.J. Fundamentals of Solidification, 3rd ed.; Trans Tech Publications: Aedermansdorf, Switzerland, 1992. [Google Scholar]
  20. Saboori, A.; Aversa, A.; Bosio, B.; Bassini, E.; Librera, E.; De Chirico, M.; Biamino, S.; Ugues, D.; Fino, P.; Lombardi, M. An investigation on the effect of powder recycling on the microstructure and mechanical properties of AISI 316L produced by Directed Energy Deposition. Mater. Sci. Eng. A 2019, 766, 138360. [Google Scholar] [CrossRef]
  21. Zhang, C.H.; Zhang, H.; Wu, C.L.; Zhang, S.; Sun, Z.L.; Dong, S.Y. Multilayer functional graded stainless steel fabricated by laser melting deposition. Vaccum 2017, 141, 181–187. [Google Scholar] [CrossRef]
  22. Ares, A.E.; Gassa, L.M. Corrosion susceptibility of Zn-Al alloys with different grains and dendritic microstructures in NaCl solutions. Corros. Sci. 2012, 59, 290–306. [Google Scholar]
  23. Nady, H.; EL-Rabiei, M.M.; Samy, M. Corrosion behavior and electrochemical properties of carbon steel, commercial pure titanium, copper and copper-aluminum-nickel alloy in 35% sodium chloride containing sulfide ions. Egypt. J. Petrol. 2017, 26, 79–94. [Google Scholar] [CrossRef] [Green Version]
  24. Hamadou, L.; Kadri, A.; Benbrahi, M.N. Characterisation of passive film formed on low carbon steel in borate buffer solution by electrochemical impedance spectroscopy. Appl. Surf. Sci. 2005, 252, 1510–1519. [Google Scholar] [CrossRef]
  25. Cui, Z.Y.; Chen, S.S.; Dou, Y.P.; Han, S.K.; Wang, L.W.; Man, C.; Wang, X.; Chen, S.G.; Cheng, Y.F.; Li, X.G. Passivation behavior and surface chemistry of 2507 super duplex stainless steel in artifificial seawater: Influence of dissolved oxygen and pH. Corros. Sci. 2019, 150, 218–234. [Google Scholar]
  26. Chen, C.; Liu, N.; Zhang, J.; Cao, J.; Wang, L.J.; Xiang, H.F. Microstructure stability and oxidation behavior of (FeCoNiMo)90(Al/Cr)10 high entropy alloys. Mater. Sci. Tech. 2019, 35, 1883–1890. [Google Scholar] [CrossRef]
  27. Liu, N.; Ding, W.; Wang, X.J.; Zhang, J.; Zhou, P.J.; Mu, C. Phase, microstructures and properties of multi-component FeCoNi-based alloys. Mater. Sci. Tech. 2020, 36, 654–660. [Google Scholar]
  28. Liu, N.; Xu, M.; Qian, Y.Y.; Zhou, P.J. Microstructure, Phase stability, and oxidation resistance of (FeCoNi)60Al15Cr25-xTix High entropy alloys. J. Alloys Compd. 2021, 870, 159320. [Google Scholar] [CrossRef]
  29. Zanotto, F.; Grassi, V.; Balbo, A.; Monticelli, C.; Zucchi, F. Stree corrosion cracking of LDX 2101 duplex stainless steel in chloride solutions in the presence of thiosulphate. Corros. Sci. 2014, 80, 205–212. [Google Scholar] [CrossRef]
Figure 1. The position between tungsten and wire (horizontal parallel wire feeding of sample 3).
Crystals 11 01401 g001
Figure 2. The extract location of microstructure, hardness test, and corrosion test.
Crystals 11 01401 g002
Figure 3. Macroscopic morphology of additive manufactured samples; (ad) is sample 1, 2, 3, and 4, respectively.
Crystals 11 01401 g003
Figure 4. Optical microstructures of samples. (a) Sample 1: Q345, (b) sample 2: 308, (c,d) sample 3 and 4, respectively.
Crystals 11 01401 g004
Figure 5. The curves of hardness (a) and average hardness (b) of samples (I is the arc additive manufactured layers, II is the heat-affected zone, and III is the substrate).
Crystals 11 01401 g005
Figure 6. Evolution of OCP evolution of samples with immersion time in 3.5% NaCl solution.
Crystals 11 01401 g006
Figure 7. Potentiodynamic polarization curves of samples in 3.5 wt.% NaCl solution.
Crystals 11 01401 g007
Figure 8. Nyquist and Bode plots of samples. (a,b) corresponds to the Nyquist and Bode plots of sample 1, 3, and 4, respectively, (c,d) the Nyquist and Bode plots of sample 2, respectively.
Crystals 11 01401 g008
Figure 9. The EC were used for fitting the impedance data of samples; (ad) are samples 1, 2, 3, and 4, respectively, after the electrochemical test.
Crystals 11 01401 g009
Figure 10. SEM images of corrosion products formed on the surface of samples 1, 2, 3 an 4 after corrosion in 3.5% NaCl. (ad) are samples 1, 2, 3, and 4, respectively.
Crystals 11 01401 g010
Figure 11. Element distribution curve near to the interface; (a) is the element distribution before corrosion, and (b) is the partial curve amplification of Figure 10a. Accordingly, (c,d) is the element distribution curve after corrosion.
Crystals 11 01401 g011
Table 1. The composition of 308 and Q345 wire (wt.%).
WireCMnSiCrNiSPFe
Q3450.21.0–1.6≤0.5≤0.3≤0.50.0350.035Bal.
3080.051.630.5118.528.640.0120.024Bal.
Table 2. The process parameters for 308/Q345 additive manufacturing with GTAW.
SampleCurrent (A)Q345/308 Wire Feeding Speed (cm/min)Wire Feeding Mode
1 (Q345)150100/
2 (308)150100/
3 (Q345 + 308)15080 (Q345) + 100 (308)Horizontal parallel wire feeding
4 (Q345 + 308)150100 (Q345) + 100 (308)Upper and lower interval wire feeding
Table 3. Electrochemical parameters extracted from potentiodynamic polarization curves (Figure 6).
Sample1234
Ecorr (VSCE)−1.00−0.24−0.82−0.92
icorr (A·cm−2)1.14 × 10−43.92 × 10−71.81 × 10−55.17 × 10−5
Table 4. Calculated values of EC components in Figure 8.
SampleRsQdl/CdlnQanRctRaL
1#4.011.08 × 10−30.7855.9122.715.59
2#4.573.17 × 10−50.578.87 × 10−50.911.212.57 × 104
3#5.444.56 × 10−54.275.780.2
4#4.116.60 × 10−54.870.710.04
Rs—the solution resistance; Qdl/Cdl—the double layer capacitor; Qa—the membrane capacitance. Rct—the charge transfer resistance; Ra—the membrane resistance; L—and the inductance impedance.
Publisher’s Note: MDPI stays neutral with regard to jurisdictional claims in published maps and institutional affiliations.

