Article

Design and Development of a Novel Ultrasonic Field Wetting Angle Measuring Instrument for Researching the Wetting of the Liquid–Solid Interface

1
School of Materials Science and Engineering, Northeastern University, Shenyang 110004, China
2
Key Laboratory of Lightweight Structural Materials, Northeastern University, Shenyang 110819, China
*
Author to whom correspondence should be addressed.
Crystals 2021, 11(11), 1400; https://doi.org/10.3390/cryst11111400
Submission received: 23 October 2021 / Revised: 10 November 2021 / Accepted: 14 November 2021 / Published: 17 November 2021

Abstract

:
A key technical problem in the preparation of Al-Ti-C grain refiner and other composite materials is the poor wetting of the Al-C interface, which greatly restricts the development of the preparation technology of related composite materials. In view of this scientific challenge, a novel ultrasonic field wetting angle measuring instrument has been designed to research the wetting behavior of the liquid–solid interface and ensure that preparation conditions are optimized. The dimensional parameters of the ultrasonic transducer and the horn in the novel ultrasonic wetting angle measuring instrument have been designed by theoretical calculation, and the modal analysis was performed for the ultrasonic horn using the functions of displacement and time. Modal analysis was utilized to optimize the dimension of the ultrasonic horn, and the natural frequency of the longitudinal vibration of the horn was reduced from 22,130 Hz to 22,013 Hz, resulting in an error rate between the actual value (22,013 Hz) and the design value (20 kHz) of less than 1%. In addition, the influence of different transition arc radiuses on the maximum stress of the optimized ultrasonic horn was analyzed.

1. Introduction

Liquid–solid interface behavior is a common physicochemical phenomenon in processes of material preparation and chemical synthesis, such as welding, liquid-phase sintering, chemical reactions of solid surfaces in liquid phase, metallurgical processes and interface reactions, and wetting behavior of some composite materials [1,2,3]. The research of liquid–solid interface behavior has important scientific significance in theory, and it is key in the preparation of composite materials, which determines the possibility of composite preparation, the final microstructure, and properties and production efficiency [4]. However, the liquid–solid interface is difficult to wet during the preparation of some composite materials, which greatly limits the development of composite materials preparation technology. For example, in the in situ synthesis process of Al-Ti-C grain refiner and TiCp-reinforced Al matrix composites, synthesis and preparation are very difficult due to the poor wetting of the Al-C interface [5,6,7,8].
Studies have shown that adding alloying elements and increasing the temperature of liquid metal could improve the wetting of the interface [9,10,11], as while the performance of the prepared material is poor, the wetting effect is not obvious. In order to solve the difficulty of interface wetting, researchers found that a high intensity ultrasonic field could achieve the wetting and dispersion of the reinforcement in the matrix in a very short time [12,13,14]. Zhao et al. [6] reported that the application of an ultrasonic field in the preparation of Al-Ti-C grain refiner could improve the wetting of the Al-C interface. Sarasua [15] sheds light on how ultrasound can instantly adjust the contact angle by tuning the vibration amplitude, and a thermodynamic model describing how ultrasound decreases the contact angle in a three-phase wetting system has been developed. Moreover, analytical and experimental research has been carried out in order to demonstrate that ultrasound is an important competitor to surfactants in terms of energy efficiency and environmental friendliness. Shrestha [16] directly address the wetting for membrane-based desalination and separation of oil-saline water mixtures by applying a superhydrophilic and oleophobic coating to a commercial membrane surface. Ezazi [17] developed a water-responsive self-repairing superomniphobic film by utilizing a cross-linked HPC-SiO2 composite treated with a low-surface-energy perfluorosilane. The HPC-SiO2 film can repair a deep scratch and restore its inherent superomniphobic wetting and mechanical hardness upon exposure to water vapor. Lebon [18,19,20] found that the ultrasonic field can improve the wetting between the reinforcing phase and the metal melt, thereby increasing the strengthening effect of the particles relative to the base metal. The results of previous research show that the application of an ultrasonic field has become an effective technology to regulate the wetting of the liquid–solid interface in the processes of composite materials preparation and chemical synthesis [21,22,23,24,25,26,27].
Although many efforts have been made to improve the wetting of the liquid–solid interface, an ultrasonic field wetting angle measuring instrument has not been developed, and similar devices were limited to the conventional measurement of wetting angle [28,29]. The main reason is that the circulation and turbulence caused by the acoustic streaming effect in the melt form discrete spectrums such as harmonics and sub-harmonics, resulting in the ultrasonic field being difficult to control [30]. Another important reason is that the acoustic cavitation causes cavitation damage during the coupling process between the ultrasonic horn and the melt and a reverberant sound field appears in the melt, which ultimately leads to the drift of system resonant frequency and the reduction of acoustic coupling efficiency. Therefore, a novel ultrasonic field wetting angle measuring instrument has been designed to research the wetting of the liquid–solid interface in the preparation of composite materials.
Generally, the main components of the ultrasonic treatment device are an ultrasonic generator, a transducer, an ultrasonic horn, a tool head, etc. [31,32]. The function of the transducer is to convert the electrical signal generated by the transmitter into mechanical vibration, which provides the amplitude required for the preparation of the composite materials [33,34]. However, the amplitude of vibration produced by the transducer is of order 5–10 μm, which is very low for the preparation of the composite materials [31,35]. As an important part, the ultrasonic horn, also termed as an amplifier, transformer, concentrator, or acoustic coupler, is employed to magnify the amplitude of vibration to a value suitable for the preparation of the composite materials [32,36]. In addition, the frequency of the horn is the same as the frequency of the transducer, which results in the ultrasonic vibration system reaching a resonance state. Therefore, the design of ultrasonic horn is an important aspect for achieving a large amplitude and the resonant state of the system, which achieves the technical requirements of ultrasonic processing on the liquid–solid interface.
The structural diagram of the novel ultrasonic field wetting angle measuring instrument is illustrated in Figure 1. In this paper, the design of the novel ultrasonic field wetting angle measuring instrument was mainly divided into three steps: Firstly, the dimensions of the transducer and horn of the ultrasonic vibration system were theoretically designed. The ultrasonic vibration system was assembled into a conventional wetting angle measuring instrument which could perform the research of improving the wetting of the liquid–solid interface under an ultrasonic field, and the design was an important innovation of the device. Secondly, modal analysis was performed to verify the natural frequency of the ultrasonic horn in longitudinal vibration, and the horn was optimized when combined with the modal analysis. Finally, the influence of different transition arc radiuses on the maximum stress of the optimized ultrasonic horn was analyzed.

2. Materials and Methods

2.1. Ultrasonic Transducer Design

The frequency of the sandwich piezoelectric ultrasonic transducer designed in this paper was 20 kHz, and the structural diagram is shown in Figure 2. In order to reduce the material used in the transducer, it was necessary to design it as a reasonable size to ensure that the transducer had an ideal vibration state. The most common design methods for a sandwich piezoelectric transducer include the half wavelength method and the quarter wavelength method. The transducer designed by the half wavelength method easily caused the piezoelectric plate to vibrate in an extra direction (the piezoelectric plate requires longitudinal vibration). In this paper, the most common quarter wavelength and piezoelectric ceramic transducer was adopted because the piezoelectric ceramic transducer can generate stable ultrasonic wave when the load changes. Meanwhile, the quarter wavelength transducer also has the characteristics of large amplitude, high electro-acoustic conversion rate, low calorific value, and high reliability. Because of the large electromechanical coupling factors and stable material characteristics of PZT ceramics, the transducer piezoelectric plate adopts PZT-8 piezoelectric ceramic material [37,38]. The number of piezoelectric ceramics must be an even number to ensure that the polarities of the front and rear cover plates are consistent. Two conventional piezoelectric ceramics were difficult to meet the power requirements, therefore we used four circular PZT-8 piezoelectric ceramics with holes.
The design principle of the ultrasonic transducer was as follows: firstly, the overall length of the transducer was equal to the half wavelength of the fundamental wave, AB was the nodal plane, and the transducer was regarded as two quarter-wavelength vibrators on the left and right. Secondly, the frequency equations of the left and right vibrators were derived. The dimensions of the front and rear covers were obtained according to the number of piezoelectric ceramics and the frequency equation of each vibrator. The AB node plane was the center position of the piezoelectric plate, as shown in Figure 2. LC1 and LC2 were the thickness of the two piezoelectric ceramics; that is, LC1 was equal to LC2. L1 and L2 were the length of the rear cover and the front cover, respectively. D0 was the outer diameter of the piezoelectric ceramic, d0 was the inner diameter of the piezoelectric ceramic, and D1 was the diameter of the front and rear cover.
Figure 3a shows the equivalent circuit diagram of each component of the ultrasonic transducer. ZA represents the load impedance of the transmitter and ZB represents the load impedance of the horn. Normally, the transducer would not be connected to the transmitter and in the no-load state, which resulted in the ZA being zero. When the transducer was connected to different horns, ZB had different values, which was also regarded as the no-load state. According to the boundary conditions, the displacement and force of each component of the transducer were continuous, and the equivalent circuit of each component could be connected in series. Therefore, Figure 3a can be converted into a composite equivalent circuit diagram containing load impedance Zm1 and Zm2, as shown in Figure 3b. The left vibrator consists of two PZT-8 piezoelectric ceramics and a rear cover, and the rear cover was regarded as the load of piezoelectric ceramics. Combined with Figure 3b, the equivalent circuit diagram of the left vibrator can be obtained, as shown in Figure 3c.
The equations of Z1p and Z2p can be expressed as:
Z 1 p = j ρ c e S tan ( k e L c 1 2 )
Z 2 p = ρ c e S j sin ( k e L c 1 )
The load impedance of piezoelectric ceramics is defined as:
Z m 1 = R m 1 + j X m 1
Assuming that the transducer and the rear cover have no loss, R m 1 = 0 , the load impedance of the piezoelectric ceramic can be simplified as:
Z m 1 = j X m 1 = j ρ 1 c 1 S 1 tan ( k 1 L 1 )
Because the displacement at the AB node plane was zero, the right of the equivalent circuit of the vibrator in Figure 3c was open circuit. According to the total impedance of the circuit of zero, the frequency equation of the left vibrator can be expressed as:
Z 1 p + Z 2 p + Z m 1 = 0
Substituting Equations (1), (2), and (4) into Equation (5), the frequency equation of the left vibrator can be described as:
j ρ c e S tan ( k e L c 1 2 ) + ρ c e S j sin ( k e L c 1 ) + j ρ 1 c 1 S 1 tan ( k 1 L 1 ) = 0
Derivation and transformation of the equation can be obtained as follows:
j ρ c e S ( 1 sin ( k e L c 1 ) tan ( k e L c 1 2 ) ) j ρ 1 c 1 S 1 tan ( k 1 L 1 ) = 1
j ρ c e S ( 1 2 sin ( k e L c 1 2 ) cos ( k e L c 1 2 ) 2 ( sin k e L c 1 2 ) 2 2 sin ( k e L c 1 2 ) cos ( k e L c 1 2 ) ) j ρ 1 c 1 S 1 tan ( k 1 L 1 ) = 1
j ρ c e S ( cos ( k 1 L c 1 ) 2 sin ( k 1 L c 1 2 ) cos ( k 1 L c 1 2 ) ) j ρ 1 c 1 S 1 tan ( k 1 L 1 ) = 1
Therefore, the final frequency equation of the left vibrator was expressed as:
ρ c e S = X m 1 tan ( k e L c 1 ) = ρ 1 c 1 S 1 tan ( k e L c 1 ) cot ( k 1 L 1 )
Similarly, the frequency equation of the right vibrator was expressed as:
ρ c e S = X m 2 tan ( k e L c 2 ) = ρ 2 c 2 S 2 tan ( k e L c 2 ) cot ( k 2 L 2 )
where, ρ ,   ρ 1 , and ρ 2 were the density of piezoelectric ceramics, rear cover, and front cover, respectively; c e , c 1 , and c 2 were the sound velocity of piezoelectric ceramics, rear cover, and front cover, respectively; k e , k 1 , and k 2 were the wave number of piezoelectric ceramics, rear cover, and front cover, respectively; S , S 1 , and S 2 . were the cross sectional area of piezoelectric ceramics, rear cover, and front cover, respectively.
The frequency of the ultrasonic equipment transmitter was 20 kHz. Because the ultrasonic energy was transmitted from the front cover to the horn, 2A12 duralumin with high transmission efficiency was selected for the front cover. The rear cover was connected to the transmitter and 45# steel with low transmission efficiency was selected to prevent the overflow of ultrasonic energy [39]. The material parameters used in ultrasonic transducer are shown in Table 1.
By transforming Equation (10), the frequency equation of the left vibrator can be expressed as:
tan ( k 1 L 1 ) = ρ c e S ρ 1 c 1 S 1 tan ( k e L c 1 )
Substituting the above parameters into Equation (12), the length dimension of the rear and front cover can be obtained: the length dimension L1 of the rear cover was 29 mm and the length dimension L2 of the front cover was 53 mm. Moreover, there was an electrode (thickness of 0.2 mm) between each piece of piezoelectric ceramic and the resulting length dimension of the piezoelectric ceramics stack was 20.8 mm.

2.2. Ultrasonic Horn Design

In this paper, the stepped horn with the highest amplitude amplification coefficient and succinctly designed dimensions was selected, and the 45# steel was employed in the manufacture of the ultrasonic horn. Figure 4 shows the structural schematic of the stepped ultrasonic horn.
When the simple harmonic vibration was applied on the stepped ultrasonic horn, the longitudinal wave vibration equation at the variable cross-section can be described as follows [31,40]:
2 ξ x 2 + 1 S × S x × ξ x + K 2 ξ = 0
where K was the circular wavenumber, K = ω / c ; ω is the ultrasonic circular frequency, rad/s; c was the longitudinal wave propagation velocity, c = E / ρ , E and ρ were the young’s modulus and density of the ultrasonic horn material; ξ was the displacement function of the particle, ξ = ξ ( x ) ; S was the cross-sectional area function of the ultrasonic horn, S = S ( x ) .
For the stepped ultrasonic horn, S(x) is a constant, the longitudinal wave vibration equation can be simplified as follows:
2 ξ x 2 + K 2 ξ = 0
The particle displacement of Equation (14) can be derived as follows:
{ ξ a = ( A 1 cos k x + B 1 sin k x ) ,   ( a < x < 0 ) ξ b = ( A 2 cos k x + B 2 sin k x ) ,   ( 0 < x < b )
According to the boundary conditions, A1, B1, A2 and B2 were expressed as:
A 1 = ξ 1 cos k a
B 1 = ξ 1 sin k a
A 2 = ξ 2 cos k b + F 2 sin k b E k S 2
B 2 = ξ 2 sin k b F 2 cos k b E k S 2 = ξ 2 ( sin k b + j Z F Z 02 cos k b )
Substituting Equations (17)–(20) into Equation (15), the final particle displacement equation can be rewritten as:
{ ξ a = ξ 1 cos [ K ( a + x ) ] ξ b = ξ 1 [ j Z F Z 02 sin K ( b x ) cos K ( b x ) ]
When the displacement node was x = 0, the horn was in the resonant state and the amplification of the horn was a function of the ratio of the squared radius. At this time, a = b = λ / 4 , and the length of the ultrasonic horn could be expressed as:
L = a + b = 2 a = λ / 2
Structural steel was used for ultrasonic horn analysis (the velocity of sound wave on structural steel is 5760 m/s) and the length of the horn was calculated according to Equation (21). Table 2 shows the parameters of the ultrasonic horn.

2.3. Modal Analysis of the Ultrasonic Horn

The modal analysis of the ultrasonic horn allows for knowing the natural frequencies of each mode and the deformations that the model has in each of these frequencies. The modal analysis of the horn adopts the relationship between displacement and time function, and the dynamic equilibrium equation in matrix form is expressed as [31]:
[ M ] { x } + [ C ] { x } + [ K ] { x } = { F ( t ) }
where [ M ] , [ C ] , and [ K ] denote mass matrix, damping matrix, and stiffness matrix, respectively, and { x } , { x } , and { x } denote acceleration, velocity, and displacement of vibrating body, respectively. Mode is an inherent property of any mechanical system, and each mode corresponds to a natural frequency, mode shape, and damping. The dynamic equilibrium equation of undamped free vibration can be simplified as:
[ M ] { x } + [ K ] { x } = { 0 }
The modal properties of ultrasonic horn are evaluated by solving the eigenvalue problem as follows [31,32]:
{ [ K ] ω i 2 [ M ] } x i = 0
where ω i denotes natural frequency of i th mode shape and x i i th denote eigenvector (mode shape) [31].
Considering the actual situation of the device, the diameters of the large and small ends of the horn have been kept at 38 mm and 13 mm, respectively. The parameters in Table 1 and ABAQUS software were used for modal analysis of the ultrasonic horn, and 25 modes were output from the calculation results. The solution can contain more than one natural frequency and corresponding mode shape in a given frequency range.

3. Results and Discussion

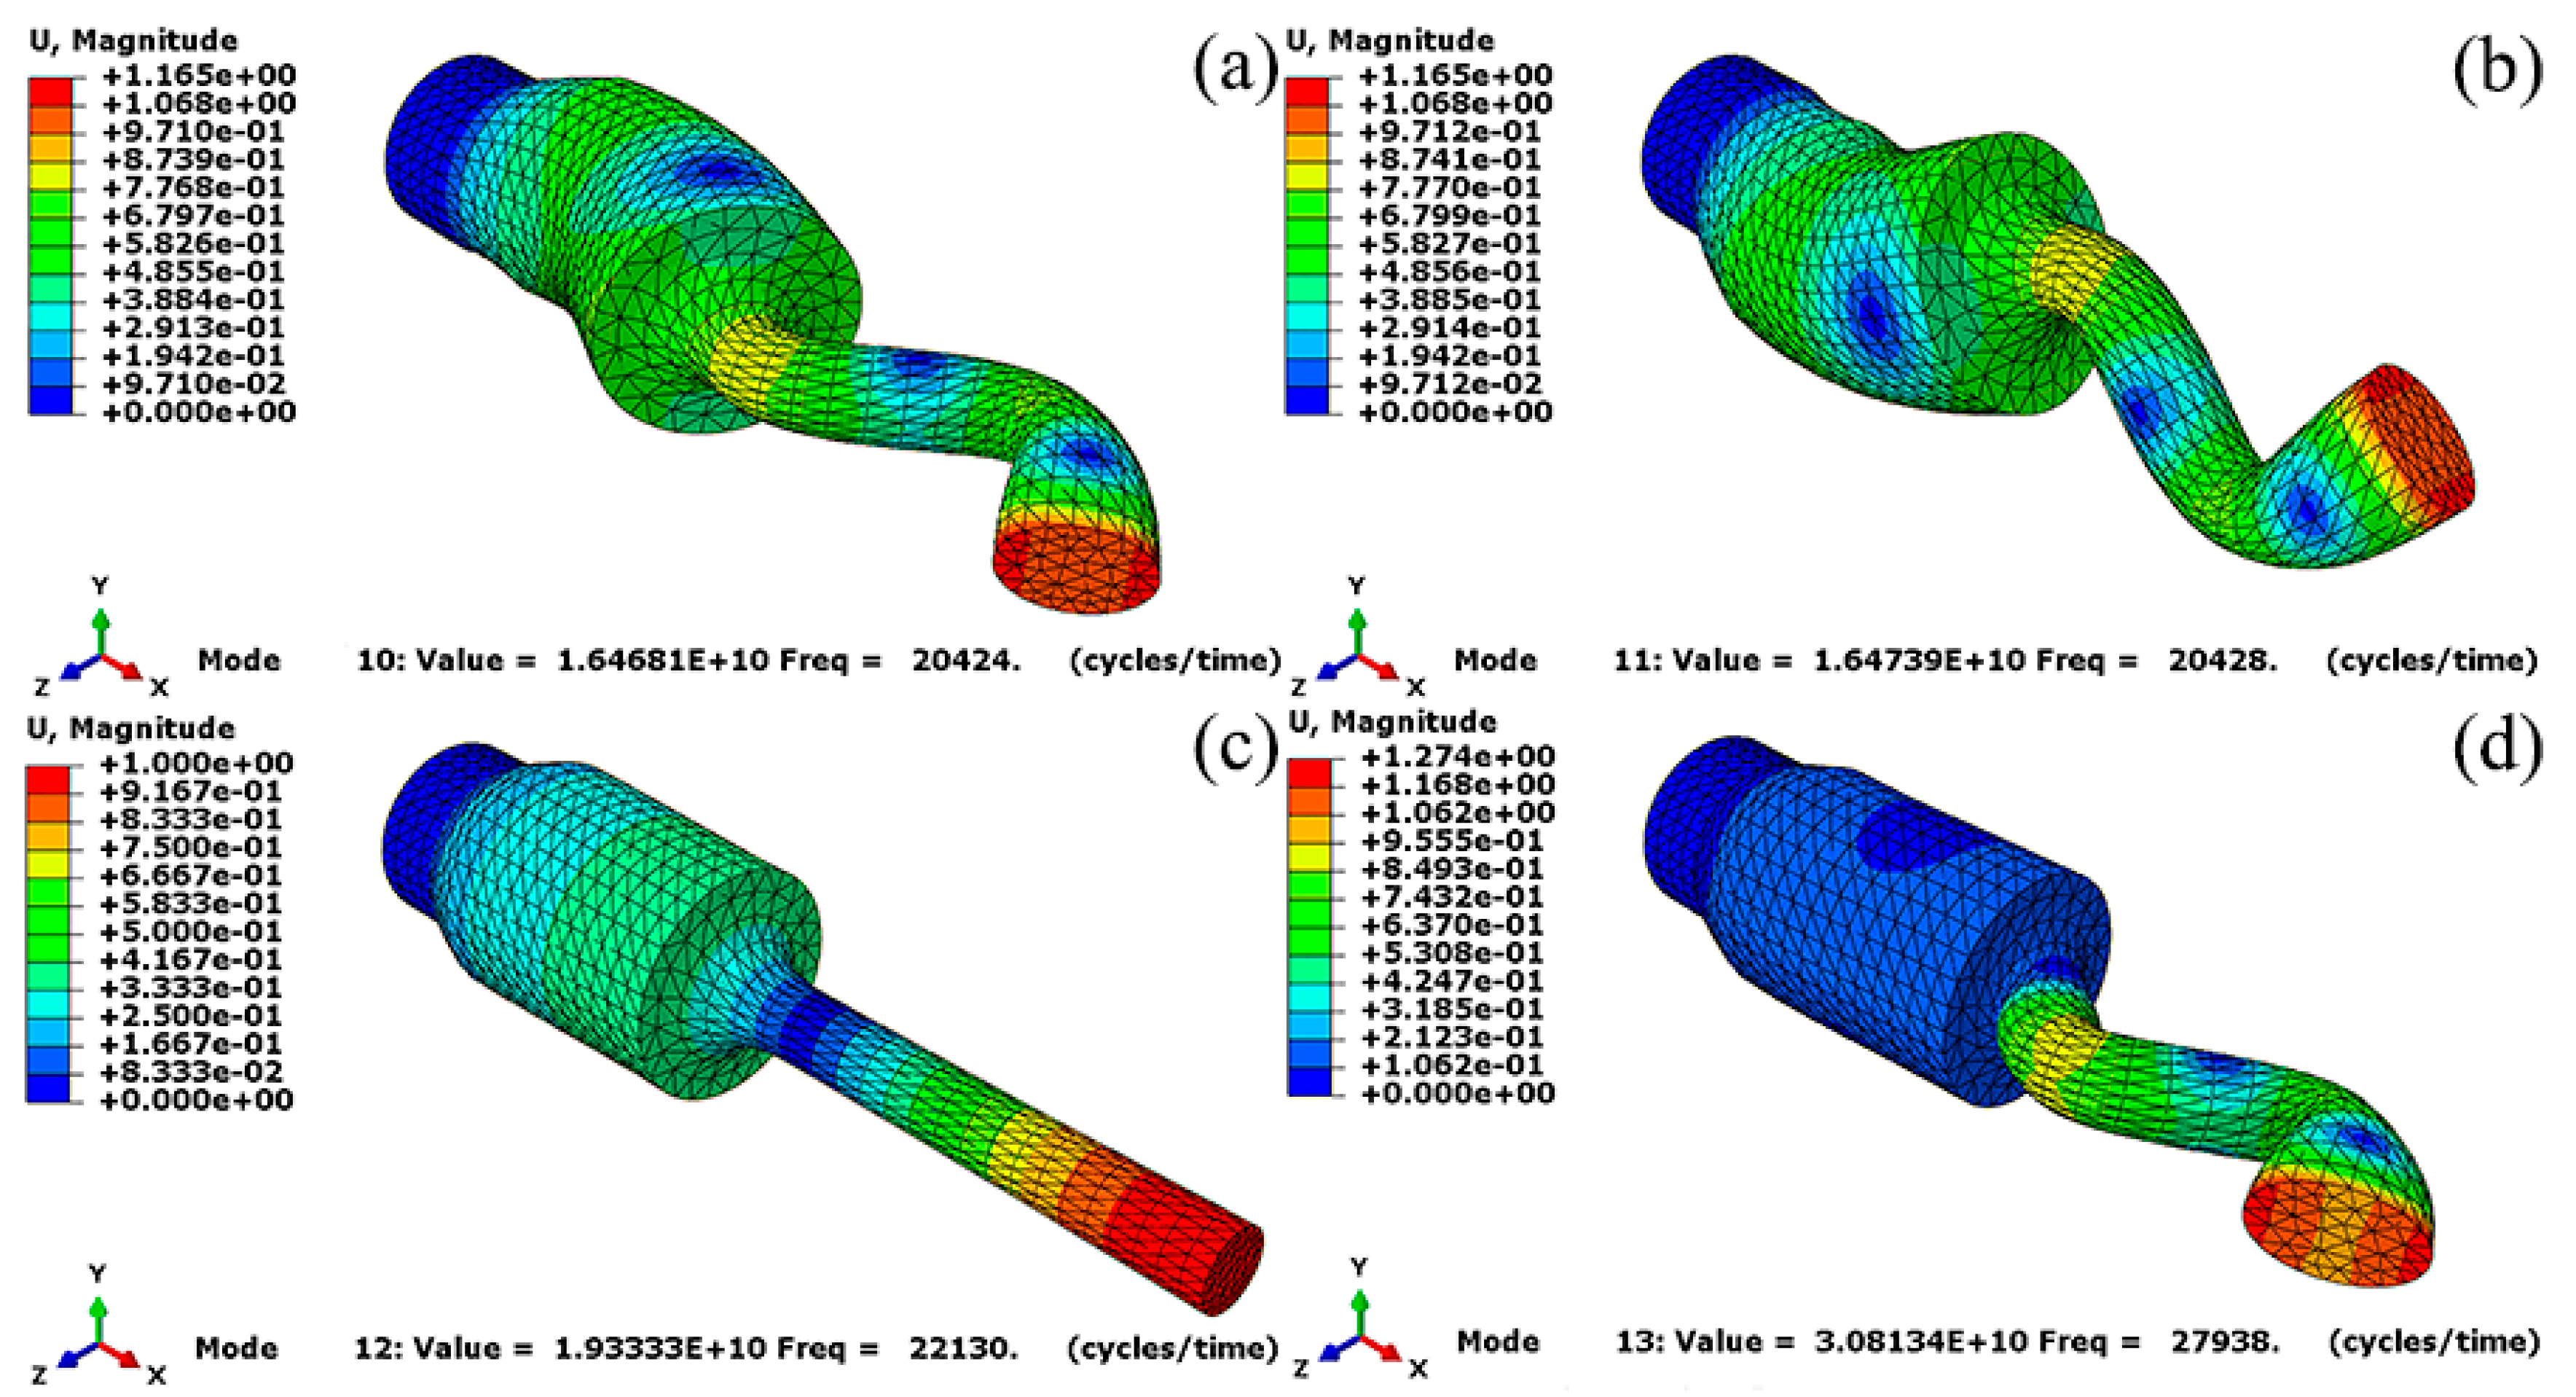
3.1. Modal Analysis Results

To verify the frequency value of the horn, the frequency extraction range was set to 10~30 kHz in the modal analysis of the horn, and the modal analysis results are shown in Table 3.
In the ideal resonant state, the frequency of the horn is the same as that of the ultrasonic transducer (20 kHz). It can be seen from Table 3 that there are three groups of natural frequencies close to 20 kHz; the frequencies are 20,424 Hz, 20,428 Hz, and 22,130 Hz, respectively. The frequency values of 10–13 modes were input into the model for the vibration mode verification of the horn, and the cloud diagram of the horn vibration mode is shown in Figure 5. It can be clearly seen from Figure 5a,b,d that the horn bends and vibrates along different coordinate axes when the natural frequency of the horn is 20,424 Hz, 20,428 Hz, and 27,938 Hz, respectively. Figure 5c shows the vibration mode of the horn with the natural frequency of 22,130 Hz, and the vibration mode is the longitudinal vibration along the X-axis, which achieves the design requirements of the stepped ultrasonic horn.

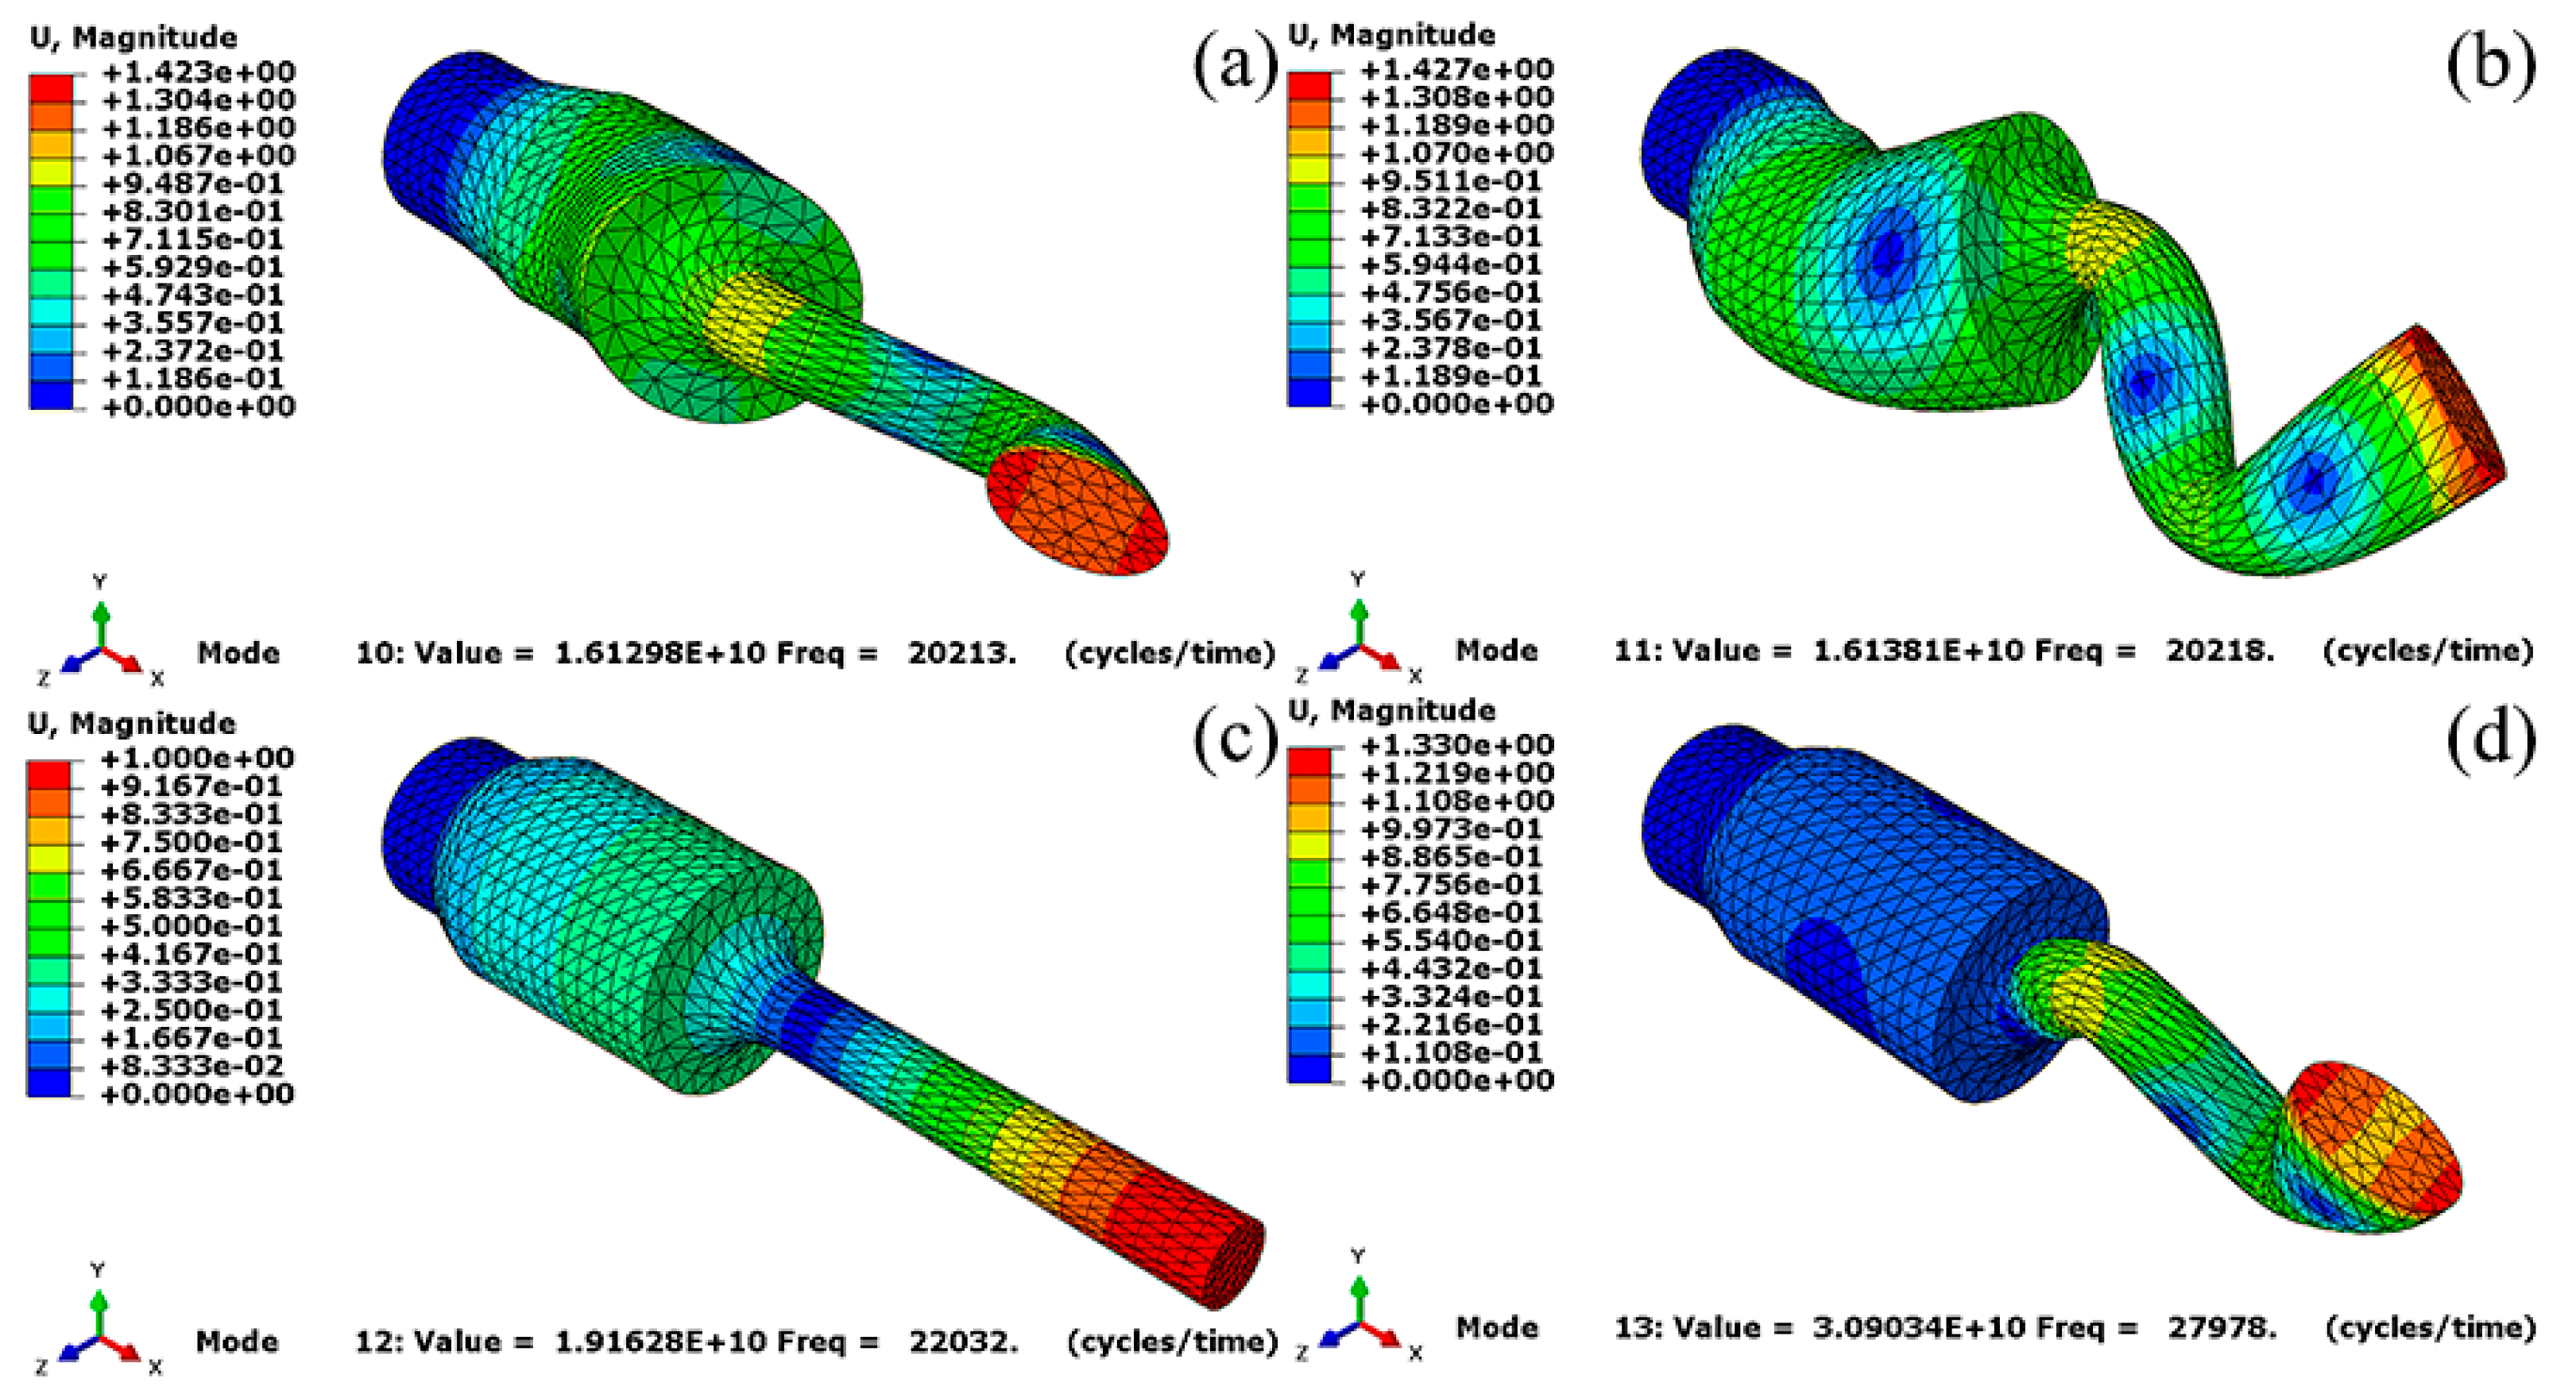
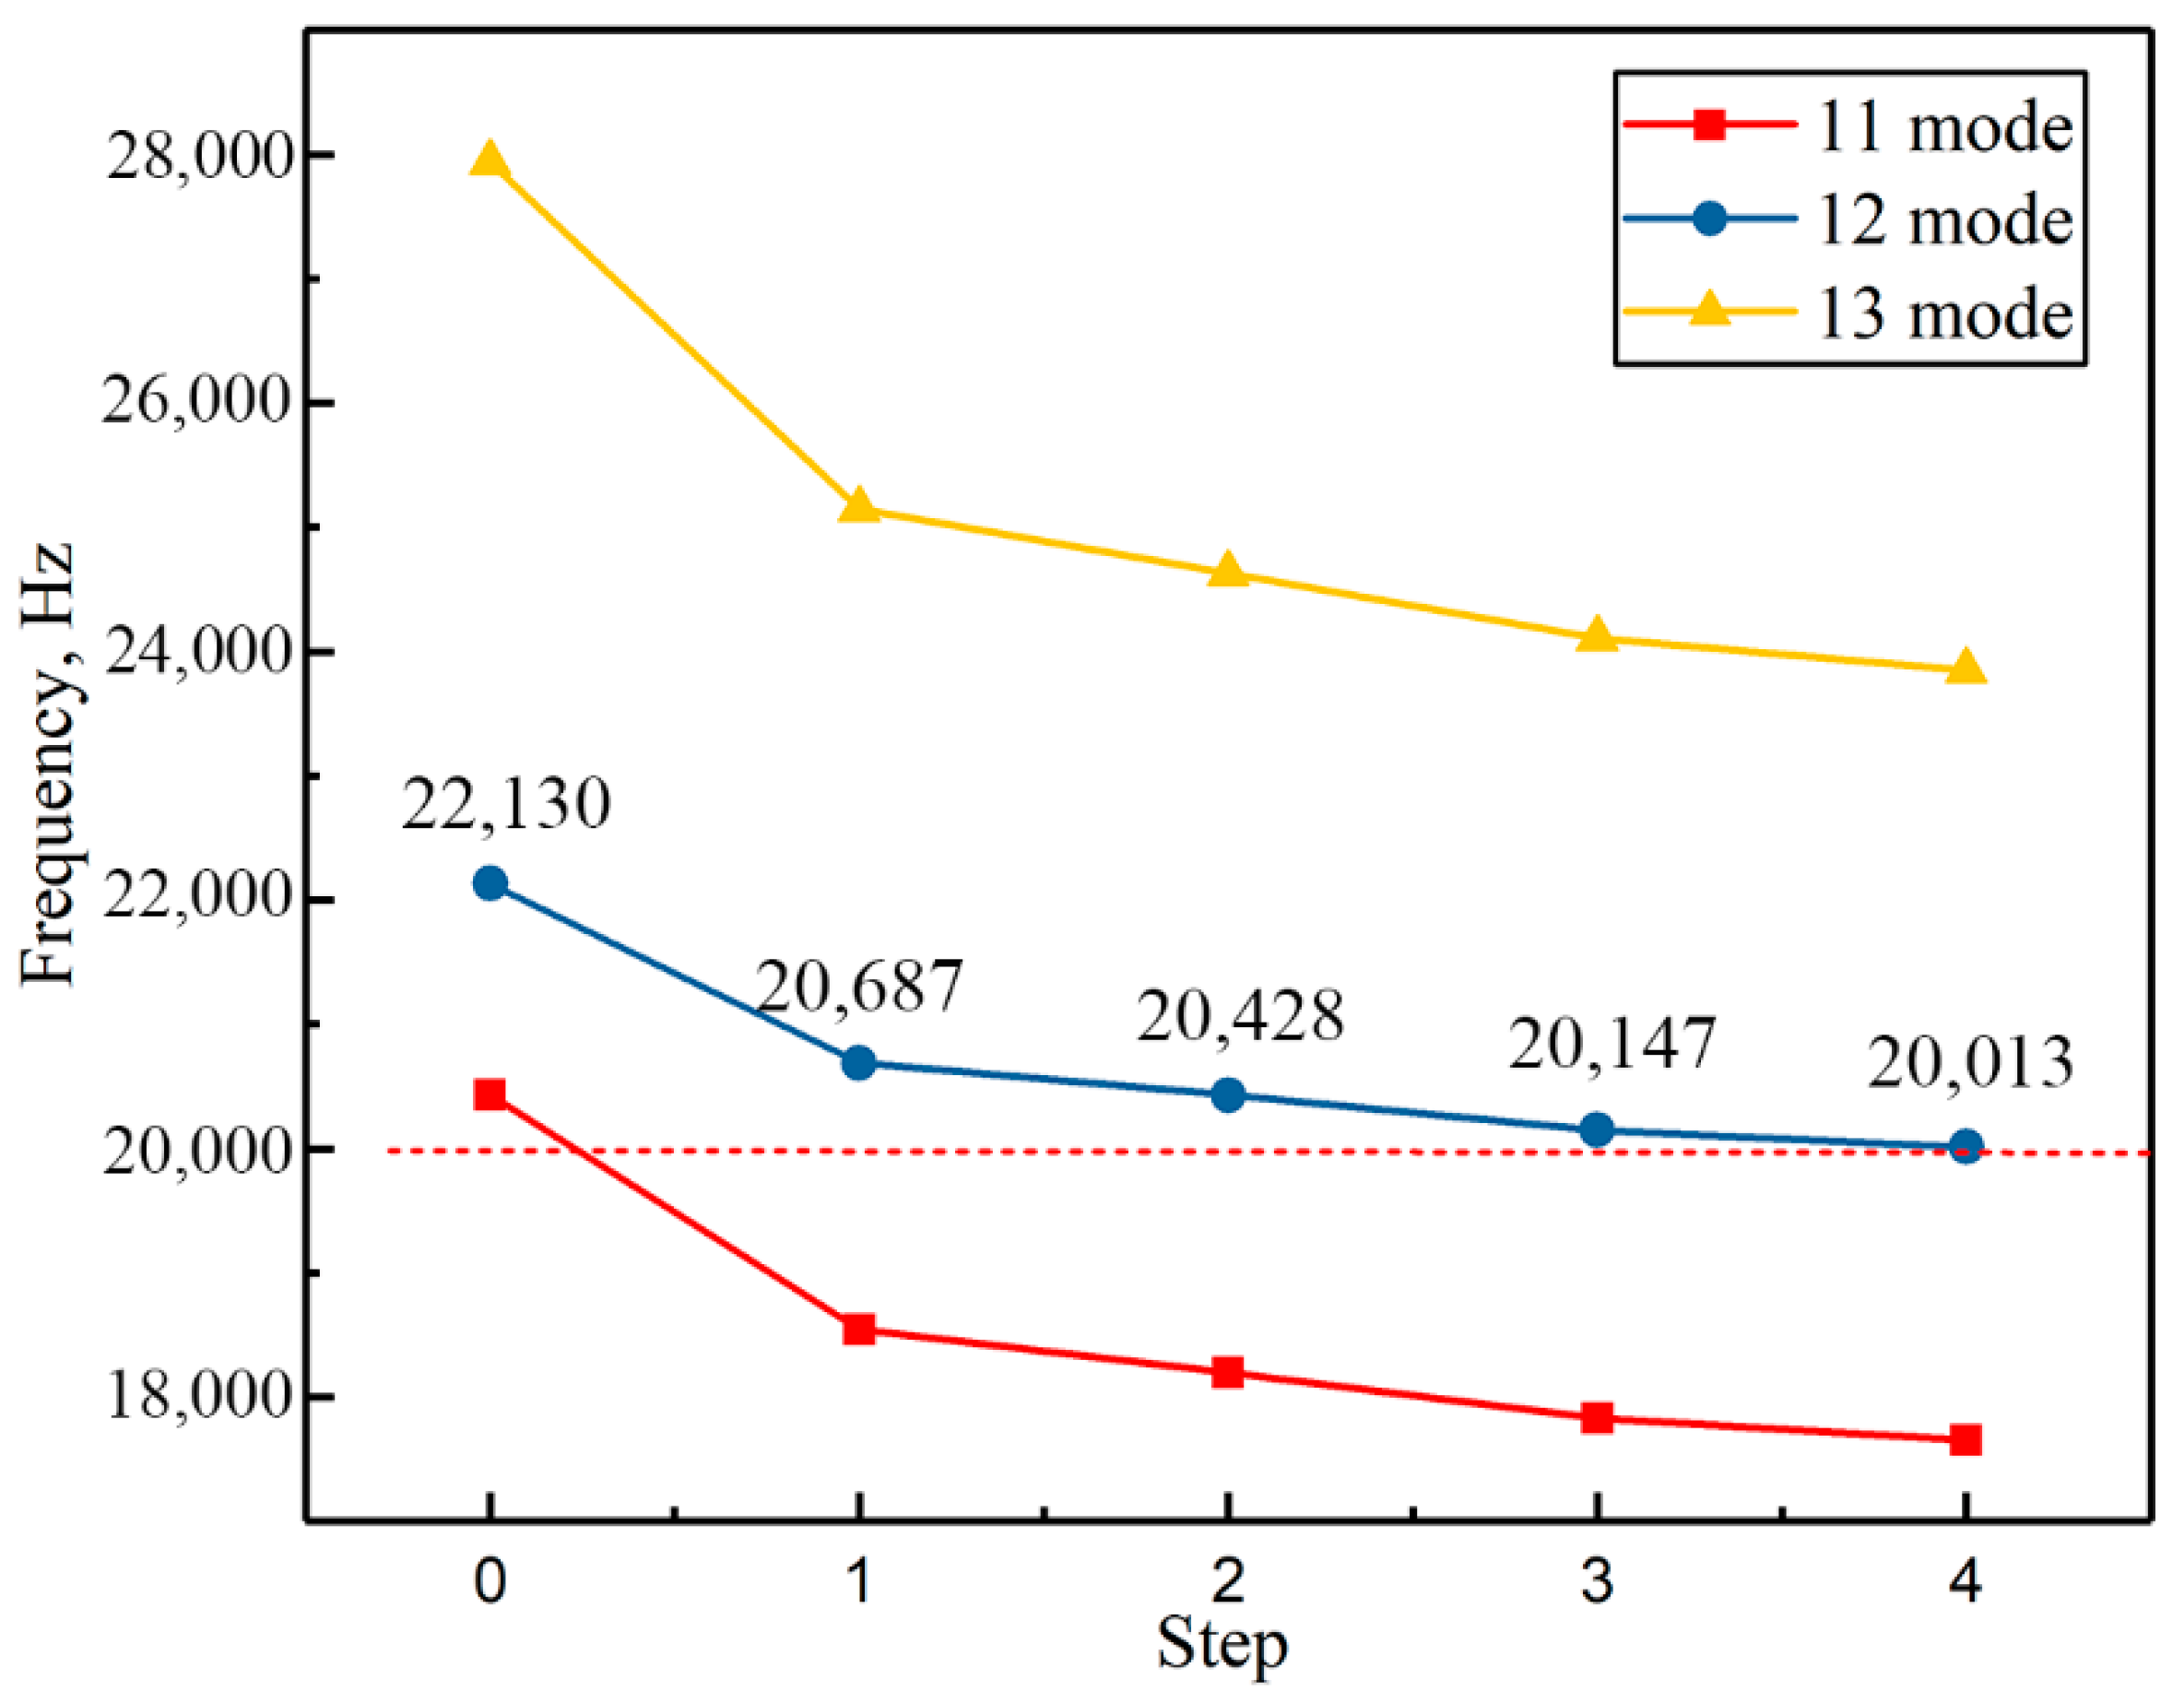
3.2. Ultrasonic Horn Optimization

When the working frequency of the transducer is consistent with the natural frequency of the horn, the entire ultrasonic vibration system reaches a resonance state. As described in the previous section, the modal analysis results of the ultrasonic horn show that the natural frequency of the ultrasonic horn in longitudinal vibration is 22,130 Hz, which is about 10.6% different from the design value of 20 kHz. For the best vibration form, it is necessary to optimize the size of the horn to make the error rate of frequency less than 1%. According to the modal analysis, the natural frequency of the ultrasonic horn in longitudinal vibration is higher than the design frequency. Therefore, the length size of the horn should be increased to reduce frequency, which achieving the natural frequency close to the design frequency. In order to improve the correction efficiency, the length of the three-dimensional model of the horn was changed and the modal analysis was carried out, and the modal analysis results were used to guide the correction process. Figure 6 shows the vibration mode cloud diagram of the 10–13 modes after the large end of the horn is increased by 1 mm. After the large end of the horn increased by 1 mm, the natural frequency of the horn in longitudinal vibration is reduced to 22,032 Hz, which indicates that the design principle of increasing the size of the horn to reduce the natural frequency close to the design value is accurate, as shown in Figure 6c.
According to the principle of horn optimization, increasing the length of the large and small ends of the horn in turn leads to the change of the natural frequency of the horn. Table 4 shows the change of the natural frequency after increasing different lengths of the horn. As shown in Table 4, when the length of the large end increased by 1mm, the natural frequency of the horn in longitudinal vibration (12 mode) decreased by 98 Hz, and when the length increased by 2 mm, the natural frequency decreased by 259 Hz; when the length of the small end increased by 1mm, the natural frequency decreased by 102 Hz, and when the length increased by 2 mm, the natural frequency decreased by 213 Hz; and when the length of the large and small ends of the horn simultaneously increased by 1 mm, the natural frequency reduced by 269 Hz. The following conclusions can be drawn: in the optimization process, increasing the large end and small end of the horn by the same length has similar effects on the frequency. Basically, as the length of the large end or small end of the horn increased by 1mm, the frequency reduced by approximately 100 Hz. Compared with solely increasing the large end or small end by 2 mm, the frequency decreased more fleetly when the large and small end simultaneously increased by 1 mm.
By testing the influence of a length change of the large and small ends on the natural frequency, the optimization principle of the horn can be summarized: the corrected length of the large and small ends can be appropriately increased, which reduces more frequency in the early stage of the horn optimization; when the frequency was reduced too close to the design frequency, the length of the horn requires a slight increase, which results in the frequency being steadily and accurately close to the design value. Based on the above analysis results, the optimization scheme of the ultrasonic horn was designed. Combined with the modal analysis results, the optimization scheme and the frequency change results of the horn were drawn, as shown in Figure 7. After several optimizations, the natural frequency of the horn in longitudinal vibration reached 20,013 Hz, which was very close to the design frequency of 20 kHz, and it was not necessary to correct the horn.
Figure 8 was the cloud diagram of stress and strain in longitudinal vibration before and after optimization of the ultrasonic horn. After the horn optimization, the maximum stress of the horn was reduced from the original 123 MPa to 81.4 MPa, and the maximum stress was reduced by 41.6 MPa, as shown in Figure 8a,b. In addition, the maximum strain of the horn was also reduced after optimization, as shown in Figure 8c,d. Obviously, the maximum stress of the horn was reduced after optimization, resulting in the stress concentration of the horn being reduced, thereby improving the stability performance and service life of the horn.

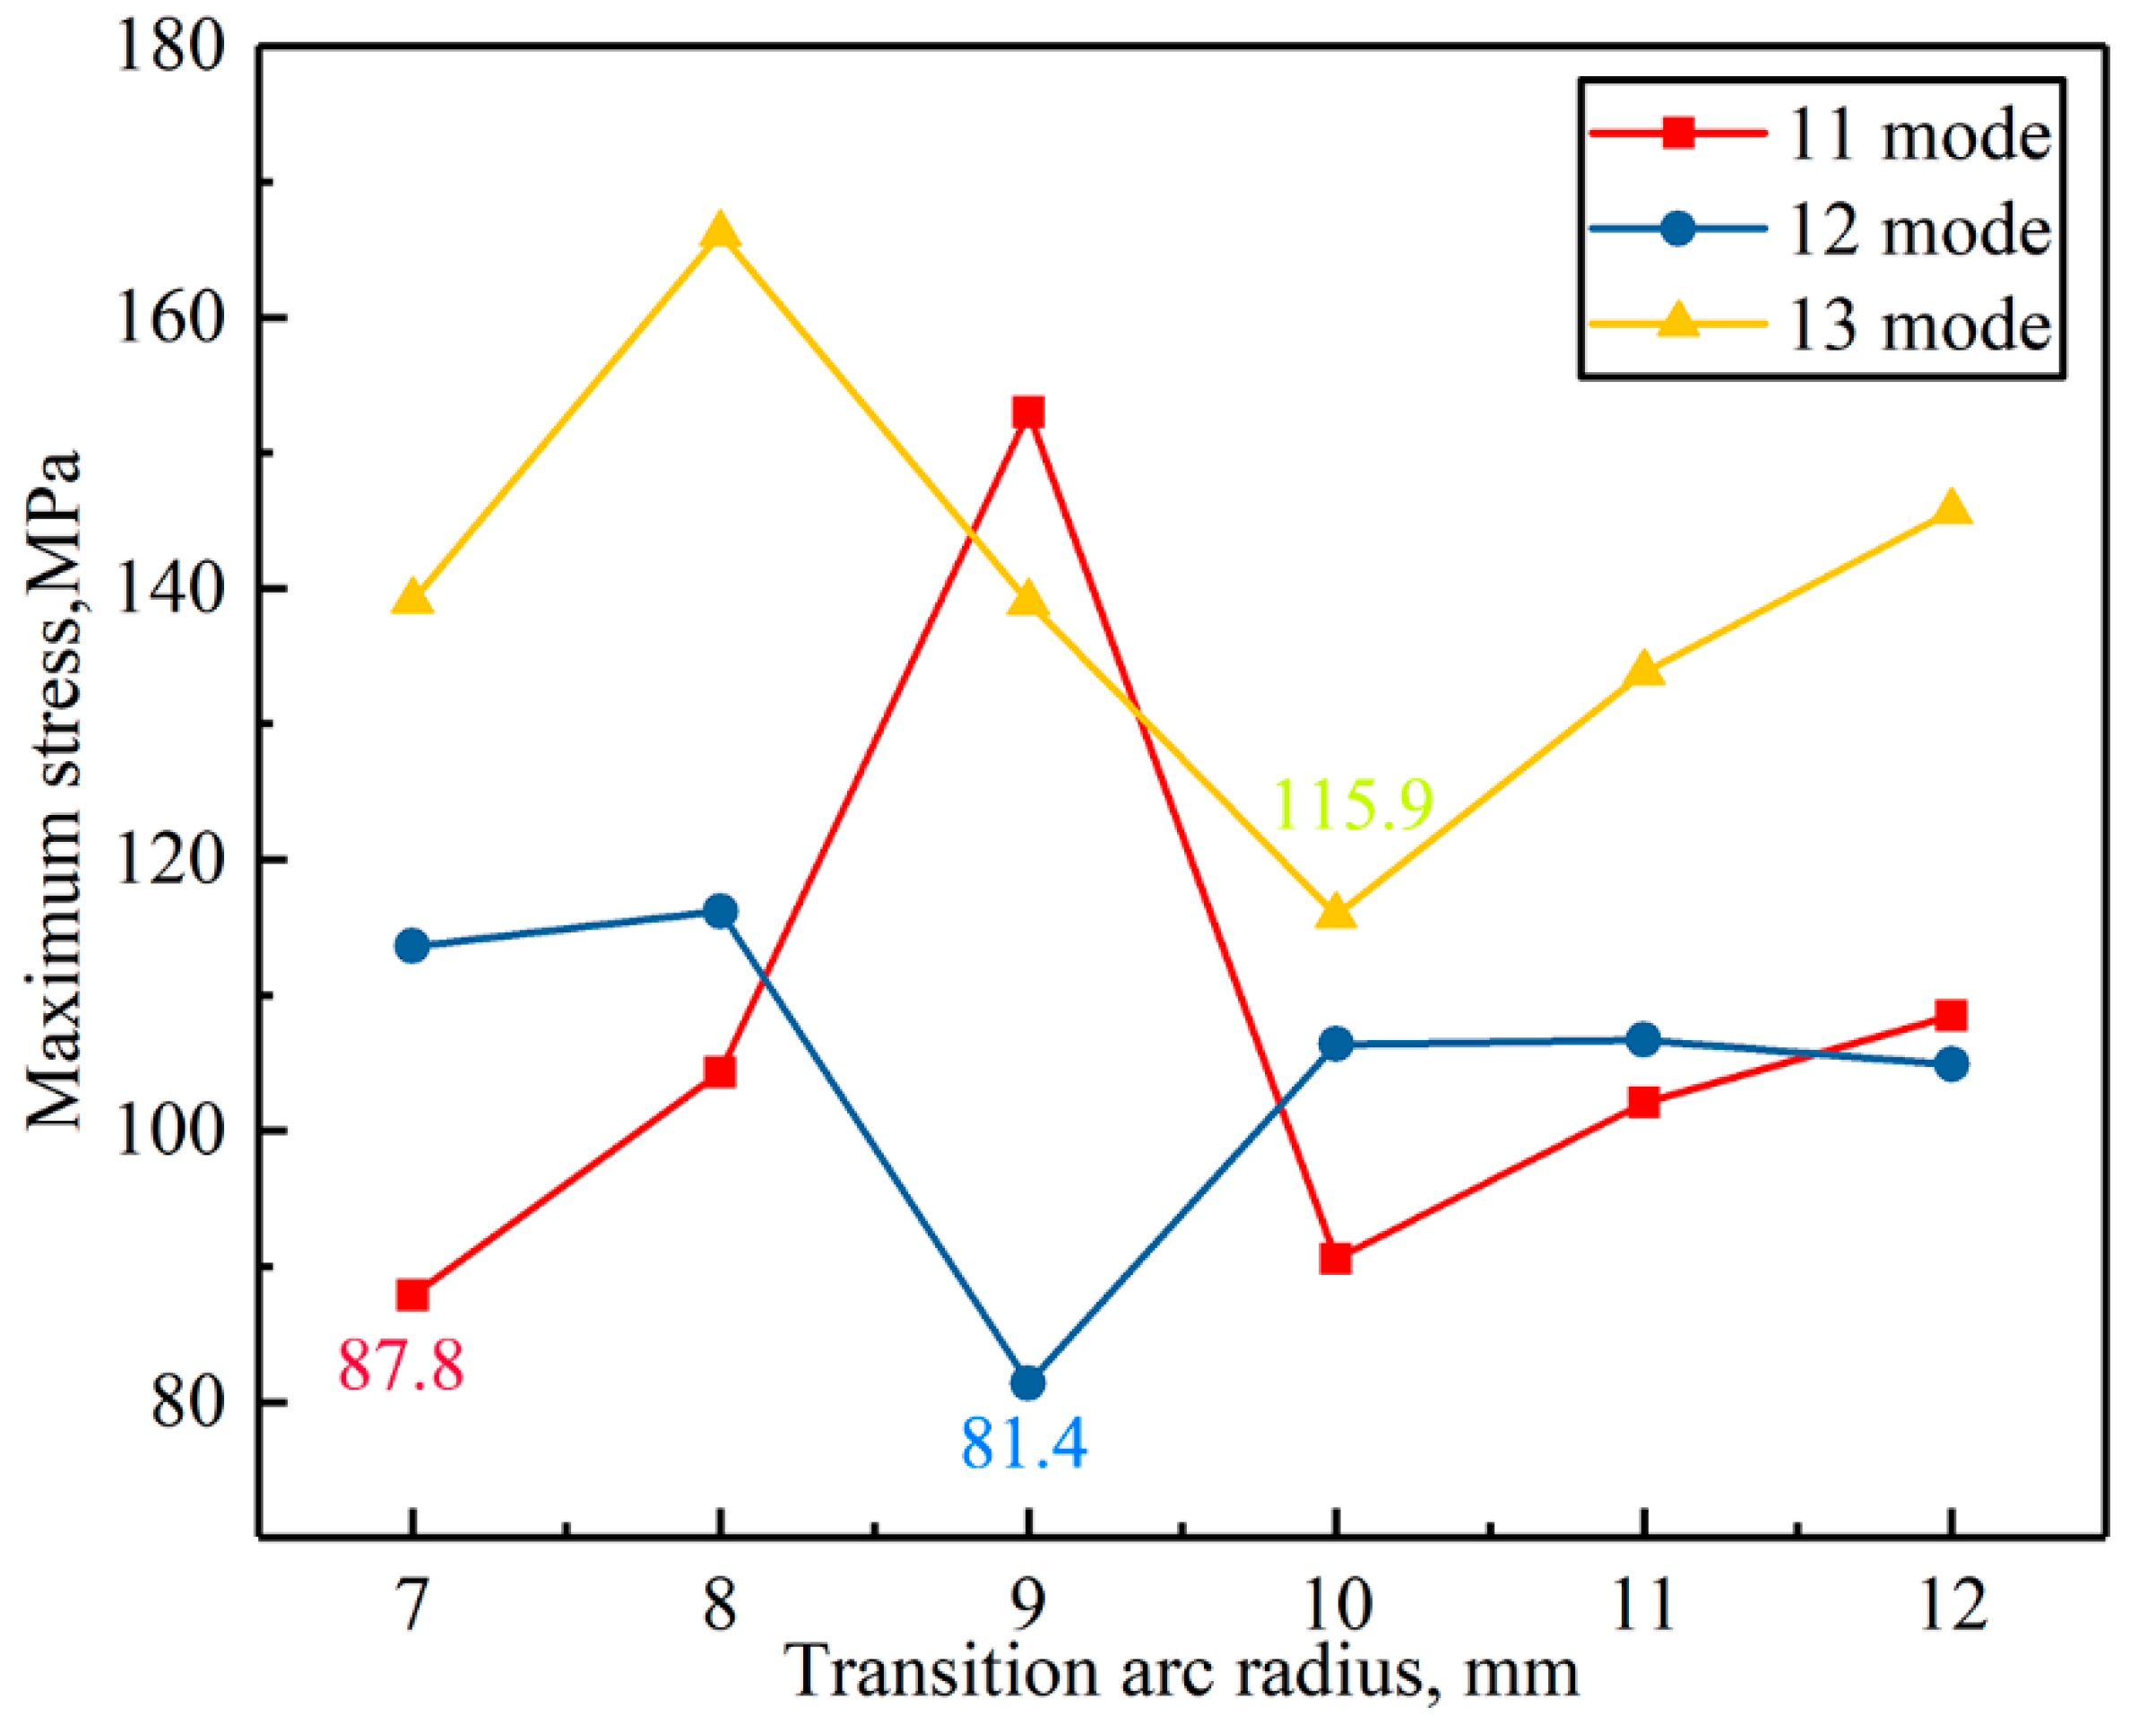
3.3. Transition Arc Radius

After optimizing the size of the horn, it was also necessary to consider whether the initial transition arc radius matched the optimized horn. The transition arc radius of the horn before optimization was 9 mm. Therefore, the application of model analysis was performed to verify whether the transition arc radius was consistent with the optimized horn. Figure 9 shows the maximum stress of the horn obtained by modal analysis with the transition arc radius of 7~12 mm (radius is an integer). Clearly, the maximum stress reached the minimum value of 81.4 MPa when the transition arc radius was 9 mm in 12 mode, indicating that the transition arc radius of 9 mm was still suitable for the optimized horn.

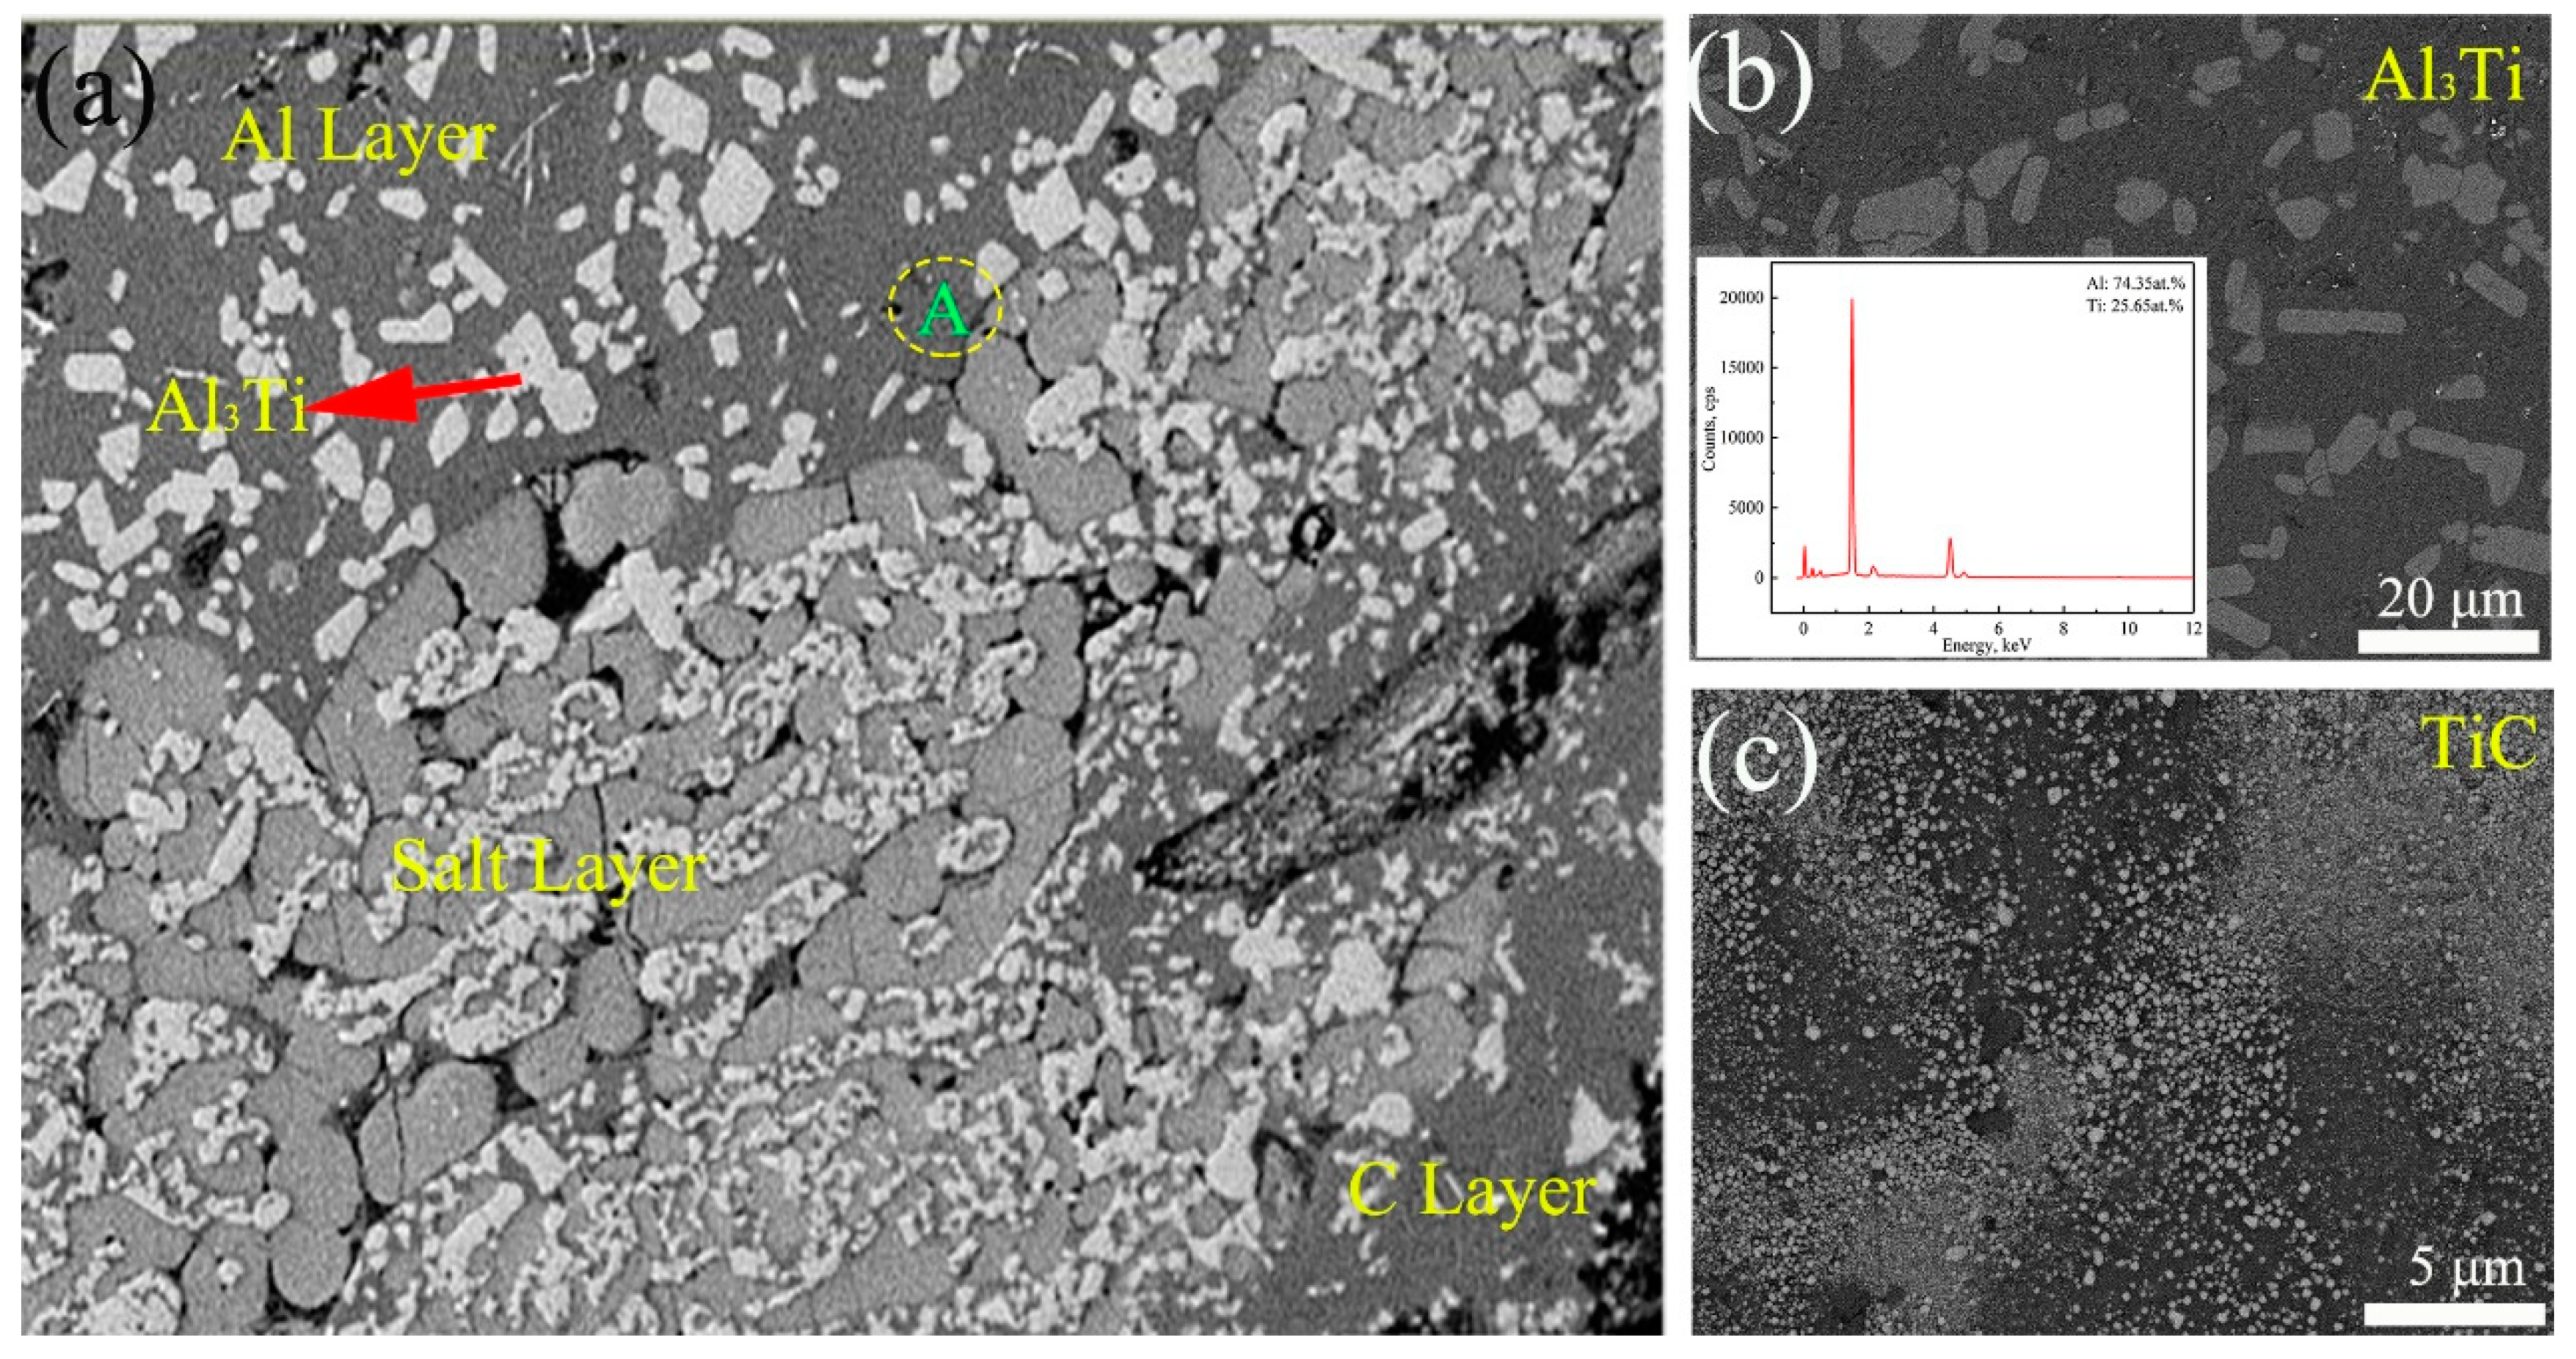
3.4. Reliability Verification of the Device

The addition of Al-Ti-C grain refiners is an effective and economical method to refine the grain of aluminum alloy. However, the preparation of Al-Ti-C grain refiners is difficult due to the poor wetting of the Al-C interface [41,42,43]. The wetting of the Al-C interface in the preparation of Al-Ti-C grain refiner was studied by using the ultrasonic field wetting angle measuring instrument, to verify the reliability and effectiveness of the novel device. The sessile drop method was used, and a specially designed experimental system was constructed [44,45,46,47,48] that was suitable for ultrasonic field wetting angle measuring instrument. The graphite substrate was put on the supporting platform with a solid Al sample laying in the center of the top surface of the substrate. In order to improve the wetting, the special molten salt, potassium fluorotitanate (K2TiF6), was evenly spread around the Al block [7]. Finally, the ultrasonic field was applied to the samples for 0–25 min and the sample was heated to various temperatures to analyze the effect of the ultrasonic field on the Al-C wetting.
The Al-C interface morphology of the sample was observed and analyzed, as shown in Figure 10. The structure of the Al-C interface can be roughly divided into three layers: Al layer, salt layer, and C layer. The Ti atoms provided by K2TiF6 could react with Al and C to form Al3Ti and TiC particles, respectively. Obviously, the EDS analysis shows that the white block in the Al layer was Al3Ti, and the area A near the interface can be enlarged to observe the dispersed TiC particles, as shown in Figure 10c. The ultrasonic field improves the wetting of the Al-C interface and can be summarized as follows: the salt layer at the interface provides a large number of Ti atoms that disperse and adsorb around the graphite, which facilitates the wetting [49]. The surface activity of graphite is improved by cavitation and TiC is formed between C and Ti, achieving the infiltration of the Al melt and graphite. Simultaneously, TiC particles move away from the carbon interface with the ultrasonic standing wave to achieve favorable reactive wetting behavior and mass transfer. In addition, the cavitation reduces the surface tension and increases the fluidity of the Al melt, which could facilitate the wetting of Al-C interface. The explanation of these phenomena has been reported in a previous research work [6]. The wetting of Al-C experiment under the ultrasonic field shows that the ultrasonic field can effectively improve the wetting of the Al-C interface.

4. Conclusions

In this paper, a novel ultrasonic field wetting angle measuring instrument has been designed for the wetting of the liquid–solid interface of composite materials. The new device can be used to study the wetting of the liquid–solid interface during the preparation of composite materials, and the specific conclusions are summarized as follows:
(1)
The dimensional parameters of the ultrasonic transducer and the horn were designed by theoretical calculation, and a modal analysis was performed for the ultrasonic horn, which achieved the vibration mode and natural frequency of the horn in the range of 10 kHz~30 kHz. The natural frequency of the ultrasonic horn in longitudinal vibration was 22,310 Hz, sufficing the requirements of the device.
(2)
Modal analysis was utilized to optimize the ultrasonic horn, reducing the natural frequency of the ultrasonic horn in longitudinal vibration to 22,013 Hz, which resulted in an error rate between the natural frequency (22,013 Hz) and the design frequency (20 kHz) of less than 1%. Simultaneously, the maximum stress of the horn was reduced from 123 Mpa to 81.4 Mpa by optimizing the ultrasonic horn, which increased the safety and service life of the horn.
(3)
The influence of different transition arc radiuses on the maximum stress of the optimized ultrasonic horn was analyzed. The results demonstrated that the maximum stress reached the minimum value of 81.40 MPa when the transition arc radius was 9 mm in 12 mode, indicating that the transition arc radius of 9 mm was still suitable for the optimized horn.
(4)
To verify the rationality and effectiveness of the novel device, the Al-C wetting experiments were performed under an ultrasonic field. The results indicate that the design of the novel ultrasonic field wetting angle measuring instrument was reasonable and effective, and the ultrasonic field provided by the novel device was conducive to the improvement of the Al-C interface wetting.

Author Contributions

Conceptualization, Y.L. and J.Z.; methodology, J.Z. and Z.J.; validation, Y.L., J.Z. and L.N.; formal analysis, J.Z.; investigation, L.N. and Z.J.; resources, Y.L.; data curation, Y.L. and J.Z.; writing—original draft preparation, J.Z.; writing—review and editing, Y.L. and J.Z.; visualization, Z.J and L.N.; supervision, Y.L.; project administration, Y.L.; funding acquisition, Y.L. All authors have read and agreed to the published version of the manuscript.

Funding

This research was funded by the National Nature Science Foundation of China, grant number 11574043.

Institutional Review Board Statement

Not applicable.

Informed Consent Statement

Not applicable.

Data Availability Statement

Not applicable.

Acknowledgments

The authors acknowledge the instrumental/date analysis from Analytical and Testing Center, Northeastern University.

Conflicts of Interest

The authors declare no conflict of interest.

References

  1. Mao, A.; Zhang, J.; Yao, S.; Wang, A.; Wang, W.; Li, Y.; Qiao, C.; Xie, J.; Jia, Y. The diffusion behaviors at the Cu-Al solid-liquid interface: A molecular dynamics study. Results Phys. 2020, 16, 102998. [Google Scholar] [CrossRef]
  2. Chen, X.; Yan, J.; Gao, F.; Wei, J.; Xu, Z.; Fan, G. Interaction behaviors at the interface between liquid Al–Si and solid Ti–6Al–4V in ultrasonic-assisted brazing in air. Ultrason. Sonochem. 2013, 20, 144–154. [Google Scholar] [CrossRef]
  3. Ding, Z.; Hu, Q.; Lu, W.; Ge, X.; Cao, S.; Sun, S.; Yang, T.; Xia, M.; Li, J. Microstructural evolution and growth behavior of intermetallic compounds at the liquid Al/solid Fe interface by synchrotron X-ray radiography. Mater. Charact. 2018, 136, 157–164. [Google Scholar] [CrossRef]
  4. Wang, M.; Zhao, Y.; Wang, L.-D.; Zhu, Y.-P.; Wang, X.-J.; Sheng, J.; Yang, Z.-Y.; Shi, H.-L.; Shi, Z.-D.; Fei, W.-D. Achieving high strength and ductility in graphene/magnesium composite via an in-situ reaction wetting process. Carbon 2018, 139, 954–963. [Google Scholar] [CrossRef]
  5. Baumli, P.; Sychev, J.; Budai, I.; Szabo, J.T.; Kaptay, G. Fabrication of carbon fiber reinforced aluminum matrix composites via a titanium-ion containing flux. Compos. Part A 2013, 44, 47–50. [Google Scholar] [CrossRef]
  6. Zhao, J.; Wu, X.; Ning, L.; Zhang, J.; Han, C.; Li, Y. Wetting of aluminium and carbon interface during preparation of Al-Ti-C grain refiner under ultrasonic field. Ultrason. Sonochem. 2021, 76, 105633. [Google Scholar] [CrossRef] [PubMed]
  7. Baumli, P.; Sytchev, J.; Kaptay, G. Perfect wettability of carbon by liquid aluminum achieved by a multifunctional flux. J. Mater. Sci. 2010, 45, 5177–5190. [Google Scholar] [CrossRef]
  8. Dehnavi, M.R.; Niroumand, B.; Ashrafizadeh, F.; Rohatgi, P.K. Effects of continuous and discontinuous ultrasonic treatments on mechanical properties and microstructural characteristics of cast Al413–SiCnp nanocomposite. Mater. Sci. Eng. A 2014, 617, 73–83. [Google Scholar] [CrossRef]
  9. Sahin, Y.; Acılar, M. Production and properties of SiCp-reinforced aluminium alloy composites. Compos. Part A Appl. Sci. Manuf. 2003, 34, 709–718. [Google Scholar] [CrossRef]
  10. Ding, W.W.; Xu, C.; Hou, X.G.; Zhao, X.Y.; Chen, T.L.; Zhao, W.J.; Xia, T.D.; Qiao, J.S. Preparation and synthesis thermokinetics of novel Al-Ti-C-La composite master alloys. J. Alloys Compd. 2019, 776, 904–911. [Google Scholar] [CrossRef]
  11. Banerji, A.; Reif, W. Metallographic investigation of TiC nucleants in the newly developed Al-Ti-C grain refiner. J. Mater. Sci. 1994, 29, 1958–1965. [Google Scholar] [CrossRef]
  12. Wang, F.; Eskin, D.; Mi, J.; Connolle, T.; Lindsay, J.; Mounib, M. A refining mechanism of primary Al3Ti intermetallic particles by ultrasonic treatment in the liquid state. Acta. Mater. 2016, 116, 354–363. [Google Scholar] [CrossRef]
  13. Eskin, G.I.; Eskin, D.G. Production of natural and synthesized aluminum-based composite materials with the aid of ultrasonic (cavitation) treatment of the melt. Ultrason. Sonochem. 2003, 10, 297–301. [Google Scholar] [CrossRef]
  14. Wang, G.; Dargusch, M.S.; Qian, M.; Eskin, D.G.; StJohn, D.H. The role of ultrasonic treatment in refining the as-cast grain structure during the solidification of an Al–2Cu alloy. J. Cryst. Growth 2014, 408, 119–124. [Google Scholar] [CrossRef] [Green Version]
  15. Sarasua, J.A.; Rubio, L.R.; Aranzabe, E.; Vilela, J.L.V. Energetic study of ultrasonic wettability enhancement. Ultrason. Sonochem. 2021, 79, 105768. [Google Scholar] [CrossRef] [PubMed]
  16. Shrestha, B.; Ezazi, M.; Kwon, G. Engineered Nanoparticles with Decoupled Photocatalysis and Wettability for Membrane-Based Desalination and Separation of Oil-Saline Water Mixtures. Nanomaterials 2021, 11, 1397. [Google Scholar] [CrossRef] [PubMed]
  17. Ezazi, M.A.; Shrestha, B.; Maharjan, A.; Kwon, G. Water-Responsive Self-Repairing Superomniphobic Surfaces via Regeneration of Hierarchical Topography. ACS Mater. Au 2021, in press. [Google Scholar] [CrossRef]
  18. Lebon, G.S.B.; Salloum-Abou-Jaoude, G.; Eskin, D.; Tzanakis, I.; Pericleous, K.; Jarry, P. Numerical modelling of acoustic streaming during the ultrasonic melt treatment of direct-chill (DC) casting. Ultrason. Sonochem. 2019, 54, 171–182. [Google Scholar] [CrossRef] [PubMed]
  19. Lebon, G.S.B.; Tzanakis, I.; Pericleous, K.; Eskin, D.; Grant, P.S. Ultrasonic liquid metal processing: The essential role of cavitation bubbles in controlling acoustic streaming. Ultrason. Sonochem. 2019, 55, 243–255. [Google Scholar] [CrossRef]
  20. Puga, H.; Barbosa, J.; Teixeira, J.C.; Prokic, M. A new approach to ultrasonic degassing to improve the mechanical properties of aluminum alloys. J. Mater. Eng. Perform. 2014, 23, 3736–3744. [Google Scholar] [CrossRef]
  21. Zhao, Y.; Song, D.; Lin, B.; Zhang, C.; Zheng, D.; Inguva, S.; Li, T.; Sun, Z.; Wang, Z.; Zhang, W. 3D characterization of ultrasonic melt processing on the microstructural refinement of Al Cu alloys using synchrotron X-ray tomography. Mater. Charact. 2019, 153, 354–365. [Google Scholar] [CrossRef] [Green Version]
  22. Ye, H.; Ye, K.; Guo, B.-G.; Le, F.-B.; Wei, C.; Sun, X.; Wang, G.-Y.; Liu, Y. Effects of combining ultrasonic micro-forging treatment with laser metal wire deposition on microstructural and mechanical properties in Ti–6Al–4V alloy. Mater. Charact. 2020, 162, 110187. [Google Scholar] [CrossRef]
  23. Madhukar, P.; Selvaraj, N.; Gujjala, R.; Rao, C.S.P. Production of high performance AA7150-1% SiC nanocomposite by novel fabrication process of ultrasonication assisted stir casting. Ultrason. Sonochem. 2019, 58, 104665. [Google Scholar] [CrossRef]
  24. Tonry, C.E.H.; Djambazov, G.; Dybalska, A.; Griffiths, W.D.; Beckwith, C.; Bojarevics, V.; Pericleous, K.A. Acoustic resonance for contactless ultrasonic cavitation in alloy melts. Ultrason. Sonochem. 2020, 63, 104959. [Google Scholar] [CrossRef]
  25. Yang, X.; Wu, S.; Lu, S.; Hao, L.; Fang, X. Refinement of LPSO structure in Mg-Ni-Y alloys by ultrasonic treatment. Ultrason. Sonochem. 2018, 40, 472–479. [Google Scholar] [CrossRef] [PubMed]
  26. Chen, X.R.; Ning, F.K.; Hou, J.; Le, Q.C.; Tang, Y. Dual-frequency ultrasonic treatment on microstructure and mechanical properties of ZK60 magnesium alloy. Ultrason. Sonochem. 2018, 40, 433–441. [Google Scholar] [CrossRef]
  27. Chen, X.R.; Jia, Y.H.; Liao, Q.Y.; Jia, W.T.; Le, Q.C.; Ning, S.C.; Yu, F.X. The simultaneous application of variable frequency ultrasonic and low frequency electromagnetic fields in semi continuous casting of AZ80 magnesium alloy. J. Alloys Compd. 2019, 774, 710–720. [Google Scholar] [CrossRef]
  28. Lin, Q.; Xing, C.; Sui, R.; Ci, W.; Xu, Y. Effect of ultrasonic vibration on wetting of water/Cu, water/PTFE, E-GaIn/Cu and E-GaIn/graphite. Exp. Therm. Fluid Sci. 2019, 102, 351–356. [Google Scholar] [CrossRef]
  29. Zhao, S.; Yao, C.; Dong, Z.; Liu, Y.; Chen, G.; Yuan, Q. Intensification of liquid-liquid two-phase mass transfer by oscillating bubbles in ultrasonic microreactor. Chem. Eng. Sci. 2018, 186, 122–134. [Google Scholar] [CrossRef]
  30. Tzanakis, I.; Lebon, G.S.B.; Eskin, D.G.; Pericleous, K.A. Characterisation of the ultrasonic acoustic spectrum and pressure field in aluminium melt with an advanced cavitometer. J. Mater. Process. Technol. 2016, 229, 582–586. [Google Scholar] [CrossRef] [Green Version]
  31. Kumar Patel, L.; Kumar Singh, A.; Sharma, V.; Kala, P. Analysis of a hybrid ultrasonic horn profile using finite element analysis. Mater. Today Proc. 2021, 41, 772–779. [Google Scholar] [CrossRef]
  32. Mughal, K.H.; Qureshi, M.A.M.; Raza, S.F. Novel ultrasonic horn design for machining advanced brittle composites: A step forward towards green and sustainable manufacturing. Environ. Technol. Innov. 2021, 23, 101652. [Google Scholar] [CrossRef]
  33. Amini, S.; Soleimanimehr, H.; Nategh, M.J.; Abudollah, A.; Sadeghi, M.H. FEM analysis of ultrasonic-vibration-assisted turning and the vibratory tool. J. Mater. Process. Technol. 2008, 201, 43–47. [Google Scholar] [CrossRef]
  34. Ni, C.; Zhu, L. Investigation on machining characteristics of TC4 alloy by simultaneous application of ultrasonic vibration assisted milling (UVAM) and economical-environmental MQL technology. J. Mater. Process. Technol. 2020, 278, 116518. [Google Scholar] [CrossRef]
  35. Amin, S.G.; Ahmed, M.H.M.; Youssef, H.A. Computer-aided design of acoustic horns for ultrasonic machining using finite-element analysis. J. Mater. Process. Technol. 1995, 55, 254–260. [Google Scholar] [CrossRef]
  36. Naseri, R.; Koohkan, K.; Ebrahimi, M.; Djavanroodi, F.; Ahmadian, H. Horn design for ultrasonic vibration-aided equal channel angular pressing. Int. J. Adv. Manuf. Technol. 2017, 90, 1727–1734. [Google Scholar] [CrossRef]
  37. Wu, L.; Chen, Y.-C. PSPICE approach for designing the ultrasonic piezoelectric transducer for medical diagnostic applications. Sens. Actuators A Phys. 1999, 75, 186–198. [Google Scholar] [CrossRef]
  38. Zheng, D.D.; Mao, Y.; Lv, S.H. Research and validation of design principles for PVDF wideband ultrasonic transducers based on an equivalent circuit model. Measurement 2019, 141, 324–331. [Google Scholar] [CrossRef]
  39. Rawson, F.F. High power resonant horns for ultrasonic welding and their material aspects. Ultrasonics 1987, 25, 371. [Google Scholar]
  40. Wang, A.; Gao, G.; Li, D.; Lu, D.; Wang, M.; Shi, D.; Xu, Z. A hollow exponential ultrasonic horn for aluminum melt degassing under power ultrasound and rotating flow field. Results Phys. 2021, 21, 103822. [Google Scholar] [CrossRef]
  41. Sobczak, N.; Sobczak, J.; Seal, S.; Morgiel, J. TEM examination of the effect of titanium on the Al/C interface structure. Mater. Chem. Phys. 2003, 81, 319–322. [Google Scholar] [CrossRef]
  42. Jiang, H.; Sun, Q.; Zhang, L.; Zhao, J. Al-Ti-C master alloy with nano-sized TiC particles dispersed in the matrix prepared by using carbon nanotubes as C source. J. Alloys Compd. 2018, 748, 774–782. [Google Scholar] [CrossRef]
  43. Pongen, R.; Birru, A.K.; Parthiban, P. Study of microstructure and mechanical properties of A713 aluminium alloy having an addition of grain refiners Al-3.Ti-1.5C and Al-3Cobalt. Results Phys. 2019, 13, 102105. [Google Scholar] [CrossRef]
  44. Liu, T.; Xiao, Y.; Lu, Z.; Hirota, N.; Li, G.; Yuan, S.; Wang, Q. Wetting behaviors of molten melt drops on polycrystalline Al2O3 substrates in high magnetic fields. J. Mater. Sci. Technol. 2020, 41, 187–190. [Google Scholar] [CrossRef]
  45. Chen, X.; Zhou, Y.; Jin, T.; Sun, X. Effect of C and Hf Contents on the Interface Reactions and Wettability between a Ni3Al-Based Superalloy and Ceramic Mould Material. J. Mater. Sci. Technol. 2016, 32, 177–181. [Google Scholar] [CrossRef]
  46. Lin, Q.; Shen, P.; Qiu, F.; Zhang, D.; Jiang, Q. Wetting of polycrystalline B4C by molten Al at 1173–1473K. Scripta Mater. 2009, 60, 960–963. [Google Scholar] [CrossRef]
  47. Lin, Q.; Li, F.; Jin, P.; Zhong, W. Wetting of TCu by molten 4043 and Al alloys at 923–1023 K. J. Alloys Compd. 2018, 734, 144–151. [Google Scholar] [CrossRef]
  48. Lin, Q.; Li, F.; Jin, P.; Zhong, W. Reactive wetting of TA2 pure Ti and TC4 alloy by molten Al 4043 alloy at 873–973 K. Vacuum 2017, 145, 95–102. [Google Scholar] [CrossRef]
  49. Lin, Q.L.; Shen, P.; Yang, L.L.; Jin, S.B.; Jiang, Q.C. Wetting of TiC by molten Al at 1123–1323 K. Acta. Mater. 2011, 59, 1898–1911. [Google Scholar] [CrossRef]
Figure 1. Structural diagram of the novel ultrasonic field wetting angle measuring instrument.
Crystals 11 01400 g001
Figure 2. Schematic diagram of the ultrasonic transducer.
Crystals 11 01400 g002
Figure 3. Equivalent circuit diagram of ultrasonic transducer, (a) the equivalent circuit of each component of transducer, (b) ultrasonic transducer composite equivalent circuit, (c) the equivalent circuit diagram of the left vibrator.
Crystals 11 01400 g003
Figure 4. Structural schematic of the stepped ultrasonic horn.
Crystals 11 01400 g004
Figure 5. Cloud diagram of horn vibration mode of the 10–13 modes, (a) 10 mode, (b) 11 mode, (c) 12 mode, (d) 13 mode.
Crystals 11 01400 g005
Figure 6. Cloud diagram of horn vibration mode of the 10–13 modes after the large end was increased 1 mm, (a) 10 mode, (b) 11 mode, (c) 12 mode, (d) 13 mode.
Crystals 11 01400 g006
Figure 7. Frequency change during ultrasonic horn optimization, Step 0: before optimization, Step 1: the length of the large and small end simultaneously increased 5 mm, Step 2: the length of the large and small ends simultaneously increased 1 mm again, Step 3: the length of the large and small ends simultaneously increased 1 mm again, Step 4: the length of the large and small ends simultaneously increased 0.5 mm again.
Crystals 11 01400 g007
Figure 8. Cloud diagram of the maximum stress and strain in longitudinal vibration, (a) stress before optimization, (b) stress after optimization, (c) strain before optimization, (d) strain after optimization.
Crystals 11 01400 g008
Figure 9. Relationship diagram between transition arc radius and maximum stress.
Crystals 11 01400 g009
Figure 10. The Al-C interface morphology of the sample, (a) the SEM of sample, (b) the SEM of Al3Ti, (c) the enlarged SEM of the area A.
Crystals 11 01400 g010
Table 1. Material parameters of the ultrasonic transducer.
MaterialD [mm] d 0 [mm] l 0 [mm] ρ [kg/m] c [m/s] E [GPa] ν
PZT-8401557.6 × 103249772-
45 steel45--7.84 × 10357602090.269
2A12 duralumin45--2.7 × 1036300710.32
Table 2. Parameters of the ultrasonic horn.
HornE (Gpa) ρ (kg/m3) c (m/s)a (mm)b (mm)L (mm)
Value2097.8457607272144
Table 3. The modal analysis results of ultrasonic horn.
Modes9 Mode10 Mode11 Mode12 Mode13 Mode14 Mode
Frequency (Hz)14,30320,42420,42822,13027,93827,939
Table 4. The change of the natural frequency after increasing different lengths of the horn (Hz).
Correction Scheme10 Mode11 Mode12 Mode13 Mode
Before amendment20,42420,42822,13027,938
Large end increase 1 mm20,21320,21822,03227,978
Small end increase 1 mm20,40420,40922,02827,532
Large end increase 2 mm19,90319,90421,87127,892
Small end increase 2 mm20,31320,31921,91727,042
large and small end simultaneously increase 1 mm20,09920,10521,86127,439
Publisher’s Note: MDPI stays neutral with regard to jurisdictional claims in published maps and institutional affiliations.

