Article

The Photovoltaic Performance of Sensitizers for Organic Solar Cells Containing Fluorinated Chalcones with Different Halogen Substituents

by
Siti Nabilla Aliya Mohd Nizar
1,
Siti Noor Farhana Ab Rahman
1,
Muhamad Fikri Zaini
2,
Ainizatul Husna Anizaim
1,
Ibrahim Abdul Razak
1,* and
Suhana Arshad
1,*
1
X-ray Crystallography Unit, School of Physics, Universiti Sains Malaysia, Gelugor 11800, Penang, Malaysia
2
Pusat GENIUS@Pintar Negara, Universiti Kebangsaan Malaysia, Bangi 43600, Selangor, Malaysia
*
Authors to whom correspondence should be addressed.
Crystals 2021, 11(11), 1357; https://doi.org/10.3390/cryst11111357
Submission received: 29 September 2021 / Revised: 26 October 2021 / Accepted: 2 November 2021 / Published: 8 November 2021
(This article belongs to the Section Organic Crystalline Materials)

Abstract

:
Two newly halogenated chalcones, derivatives of C15H10ClFO (CH-ClF) and C15H10F2O (CH-FF), were synthesized using the Claisen–Schmidt condensation method. Both compounds were crystallized using a slow evaporation method, forming a monoclinic crystal system with a space group of P21 and P21/c, respectively. The compounds were further analyzed using spectroscopic techniques such as Fourier Transform Infrared (FTIR), Nuclear Magnetic Resonance (NMR), and Ultraviolet–Visible (UV–vis) analyses. The single crystal X-ray diffraction method revealed the existence of C−H⋯O and C−H⋯F intermolecular interactions in CH-FF. Hirshfeld surface analysis was performed to confirm the existence of intermolecular interactions in the compounds. The molecular geometries obtained from the X-ray structure determination were further used to optimize the structures using density functional theory (DFT), with the B3LYP/6-311G++(d,p) basis set in the ground state. The TD-DFT/B3LYP method was used to obtain the electronic properties and the HOMO–LUMO energy gap. Both compounds exhibited A-π-A architecture with different halogen substituents in which the CH-FF, containing -fluoro substituents, possessed good electron injection ability due to its electronegative properties. This increased the flow of the charge transfer for the dye regeneration process and enhanced the efficiency of the dye-sensitized solar cell (DSSC).

Graphical Abstract

1. Introduction

There has been much research into organic material due to its variety of design selections, which can be used with suitable reactants through simple procedures and low synthesis cost [1,2]. Chalcones are organic materials from the flavonoid family with a molecular structure that can be modified and synthesized using assorted heterocyclic compounds [3]. Chalcones are constructed by planar π-conjugated systems connected with aromatic rings at both ends of the enone bridge [4]. As the substituent components of chalcone can be varied, this leads to spectroscopic and characterization analysis regarding structural planarity, the involvement of intermolecular interaction, and the intramolecular charge transfer (ICT) of the compounds [5]. Additionally, the existence of a donor (D) and acceptor (A) linked via the α, β- unsaturated keto group as D–A–D, A–D–A, D–π–A, D–π–D and A–π–A construct a chalcone with a good charge transfer configuration for use as a dye-sensitizer in solar cell applications [6,7,8].
Many researchers have employed chalcone derivatives as sensitizers [9,10,11,12,13,14] due to their properties and performance. The ability of various substituents to be anchored at different positions in chalcone derivatives enables studies on their light harvesting potential for DSSC applications [15]. The DSSC is a third-generation solar cell that is economical and environmentally friendly, with excellent cell flexibility compared to the silicon-based solar cell [16]. As a newly developed photovoltaic technology, the invention of the DSSC was inspired by the photosynthesis process that converts sunlight into valuable products, in our case, electrical energy [16,17]. The DSSC has become an increasingly popular alternative energy source since its development in the 1970s by Gerischer and Tributsch [18].
In order to contribute to this work, two chalcone derivatives, namely (E)-3-(3-chlorophenyl)-1-(4-fluorophenyl)prop-2-en-1-one, C15H10ClFO (CH-ClF) and (E)-3-(3-fluorophenyl)-1-(4-fluorophenyl)prop-2-en-1-one, C15H10F2O (CH-FF) were synthesized in order to study their chemical properties and potency as dye-sensitizers in DSSCs. CH-ClF and CH-FF represent similar structural designs, with -chloro and -fluoro attachments on the corresponding compounds, respectively. Electronegativity is defined as the ability of the atom to attract electron density when forming the chemical bond. The fluorine atom is more negative than chlorine [19]. A compound with a higher electronegativity increases the ability of electron transfer within the molecule [20,21,22], thus influencing the low gap between HOMO and LUMO energy levels [10]. From this perspective, we successfully proved that CH-FF, with the substitution of -fluoro on both aromatic rings of the chalcone derivative, contributed to a higher DSSC efficiency than CH-ClF. Additionally, the presence of hydrogen bonds in CH-FF provided good electronic communication between the molecules, resulting in an excellent DSSC power conversion.

2. Methodology

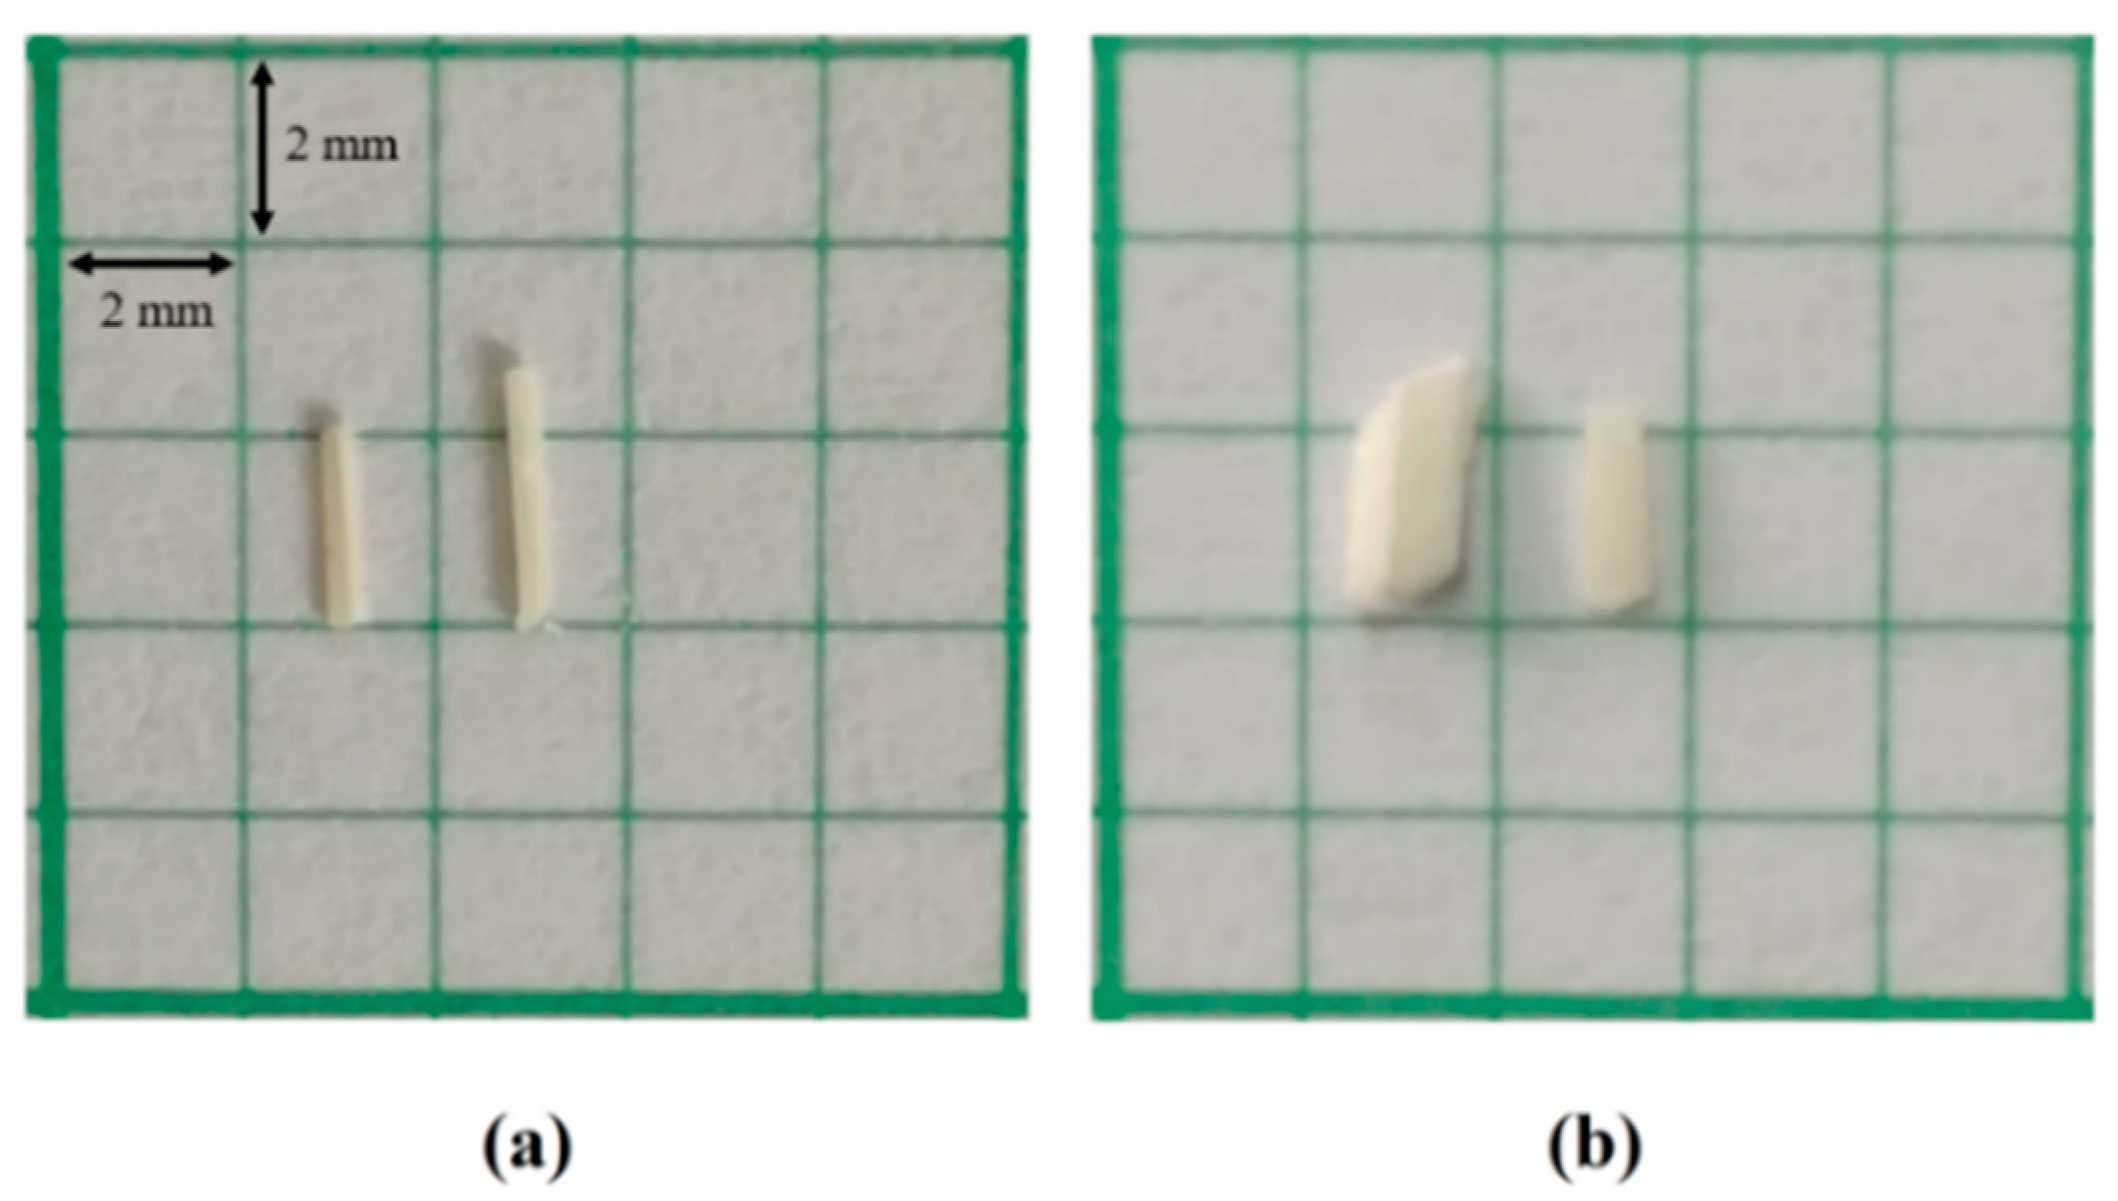
2.1. Synthesis of Halogenated Chalcone Derivatives

Initially, the synthesis of halogenated chalcone derivatives was achieved by the condensation of 4′-fluoroacetophenone (0.01 mol) with corresponding benzaldehydes (0.01 mmol) comprising 3-chlorobenzaldehyde and 3-fluorobenzaldehyde in 60 mL of ethanol in the presence of a catalytic amount of sodium hydroxide solution (5 mL, 20%). The solution was continuously stirred for about 5–6 h at room temperature. The resultant precipitates were filtered, washed successively with distilled water, and recrystallized from acetone to obtain the corresponding chalcone (Scheme 1). Figure 1 shows the single crystals of the compounds, which were suitable for X-ray structural analysis.

2.2. Spectroscopy Analysis

The infrared spectra were analyzed using a PerkinElmer GX Frontier Spectrophotometer in the range of 400–4000 cm−1, with a KBr pellet to transcribe the vibrational modes consistent with the functional groups. In addition, 1H NMR and 13C NMR spectra studies were recorded in DMSO-d6 by a Bruker 500 and a 125 MHz Avance III spectrometer, respectively. The chemical shifts (δ) were utilized in parts per million (ppm) downfield from the internal tetramethysilane (TMS) internal reference. UV–vis spectroscopy was performed in acetonitrile solution using a SHIMADZU UV-1800 Spectrophotometer in the spectral region of 200–900 nm to study the electronic transition within the compounds.

2.3. X-ray Crystallography Analysis

X-ray analysis was performed on single suitable crystals with an APEXII Duo CCD area detector using Mo Kα radiation (λ = 0.71073 Å). Good quality crystals were selected under the microscope and used for data collection. Data collection was performed using APEX2 software [23], whereas the cell refinement and data reduction were performed using SAINT software [23]. The crystal structures were solved by the Direct Method using the program SHELXTL [24] and refined by the full-matrix least squares technique on F2 using anisotropic displacement parameters by SHELXTL [24]. Absorption corrections were applied to the final crystal data using SADABS software [23]. All geometrical calculations were carried out using the program PLATON [25]. The molecular graphics were drawn using SHELXTL [24] and the Mercury program [26]. The non-hydrogen atoms were refined anisotropically. All the hydrogen atoms were positioned geometrically (C—H = 0.93 Å) and refined using the riding model Uiso(H) = 1.2 Ueq(C), meaning that the isotropic displacement parameters were set to 1.2(C) times the equivalent isotropic U values of the parent carbon atoms. Table 1 provides a summary of the crystal data and relevant refinement parameters of the title compounds.

2.4. Hirshfeld Surface Analysis

Hirshfeld surfaces and the associated 2D fingerprint plots were calculated using Crystal Explorer 3.1 [27]. This approach attempts to present a graphical tool for the visualization and understanding of intermolecular interactions through the identification of all close contacts. The Hirshfeld surface provides the close interaction of the crystal structure, which is summarized in a 2D fingerprint plot. The distances from the Hirshfeld surface to the nearest atoms outside and inside the surface are represented as di and de, respectively. The blue refers to the low occurrence of the (di, de) pair and the grey is the outline of the full fingerprint [28]. The parameters such as di, de and the Van der Waals radii (rvdW) can be correlated into Equation (1) and act as an identification tool for specific intermolecular interactions via the color-coding system. In addition, a shape index was also used as a qualitative measure of molecular shape, explicitly in regions where the total curvature (or the curvedness) was very low.
d n o r m = d i r i v d W r i v d W + d e r e v d W r e v d W

2.5. Computational Analysis

The geometrical parameters of the compound were analyzed via X-ray refinement data using the Direct method. The molecular geometries were further optimized using Gaussian09W application software to obtain all the theoretical calculations [29] by utilizing the Becke three-parameter hybrid plus combined with the Lee–Yang–Parr correlation functional studies. The DFT calculations deployed a hybrid density functional B3LYP with the 6-311++G(d,p) base set. Additionally, the time-dependent density functional theory (TD-DFT) was used to extract information regarding charge transfer between the highest occupied molecular orbital (HOMO) and lowest unoccupied molecular orbital (LUMO) using the same base set. The calculation was conducted in an isolated condition by applying the integral equation formalism polarizable continuum model (IEFPCM) in a specific acetonitrile solvent environment.

2.6. Dye-Synthesized Solar Cell (DSSC) Fabrication

The preparation of DSSCs was conducted following the previous fabrication method [9,10]. A full set of DSSC kits was purchased from Solaronix for the fabrication process.

2.6.1. Preparation of Halogenated Chalcones as Organic Dye Sensitizers

The preparation of organic dye sensitizer began by dissolving 10−2 M of CH-ClF and CH-FF precipitate into 5 mL of acetonitrile for each compound. A small amount of chenodeoxycholic acid (ratio 10:1) was added into the dye solution as a coadditive to enhance the DSSC conversion [30]. All steps were conducted with a minimal presence of light to preserve the properties of the dye-sensitizers.

2.6.2. Preparation of Ruthenium Standard Dye as a Reference

A reference standard dye, cis-diisothiocyanato-bis(2,20-bipyridyl-4,40-dicarboxylato) ruthenium(II) bis(tetrabutylammonium), or, N719 was prepared as a reference for the solar cell efficiency study. The standard dye was dissolved into a 10 mL acetonitrile solvent with a small amount of chenodeoxycholic acid (10:1 ratio). Due to the light sensitivity of N719 dye, the preparation was conducted in a dark room to avoid any direct contact with light.

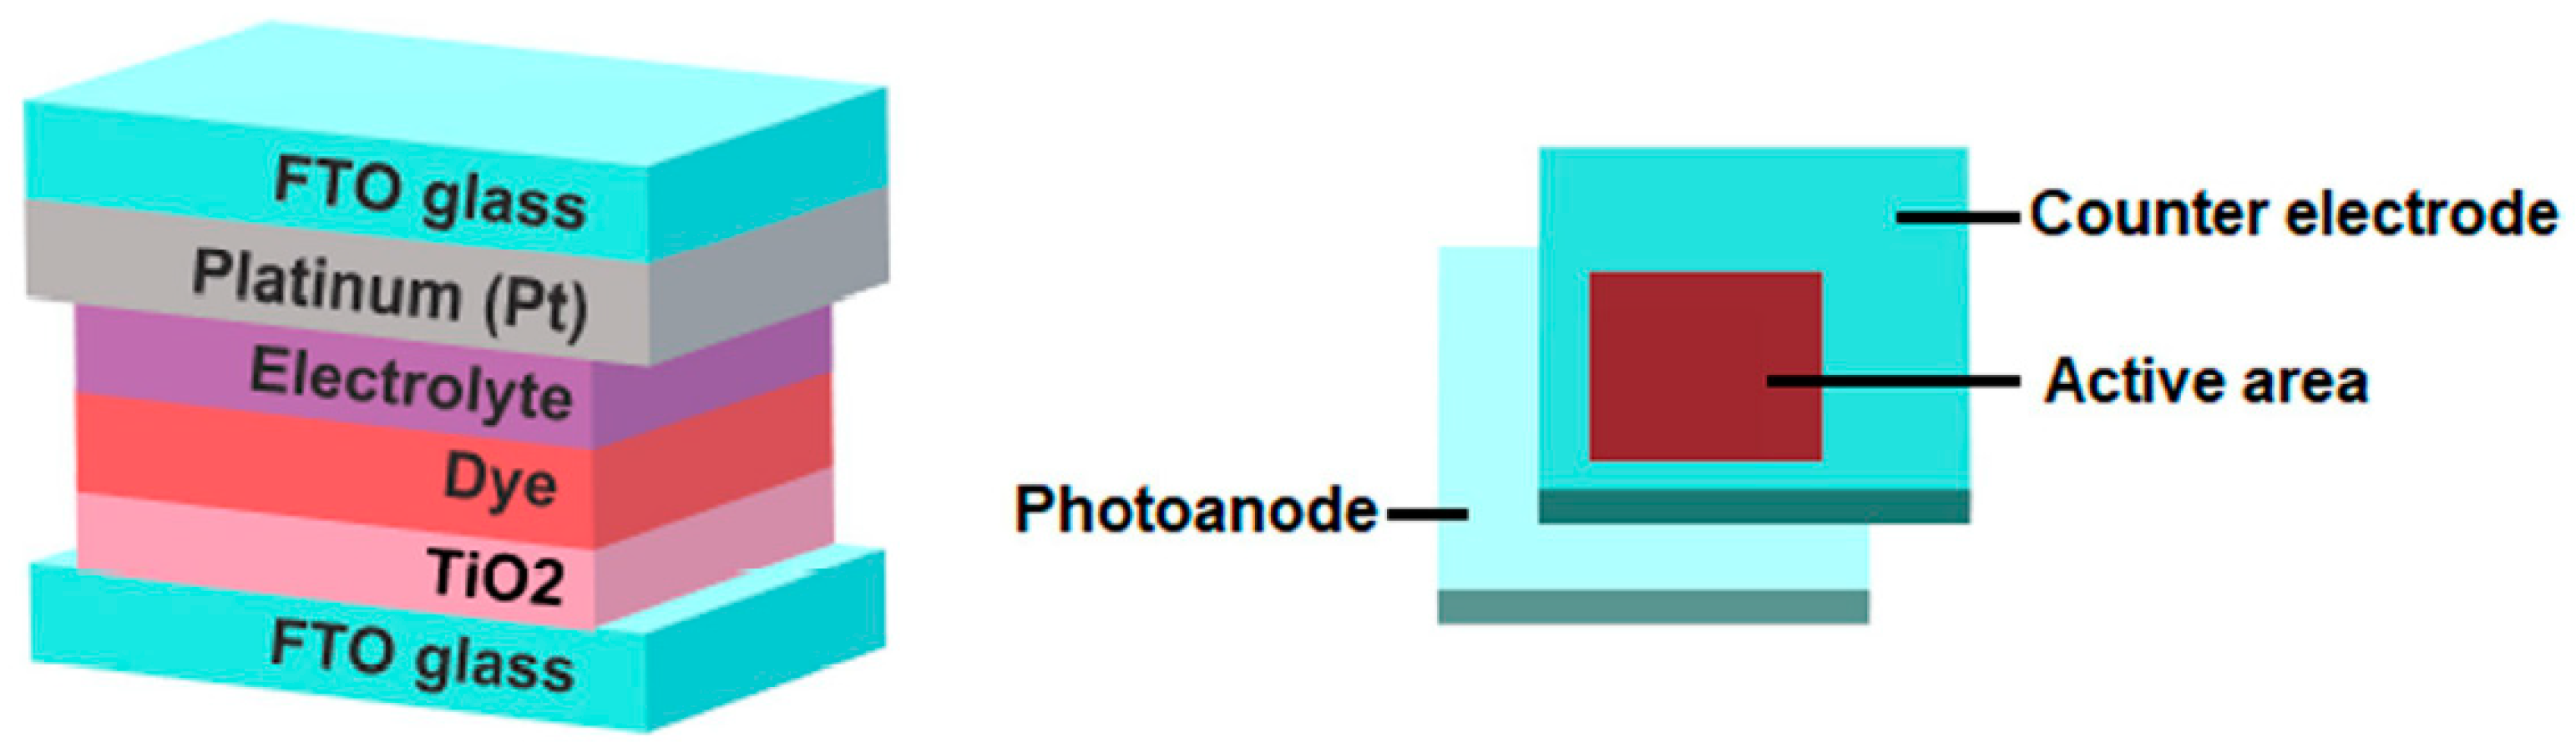
2.6.3. Preparation of DSSC Fabrication

A working electrode composed of TiO2 (6 mm × 6 mm area) coated with FTO glass was sensitized by immersion into the respective dye solution of each compound overnight. Once ready, the samples were rinsed using the residual acetonitrile to extract the excessive dye and the remaining dye solution was dropped onto the TiO2 area using the drop casting method while being dried in the hot airflow. The photoanode and counter electrode were attached together by placing a sealing film made from Meltonix 1170 with 60 μm thickness in between the electrodes to form a sandwich-type cell. The cell was again placed on the hot plate in order to melt the film via gradual application of pressure. Iodolyte AN-50 electrolyte solution was injected into both sandwich cells through a predrilled hole located at the surface of the counter electrode. Then, the holes were covered by sealing films to avoid the electrolyte being leaked and the dyes drying out. The basic components of the fabricated DSSC are illustrated in Figure 2; a picture of the DSSCs assembled by the CH-ClF and CH-FF sensitizers is shown in Figure S1 in the Supplementary Information.
The sensitized cells were analyzed by a Keithley 2400 solar simulator in order to determine the output voltage and the current reading of the tested compounds, under irradiation of AM 1.5 simulated sunlight (CHF-XM-500 W) with an intensity of 100 ± 3 mW/cm2.

3. Results and Discussion

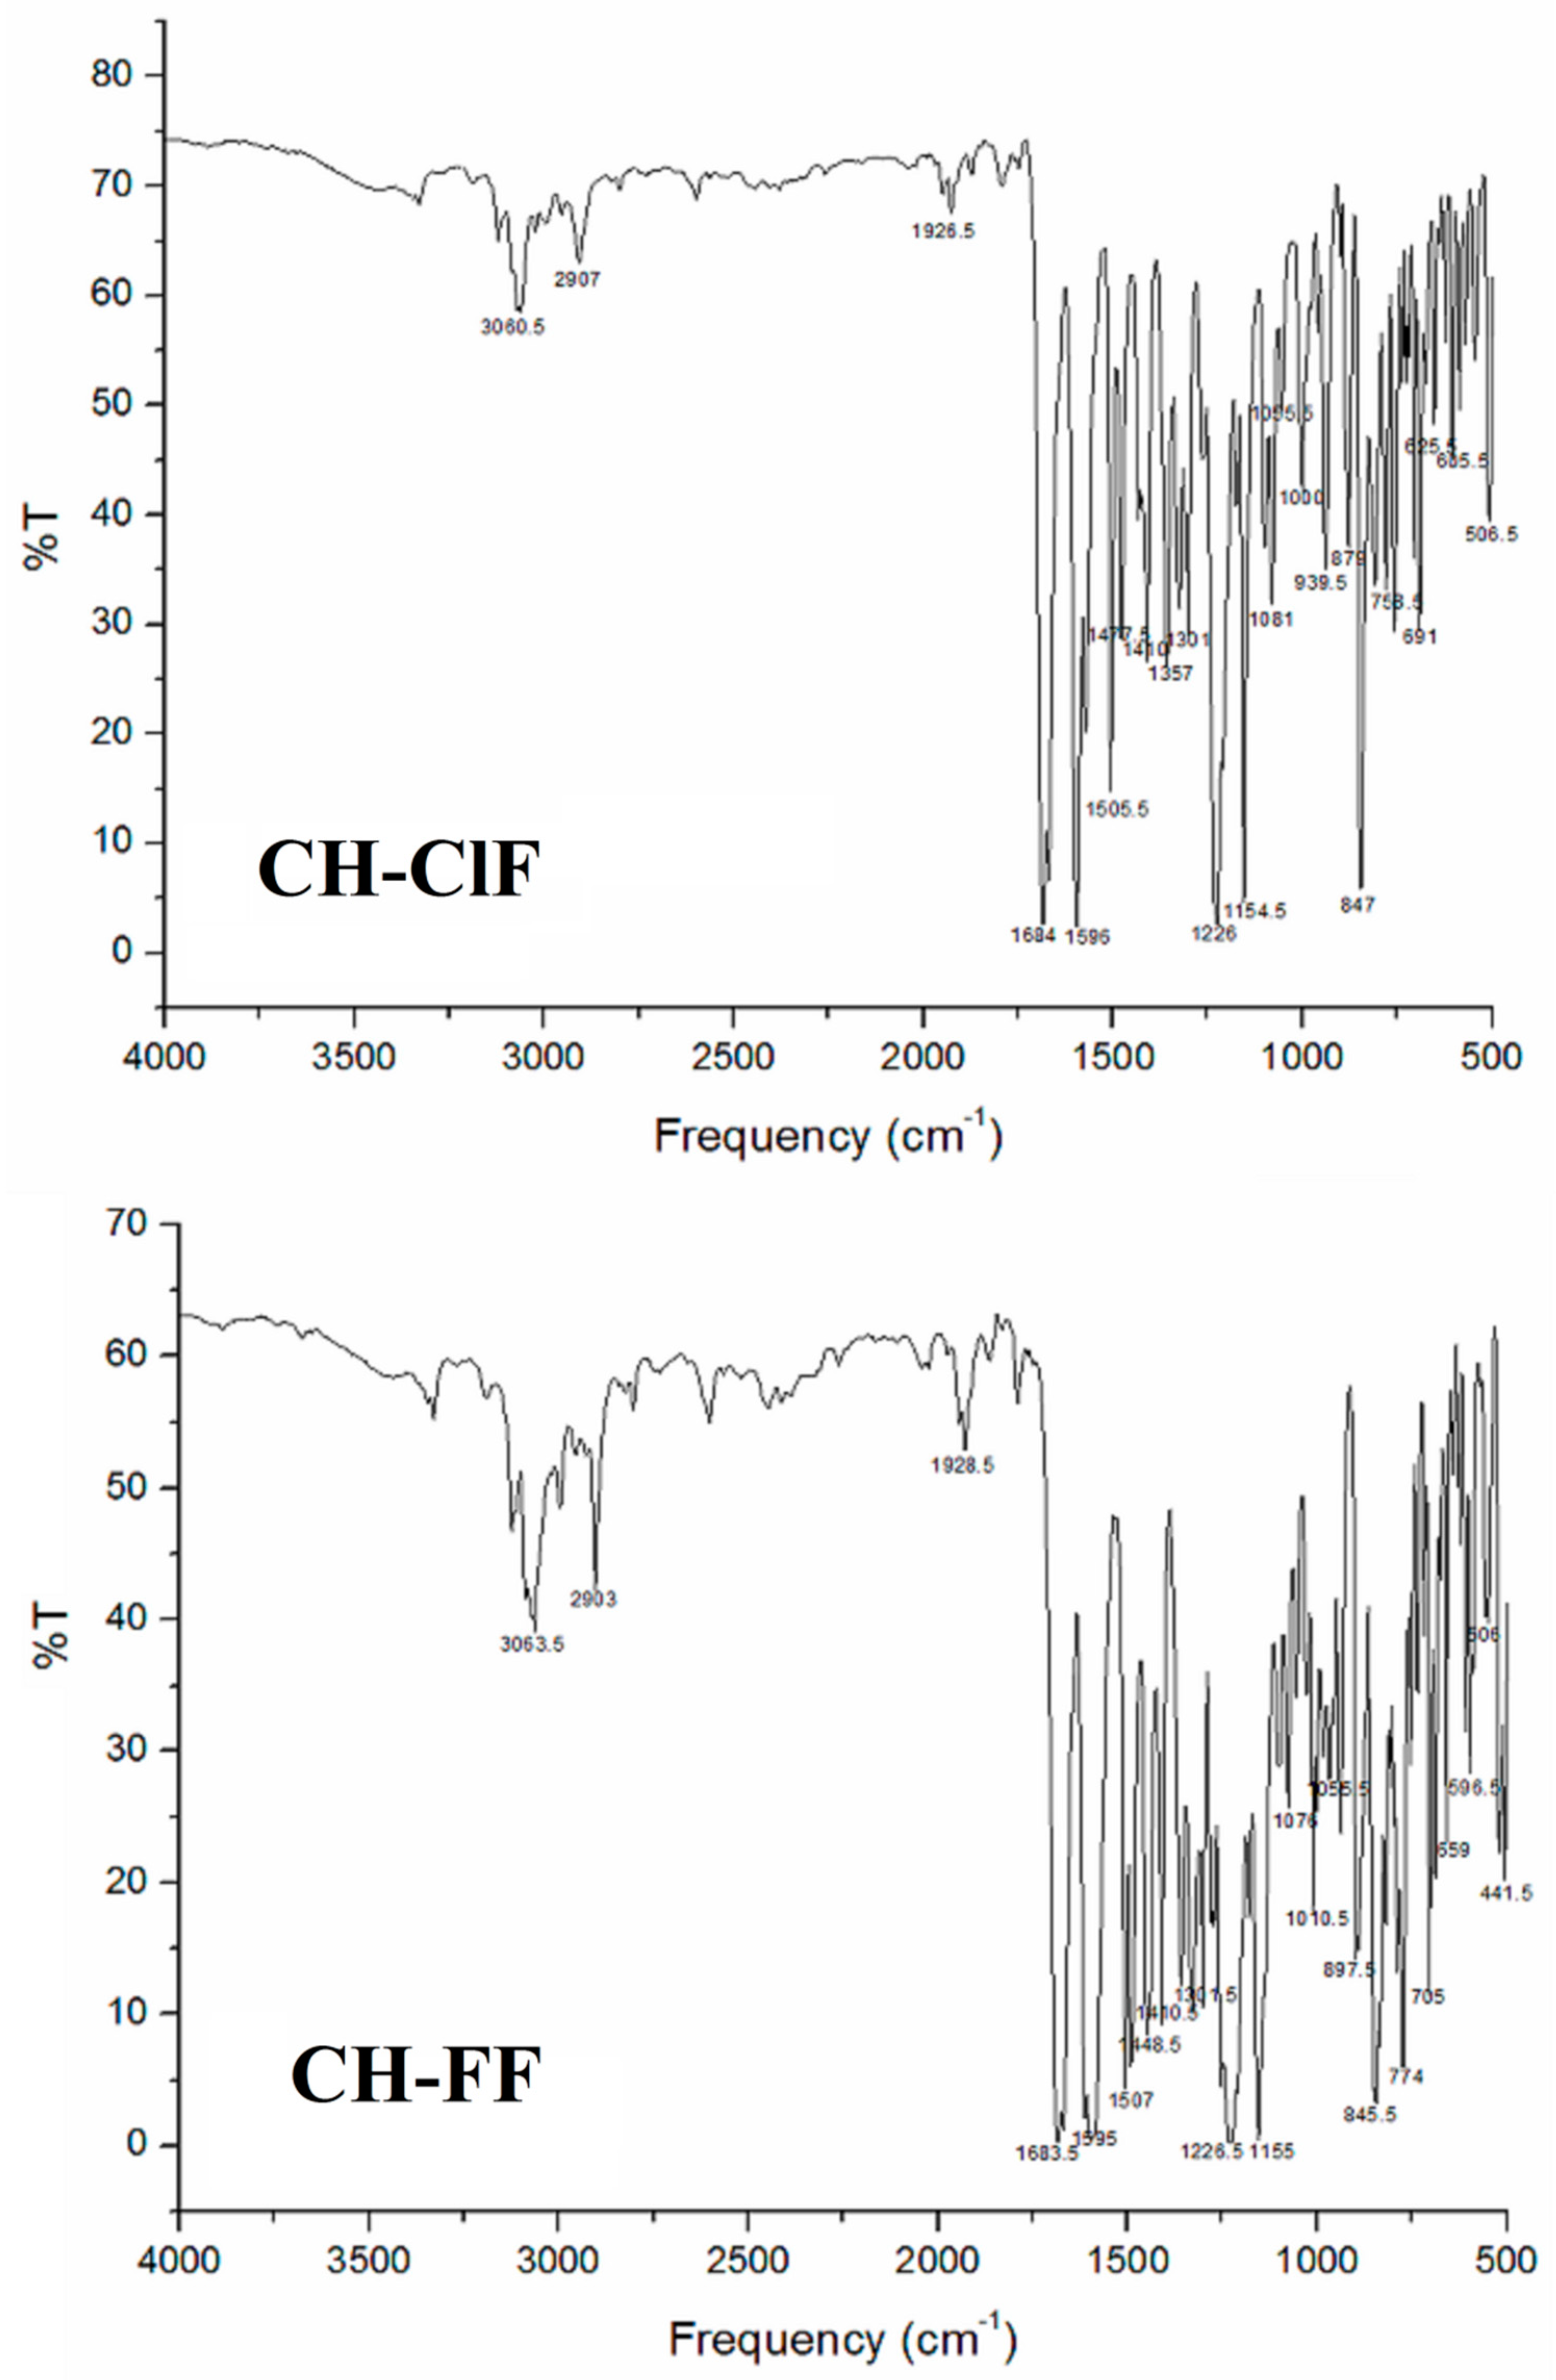
3.1. Fourier Transform Infrared Spectroscopy (FTIR) Studies

FTIR study is an analytical method conducted to interpret the existence of various functional groups and the vibrational frequency within the compound based on the spectrum [31]. As in our report, the FTIR spectra of CH-ClF and CH-FF from the experimental analysis are depicted in Figure 3 and summarized in Table 2.

3.1.1. C–H Vibrations

The FTIR studies previously reported by Vinaya described that C–H stretching vibrations were assigned at a wavenumber of 2800 and 3100 cm−1 [32]. Meanwhile, the absorption bands of CH-ClF and CH-FF were seen at the frequencies of 3060.5 cm−1 and 3063.5 cm−1, respectively. Both compounds consisted of similar C–H contents, which led to similar wavenumber values. The C–H in-plane and C–H out-of-plane bending vibrations appeared at 1474–1167 cm−1 and 1023–715 cm−1, respectively [33]. The C–H in-plane bending vibrations were observed at 1410, 1357, 1301, and 1226 cm−1 in the CH-ClF spectrum and 1448, 1410.5, 1301.5, and 1226.5 cm−1 in the CH-FF spectrum. The C–H out-of-plane bending vibrations were detected at peaks 1000, 939.5, 879, and 758.5 cm−1 for CH-ClF and 1010.5, 897.5, 845.5, and 705 cm−1 for the CH-FF spectrum. Both C–H planes were found within the normal wavenumber ranges.

3.1.2. C = O Vibrations

The carbonyl group existed at the enone bridge of the compounds, contributing to the C = O stretching vibration. The C = O stretching vibration absorbed IR strongly in the region of 1715–1600 cm−1 [34]. Hence, the wavenumbers of 1684 cm−1 (CH-ClF) and 1683.5 cm−1 (CH-FF) indicated the presence of C = O vibration in the spectral region. The small difference of 0.5 cm−1 between the vibration of CH-ClF and CH-FF was due to the similar physical position of the carbonyl group in their respective chemical structures. The peaks observed for the C = O stretching vibration appeared as a strong band, as a large dipole moment existed due to the carbonyl carbon and oxygen consisting of a large partial positive and negative charge, respectively [9].

3.1.3. C = C and C—C Vibrations

For the C = C stretching vibration, the wavenumbers were observed at the 1596 cm−1 and 1683 cm−1 band spectrums of CH-ClF and CH-FF, respectively. The results were interpreted by referring to previous research, which estimated about 1600 cm−1 for the conjugated C = C that was bonded to the carbonyl group [35]. As for the C—C stretching mode, the electronegativity effect between two carbon atoms caused small peak contributions to the spectrum, which were mostly insignificant [36]. In our studies, we found the vibrational frequencies of C—C of CH-ClF and CH-FF at the same wavenumber, 1055.5 cm−1. This occurred due to the carbon atoms being in the same position in the molecular structure of both compounds, which contributed to their having the same vibrational frequency values.

3.1.4. C—X Vibrations

C—X vibrations in which X was specifically known as halogen atoms were found to easily interact with the phenyl ring especially when the halogen atom directly bonded to the benzene ring [37]. The presence of a C-Cl bond was found in CH-ClF to mark the observed bands at 691 cm−1 and 506 cm−1. The C-Cl stretching vibrations were expected to be in the range of 492 and 1234 cm−1 determined by the structure configuration of the compound [38]. Additionally, another halogenated vibrational frequency, which was C-F stretching, contributed a high intensity band and was found in both reported compounds. In CH-ClF, the C-F stretching mode was interpreted at 1154.5 cm−1, meanwhile in CH-FF, it was observed at 1155 cm−1; both peaks were found to fall in an assumed range between 1155 to 1330 cm−1 in previous research [36]. The vibration wavenumber achieved in C-F stretching mode was higher than C-Cl due to the presence of the inductive effect between the C-F bond and fluorine, which triggered an increase in the force constant and higher wavenumber absorption [39].

3.2. Nuclear Magnetic Resonance (NMR) Analysis

The Nuclear Magnetic Resonance (NMR) of the experimental 1H and 13C was investigated to confirm the total number of hydrogen and carbon atoms present in CH-ClF and CH-FF. In CH-ClF, the 1H NMR chemical shift values were observed in the range of 8.287–7.389 ppm, whereas the 1H NMR chemical shift values of CH-FF were obtained within 8.287–7.123 ppm. The vinylene group (C = C) hydrogens resonated as two doublets in the ranges of 7.12–7.65 ppm (Hα) and 7.86–8.29 ppm (Hβ), respectively, which corresponded to the trans double-bond configuration of chalcones [40]. Additionally, the aromatic protons were located in the range of δH 7.34–7.93 ppm for CH-ClF and δH 7.41–8.02 ppm CH-FF within the shielded region. The electronic effect of the substituent content in the ring influenced the chemical shift for aromatic photons, which commonly appears between δ6.9 and 8.0 ppm in either the downfield or the upfield region [40].
The signal observed at δ196.27 ppm and δ198.71 ppm in the 13C NMR spectrum appeared at the most deshielded area, assigned to the C7 atom of the carbonyl group of both CH-ClF and CH-FF. The factor environment and rise of electronegativity from the oxygen atom caused the deshielded area of carbonyl groups compared to other carbon atoms [10]. The chemical shift of aromatic carbons of the phenyl rings was found between 138.5 and 125.0 ppm for both compounds. At the enone bridge, the signals of carbon atoms at the enone moiety for CH-ClF (δ127.91–129.53 ppm (Cα) and δ141.23–142.43 ppm (Cβ)) and CH-FF (δ125.63–125.65 ppm (Cα) and δ142.63–142.65 ppm (Cβ)) were attained from the 13C NMR spectra.

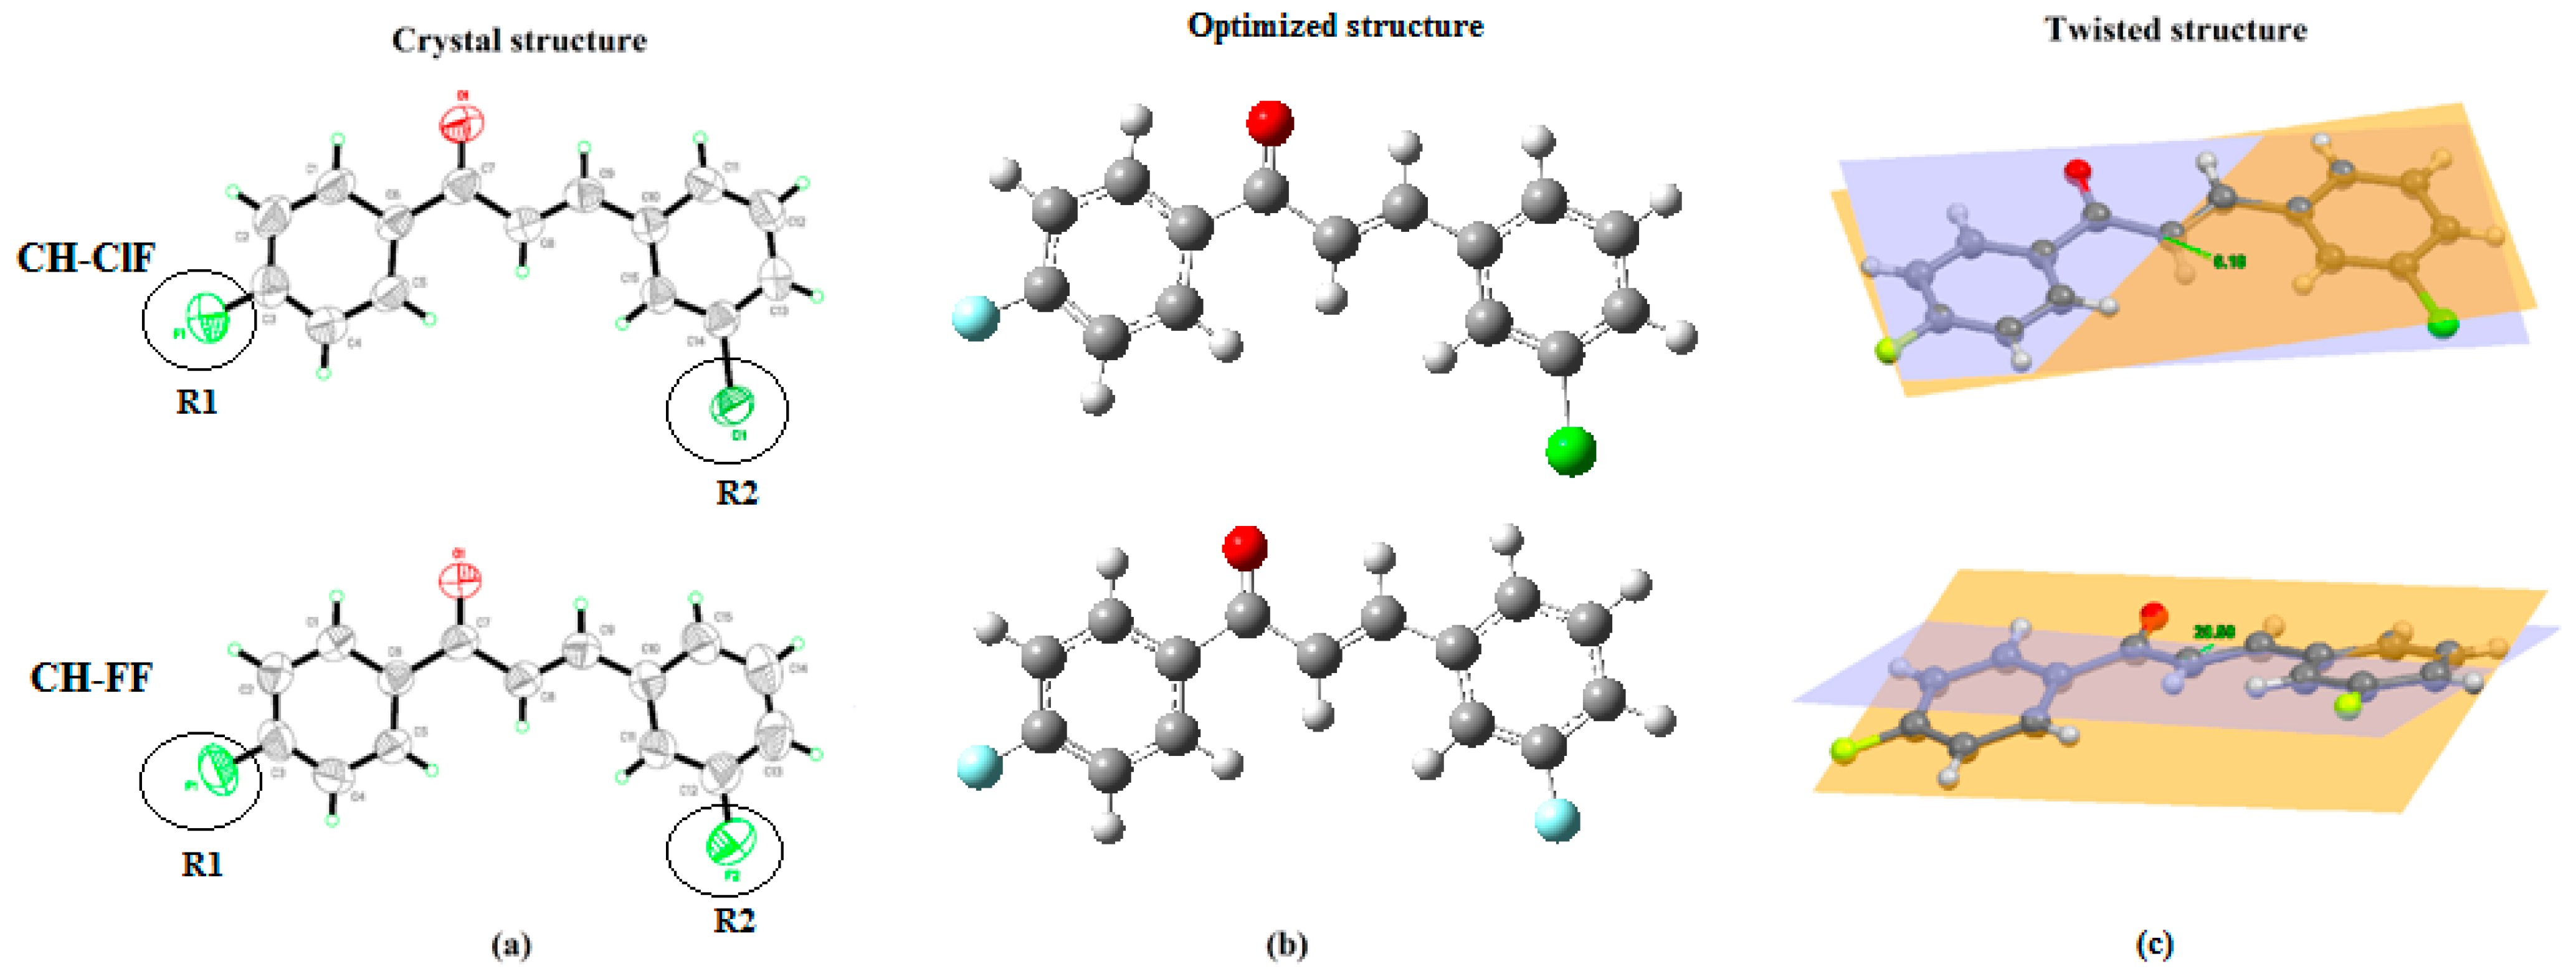
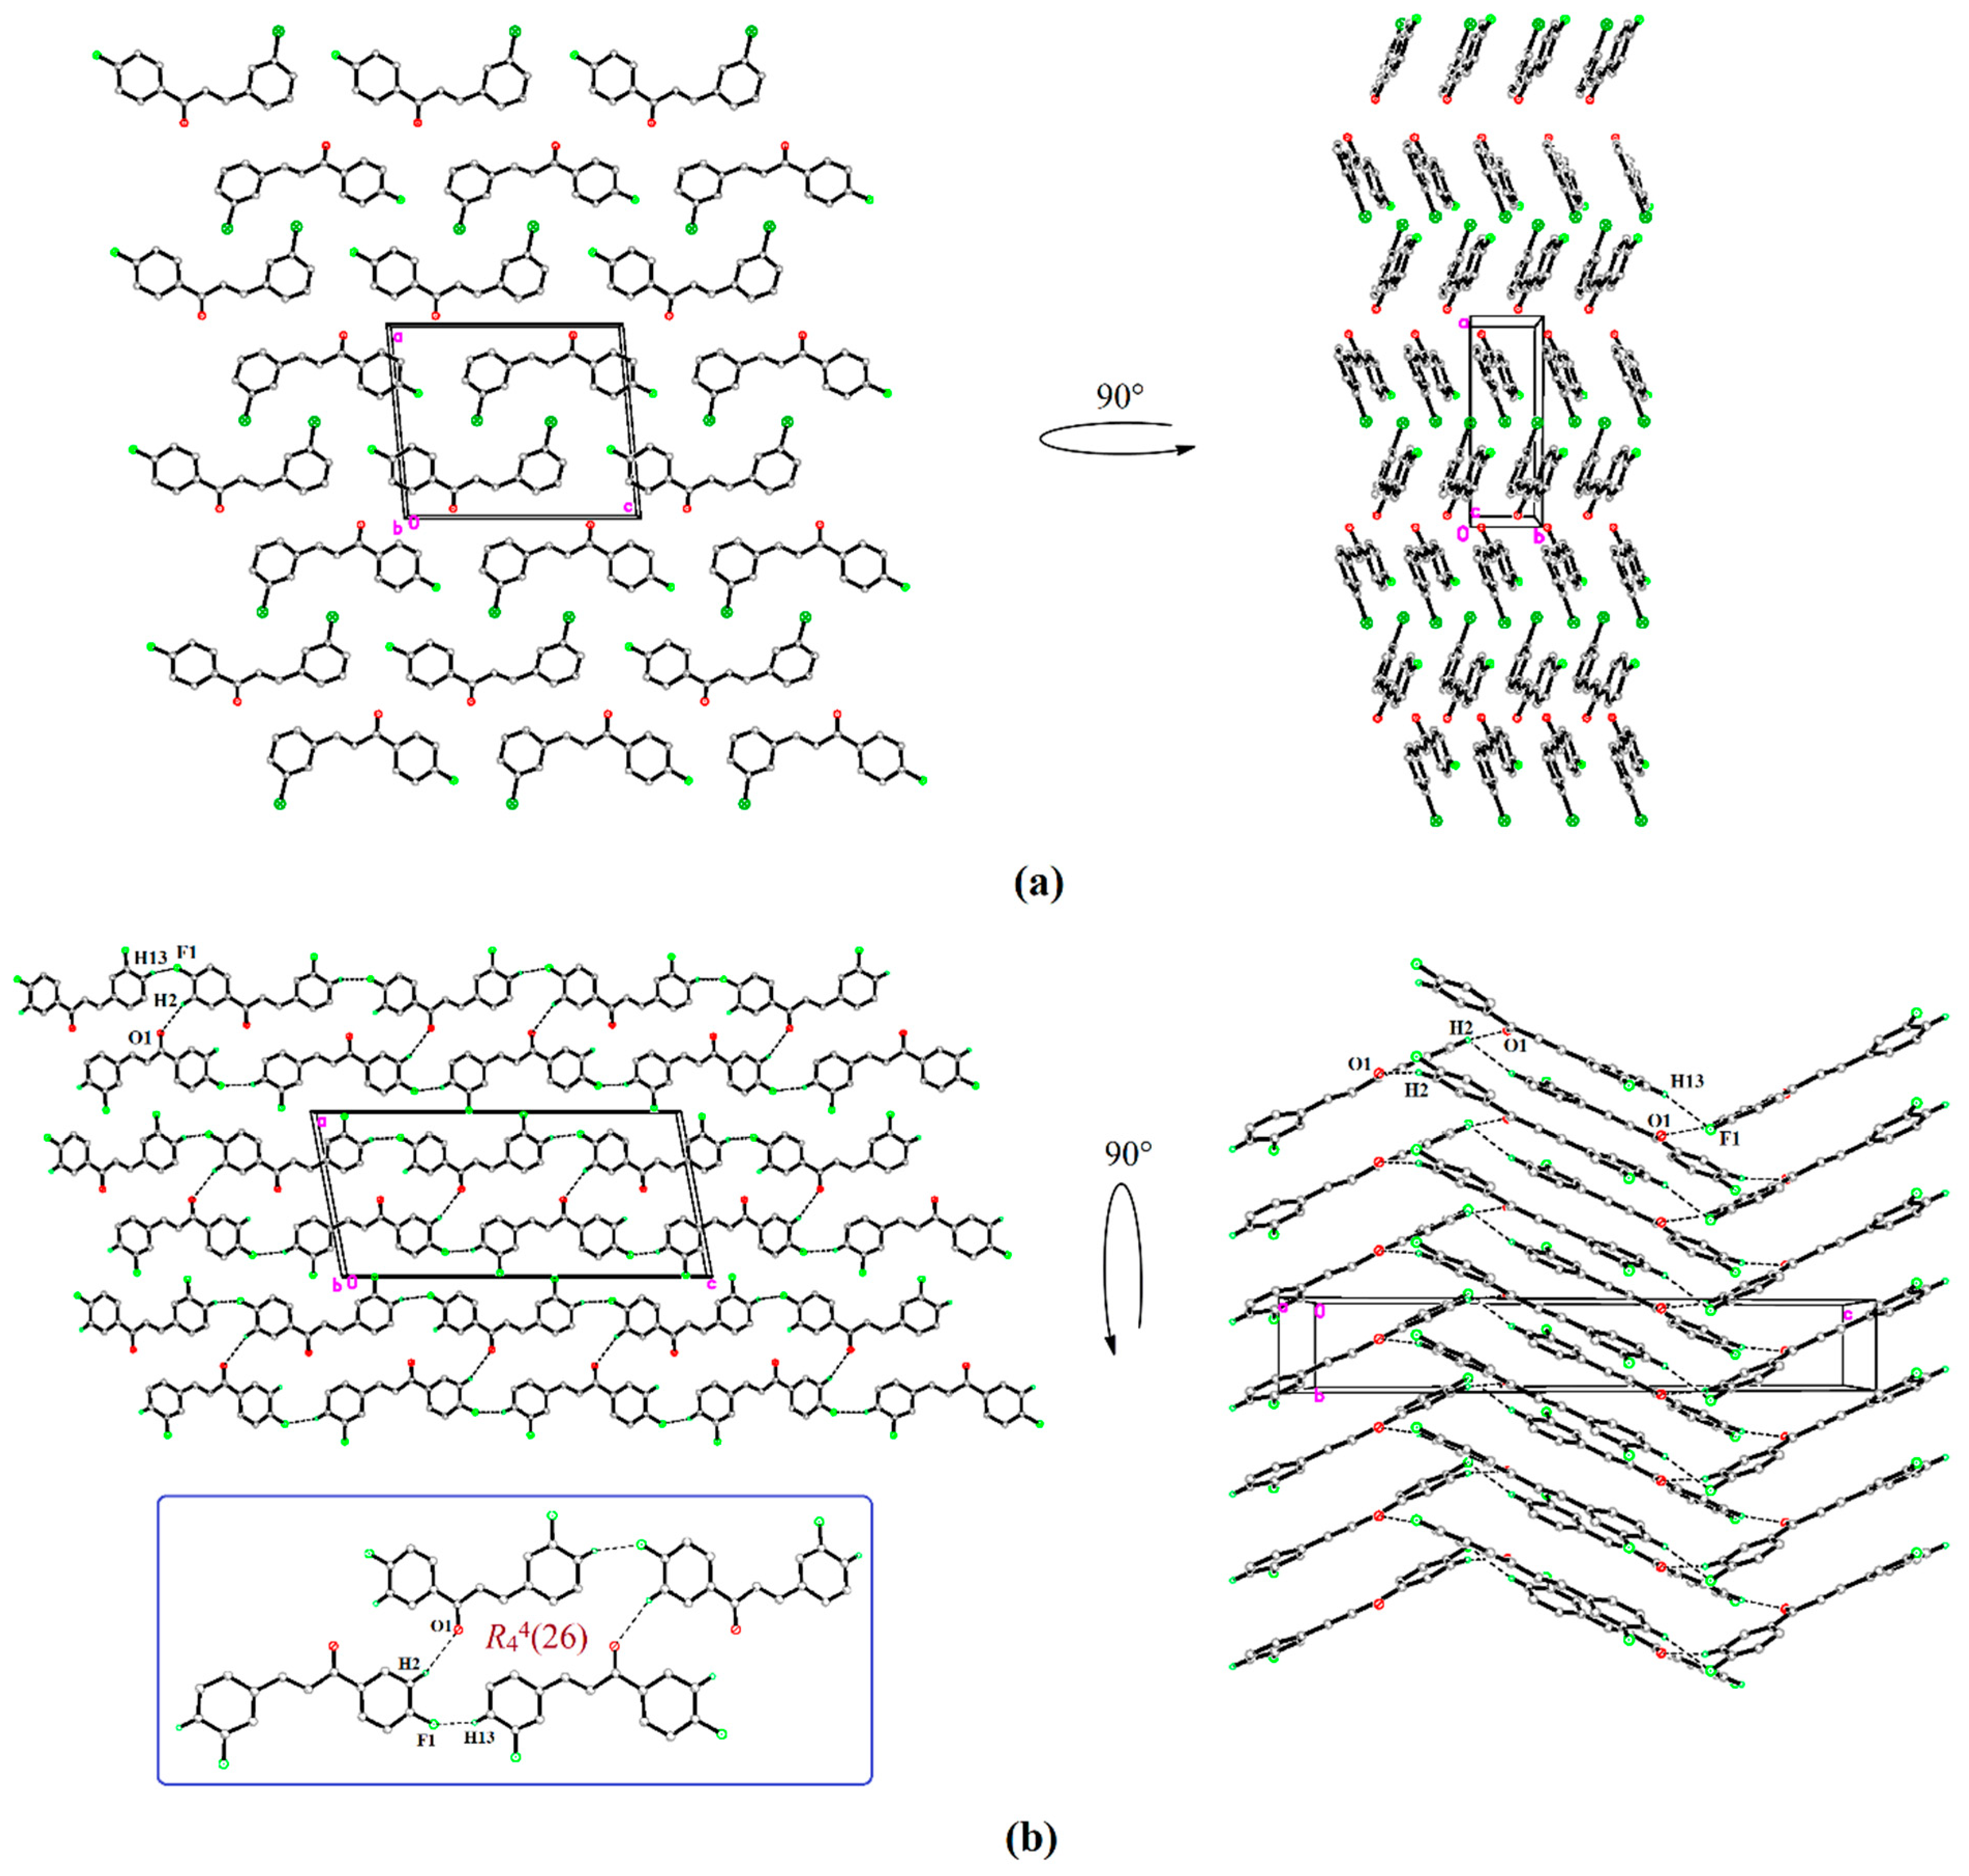
3.3. Molecular and Crystal Structural Analysis

The molecular and optimized structure of the compounds CH-ClF and CH-FF along with the assigned atom-numbering schema are presented in Figure 4a,b, respectively. The new halogen chalcones, namely, (E)-3-(3-chlorophenyl)-1-(4-fluorophenyl)prop-2-en-1-one (CH-ClF) and (E)-3-(3-fluorophenyl)-1-(4-fluorophenyl)prop-2-en-1-one (CH-FF) contained a similar fluoro-substituent unit at the para-position of phenyl ring (R1) and different substituents at the meta-position of phenyl ring (R2). Both chalcones represented an acceptor-pi-acceptor (A-π-A) system [36,40], with the halogen substituents at both ends capped and carbonyls acting as electron-withdrawing groups. Both molecular structures crystallized in a monoclinic crystal system with P21 (CH-ClF) and P21/c (CH-FF) space groups. All bond lengths and angles were within the normal ranges [41] and comparable to the previously reported structures of chalcone [42,43,44]. The geometrical parameters are listed in Table 3, showing small discrepancies, which reveal that calculation was conducted in the gaseous state while observation was performed in the solution state [45].
The molecular structure of both compounds showed an s-cis configuration with respect to the C8 = C9 double bond, with bond distances of 1.334 (3) Å in CH-ClF and 1.312 (2) Å in CH-FF (Table 3). The 4-fluorophenyl moiety (F1/C1-C6) of compound CH-ClF deviated slightly from the (E)-4-(3-chlorophenyl) but-3-en-2-one planarity (Cl1/O1/C7-C15; maximum deviation: 0.084 (3) Å at C8) at the C6—C7 bond with the C5—C6—C7—O1 torsion angle being −171.2 (3)°. Likewise, the fluoro-substituent benzene ring (F1/C1-C6) was slightly twisted at the C6—C7 bond from the mean plane of the (E)-4-(3-fluorophenyl) but -3-en-2-one (F1/O1/C7-C15; maximum deviations: 0.1726 (15) Å at atom O1) with the C5—C6—C7—O1 torsion angle value of 173.13 (17)° in compound CH-FF. Interestingly, compound CH-ClF was found to be almost planar, with the dihedral angles between the mean plane through the enone moiety (O1/C7-C9; maximum deviation of 0.028 (3) Å at atom C7) with the fluoro-substituted and chloro-substituted benzene rings (F1/C1-C6 and Cl1/C10-C15) were 9.38 (18)° and 6.51 (17)°, respectively. Meanwhile, the enone moiety (O1/C7-C9) of compound CH-FF, with a maximum deviation of 0.0295 (16) Å at atom C7, formed dihedral angles of 8.33 (11)° and 12.57 (11)° with the fluoro-substituted benzene rings (F1/C1-C6 and F1/C10-C15), respectively. The dihedral and twisted angles further confirmed the non-planar molecular structure of the compound, as shown in Figure 4c. The dihedral angles formed between two C1-C6 (R1) and C10-C15 (R2) phenyl rings for compound CH-ClF and CH-FF were 6.18° and 20.58°, respectively. It was found that compound CH-FF possessed a large dihedral angle, diminishing the electronic effect between the two phenyl rings through the enone moiety [40].
In the crystal packing of the compound CH-FF (Figure 5b), the molecules were connected by intermolecular C2—H2A⋯O1 (symmetry code: −x + 1, y + 1/2, −z + 3/2) and C13—H13A⋯F1 (symmetry code: −x, −y−1/2, z−1/2) hydrogen bonds (Table 4) to form an infinite two-dimensional sheet parallel along the ac-plane. This parallel sheet was further linked to the neighboring sheet by intermolecular C2—H2A⋯O1 hydrogen bonds propagating along the b-axis direction. In addition, the intermolecular C—H⋯O and C—H⋯Fl hydrogen bonds led to the formation of R 4 4 (26) ring motifs [46]. Notably, there were no classical hydrogen bonding interactions found in compound CH-ClF (Figure 5a).

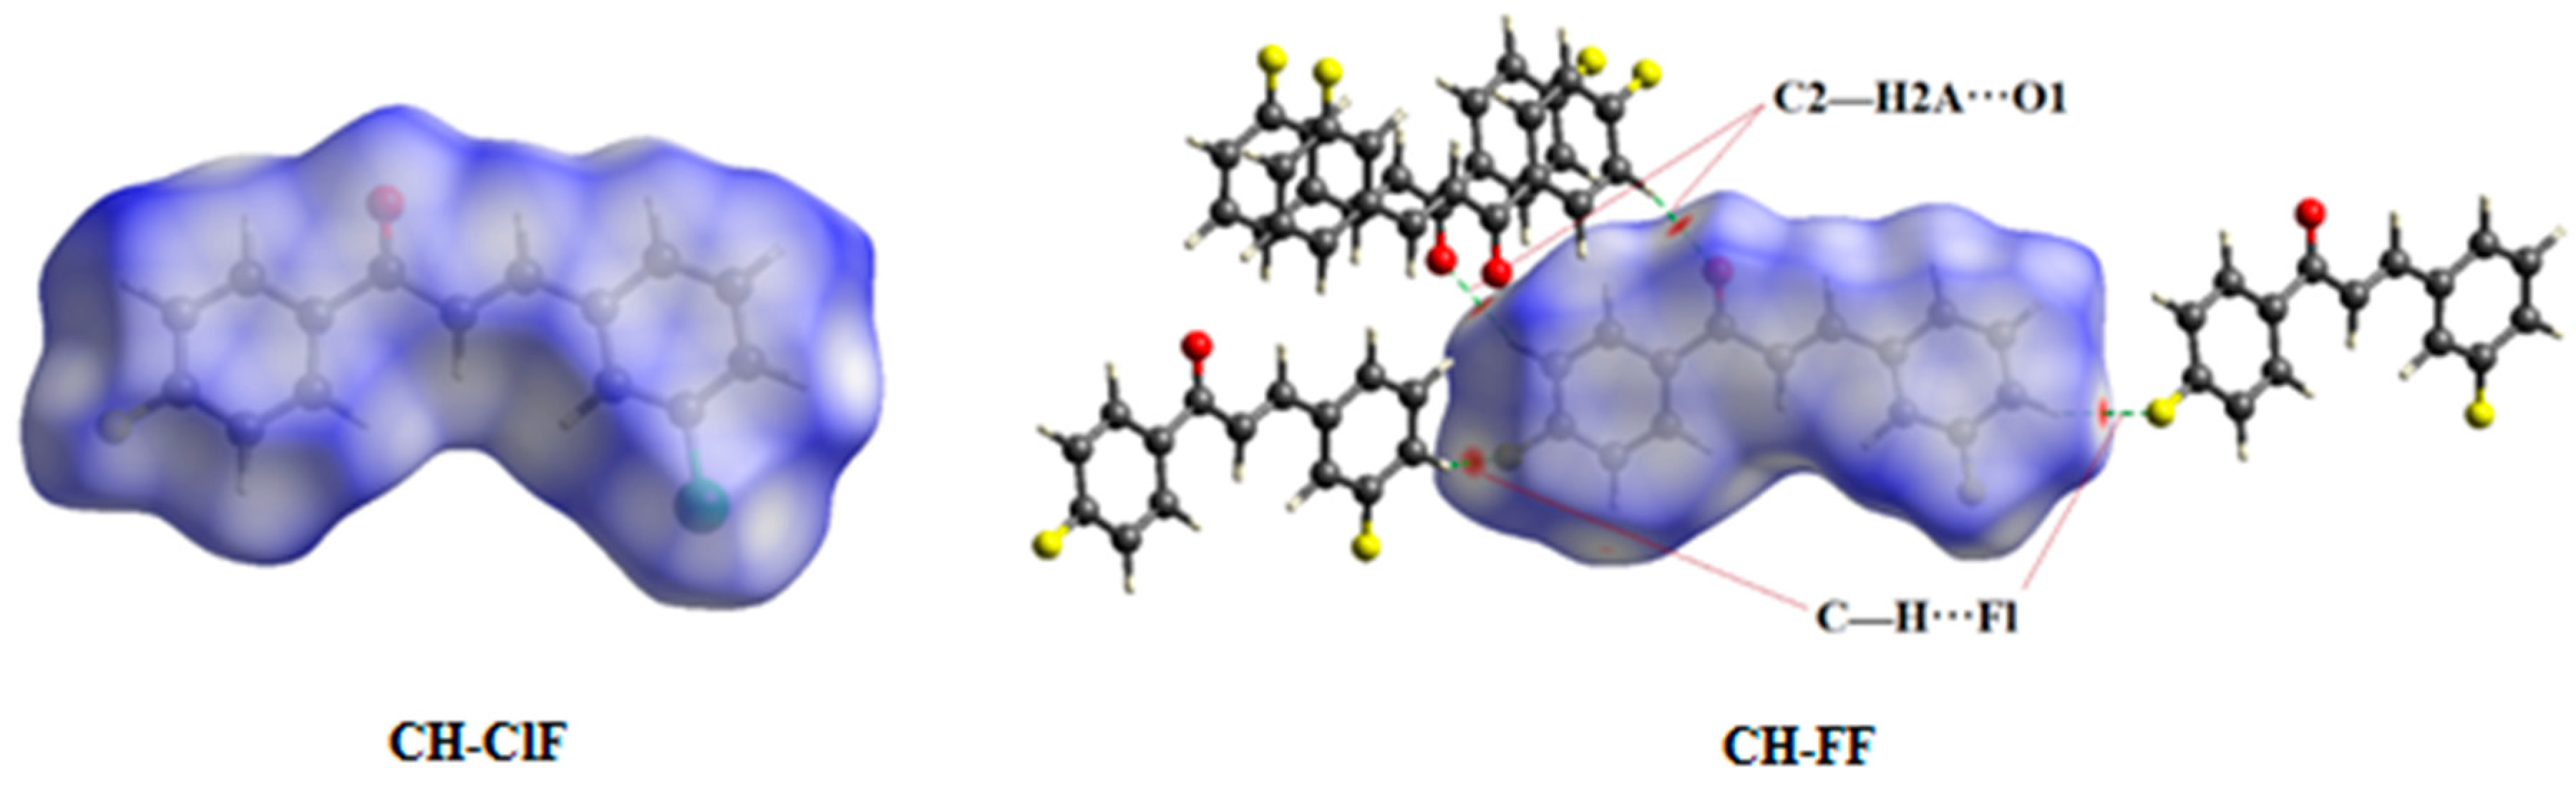
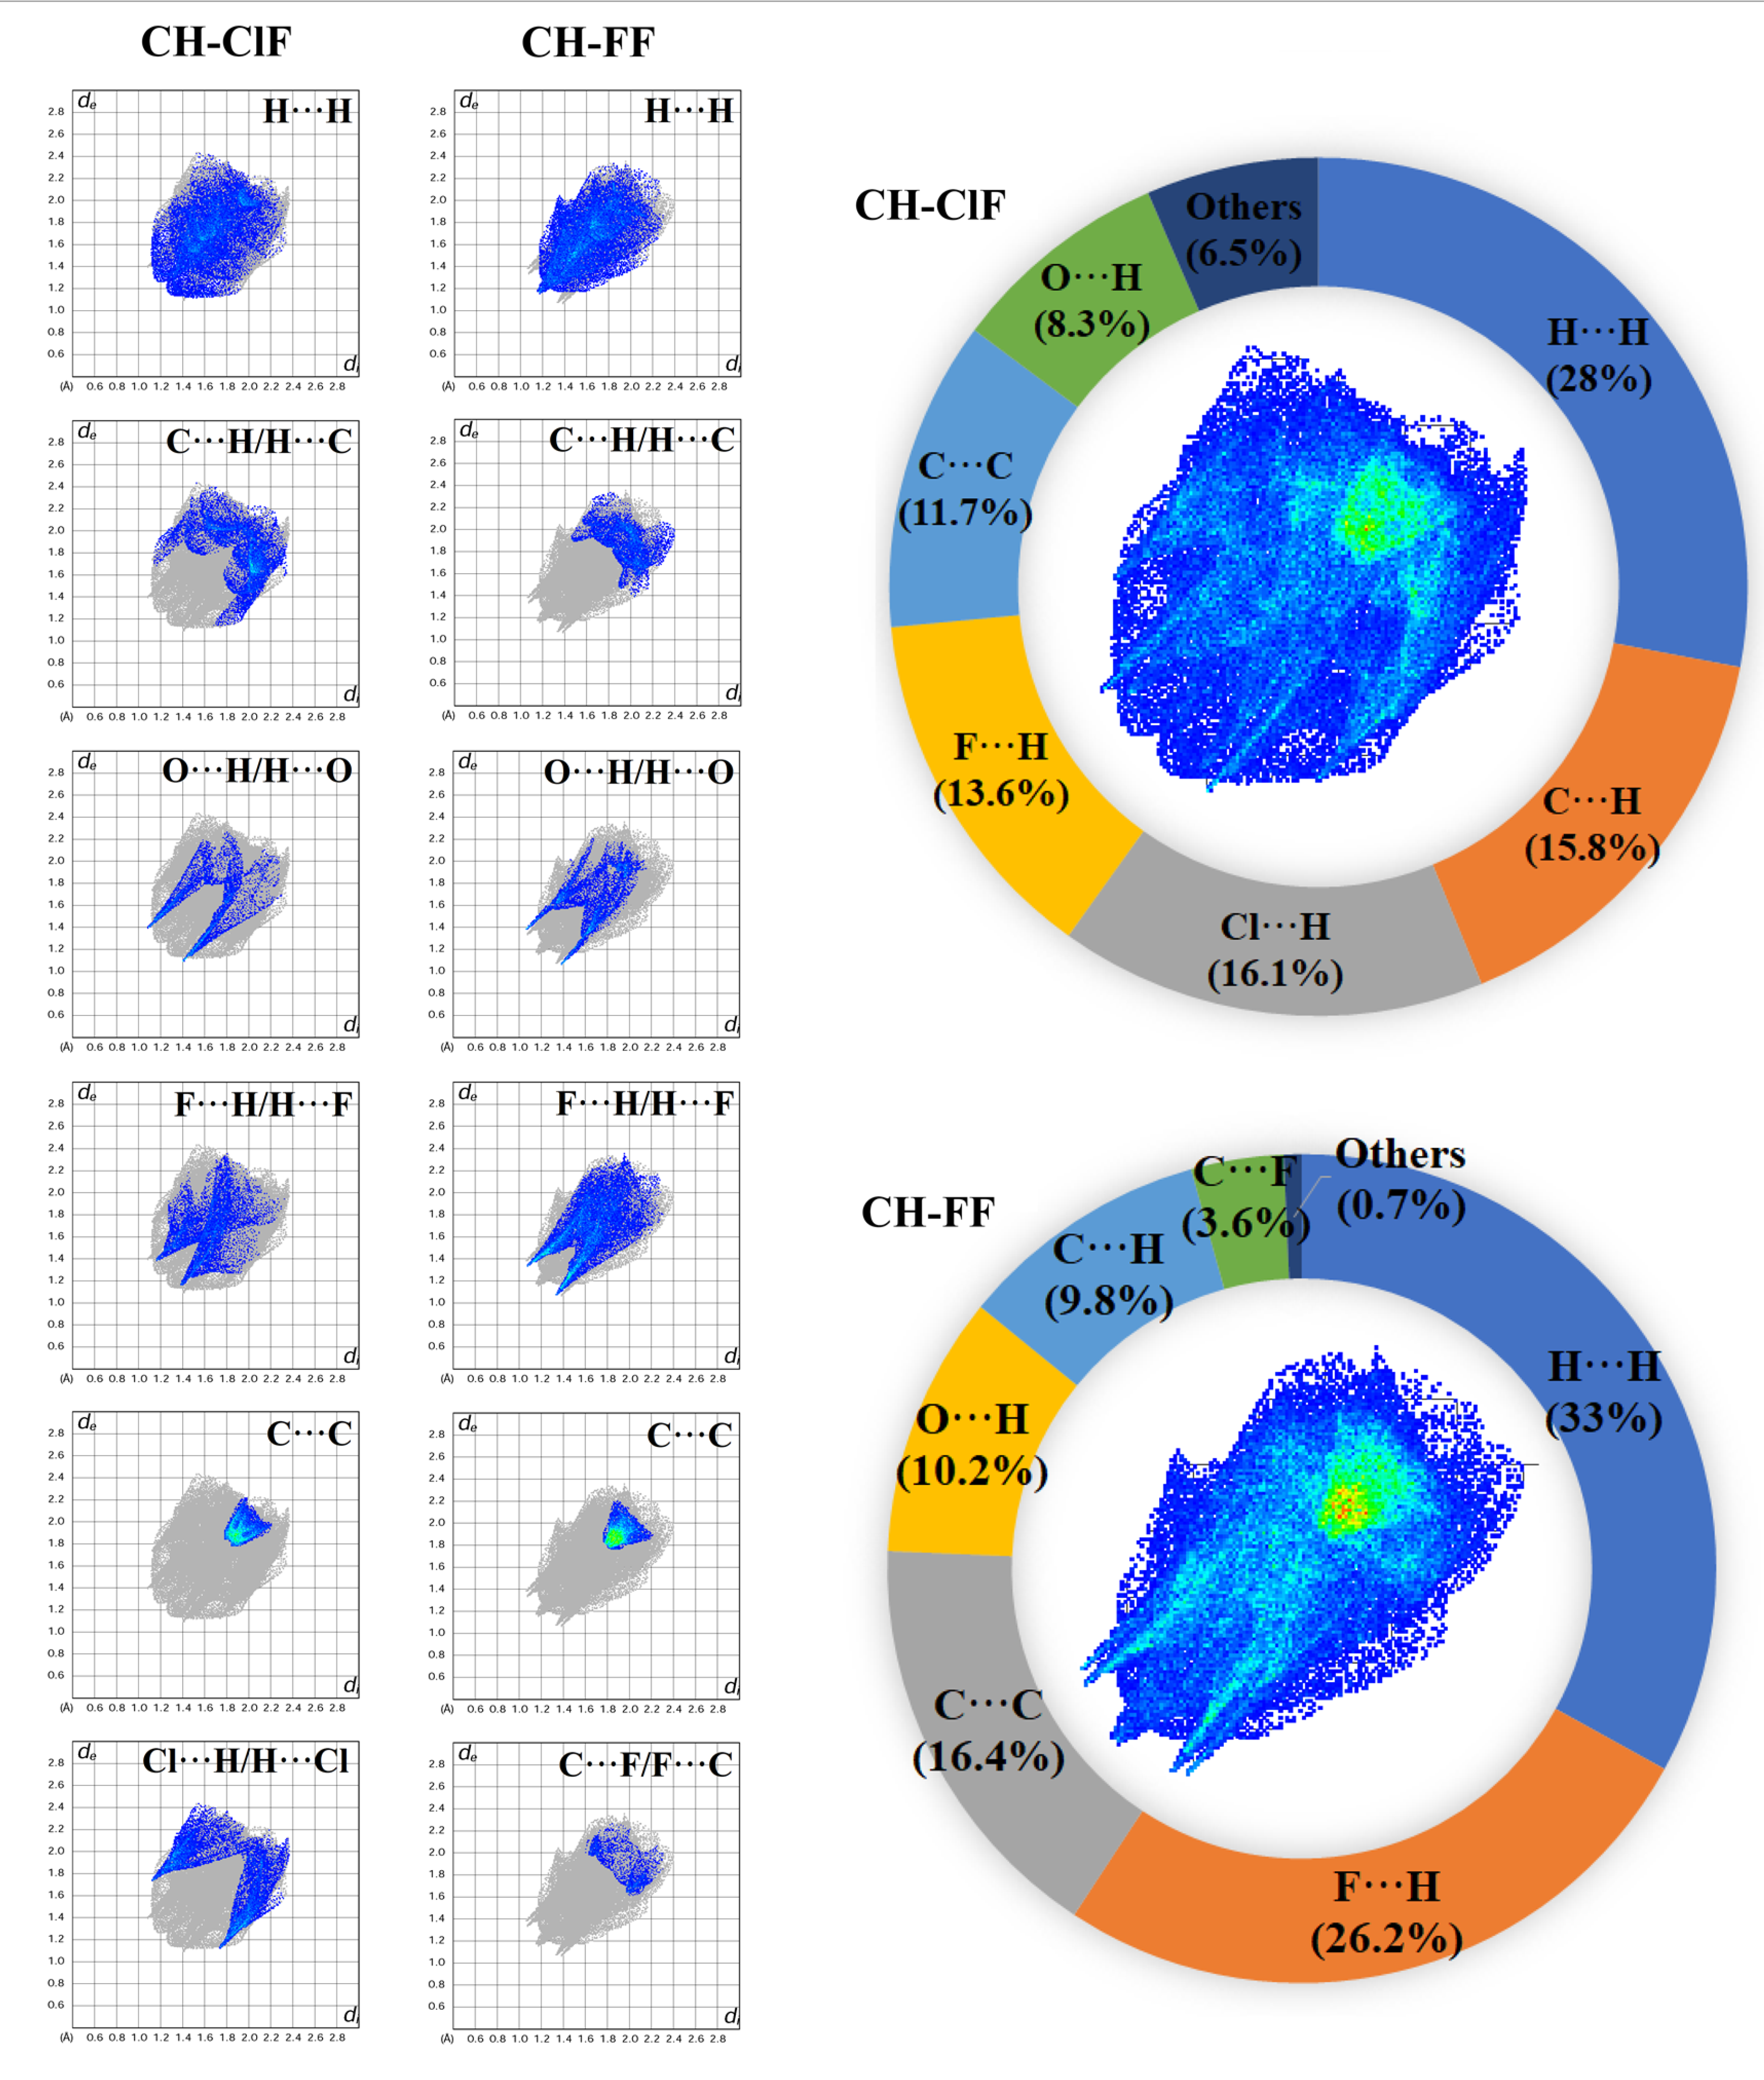
3.4. Hirshfeld Surface Calculations

The presence of intermolecular interactions in the compound were verified by performing the Hirshfeld surface analysis. This provided a three-dimensional visual understanding of the intermolecular contacts and crystal packing of a compound under different types of surface properties and displayed the quantitative statistical distribution of specific interactions. The normalized contact distance dnorm and the breakdown of the associated fingerprint plots of the compounds are depicted in Figure 6 and Figure 7, respectively. The compound CH-FF is depicted as bright red spots on the Hirshfeld surface mapped over dnorm, indicating the presence of C2—H2A⋯O1 and C13—H13A⋯F1 intermolecular interactions connected with neighboring molecules with a distance of 2.58 Å and 2.55 Å, respectively. However, no bright red spots were observed in compound CH-ClF, signifying that intermolecular interactions were not involved in the molecule. Meanwhile, the blue and white regions represent longer intermolecular contacts and contacts around the Van der Waals separation, respectively. The 2D fingerprint plots were deconstructed to highlight particular atom pair contacts in both molecules, delineated into H⋯H, C⋯H/H⋯C, O⋯H/H⋯O, F⋯H/H⋯F, C⋯C, Cl⋯H/H⋯Cl and C⋯F/F⋯C. The Hirshfeld surface analysis of both compounds showed H⋯H interactions of 28% (CH-ClF) and 33% (CH-FF), which were thus revealed as the major contributor to intermolecular interactions and are represented by the largest region in the fingerprint plot (Figure 7). Meanwhile, the second largest contributor in the compound CH-ClF were C⋯H/H⋯C contacts, with 15.8%, whereas F⋯H/H⋯F in compound CH-FF was the second largest ranking contribution with 26.2%, depicted by two narrow sharp spikes attributed to the presence of intermolecular C13—H13A⋯F1 interactions. In addition, the O⋯H/H⋯O contact became the inferior contributor in compound CH-ClF and fourth ranking contribution in compound CH-FF, with 8.3% and 10.2%, respectively, as observed by two symmetrical narrow spikes with di + de ~ 2.4 Å where this value was approximately closer to the separation distance of the hydrogen bond interaction between the hydrogen atom and oxygen of the carbonyl group (H2A⋯O1).

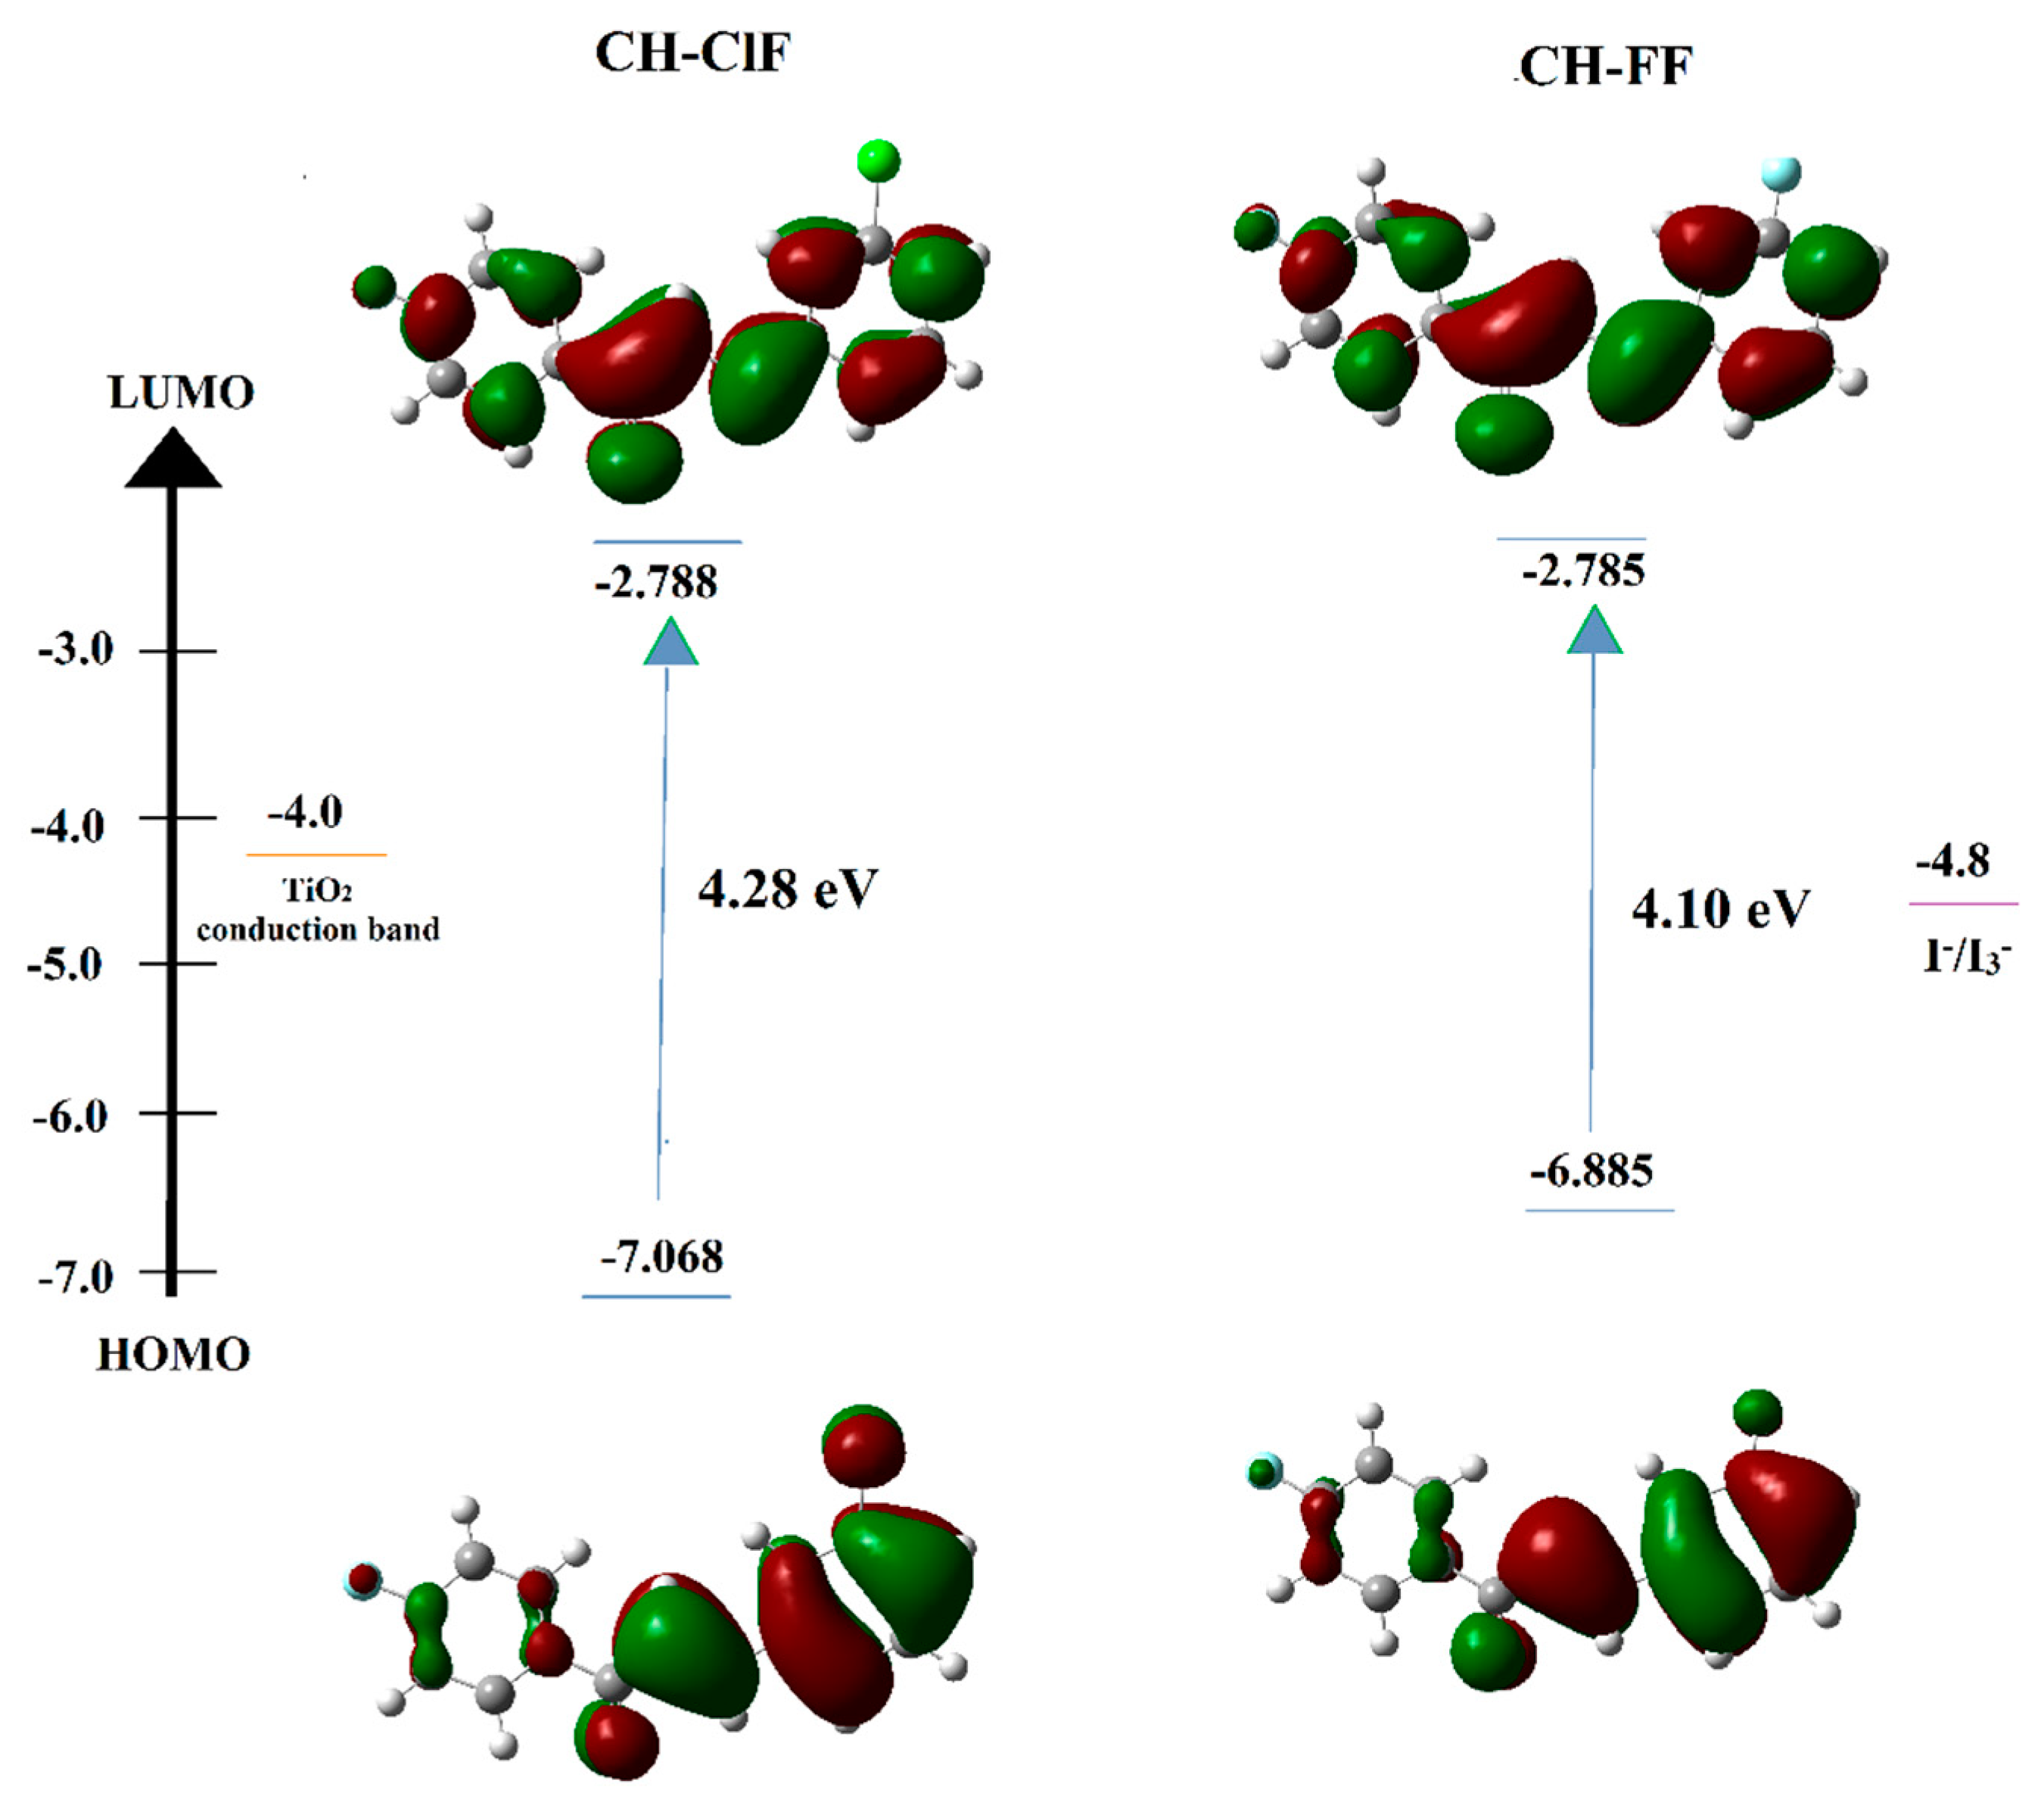
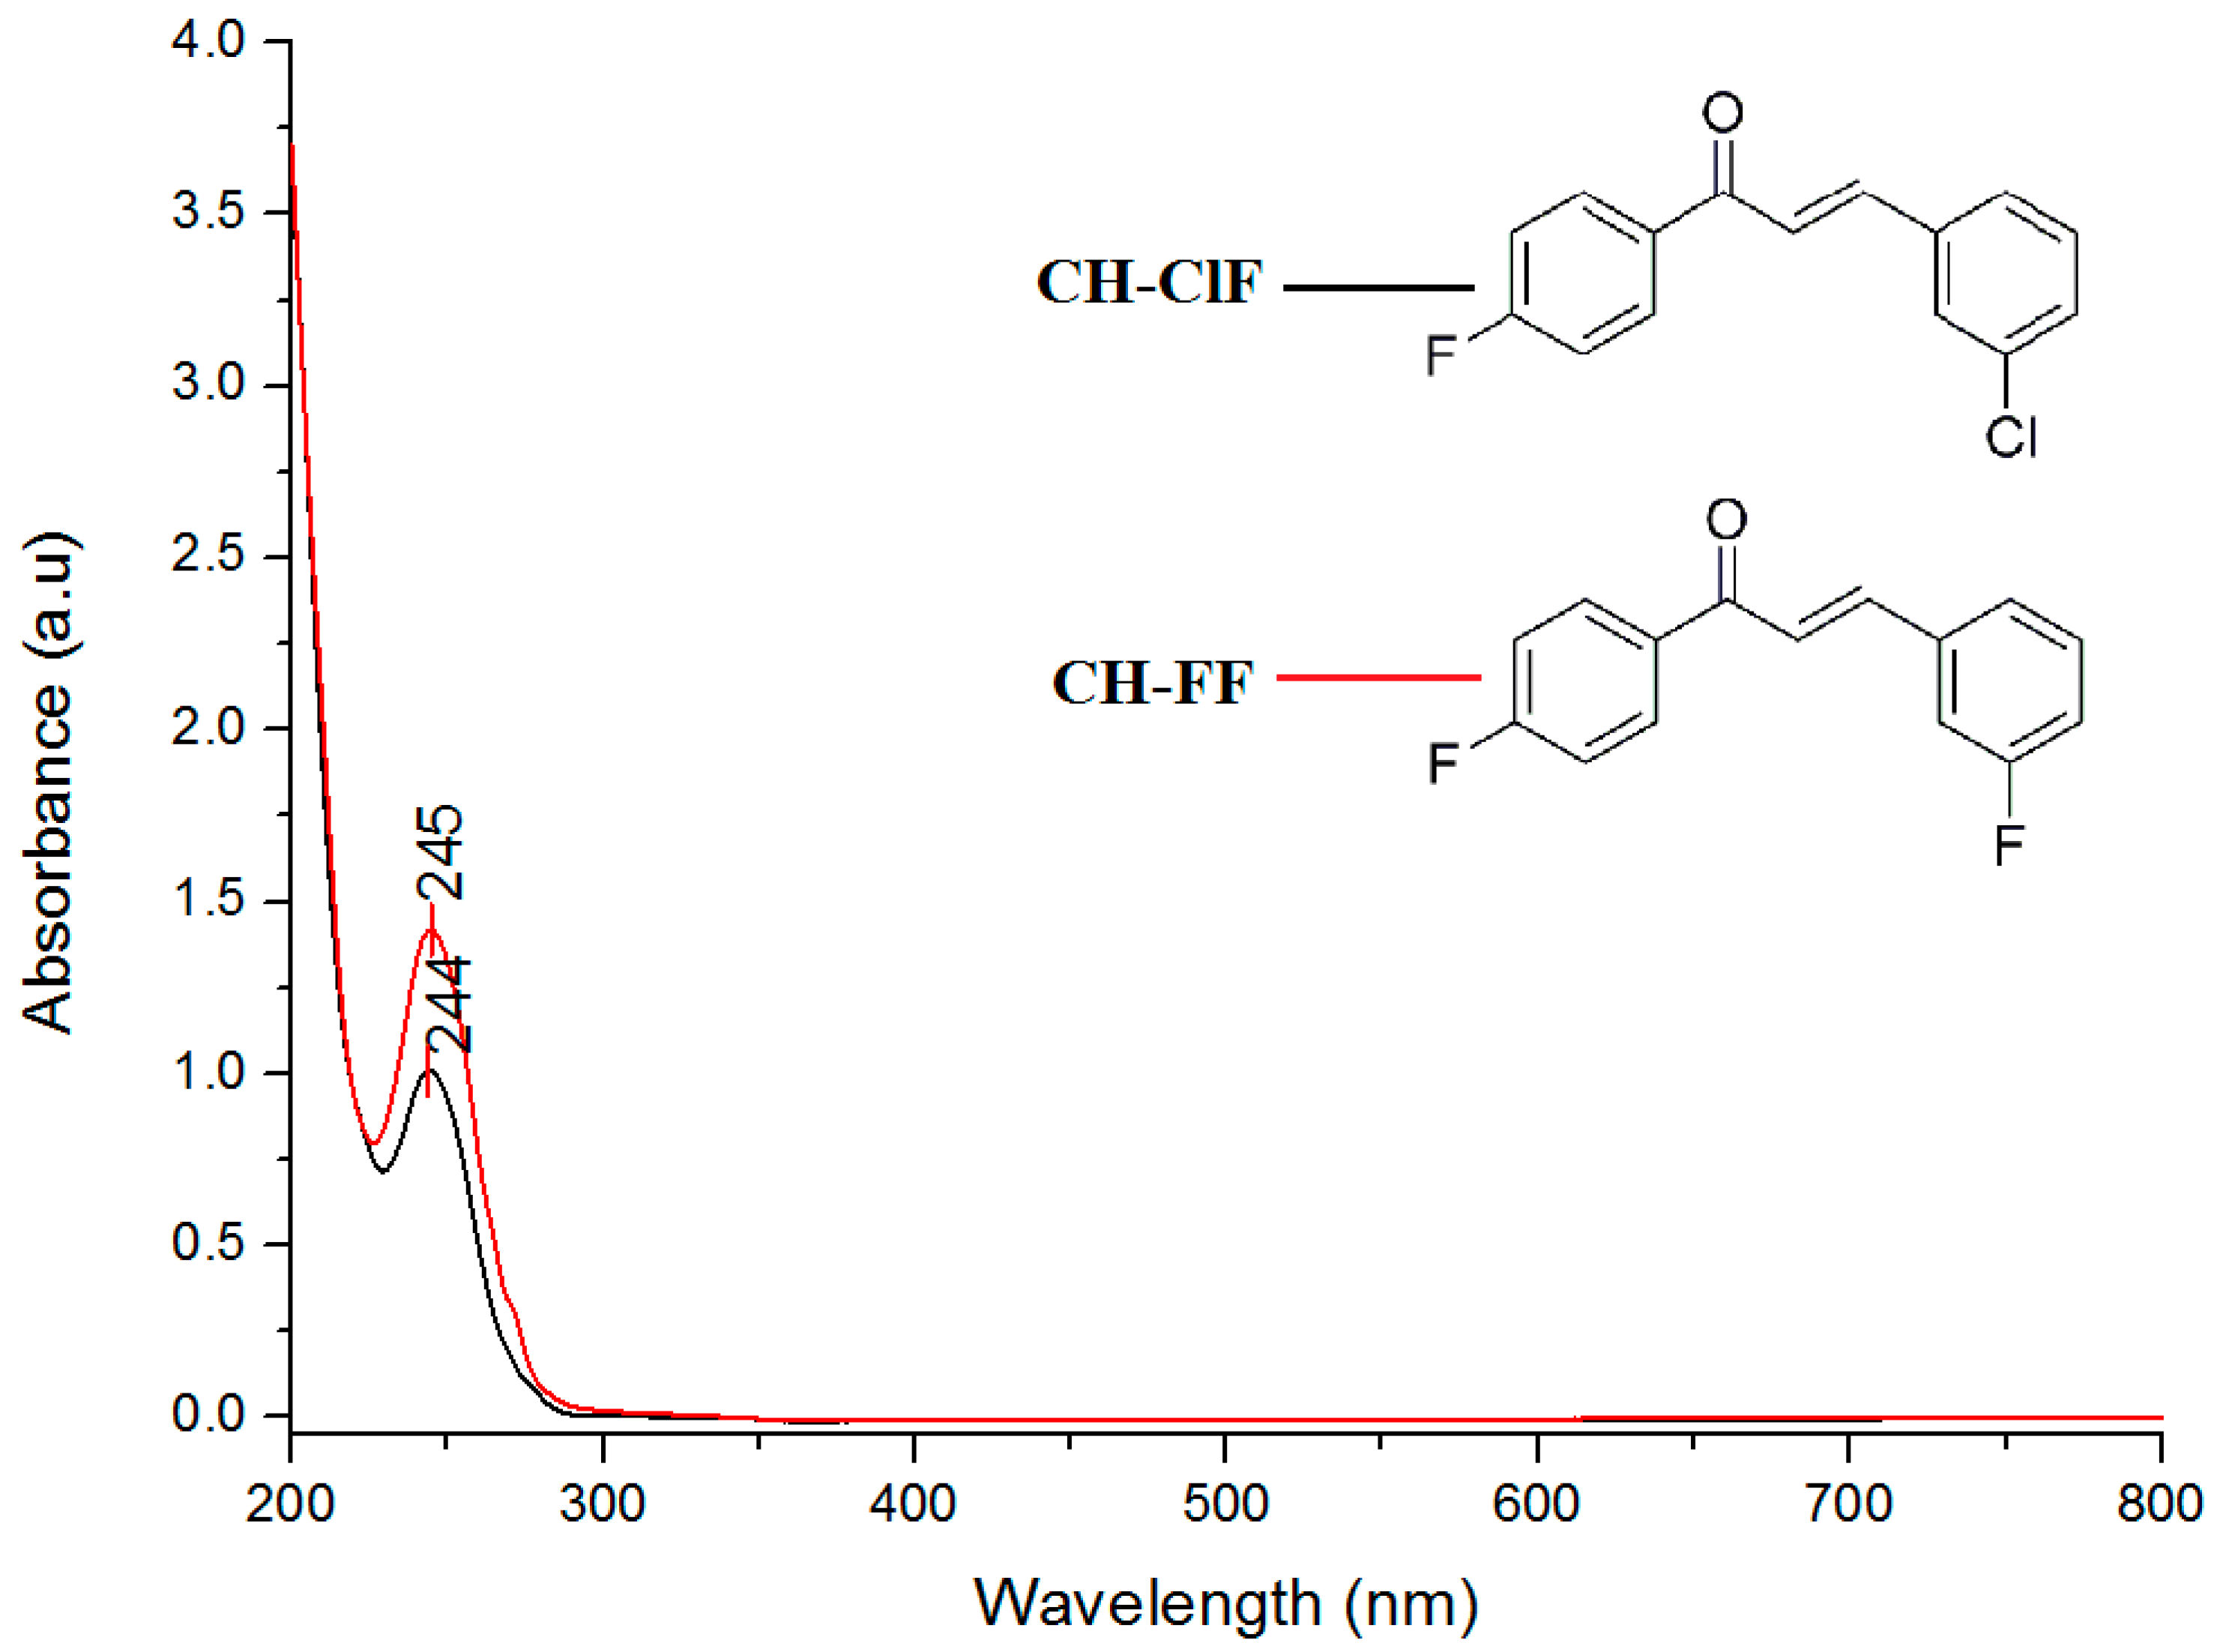
3.5. Ultraviolet–Visible (UV–Vis) and Frontier Molecular Orbital (FMO) Analysis

The important parameters for studying the reactivity of the molecules were analyzed using HOMO and LUMO energies, with HOMO playing a crucial part in illustrating the capability of the compounds as electron donors to unoccupied molecular orbitals [9]. The electronic transition between HOMO and LUMO of CH-ClF and CH-FF showed a similar trend movement, as can be seen in Figure 8. The electron distributions in the HOMO state were localized at the ethylenic bridge and phenyl ring attached to the chlorine and fluorine atom of CH-ClF and CH-FF, respectively. Additionally, both compounds had a small molecular orbital localization at the phenyl ring that bonded to the fluorine atom of each molecule. In the LUMO state, the electron distributions were firmly distributed through the molecular skeleton of both compounds. The energy shift of frontier orbitals from HOMO to LUMO was calibrated by using TD-DFT/B3LYP in order to identify the theoretical absorption maximum values for compounds CH-ClF and CH-FF, which were 336.39 nm and 363.69 eV, respectively.
In the working principle of DSSC, an appropriate energy level is required for deployment as a sensitizer to ensure the occurrence of the electron injection and dye regeneration processes [47]. Figure 8 represents the HOMO energy levels of both compounds, which were lower than the redox potential of I / I 3 ( 4.8   eV), indicating the ability of the oxidized dye to be restored by obtaining electrons from the electrolyte [10]. Likewise, the higher LUMO energy levels compared to the TiO2 conduction band energy level ( 4.0   eV) of CH-ClF and CH-FF suggested the presence of electron injection from the dye to the semiconductor substrate [10]. Hence, the HOMO and LUMO energy levels in Figure 8 illustrate the potential of the CH-ClF and CH-FF compounds as dye-sensitizers in DSSC applications.
Meanwhile, the UV–vis absorption spectrum in Figure 9 was conducted in an acetonitrile solution ( 10 5 M) with a cutoff wavelength of 190 nm. The energy gap values of CH-ClF (experimental: 4.44 eV; theoretical: 4.17 eV) and CH-FF (experimental: 4.38 eV; theoretical: 4.10 eV) were successfully attained. The isolated condition while conducting the theoretical calculations resulted in a slight deviation from the experimental value. The absorption spectra of CH-ClF and CH-FF depicted similar wavelength regions to previously reported compounds containing fluorine substituents [48,49]. Wavelength absorption is influenced by the electron affinity properties of the reported compounds [48].

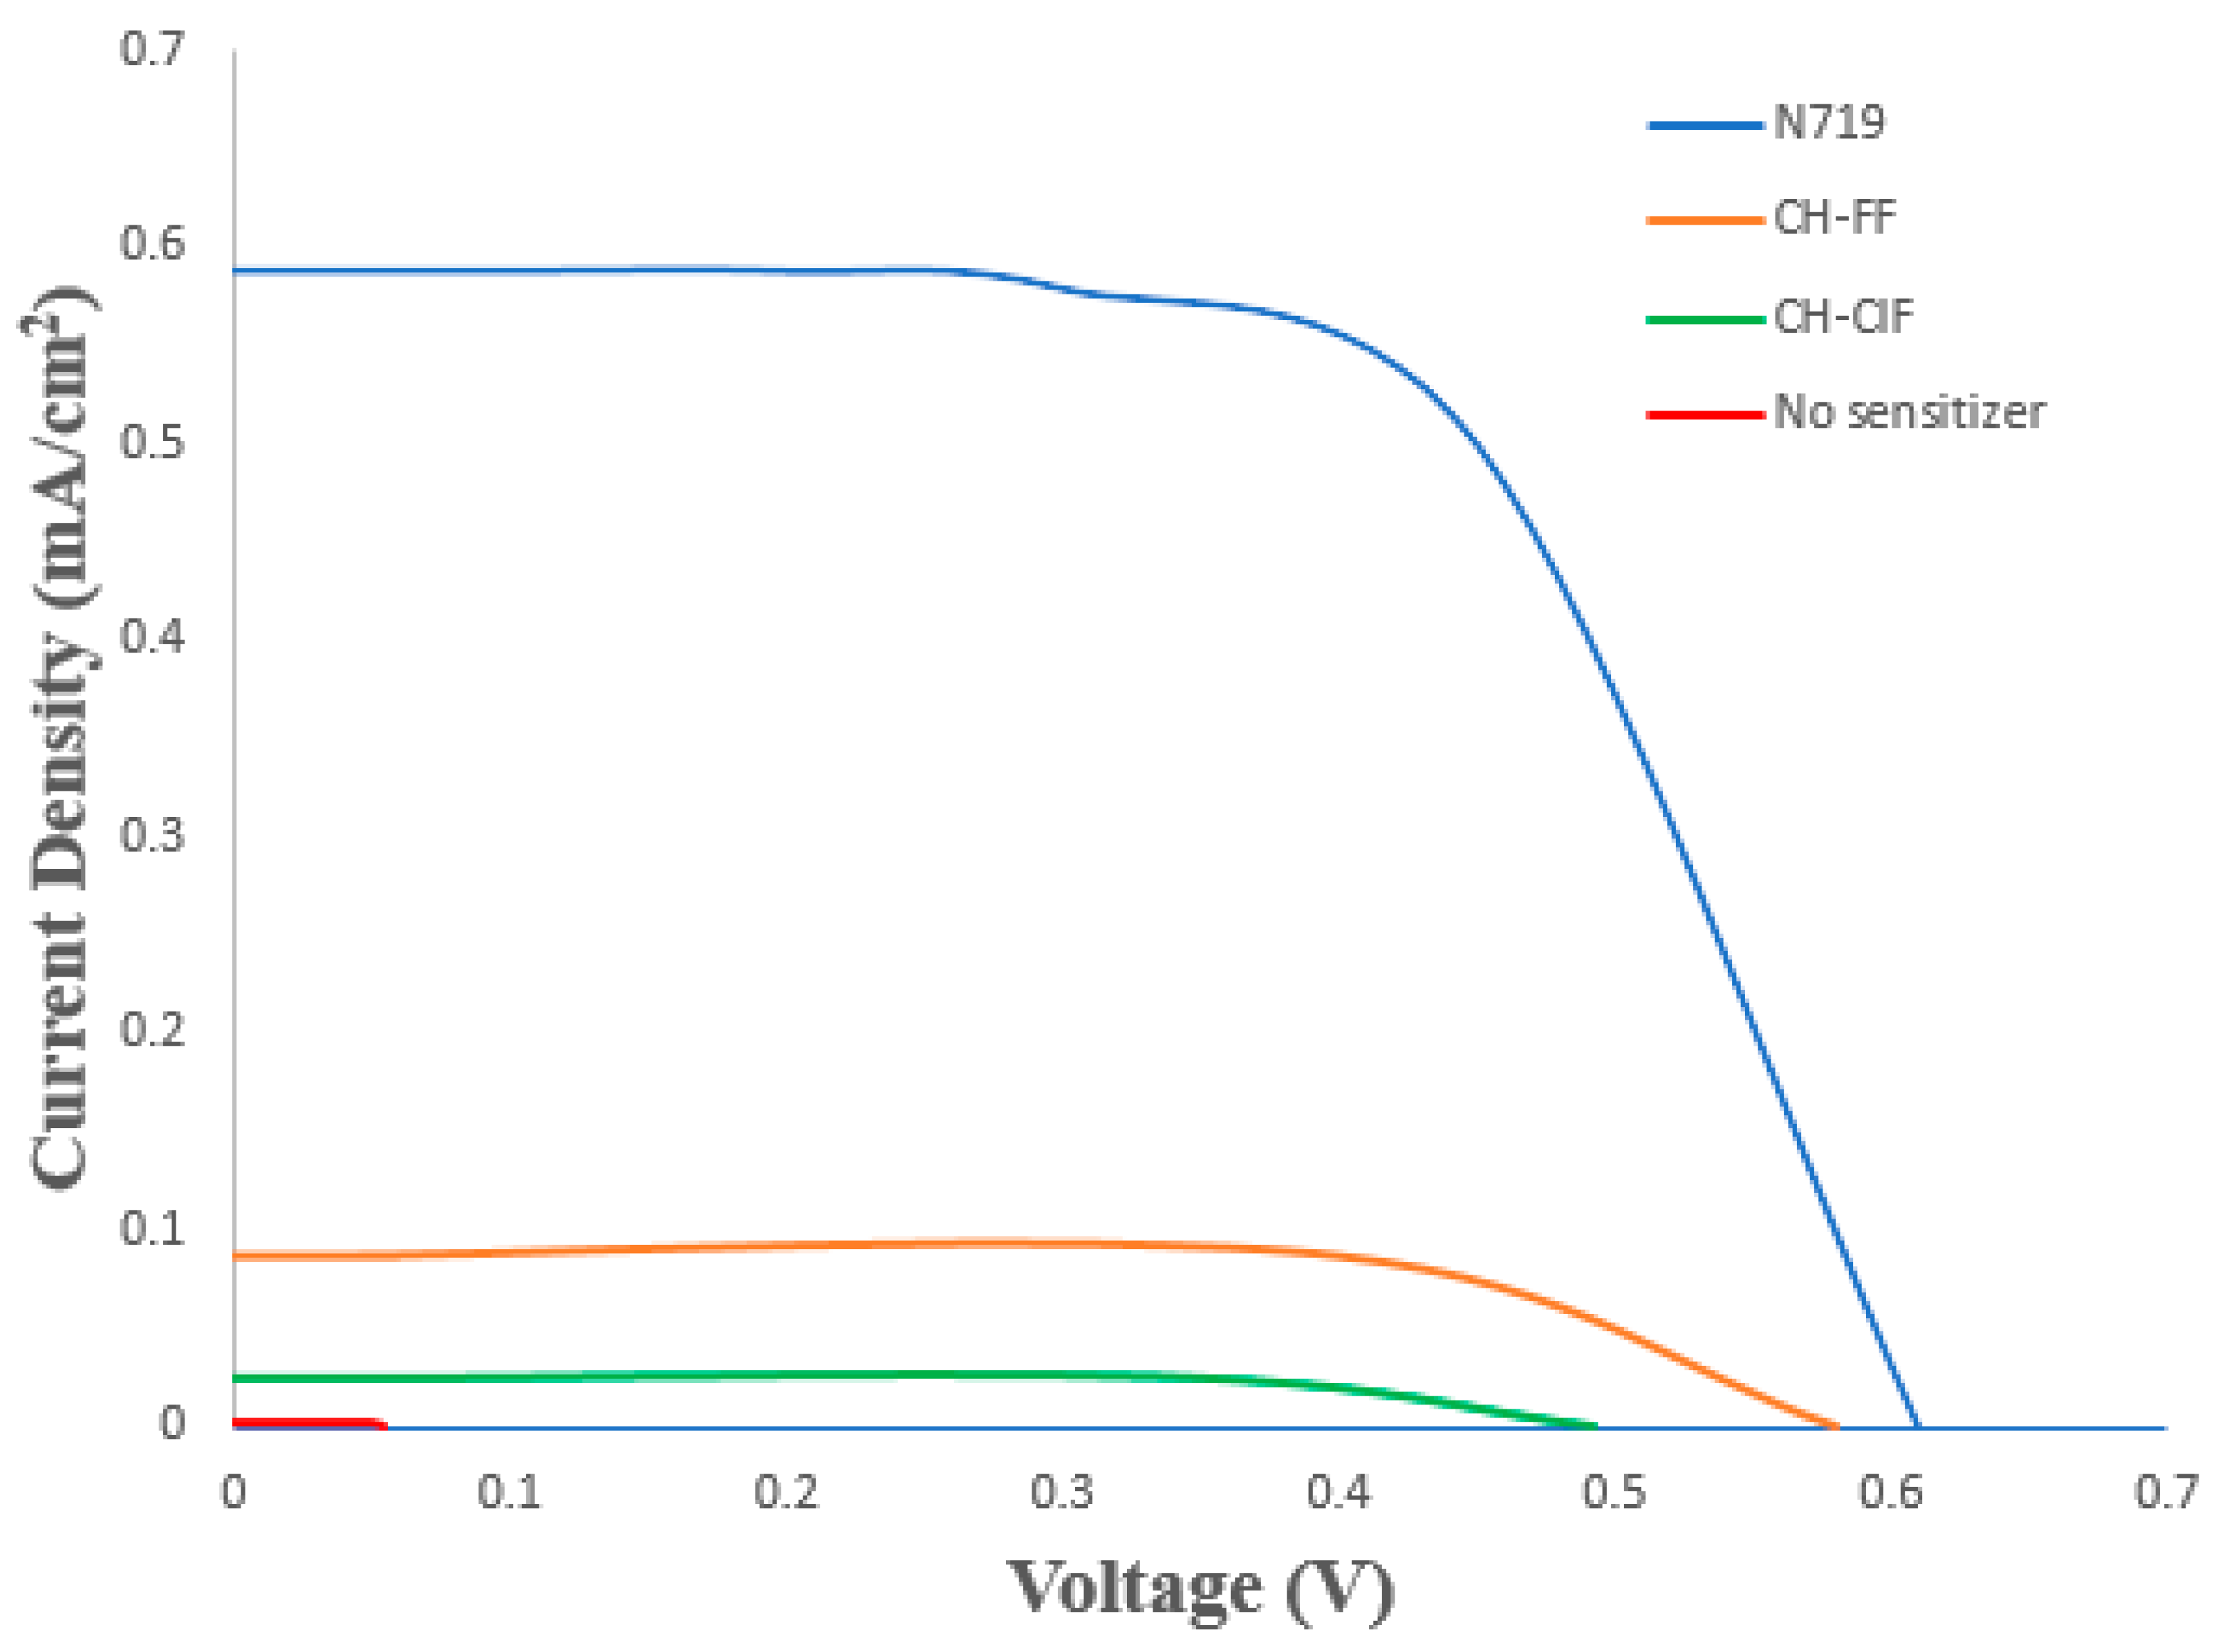
3.6. DSSC Applications and Performance

The photovoltaic performance of DSSC was associated with essential parameters, which were short circuit current (Jsc), open circuit voltage (Voc), fill factor (FF) and power efficiency (η), as defined in Table 5 and illustrated in the J-V characteristic curve in Figure 10 for the reported compounds, N719, and the DSSC without sensitizer. The Jsc was controlled by the ability of dye molecules to absorb light and the flow of charge through the dye molecules to the nanocrystalline TiO2 area [10]. The Fill Factor (FF) operated on the quality of the device’s performance, which was influenced by appropriate TiO2 thickness, suitable electrolyte solution, and photocurrent conversion by the dye-sensitizer [50]. The ability of the dye to be coated well on the TiO2 surface during the fabrication process was important in achieving better DSSC efficiency.
In this research, the halogenated chalcone cells were tested along with the standard dye (N719) and the cell without sensitizer under the same conditions for comparison and consistency. As can be seen in Figure 10, all plotted curves displayed an almost similar trend with the increment of Jsc, which caused the Voc to be gradually shifted to the right. The graph shows higher current density for the N719 than the halogenated chalcones tested. Meanwhile, the DSSC without any sensitizer shows the smallest Jsc value (0.002 mA/cm2) in the TiO2 layer, suggesting the presence of CH-ClF and CH-FF as potential sensitizers to compliment the photovoltaic performance. Furthermore, these results support the fact that the fluorinated chalcones were anchored on the TiO2 layer.
From Table 5, the open circuit voltages (Voc) achieved by CH-ClF and CH-FF were higher than the DSSC without sensitizer; however, they were lower than the standard dye, N719. The Voc results were controlled by the concentration of injected electrons at the TiO2 layer and the electron recombination process that occurred between the dye molecules and the electrolyte [10]. The higher values of Voc were due to efficient electron injection accumulation at the TiO2 and a low injected electron recombination rate with the electrolyte [51].
The efficiency of the DSSC performance for both halogenated chalcone, N719, and the cell without sensitizer were calculated using Equation (2). The results revealed that the DSSC conversion efficiency of CH-FF ( η = 0.03632%) was larger than CH-ClF ( η = 0.00832%) due to the structural configuration of CH-FF with –fluoro attachments on both aromatic rings, leading to the higher electronegativity properties compared to CH-ClF. The electronegativity properties acted as the chemical descriptor for the atoms within the compound to attract the electrons during the chemical reaction [19]. Hence, this led to the good quality of charge transfer within the CH-FF molecules, which also affected the HOMO–LUMO energy levels for an excellent band energy [20,21]. The flow of charge transfer within HOMO–LUMO energy levels is important to ease the electron injection process in the TiO2 layer [10]. These criteria were well defined for CH-FF, resulting in a higher Jsc values (Figure 10) and DSSC conversion efficiency.
η = J s c × V o c × F F P i n  
Additionally, CH-FF molecules were stabilized by the various hydrogen bond interactions of C−H⋯O and C−H⋯F. The existence of intermolecular interactions in DSSC induced the charge transfer between the molecules to facilitate the electron injection and dye regeneration process for better photovoltaic performance. In addition, the high percentage of Fill Factor (FF) indicated the possibility of high-energy conversion and good dye absorption in the TiO2 area [13]. The fill factor, FF achieved by CH-FF (72.8%) in Table 5 shows its better fabrication and good absorption process compared to CH-ClF (70.2%). However, the efficiency of CH-ClF and CH-FF, as shown in Figure 10, were lower than the standard dye. This is due to the -COOH functional group that exists in N719, which helps to facilitate electron transport compared to the reported compounds without a -COOH anchoring group. The presence of the -COOH attachment was reported as a good potential factor for the dye to anchor on the TiO2 area by improving the coupling effect of electrons [15]. The DSSC efficiency achieved by CH-ClF was comparable with the previously reported studies [52]; however, CH-FF shows lower power conversion results.

4. Conclusions

In the final analysis, we have discovered that the efficiencies of the DSSC application contributed well to the electronegativity of the designed compounds. The compound with the highest electronegative properties (CH-FF) was able to enhance the charge transfer flow inside the molecules compared to the compound with lower electronegativity (CH-ClF). The charge movement within the molecules was clearly shown in the energy shift of the frontier orbitals from HOMO to LUMO, as calibrated at 4.28 eV (CH-ClF) and 4.10 eV (CH-FF). Apart from this, the strong intermolecular interactions helped to further stabilize the compound, resulting in better performance of the DSSC due to excellent charge mobility between the molecules. CH-FF possessed C−H⋯O and C−H⋯F interactions, while there were no classical hydrogen bonding interactions found in CH-ClF, as confirmed by the Hirshfeld analysis. This successfully yielded a DSSC conversion power for CH-FF and CH-ClF of 0.03632% and 0.00832%, respectively.

Supplementary Materials

The following are available online at https://www.mdpi.com/article/10.3390/cryst11111357/s1, Figure S1: (a) The image of the sensitized TiO2 on the working electrode before fabrication and (b) after fabrication with electrolyte injected on the CH-ClF and CH-FF cells.

Author Contributions

Conceptualization, S.N.A.M.N., S.N.F.A.R., M.F.Z. and A.H.A.; Methodology, S.N.A.M.N., S.N.F.A.R., M.F.Z. and A.H.A.; Funding acquisition, S.A.; Project administration: S.A. and I.A.R.; Supervision, S.A. and I.A.R.; Visualization, S.N.A.M.N., S.N.F.A.R., M.F.Z. and A.H.A., Writing—original draft: S.N.A.M.N., S.N.F.A.R., M.F.Z., A.H.A. and S.A.; Writing—review & editing: S.N.A.M.N., M.F.Z., A.H.A. and S.A. All authors have read and agreed to the published version of the manuscript.

Funding

This work was funded under the Research University Grant (RUI) No. 1001.PFIZIK.8011115.

Institutional Review Board Statement

Not applicable.

Informed Consent Statement

Not applicable.

Data Availability Statement

CCDC 1521381 and 1521383 contain the supplementary crystallographic data for this paper. These data can be obtained free of charge via www.ccdc.cam.ac.uk/data_request/cif, or by emailing [email protected], or by contacting The Cambridge Crystallographic Data Centre, 12 Union Road, Cambridge CB2 1EZ, UK; fax: +44 1223 336033.

Acknowledgments

The authors would like to thank the Malaysian Government and Universiti Sains Malaysia for providing facilities and funding to conduct this work.

Conflicts of Interest

The authors declare no conflict of interest.

References

  1. Prabhu, A.N.; Upadhyaya, V.; Jayarama, A.; Bhat, K.S. Synthesis, growth and characterization of π conjugated organic nonlinear optical chalcone derivative. Mater. Chem. Phys. 2013, 138, 179–185. [Google Scholar] [CrossRef]
  2. Shehzad, R.A.; Muhammad, S.; Chaudhry, A.R.; Ito, S.; Iqbal, J.; Khalid, M.; Aloui, Z.; Xu, H.-L. Electro-Optical and Charge Transport Properties of Chalcone Derivatives Using a Dual Approach from Molecule to Material Level Simulations. Comput. Theor. Chem. 2021, 1203, 113349. [Google Scholar] [CrossRef]
  3. Alidmat, M.M.; Khairuddean, M.; Norman, N.M.; Asri, A.N.M.; Suhaimi, M.H.M.; Sharma, G. Synthesis, Characterization, Docking Study and Biological Evaluation of New Chalcone, Pyrazoline, and Pyrimidine Derivatives as Potent Antimalarial Compounds. Arab. J. Chem. 2021, 14, 103304. [Google Scholar] [CrossRef]
  4. Wu, X.; Shi, Y.; Ju, Y.; Jia, J.; Fang, Y.; Chen, Y.; Wu, Q.; Song, Y. Investigation of the intensity dependent transition from saturable absorption to reverse saturable absorption and ultrafast negative refraction in terthiophene-based chalcone derivatives. Opt. Mater. 2021, 117, 111174. [Google Scholar] [CrossRef]
  5. Gomes, L.R.; Low, J.N.; Wardell, J.L. Crystal structures, Hirshfeld surface analysis and PIXEL calculations of two chalcone derivatives, containing isopropoxy substituents: Importance of dispersion energy. J. Mol. Struct. 2021, 1237, 130354. [Google Scholar] [CrossRef]
  6. Kiran, M.S.; Anand, B.; Sankara, S.S.; Rao, G.N. Second- and third-order nonlinear optical properties of bis-chalcone derivatives. J. Photochem. Photobiol. A Chem. 2014, 290, 38–42. [Google Scholar] [CrossRef]
  7. Vlasiou, M.C.; Al Hatahta, A. Spectroscopic evaluation of chalcone derivatives and their zinc metal complexes: A combined experimental and computational approach studying the interactions of the complexes with the serum albumin. J. Mol. Struct. 2021, 1232, 130052. [Google Scholar] [CrossRef]
  8. Makhlouf, M.M.; Radwan, A.S.; Ghazal, B. Experimental and DFT insights into molecular structure and optical properties of new chalcones as promising photosensitizers towards solar cell applications. Appl. Surf. Sci. 2018, 452, 337–351. [Google Scholar] [CrossRef]
  9. Anizaim, A.H.; Zainuri, D.A.; Zaini, M.F.; Razak, I.A.; Bakhtiar, H.; Arshad, S. Comparative analyses of new donor-π-acceptor ferrocenyl-chalcones containing fluoro and methoxy-fluoro acceptor units as synthesized dyes for organic solar cell material. PLoS ONE 2020, 15, e0241113. [Google Scholar] [CrossRef]
  10. Anizaim, A.H.; Zaini, M.F.; Razak, I.A.; Arshad, S. Insight into the impact of the substituent modification on the photovoltaic performance of ferrocenyl chalcones based DSSCs. J. Solid State Chem. 2021, 304, 122551. [Google Scholar] [CrossRef]
  11. Phan, T.P.; Teo, K.Y.; Liu, Z.Q.; Tsai, J.K.; Tay, M.G. Application of unsymmetrical bis-chalcone compounds in dye sensitized solar cell. Chem. Data Collect. 2019, 22, 100256. [Google Scholar] [CrossRef]
  12. Rajakumar, P.; Thirunarayanan, A.; Raja, S.; Ganesan, S.; Maruthamuthu, P. Photophysical properties and dye-sensitized solar cell studies on thiadiazole–triazole–chalcone dendrimers. Tetrahedron Lett. 2012, 53, 1139–1143. [Google Scholar] [CrossRef]
  13. Rajakumar, P.; Kalpana, V.; Ganesan, S.; Maruthamuthu, P. Synthesis and DSSC application of novel dendrimers with benzothiazole and triazole units. Tetrahedron Lett. 2011, 52, 5812–5816. [Google Scholar] [CrossRef]
  14. Rajakumar, P.; Visalakshi, K.; Ganesan, S.; Maruthamuthu, P.; Suthanthiraraj, S.A. Pyreno-chalcone dendrimers as an additive in the redox couple of dye-sensitized solar cells. J. Mater. Sci. 2012, 47, 1811–1818. [Google Scholar] [CrossRef]
  15. Chauhan, R.; Yadav, R.; Singh, A.K.; Trivedi, M.; Kociok-Köhn, G.; Kumar, A.; Gosavi, S.; Rane, S. Ferrocenyl chalcones with phenolic and pyridyl anchors as potential sensitizers in dye-sensitized solar cells. RSC Adv. 2016, 6, 97664–97675. [Google Scholar] [CrossRef]
  16. Omar, A.; Ali, M.S.; Rahim, N.A. Electron transport properties analysis of titanium dioxide dye-sensitized solar cells (TiO2-DSSCs) based natural dyes using electrochemical impedance spectroscopy concept: A review. Sol. Energy 2020, 207, 1088–1121. [Google Scholar] [CrossRef]
  17. Yahya, M.; Bouziani, A.; Ocak, C.; Seferoğlu, Z.; Sillanpää, M. Organic/metal-organic photosensitizers for dye-sensitized solar cells (DSSC): Recent developments, new trends, and future perceptions. Dye. Pigment. 2021, 192, 109227. [Google Scholar] [CrossRef]
  18. Patil, S.S.; Mane, R.M.; Khot, K.V.; Mali, S.S.; Hong, C.K.; Bhosale, P.N. Surfactant assisted approach to development of efficient WO3 photoanode for natural dye sensitized solar cell. Sol. Energy 2021, 220, 371–383. [Google Scholar] [CrossRef]
  19. Dimitrov, V.; Komatsu, T. Correlation among electronegativity, cation polarizability, optical basicity and single bond strength of simple oxides. J. Solid State Chem. 2012, 196, 574–578. [Google Scholar] [CrossRef]
  20. Mujica-Martínez, C.A.; Arce, J.C. Mini-bandstructure tailoring in pi-conjugated periodic block copolymers using the envelope crystalline-orbital method. Int. J. Quantum Chem. J. 2010, 110, 2532–2540. [Google Scholar]
  21. Pan, S.; Kong, X.; Zhang, Q.; Xu, Q.; Wang, M.; Wei, C.; Zhao, Y.; Zhang, X. Rational modulating electronegativity of substituents in amorphous metal-organic frameworks for water oxidation catalysis. Int. J. Hydrogen Energy 2020, 45, 9723–9732. [Google Scholar] [CrossRef]
  22. Zhang, B.; Chou, L.; Bi, Y. Tuning surface electronegativity of BiVO4 photoanodes toward high-performance water splitting. Appl. Catal. B Environ. 2020, 262, 118267. [Google Scholar] [CrossRef]
  23. Bruker, A. Saint and SADABS; Bruker AXS Inc.: Madison, WI, USA, 2009. [Google Scholar]
  24. Sheldrick, G. A short history of SHELX. Acta Crystallogr. Sect. A 2008, 64, 112–122. [Google Scholar] [CrossRef] [PubMed] [Green Version]
  25. Spek, A.L. Structure validation in chemical crystallography. Acta Crystallogr. Sect. D Biol. Crystallogr. 2009, 65, 148–155. [Google Scholar] [CrossRef] [PubMed]
  26. Macrae, C.F.; Bruno, I.; Chisholm, J.A.; Edgington, P.R.; McCabe, P.; Pidcock, E.; Rodriguez-Monge, L.; Taylor, R.J.; van de Streek, J.; Wood, P. Mercury CSD 2.0– new features for the visualization and investigation of crystal structures. J. Appl. Crystallogr. 2008, 41, 466–470. [Google Scholar] [CrossRef]
  27. Wolff, S.; Grimwood, D.; McKinnon, J.; Turner, M.; Jayatilaka, D.; Spackman, M. Crystal Explorer; The University of Western Australia: Perth, Australia, 2012. [Google Scholar]
  28. Ternavisk, R.R.; Camargo, A.J.; Machado, F.B.C.; Rocco, J.A.F.F.; Aquino, G.L.B.; Silva, V.H.C.; Napolitano, H.B. Synthesis, characterization, and computational study of a new dimethoxy-chalcone. J. Mol. Model. 2014, 20, 2526. [Google Scholar] [CrossRef]
  29. Frisch, M.J.; Trucks, G.W.; Schlegel, H.B.; Scuseria, G.E.; Robb, M.A.; Cheeseman, J.R.; Scalmani, G.; Barone, V.; Mennucci, B.; Petersson, G.A.; et al. Gaussian 09; Revision B.01; Gaussian, Inc.: Wallingford, CT, USA, 2009. [Google Scholar]
  30. Kumar, V.; Gupta, R.; Bansal, A. Role of chenodeoxycholic acid as co-additive in improving the efficiency of DSSCs. Sol. Energy 2020, 196, 589–596. [Google Scholar] [CrossRef]
  31. Nandiyanto, A.B.D.; Oktiani, R.; Ragadhita, R. How to Read and Interpret FTIR Spectroscope of Organic Material. Indones. J. Sci. Technol. 2019, 4, 97–118. [Google Scholar] [CrossRef]
  32. Vinaya, P.; Prabhu, A.; Bhat, K.S.; Upadhyaya, V. Synthesis, growth and characterization of a long-chain π-conjugation based methoxy chalcone derivative single crystal; a third order nonlinear optical material for optical limiting applications. Opt. Mater. 2019, 89, 419–429. [Google Scholar] [CrossRef]
  33. Thanigaimani, K.; Arshad, S.; Khalib, N.C.; Razak, I.A.; Arunagiri, C.; Subashini, A.; Sulaiman, S.F.; Hashim, N.S.; Ooi, K.L. A new chalcone structure of (E)-1-(4-Bromophenyl)-3-(napthalen-2-yl)prop-2-en-1-one: Synthesis, structural characterizations, quantum chemical investigations and biological evaluations. Spectrochim. Acta Part A. Mol. Biomol. Spectrosc. 2015, 149, 90–102. [Google Scholar] [CrossRef]
  34. Naik, V.S.; Patil, P.S.; Wong, Q.A.; Quah, C.K.; Gummagol, N.B.; Jayanna, H. Molecular structure, linear optical, second and third-order nonlinear optical properties of two non-centrosymmetric thiophene-chalcone derivatives. J. Mol. Struct. 2020, 1222, 128901. [Google Scholar] [CrossRef]
  35. Saravanan, R.R.; Seshadri, S.; Gunasekaran, S.; Mendoza-Meroño, R.; Garcia-Granda, S. Spectrochimica Acta Part A: Molecular and Biomolecular Spectroscopy MEP and molecular docking studies on 1- (1- (3-methoxyphenyl) ethylidene) thiosemicarbazide. Spectrochim. Acta Part A Mol. Biomol. Spectrosc. 2015, 139, 321–328. [Google Scholar] [CrossRef] [PubMed]
  36. Anizaim, A.H.; Arshad, S.; Zaini, M.F.; Abdullah, M.; Zainuri, D.A.; Razak, I.A. Third order nonlinear optical properties of selected fluorinated chalcone derivatives. Opt. Mater. 2019, 98, 109406. [Google Scholar] [CrossRef]
  37. Arshad, S.; Pilli, R.R.; Zainuri, D.A.; Khalib, N.C.; Razak, I.A.; Armaković, S.; Armaković, S.J.; Renjith, R.; Panicker, Y.; Alsenoye, C.V. Synthesis, XRD crystal structure, spectroscopic characterization, local reactive properties using DFT and molecular dynamics simulations and molecular docking study of (E)-1-(4-bromophenyl)-3-(4-(trifluoromethoxy)phenyl)prop-2-en-1-one. J. Mol. Struct. 2017, 1137, 419–430. [Google Scholar] [CrossRef]
  38. Zainuri, D.A.; Abdullah, M.; Arshad, S.; Aziz, M.S.A.; Krishnan, G.; Bakhtiar, H.; Razak, I.A. Crystal structure, spectroscopic and third-order nonlinear optical susceptibility of linear fused ring dichloro-substituent chalcone isomers. Opt. Mater. 2018, 86, 32–45. [Google Scholar] [CrossRef]
  39. Kumar, R.; Kumar, A.; Deval, V.; Gupta, A.; Tandon, P.; Patil, P.S.; Watve, J.G. Molecular structure, spectroscopic (FT-IR, FT Raman, UV, NMR and THz) investigation and hyperpolarizability studies of 3-(2-Chloro-6-fluorophenyl)-1-(2-thienyl) prop-2-en-1-one. J. Mol. Struct. 2017, 1129, 292–304. [Google Scholar] [CrossRef]
  40. Zaini, M.F.; Arshad, S.; Thanigaimani, K.; Khalib, N.C.; Zainuri, D.A.; Abdullah, M.; Razak, I.A. New halogenated chalcones: Synthesis, crystal structure, spectroscopic and theoretical analyses for third-order nonlinear optical properties. J. Mol. Struct. 2019, 1195, 606–619. [Google Scholar] [CrossRef]
  41. Allen, F.H.; Kennard, O.; Watson, D.G.; Brammer, L.; Orpen, A.G.; Taylor, R. Tables of bond lengths determined by X-ray and neutron diffraction. Part 1. Bond lengths in organic compounds. J. Chem. Soc. Perkin Trans. 2 1987, 2, S1–S19. [Google Scholar] [CrossRef]
  42. Ng, S.-L.; Razak, I.A.; Fun, H.-K.; Patil, P.S.; Dharmaprakash, S.M. 4’-Fluorochalcone. Acta Crystallogr. Sect. E 2006, 62, o2897–o2899. [Google Scholar] [CrossRef]
  43. Fun, H.-K.; Chia, T.S.; Sapnakumari, M.; Narayana, B.; Sarojini, B. (E)-3-(4-Chlorophenyl)-1-(4-fluorophenyl) prop-2-en-1-one. Acta Crystallogr. Sect. E Struct. Rep. Online 2012, 68, o629. [Google Scholar] [CrossRef]
  44. Fun, H.-K.; Farhadikoutenaei, A.; Narayana, B.; Nayak, P.S.; Sarojini, B. (2E)-3-(2-Fluorophenyl)-1-(4-fluorophenyl) prop-2-en-1-one. Acta Crystallogr. Sect. E Struct. Rep. Online 2012, 68, o2658. [Google Scholar] [CrossRef] [Green Version]
  45. Alwani Zainuri, D.; Arshad, S.; Che Khalib, N.; Fikri Zaini, M.; Razak, I.A. Molecular Structure Investigation on Organic Chalcone Derivative of (E)-3-(4-Bromothiophen-2-1-(3-nitrophenyl)prop-2-en-1-one: A Combined Experimental and Theoretical Study. J. Phys. Conf. Ser. 2018, 1083, 1. [Google Scholar] [CrossRef] [Green Version]
  46. Velasques, J.M.; Gervini, V.C.; Bortoluzzi, A.J.; De Farias, R.L.; De Oliveira, A.B. Crystal structure of (3E)-5-nitro-3-(2-phenylhydrazinylidene)-1H-indol-2(3H)-one. Acta Crystallogr. Sect. E Crystallogr. Commun. 2017, 73, 168–172. [Google Scholar] [CrossRef]
  47. Tripathi, A.; Ganjoo, A.; Chetti, P. Influence of internal acceptor and thiophene based π-spacer in D-A-π-A system on photophysical and charge transport properties for efficient DSSCs: A DFT insight. Sol. Energy 2020, 209, 194–205. [Google Scholar] [CrossRef]
  48. Reichardt, C.; Eschner, M.; Schäfer, G. Syntheses and UV-visible spectroscopic properties of new ‘fluorophilic’ fluorine- and perfluoroalkyl-substituted solvatochromic pyridiniumN-phenolate betaine dyes. J. Phys. Org. Chem. 2001, 14, 737–751. [Google Scholar] [CrossRef]
  49. Zaini, M.F.; Arshad, S.; Ibrahim, A.R.; Khalib, N.C.; Zainuri, D.A. Structural Properties and Quantum Chemical Analysis on a New Chalcone Derivative of (E)-3-(4-bromophenyl)-1-(4-fluorophenyl)prop-2-en-1-one. J. Physics Conf. Ser. 2018, 1083, 012047. [Google Scholar] [CrossRef] [Green Version]
  50. Hossain, M.K.; Pervez, M.F.; Mia, N.H.; Mortuza, A.A.; Rahman, M.S.; Rahaman, M.R.; Karim, M.R.; Islam, J.M.M.; Ahmed, F.; Khan, M.A. Effect of dye extracting solvents and sensitization time on photovoltaic performance of natural dye sensitized solar cells. Results Phys. 2017, 7, 1516–1523. [Google Scholar] [CrossRef]
  51. Borbόn, S.; Lugo, S.; Pourjafari, D.; Pineda Aguilar, N.; Oskam, G.; Lόpez, I. Open-Circuit Voltage (VOC) Enhancement in TiO2-Based DSSCs: Incorporation of ZnO Nanoflowers and Au Nanoparticles. ACS Omega 2020, 5, 10977–10986. [Google Scholar] [CrossRef] [PubMed]
  52. Dao, V.-D. Comment on “Energy storage via polyvinylidene fluoride dielectric on the counter electrode of dye-sensitized solar cells” by Jiang et al. J. Power Sources 2017, 337, 125–129. [Google Scholar] [CrossRef]
Scheme 1. The synthesis route of the title compounds.
Crystals 11 01357 sch001
Figure 1. The single crystals of the compound (a) CH-ClF and (b) CH-FF.
Crystals 11 01357 g001
Figure 2. Illustrative diagram of the DSSC components [9].
Crystals 11 01357 g002
Figure 3. FTIR spectrum of CH-ClF and CH-FF.
Crystals 11 01357 g003
Figure 4. (a) The molecular structure of the compounds with 50% ellipsoid probability, with atomic numbering scheme, (b) the optimized structures using DFT/B3LYP/6-311G++(d,p) basis set level, and (c) their respective planarity confirmation.
Crystals 11 01357 g004
Figure 5. Crystal packing of compound (a) CH-ClF and (b) CH-FF showing that the molecules are connected by intermolecular C−H⋯O and C−H⋯F hydrogen bonds into a two-dimensional sheet parallel to the ac-plane. The observed C−H⋯O bond propagates along the b-axis direction.
Crystals 11 01357 g005
Figure 6. dnorm surface.
Crystals 11 01357 g006
Figure 7. Fingerprint plots of intermolecular contacts showing the percentage contributions to the total Hirshfeld surface area.
Crystals 11 01357 g007
Figure 8. Molecular orbitals of the HOMO–LUMO energy levels of both compounds.
Crystals 11 01357 g008
Figure 9. The experimental UV–vis spectra of CH-ClF and CH-FF.
Crystals 11 01357 g009
Figure 10. J-V curves for DSSCs of the reported compounds under irradiance.
Crystals 11 01357 g010
Table 1. Crystallographic collection and refinement data for compounds CH-ClF and CH-FF.
ParametersCH-ClFCH-FF
CCDC deposition numbers15213811521383
Molecular formulaC15H10ClFOC15H10F2O
Molecular weight260.68244.23
Crystal systemMonoclinicMonoclinic
Space groupP21P21/c
a11.4052 (10)11.735 (2)
b3.9037 (3)3.9383 (8)
c13.8077 (12)25.862 (4)
β/°95.2670 (18)100.794 (4)
V31386.42 (9)1174.1 (4)
Z24
Dcalc (Mg m−3)1.4141.382
Crystal Dimensions (mm)0.57 × 0.20 × 0.090.68 × 0.22 × 0.20
μ (mm−1)0.310.11
Radiation λ (Å)0.710730.71073
F(000)268504
Tmin/Tmax0.8103/0.88350.8068/0.9393
Reflections measured13,23612,518
Ranges/indices (h, k, l)h = −16→16
k = −5→5
l = −19→19
h = −16→16
k = −2→5
l = −36→36
θ limit (°)1.5–30.22.2–30.0
Unique reflections36163430
Observed reflections (I > 2σ(I))26641823
Parameters163163
R1 [a], wR2 [b] [I ≥ 2σ(I)]0.038/0.110i0.048/0.170ii
Goodness of fit [c] on F21.051.03
Rint0.0290.037
Largest diff. peak and hole, e/Å−30.21 and −0.130.15 and −0.15
[i] w = 1/[σ2(Fo2) + (0.0525P)2 + 0.0304P], [ii] w = 1/[σ2(Fo2) + (0.074P)2 + 0.0988P], where P = (Fo2 + 2Fc2)/3; [a] R = Σ||Fo| − |Fc||/Σ|Fo|, [b] wR = {wΣ(|Fo| − |Fc|)2/Σw|Fo|2}1/2, [c] GOF = {Σw(|Fo| − |Fc|)2/(n–p)}1/2, where n is the number of reflections and p the total number of parameters refined.
Table 2. Summary of the IR vibrational band of CH-ClF and CH-FF.
Functional GroupsWavenumber Frequency (cm−1)
CH-ClFCH-FF
vC = O1684.01683.5
vC = C1596.01683.0
vC—C1055.51055.5
vC—Cl691.0506.0
vC—F1154.51155.0
Table 3. Selected bond lengths and angles.
CompoundCH-ClFCH-FF
ExperimentalDFTExperimentalDFT
Bond length (Å)
C3—F11.360 (3)1.3521.357 (18)1.352
C7—O11.212 (3)1.2241.219 (17)1.224
C6—C71.494 (3)1.5011.484 (2)1.501
C7—C81.477 (3)1.4861.478 (2)1.486
C8—C91.334 (3)1.3441.312 (2)1.345
C9—C101.458 (3)1.4631.458 (2)1.462
C14—Cl11.742 (2)1.759--
C12—F2--1.357 (2)1.355
Bond angle (°)
O1—C6—C7120.50 (2)119.85120.26 (14)119.86
O1—C7—C8120.90 (2)121.07120.06 (14)121.15
C1—C6—C7118.47 (19)117.52118.67 (13)117.58
C5—C6—C7123.54 (19)123.83123.19 (13)123.73
C7—C8—C9120.60 (2)120.21122.41 (14)120.26
C8—C9—C10127.50 (2)127.91128.04 (15)127.82
C9—C10—C11119.00 (2)118.63122.19 (14)122.92
C9—C10—C15122.28 (19)122.90119.89 (15)118.60
Torsion angle (°)
C1—C6—C7—O17.3 (4)9.2−6.0 (3)−11.2
C5—C6—C7—O1−171.2 (3)10.8173.13 (17)167.61
O1—C7—C8—C96.9 (4)3.3−7.5 (3)−4.2
C6—C7—C8—C9−173.8 (2)−177.4172.78 (16)176.68
C7—C8—C9—C10−179.5 (2)−179.3−179.33 (16)179.03
C8—C9—C10—C11170.5 (2)−179.7−8.9 (3)−1.6
C8—C9—C10—C15−9.5 (4)0.3171.66 (18)178.47
Table 4. Hydrogen bond geometry (Å, °).
CompoundBond
D—H⋯A
Bond Length, (Å)Angle
D—H⋯A (°)
D—HH⋯AD⋯A
CH-FFC2—H2A⋯O1 (i)0.932.583.464 (2)158
C13—H13A⋯F1 (ii)0.932.553.422 (2)157
Symmetry codes: (i) −x + 1, y + 1/2, −z + 3/2; (ii) −x, −y − 1/2, z − 1/2.
Table 5. Photovoltaic parameters summary of the DSSCs performance.
CompoundCurrent Density,
Jsc (mA/cm2)
Open Circuit
Voltage, Voc
(mV)
Fill Factor,
FF (%)
Efficiency, η
(%)
CH-ClF0.02449270.20.00832
CH-FF0.08658072.80.03632
N7190.58960973.80.26470
No Sensitizer0.0025423.90.00002
Publisher’s Note: MDPI stays neutral with regard to jurisdictional claims in published maps and institutional affiliations.

