Article

The Crack Angle of 60° Is the Most Vulnerable Crack Front in Graphene According to MD Simulations

1
Computer Engineering Department, King Fahd University of Petroleum and Minerals, Dhahran 31261, Saudi Arabia
2
Physics Department, King Fahd University of Petroleum and Minerals, Dhahran 31261, Saudi Arabia
3
Interdisciplinary Research Center for Membranes and Water Security, King Fahd University of Petroleum and Minerals, Dhahran 31261, Saudi Arabia
4
Materials Sceince and Engineering Department, King Fahd University of Petroleum and Minerals, Dhahran 31261, Saudi Arabia
5
Hydrogen and Energy Storage Center, King Fahd University of Petroleum and Minerals, Dhahran 31261, Saudi Arabia
6
K.A.CARE Energy Research & Innovation Center at Dhahran, Dhahran 31261, Saudi Arabia
*
Author to whom correspondence should be addressed.
Crystals 2021, 11(11), 1355; https://doi.org/10.3390/cryst11111355
Submission received: 14 September 2021 / Revised: 3 October 2021 / Accepted: 30 October 2021 / Published: 8 November 2021
(This article belongs to the Special Issue Graphene Mechanics (Volume II))

Abstract

:
Graphene is a type of 2D material with unique properties and promising applications. Fracture toughness and the tensile strength of a material with cracks are the most important parameters, as micro-cracks are inevitable in the real world. In this paper, we investigated the mechanical properties of triangular-cracked single-layer graphene via molecular dynamics (MD) simulations. The effect of the crack angle, size, temperature, and strain rate on the Young’s modulus, tensile strength, fracture toughness, and fracture strain were examined. We demonstrated that the most vulnerable triangle crack front angle is about 60°. A monitored increase in the crack angle under constant simulation conditions resulted in an enhancement of the mechanical properties. Minor effects on the mechanical properties were obtained under a constant crack shape, constant crack size, and various system sizes. Moreover, the linear elastic characteristics, including fracture toughness, were found to be remarkably influenced by the strain rate variations.

1. Introduction

Graphene is a two-dimensional (2D) material comprised of sp 2 carbon atoms that are regularly arranged in periodic hexagons, producing a honeycomb lattice structure [1]. Graphene has garnered considerable attention due to its remarkable mechanical and physical characteristics. It plays a significant role in the strengthening of composite materials [2,3,4,5] and is the primary building block of 1D carbon nanotubes and 3D graphite structures [6]. Studying the mechanical characteristics and deformation physics of graphene is thus crucial from a technological point of view due to its potential use in numerous applications. Currently, it is utilized in several electrical, thermal, and mechanical applications [7,8,9].
Several studies on the mechanical properties of graphene have been reported. Recently, theoretical and computational modeling studies have provided significant insights into graphene’s structural fracture and strength-controlling mechanics with both perfect and defective structures [1,10,11,12,13,14,15,16]. In addition, experiments have intriguingly shown the extreme elastic stiffness (elastic modulus of 1 TPa) and intrinsic strength (130 GPa) of pristine monolayer graphene. Thus, it is believed to be one of the strongest materials [17,18]. Its mechanical properties have been extensively investigated [19,20,21,22,23,24,25,26] along with those of hydrogenated graphene and other derivatives [27,28,29,30,31]. Furthermore, studies have shown that the fracture toughness (a measure of a material’s ability to resist fracture) of defective graphene is very low, classifying it as a brittle material that is hence susceptible to breaking [12].
Defects are inevitably introduced during the processing, including fabrication and operation, of practical devices and systems. Hence, regular efforts are made to establish effective methods through which graphene toughness can be improved. A number of studies on the effect of the defect geometry, including cracks, on the mechanical properties of graphene, such as its fracture toughness, have been reported [25,32,33,34]. Crack tips, in general, are wedge-shaped. However, such crack tips have not been well studied, partially due to the complexity of modeling.
In this research, we aim to study the mechanical properties of a single-layer graphene sheet (SLGS) with a triangular crack under various rates of tensile loading. We examined the effect of triangular crack size, crack shape, system size, and strain rate on the mechanical properties of SLGSs by means of the atomic modeling of tensile tests. To gain atomic insights, we used molecular dynamics simulations, which are a powerful tool for various atomic-level large-scale finite-temperature simulations [35]. The rest of the paper is organized as follows: The model and methods are presented in Section 2. The results and discussions are presented in Section 3, followed by the conclusion in Section 4.

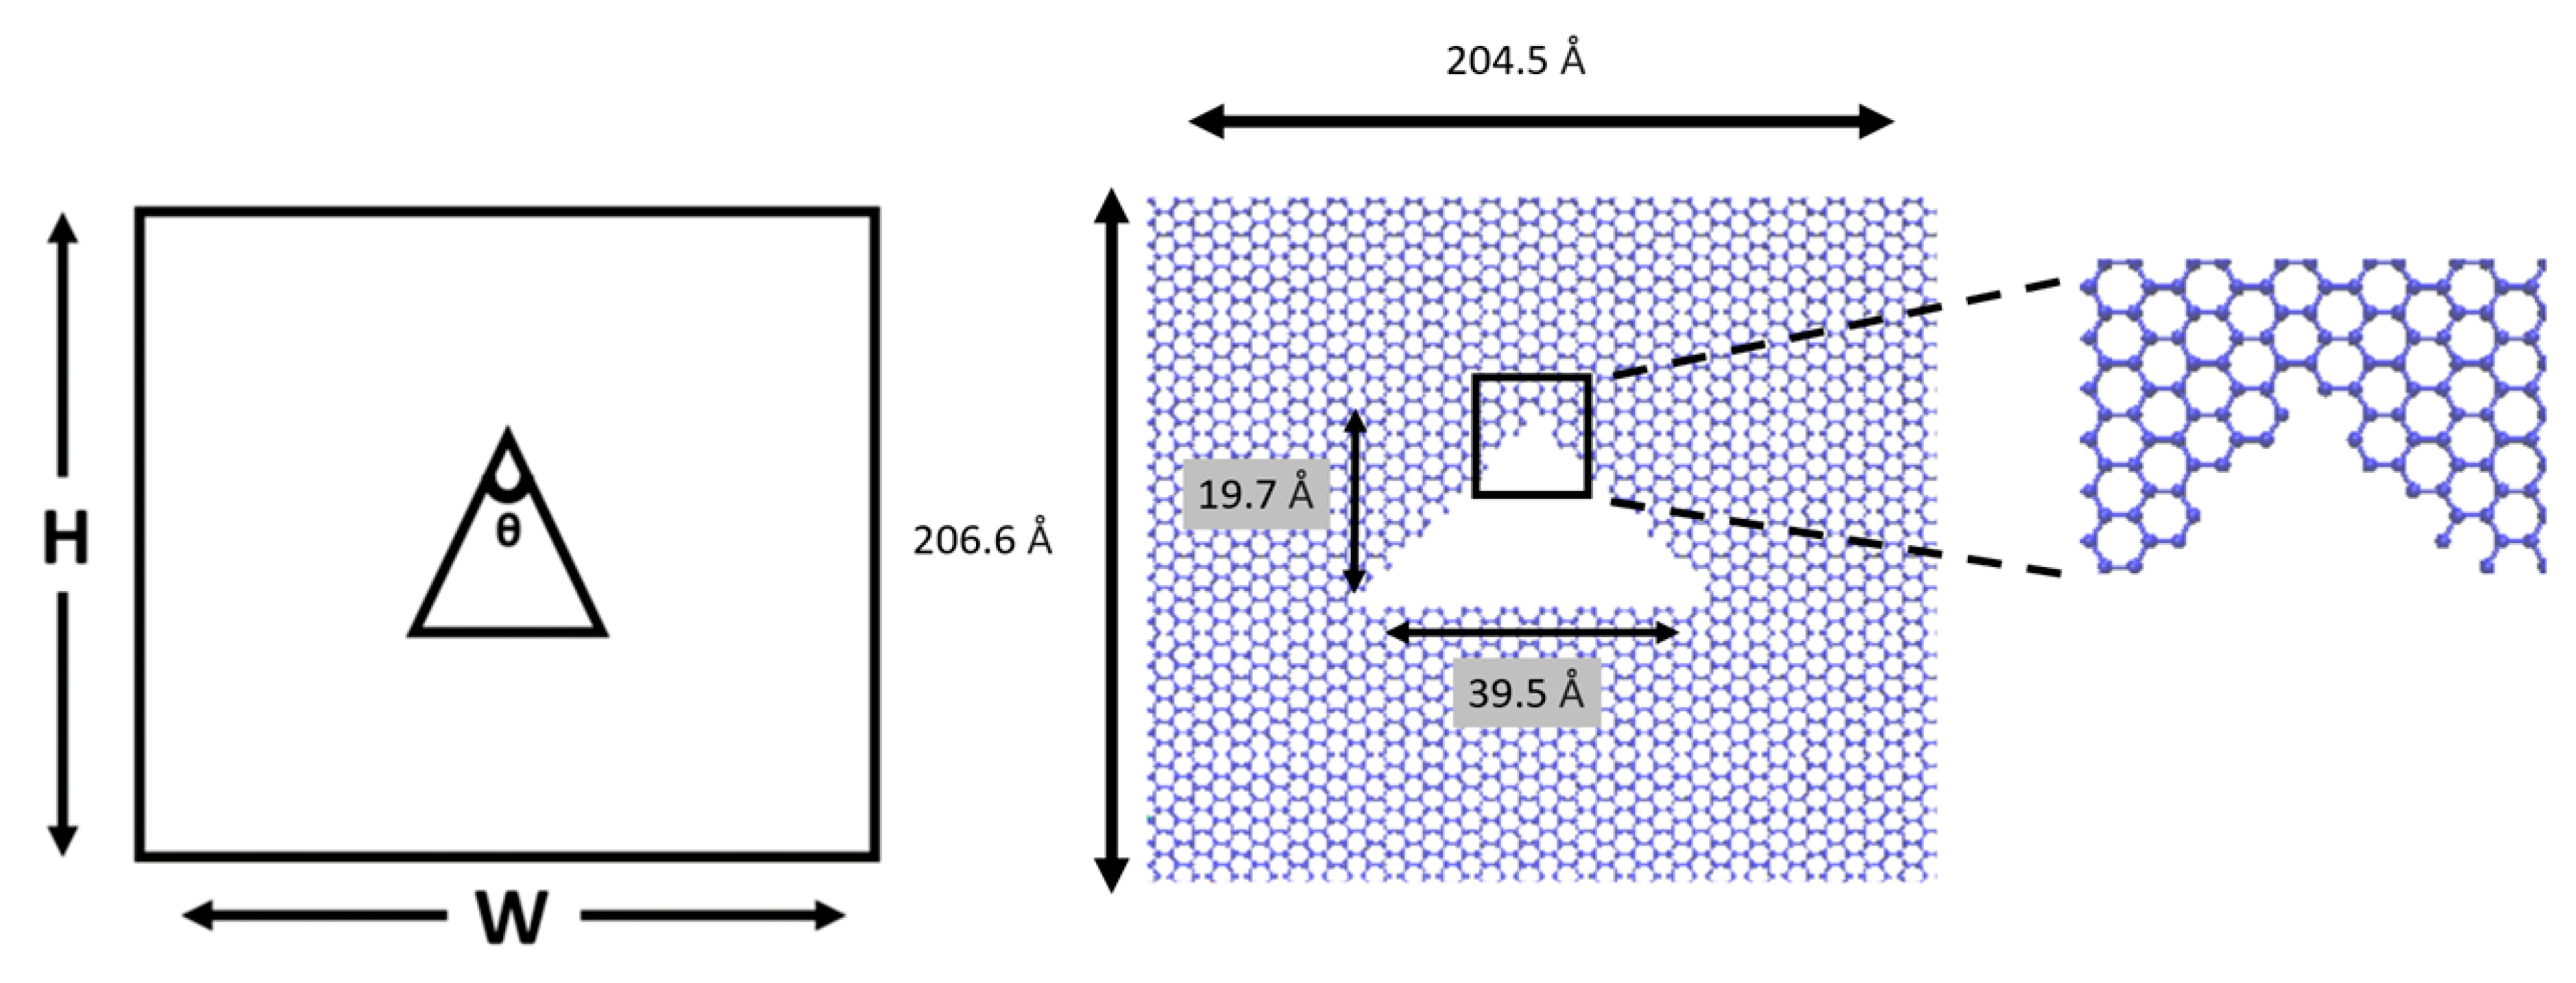
2. Model and Methods

Model: The angular crack front was modeled by the vertex angle of an isosceles triangle-shaped crack embedded in a single layer of graphene. The pre-cracks were obtained by removing carbon atoms in the confined zone of an isosceles triangle, as shown in Figure 1. The example system displayed is the pre-cracked single-layer graphene with the crack shape of a 90° isosceles triangle, which is denoted as Angle90 hereafter for convenience. We examined eight vertex angles: 30°, 36°, 60°, 72°, 90°, 108°, 120°, and 150°. The system size was 20.7 nm × 20.5 nm with 16,128 carbon atoms before the creation of the cracks. The carbon-carbon bond length was 0.142 nm at room temperature.
Besides the shape of the crack front, which is determined by the angle, the aspect ratio is also an important factor affecting the mechanical properties. To investigate the size effect, we created two models and doubled the sizes of both in-plane directions in each case. In one model, we aimed to keep the shape of the isosceles triangle, so the area of the triangle was quadrupled. In the other, we aimed to keep both the size and shape of the isosceles triangle the same so that the area of the triangle crack would be constant while the total system size in the area would be quadrupled. We investigated various defective SLGSs with different crack angles. The details of the removed atoms and the percentage of the defects are summarized in Table 1 for the 8 defective configurations. Figure 1 presents a supercell of an SLGS system used for examining the system size effect.
Method: The mechanical properties were obtained by simulating the uniaxial tensile tests by means of molecular dynamics (MD) simulations. All MD simulations were employed using the large-scale atomic/molecular massively parallel simulator (LAMMPS) package [36]. The force-field that portrays the microscopic interactions amongst carbon atoms in the graphene sheet is the adaptive intermolecular empirical reactive bond order (AIREBO) potential, which allows for the breaking and forming of carbon-carbon covalent bonds, enabling a precise visualization of the atomic interactions within harsh environments, including fracture. This potential is suitable for investigating the mechanical properties of graphene [37,38].
We mimicked ambient conditions by using atmospheric pressure ( 1   a t m ) and a temperature of 300 K, which was kept steady by means of the Nose–Hoover thermostat. For the tensile test, we scaled the deformation using engineering strain. The strain rate was fixed at a certain value during one tensile test. The effect of the strain rate was examined by varying it from 1 × 10 7   s 1 to 1 × 10 10   s 1 .
The simulation time step was set to 1 fs. Prior to applying any mechanical tensile load, we relaxed the system using the isobaric-isothermal (constant pressure and temperature) ensemble (NPT ensemble) to release the residual stress. After relaxing the system, uniaxial tensile load was applied along the horizontal (armchair) direction. The stress–strain curves were obtained from the simulation. Then, by analyzing the output data, we could compute the mechanical properties, including the Young’s modulus, ultimate tensile strength, fracture toughness, and fracture strain. The stresses were converted to the unit of GPa by assuming the thickness of a single layer of graphene as 0.34 nm as a convention [37,38]. The visualization was achieved by using the OVITO package [39].

3. Results and Discussion

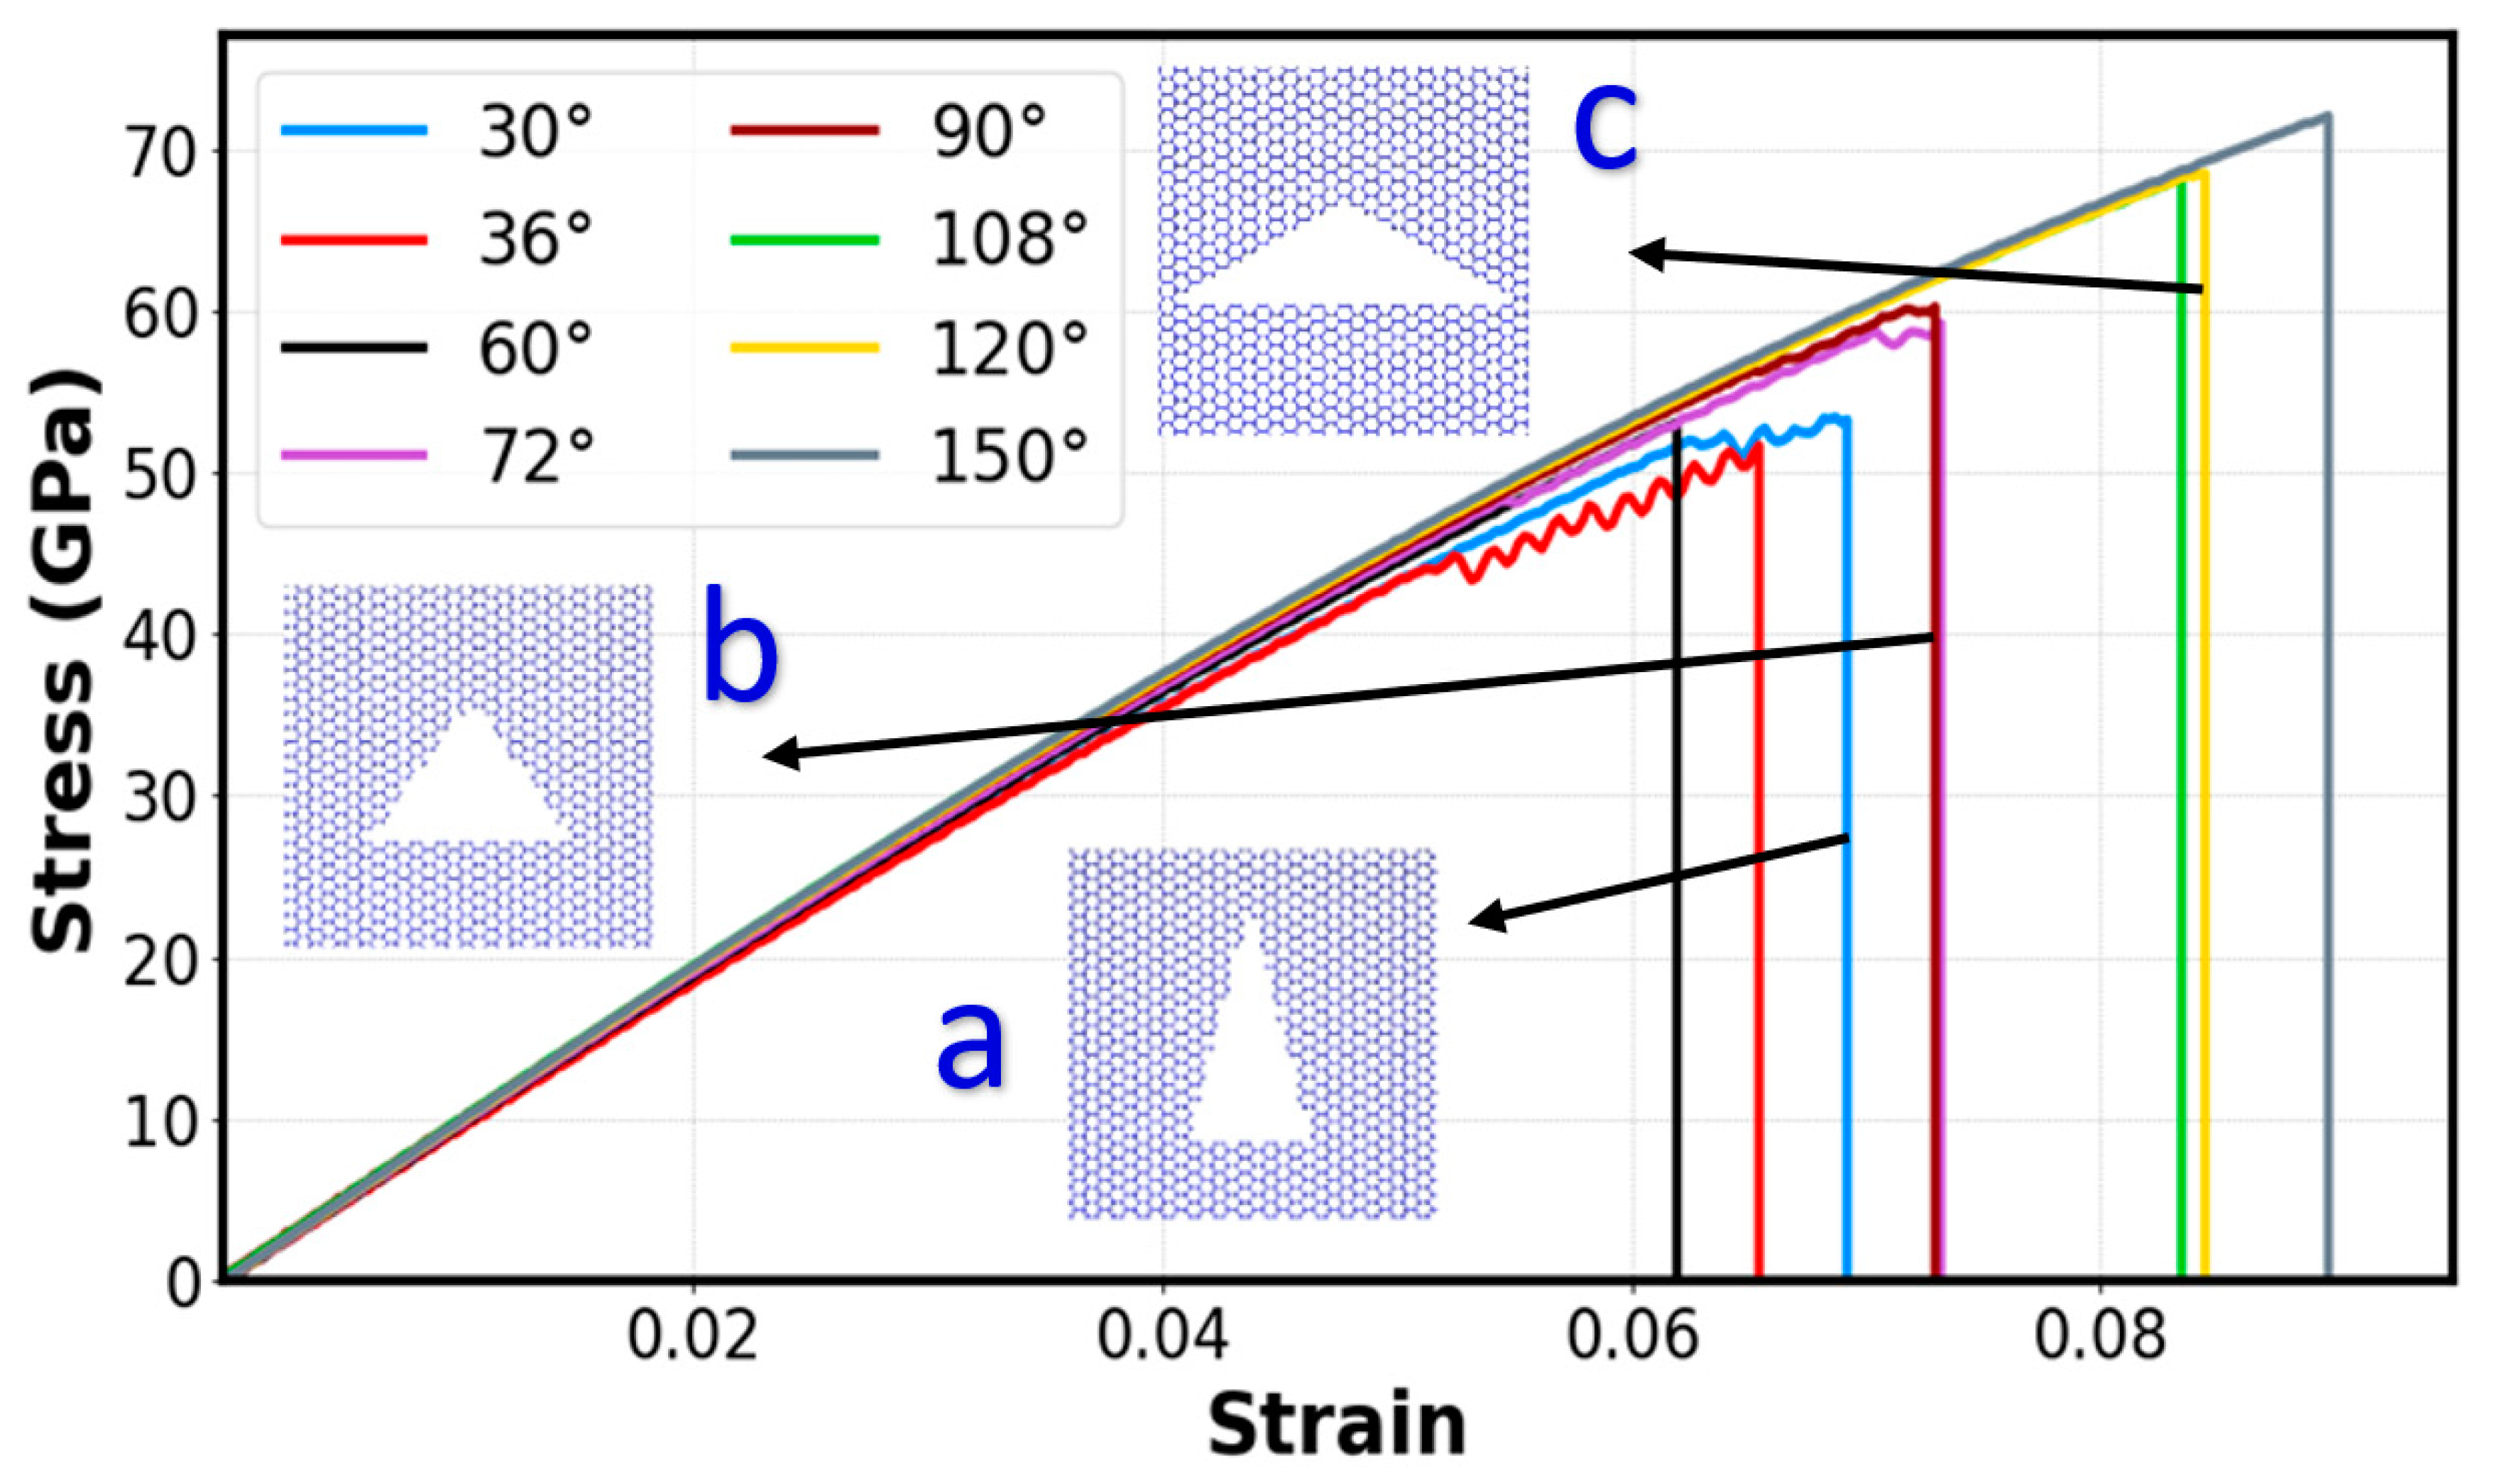
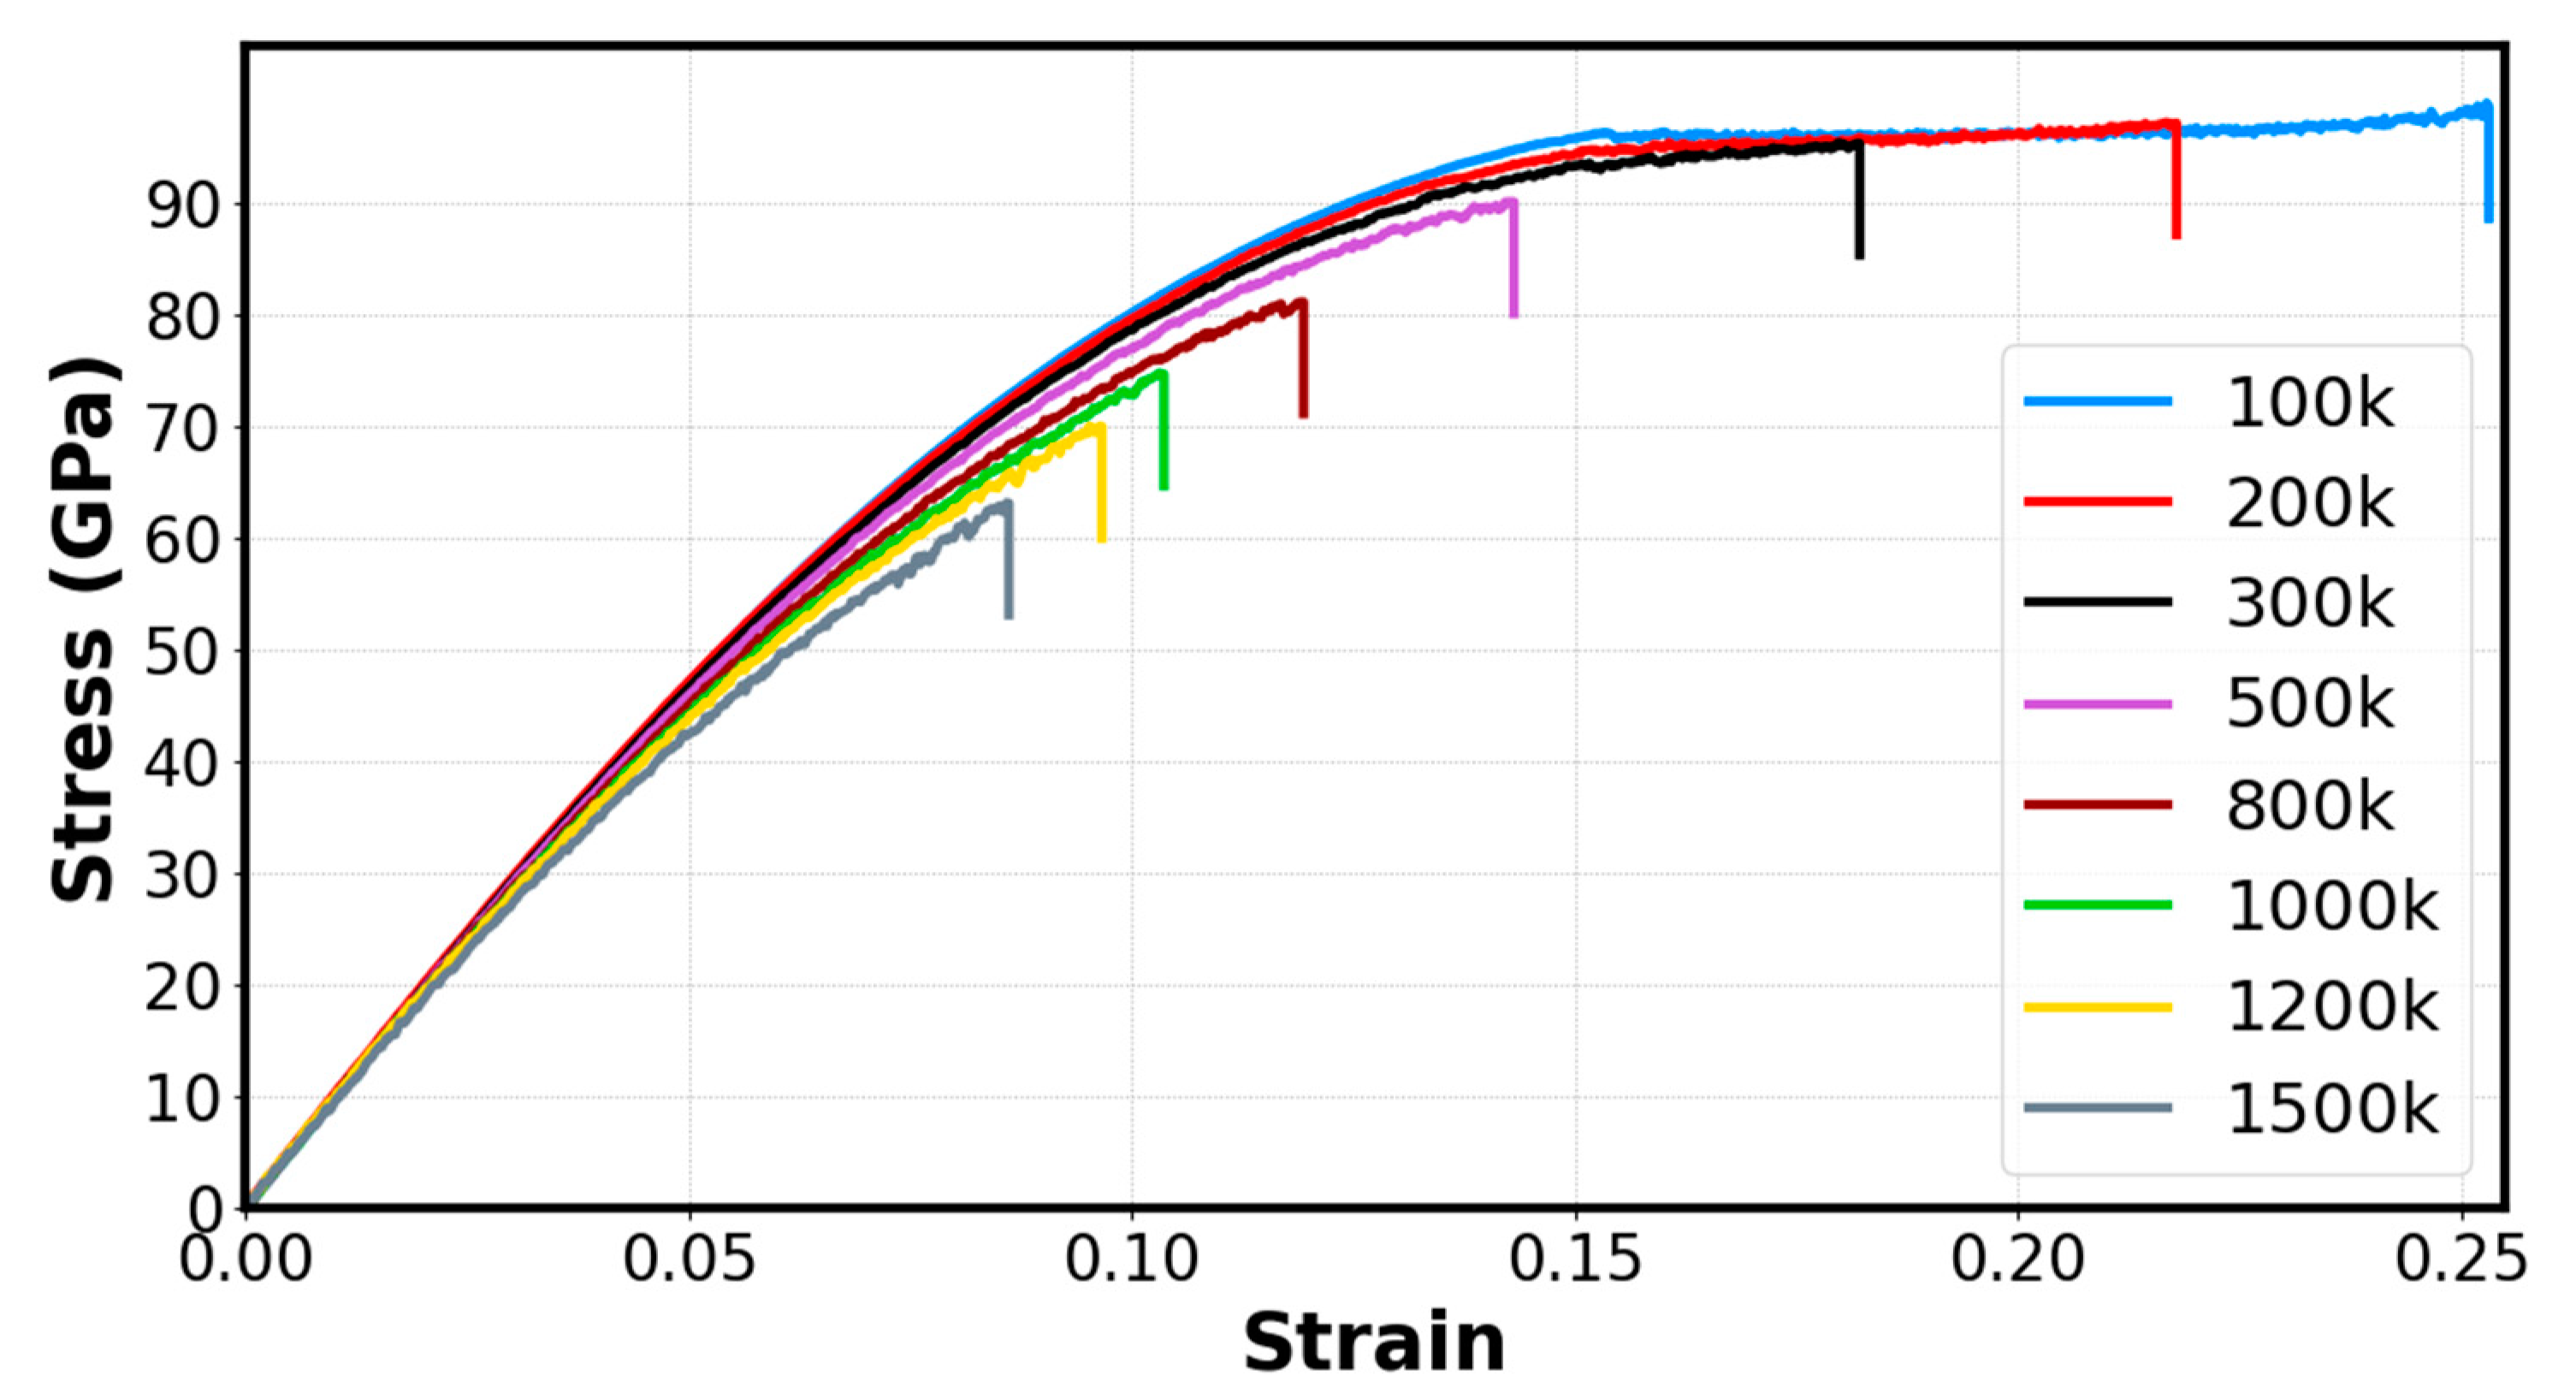
3.1. Stress–Strain Relationship
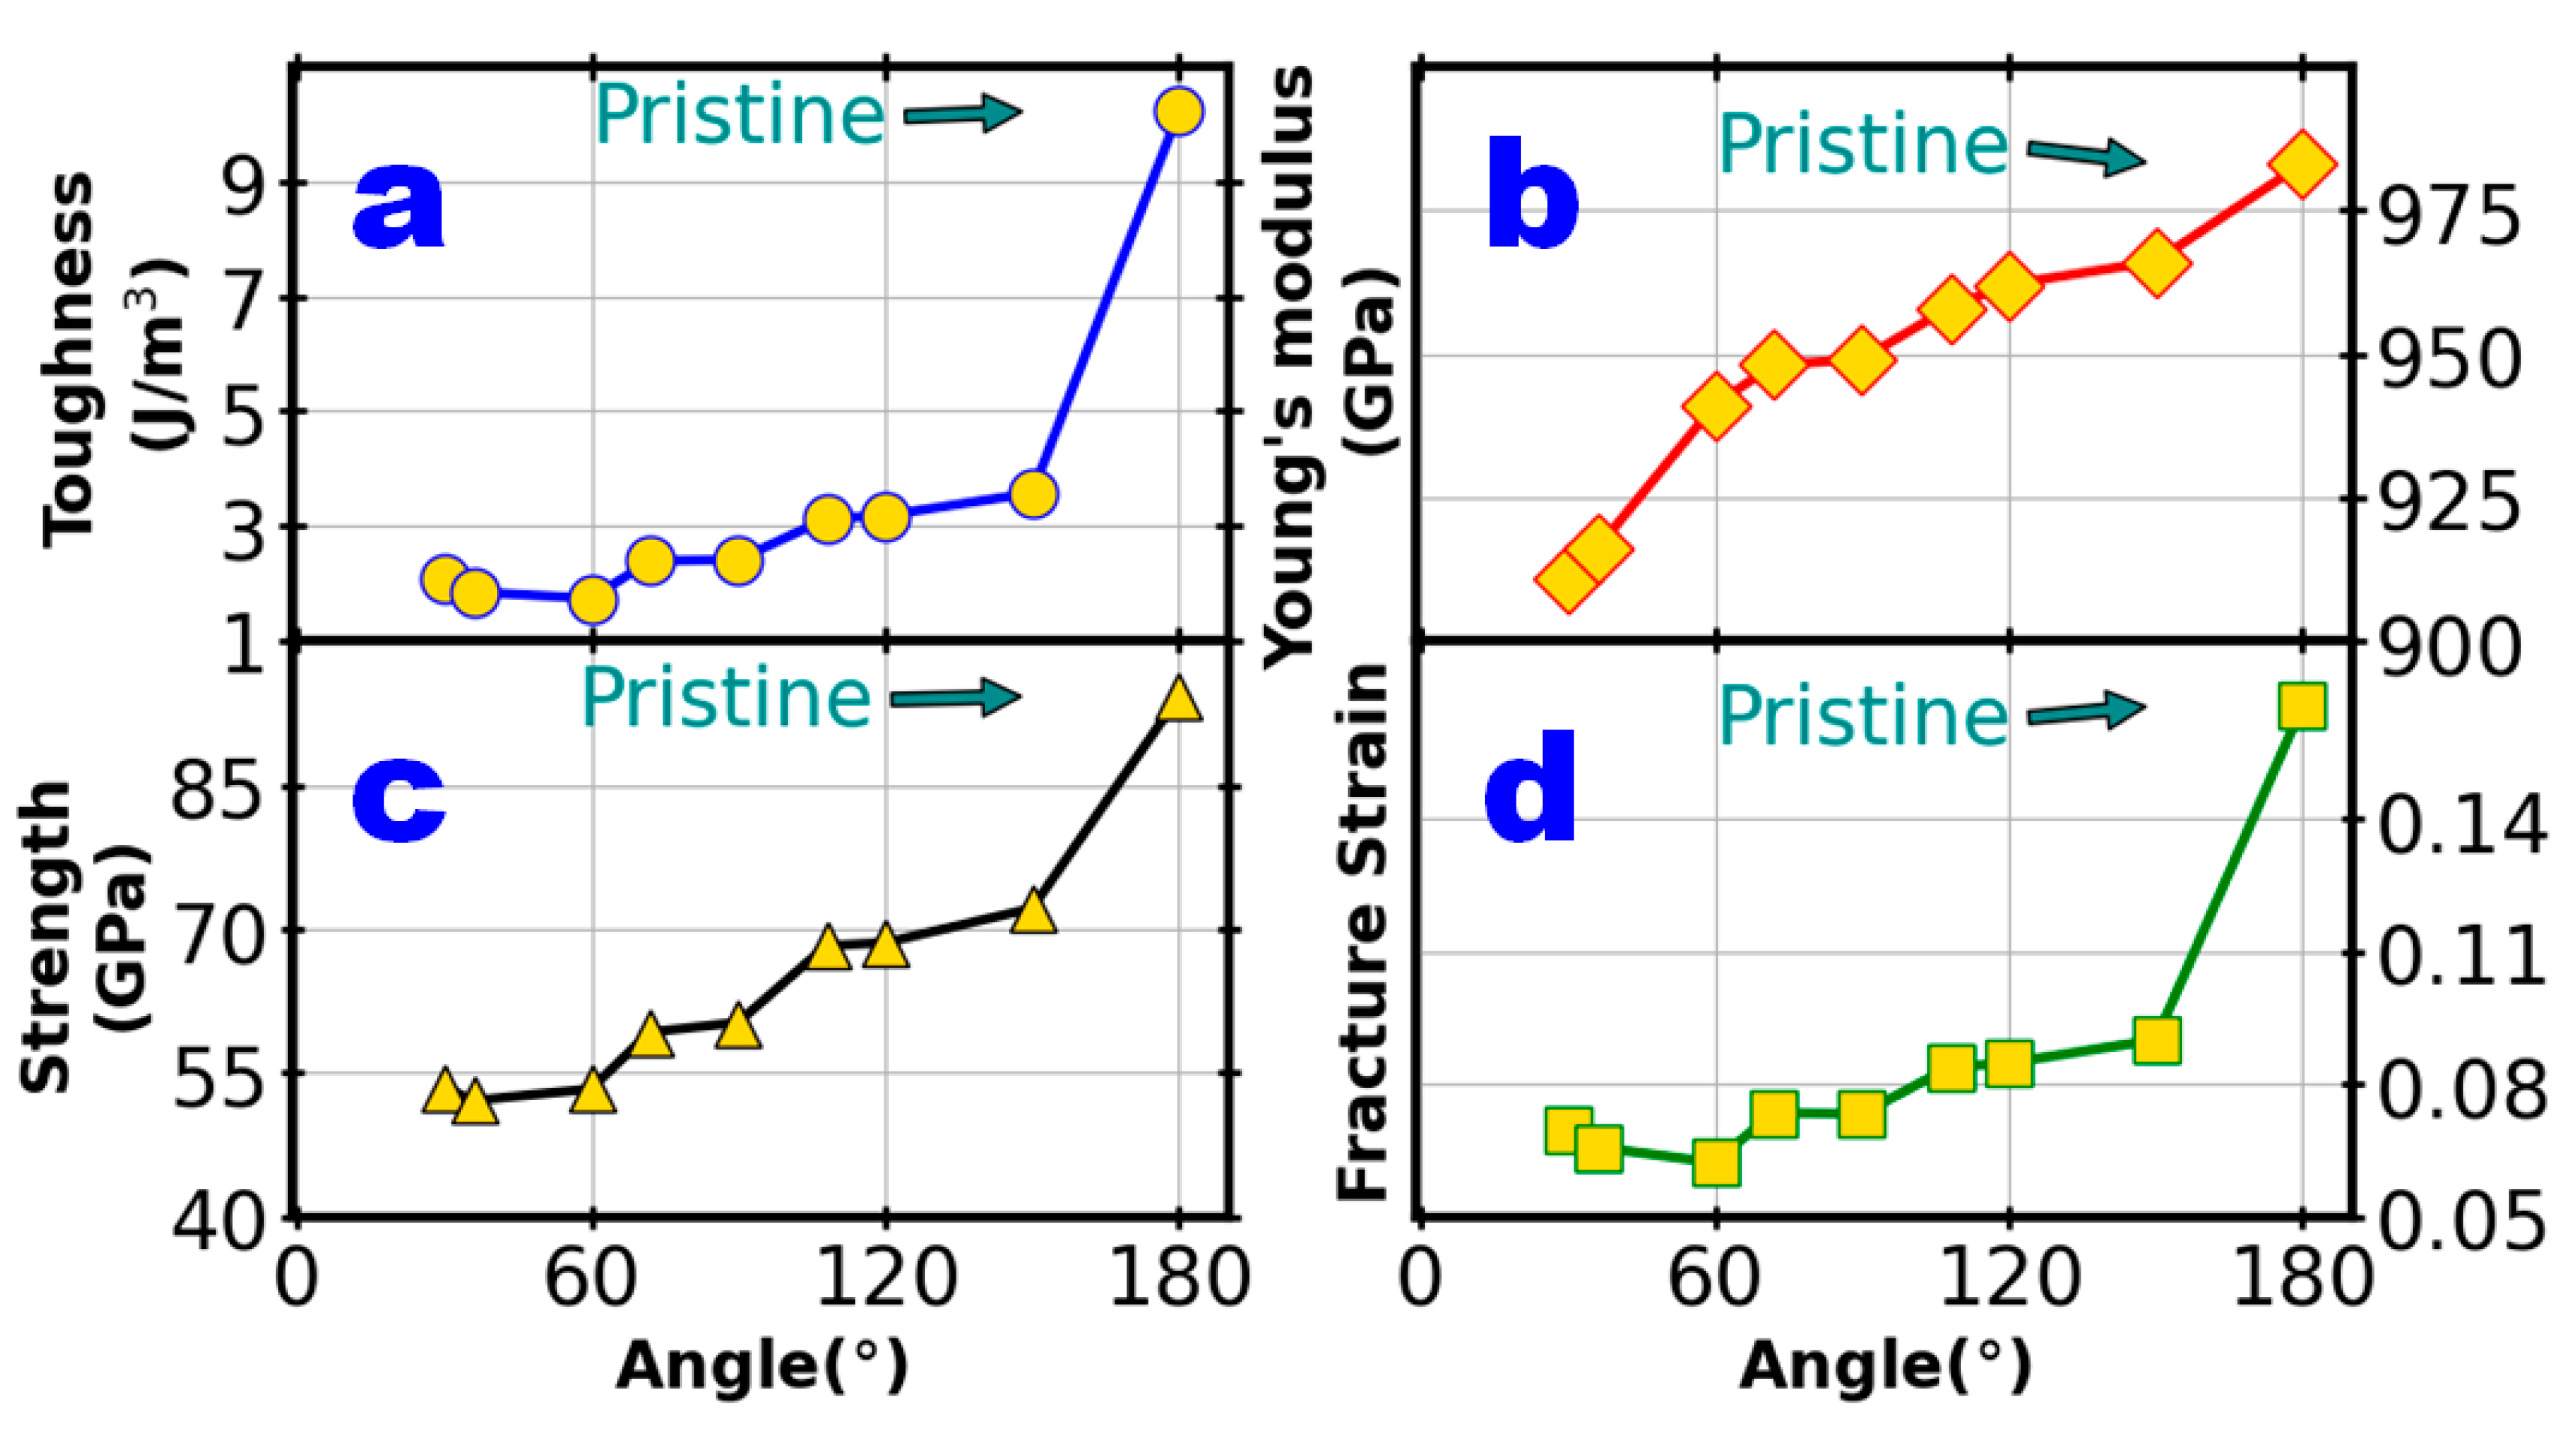
The stress–strain relationship plays a key role in the characterization of the mechanical properties of materials. The stress–strain coupling is obtained from tensile load application tests. In this study, the tensile load was uniaxially applied to the simulation samples along the armchair direction. The Angle90 sample system is illustrated in Figure 1. We examined eight vertex angles: 30°, 36°, 60°, 72°, 90°, 108°, 120°, and 150°. The results of the stress–strain curves are displayed in Figure 2.
The stress–strain curves of the eight systems shared the same pattern: initially, the stress values rose linearly with the strain, reaching tensile strength and then fracturing abruptly. This behavior indicates that all eight systems are brittle, which is consistent with our observation using visualization analysis. Evidently, the Angle90 cracked sample outperformed all the evaluated samples in terms of its tested mechanical properties. The relative values of Young’s modulus, strength, toughness, and fracture strain for the Angle90 structure were 949 GPa, 60.2 Gpa, 2.4 J · m 3 , and 7.3%, respectively. The obtained value for Young’s modulus was in line with the one reported for multi-layer graphene assemblies, but the fracture strength soared to a higher value [40]. The fracture strength may also be compared to the strength of graphene at room temperature [41]. Both the Young’s modulus and fracture strength values were found to be similar to those obtained for multi-walled carbon nanotubes [42].

3.2. Angle Effect

We investigated the vertex angle effect on the mechanical properties of a triangular crack in graphene. We examined eight vertex angles ranging from 30° to 150° for isosceles-triangular pre-cracks and compared the results with those of pristine graphene. The stress–strain curves for the eight systems are displayed in Figure 2. For the 60° sample, the abrupt drop in stress at an approximately 0.061 strain marks mechanical failure. The corresponding stress and strain are the fracture stress and fracture strain, respectively. The maxima in the stress–strain curves refer to the ultimate tensile strength of the system, which is also called the tensile strength or material strength by convention. The tensile strength represents the limit beyond which failure starts to occur. The corresponding ultimate tensile strain defines the flexibility of the deformed mechanical systems. Because these systems are all brittle, the ultimate tensile strength is coincident with the fracture stress and the ultimate tensile strain is the same as the fracture strain. The toughness is defined by the area between the stress–strain curve and the strain axis up to the fracture strain.
The tensile strength, fracture strain, Young’s modulus (GPa), and toughness ( J · m 3 ) can be obtained from the stress–strain relationship, as illustrated in Figure 3, as a function of the vertex angles. For comparison, the tensile loading was set to the same loading circumstances (strain rate, pressure, temperature) as the eight systems with various vertex angles. The pristine graphene (represented as 180°) in Figure 3 is the ideal system without pre-cracks. The results of fracture toughness (Figure 3a) and fracture strain (Figure 3d) have illustrated that the vertex angle of 60° is the most vulnerable crack front with the lowest fracture toughness and fracture strain.
In this study, the numeric results of the Young’s modulus of pristine graphene are in good agreement with previously reported experimental data [43,44]. Moreover, these results are compatible to some extent with values that were theoretically deduced in [45,46,47,48,49,50,51,52,53,54,55]. The existing discrepancies in the results are mainly due to the different potentials used for the tensile simulations with a possible variety of simulation conditions. The mechanical properties of the pristine structure demonstrated by our model are comparable to results from past studies. Hence, this validates our system and gives perspective to the results obtained from the pre-cracked structures.
As is evident from the MD simulation results and taking the Angle90 system as a reference, the Angle36 system exhibits the lowest tensile strength. The fracture stress of the Angle36 system reached its failure strain (6.6%) with the least amount of applied stress (52.1 GPa) compared to the other tested cracks. On the other hand, the 150° crack had a minor effect, as it could withstand a relatively large amount of stress (72.1 GPa) until it reaches its failure strain (9.9%). Moreover, when it came to fracture toughness and strain, the 60° crack had the lowest values (1.7 J · m 3 and 6.2 % , respectively). Furthermore, the least stiff SLGS was the one with a 30° crack showing a Young’s modulus value of 911 GPa. When the crack angle exceeds 70°, the behavior of the tested mechanical properties tends, to a good approximation, to evolve linearly and, intriguingly, the properties for some of the crack angles are the same. For instance, the mechanics caused by the 72° crack behave approximately the same as those for the 90° crack, and a similar situation can be obtained for the 108° and 120° cracks. It is convenient to conclude that the sample with a 150° crack outperforms all the other tested simulation sample in all other investigated properties (toughness, stiffness, etc.), as demonstrated in Figure 3. Evidently, there is a general trend of rise of each of our mechanical properties with increasing angles as the crack shape transforms from a triangle to the more traditional straight crack shape. This seems to imply that graphene is more resistant to fracturing as we approach a straight crack configuration as opposed to the triangle configuration when the load is applied along the crack length direction. In general, the various fracture properties examined in this study are comparable to other defect geometry (including cracks) -influenced properties [11,56,57,58,59,60,61,62,63].

3.3. Size Effect

3.3.1. System Size Effect (Same Crack Size but Different System Size)

Upon the application of periodic boundary conditions to the defective graphene system, the self-image interaction of defects (with its periodic images), caused by the long range of the elastic field, is inevitable. Consequently, the size has a noticeable influence on the simulation results. As an attempt to reduce the artificial effects in our MD simulations, we constructed a simulation box that is large enough. Here, we thoroughly examined a 90° crack system by testing several simulation parameters (namely, system size and strain rate) and analyzed the corresponding outcomes. As for the size of the system, it was studied by considering two supercells that were composed of 4 × 4 and 8 × 8 (409.041 Å × 413.28 Å) unit cells, respectively. The original number of carbon atoms in each pure (crack-free) graphene system was 16,128 and 64,512 atoms, respectively.
The results of the stress–strain relationships demonstrating the size effects are illustrated in Figure 4. The red and blue curves represent the stress–strain relationships for 4 × 4 and 8 × 8-cracked SLGSs under a constant crack size. The simulation results demonstrate that the impact of the crack size on the fracture toughness of cracked SLGSs can be comparatively disregarded. The 8 × 8 size system has a critical stress of 63.2117 GPa, which is only 4.9% different from the smaller crack size system with a critical stress of 60.2332 GPa. These findings suggest that the system size effect on sizes larger than a 4 × 4 configuration is negligible compared to the fracture toughness and is in line with other graphene systems [64,65].
For the better viewing of the fracture of the triangle-shaped crack, we have color-coded the atomic configurations according to the x-component atomic stress. We used the system with the size of 4 × 4 (or 20.7 nm × 20.5 nm with 16,128 lattice sites). The snapshots of the x-component atomic stress distributions of the system just before the failure are displayed in Figure 4b. The color map is in the middle. For direct comparison, the stress distribution of the system after the failure is shown in Figure 4c. One can tell that the atomic stress is highly concentrated around the vertex angle of the tip of the isosceles right triangle. The highly concentrated atomic stress is the driving force for fracture propagation, as expected.

3.3.2. Crack Size Effect (Same System Size but Different Crack Size)

As shown in Figure 4, the red and black curves represent the stress–strain relationships for two cracked SLGSs of equal system sizes (8 × 8) when the shape of the cracks is preserved, whereas the crack area is changed. In contrast to the 4 × 4 size system, the system of inflated size (black curve) has an equivalent percentage (0.981%) of carbon atoms lost to the original number of existent atoms. Consequently, a drastic change in the crack size takes place and evidently the critical stress changes by a large margin. The critical stress of the system is approximately 50 GPa, which is less than that of the unchanged crack size 8×8 system due to the smaller mass density. As compared to the 4 × 4 system, this represents a considerable drop in performance by 16.7%.

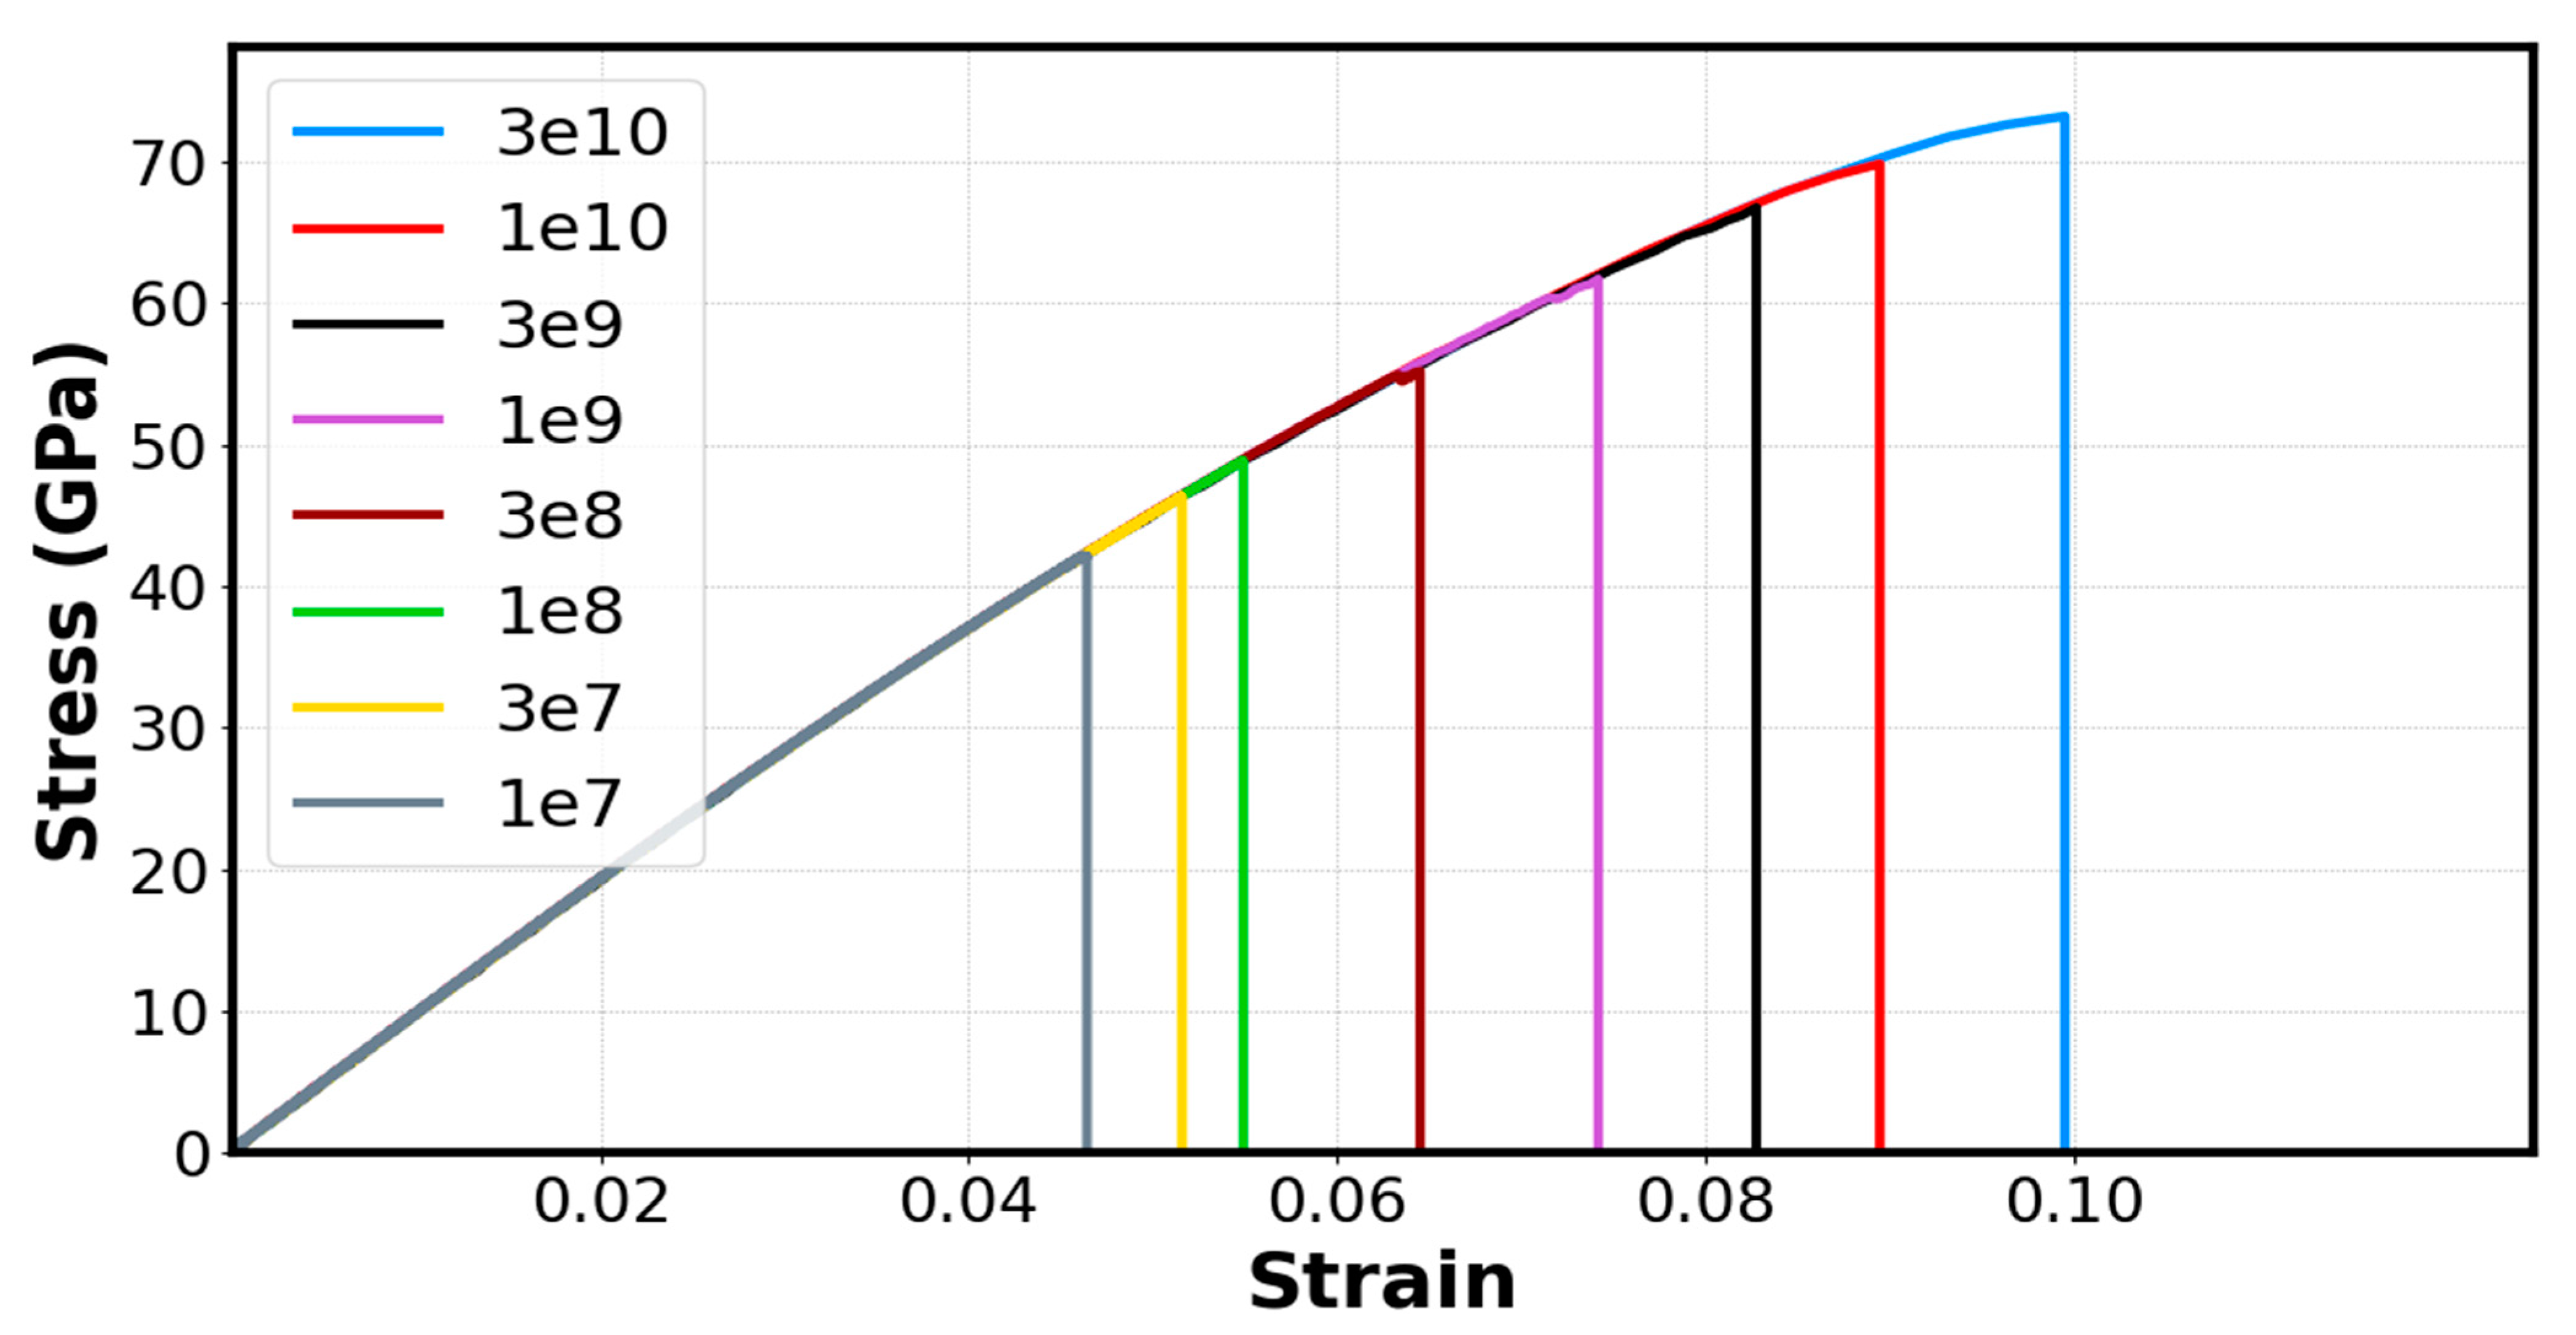
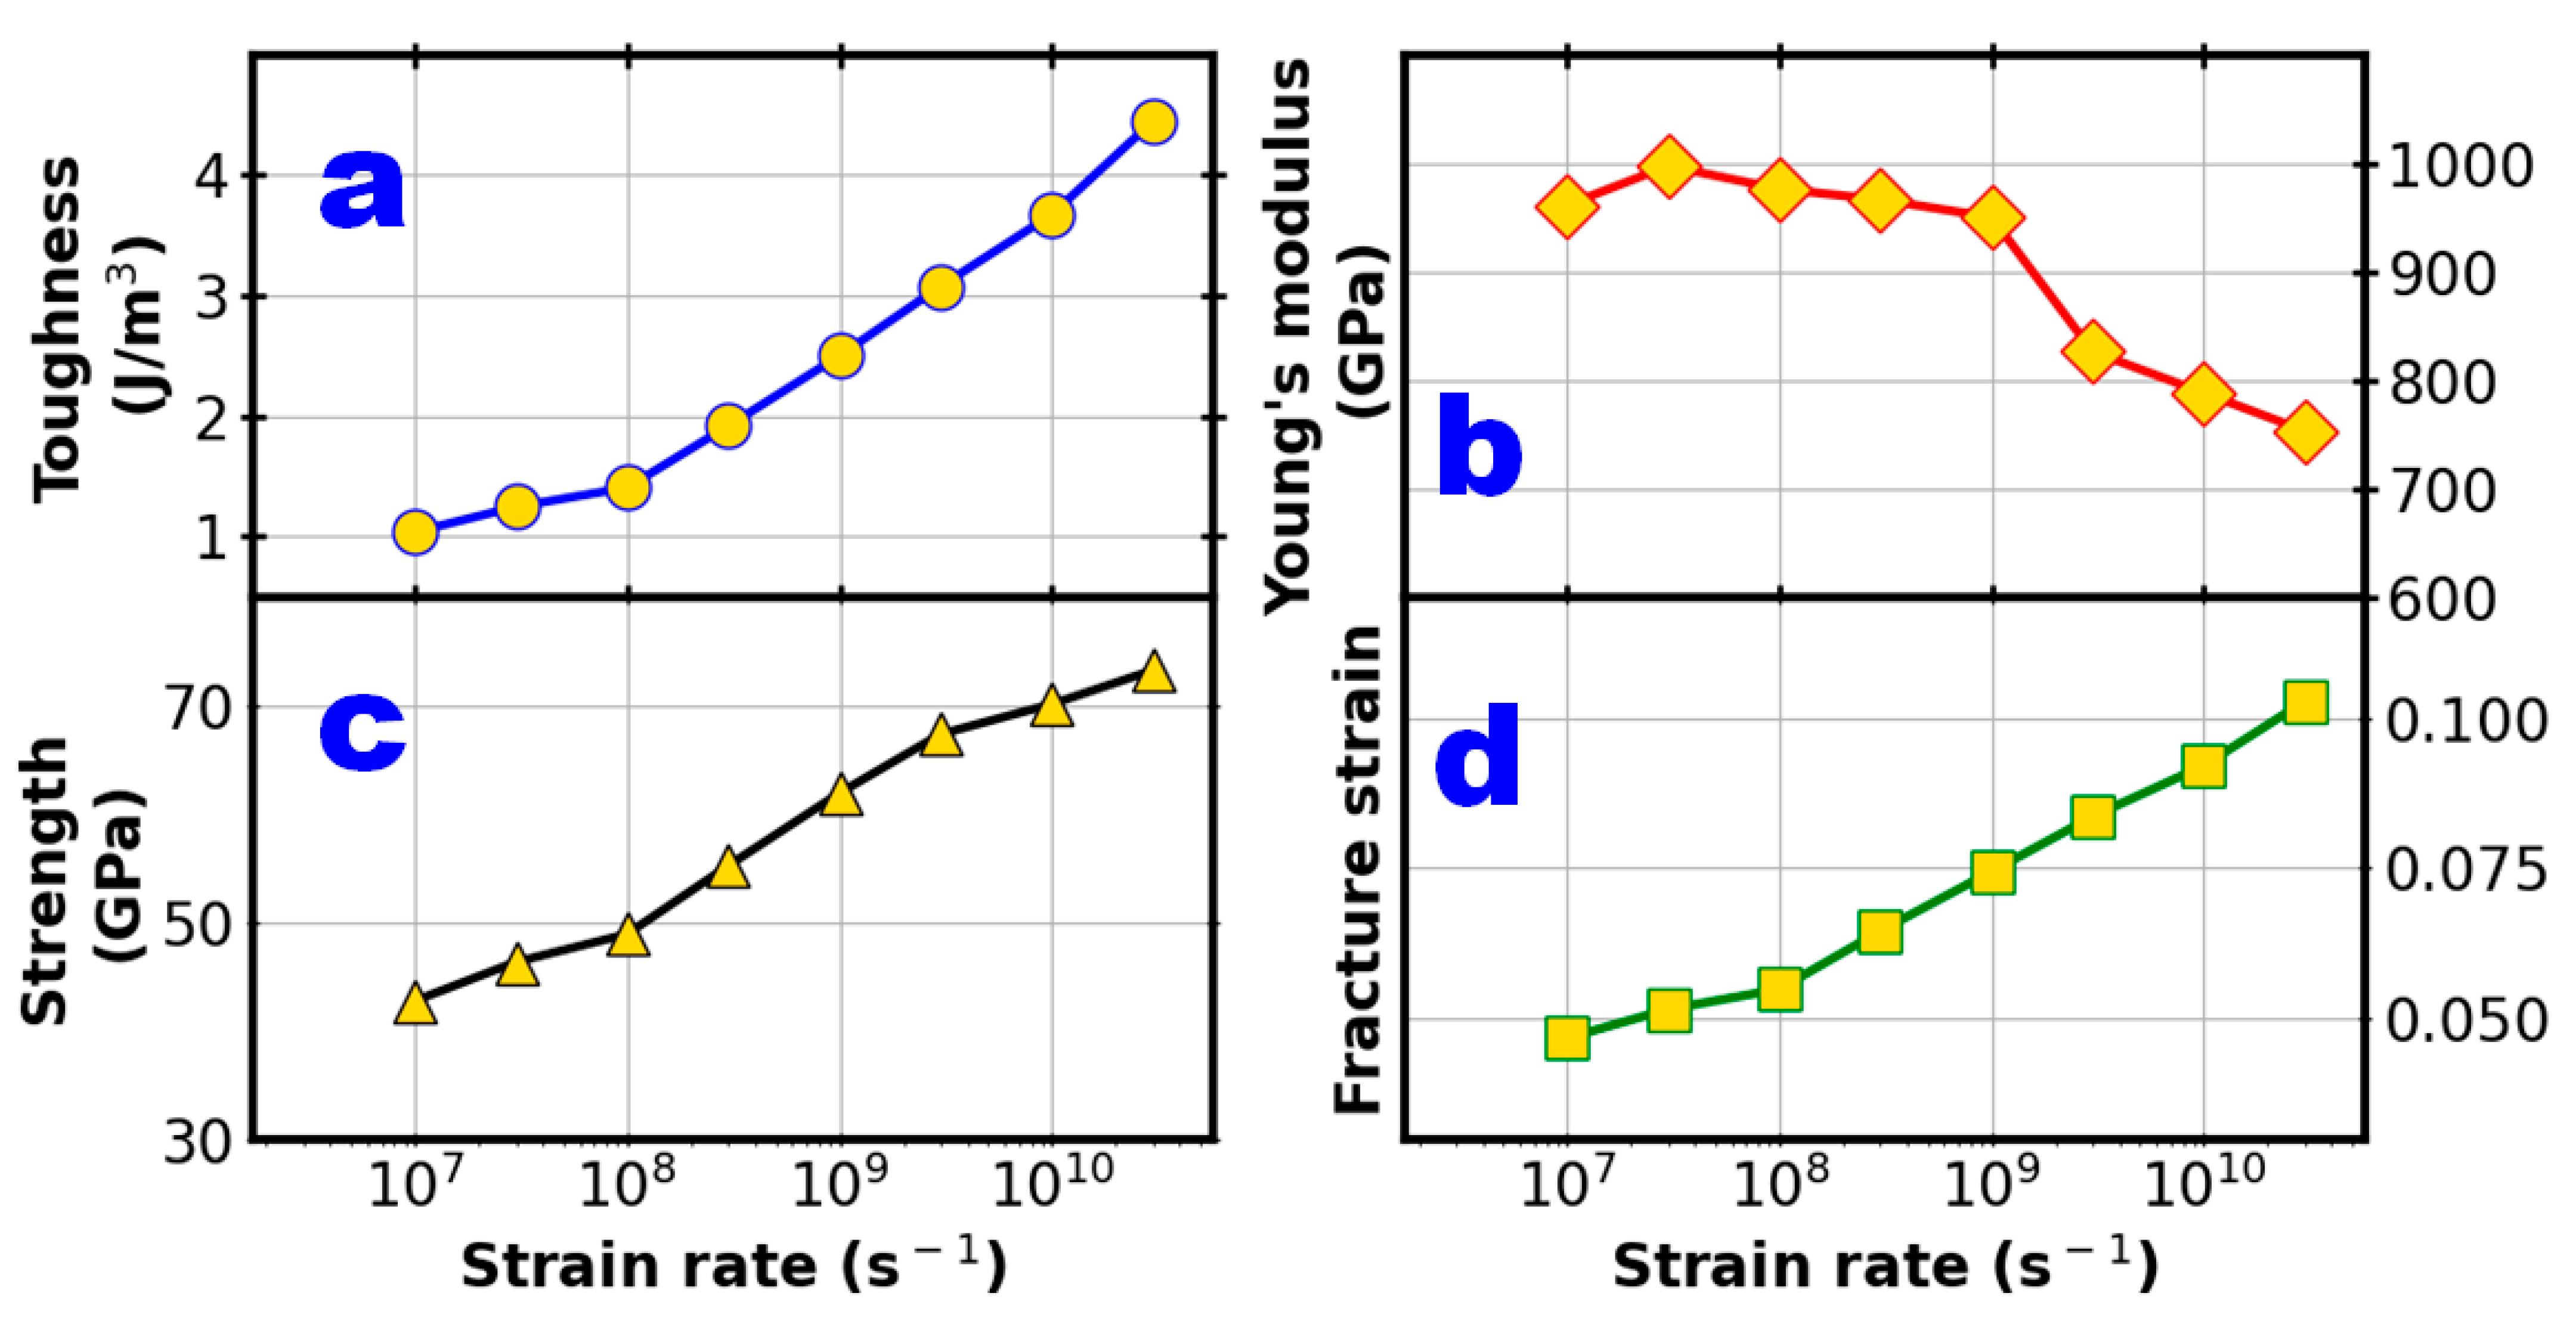
3.4. Strain Rate Effect

The strain rate has a powerful impact on the mechanical properties. It can profoundly affect the fracture toughness, as it takes time for the system to react to the applied load. We ran the MD simulation for eight strain rates of different orders of magnitude. The rates used were larger than those used in experimental studies because of the computational resource limitation. Stress–strain relationship curves used for a 90° cracked system are depicted in Figure 5. The strain rates we used are 1 × 10 7   s 1 , 3 × 10 7   s 1 , 1 × 10 8   s 1   ,   3 × 10 8   s 1 ,   1 × 10 9   s 1 ,   3 × 10 9   s 1 ,   1 × 10 10   s 1 ,   and   3 × 10 10   s 1 . Despite the large gap among the strain rates, the results showed that the rates have considerable effects on the linear elastic characteristics of the material. This certainly reflects the fact that the material had only a short time to respond to the mechanical stimuli (adiabatic conditions) at such high strain rates. At these rates, one may compare the results to those of previous intensive studies. Upon comparison with the stress–strain MD studies reported in [64], our defective SLGSs can evidently demonstrate an enhanced fracture toughness compared to that of twisted bilayer graphene at certain misorientation angles under similar strain rates.
Figure 6 illustrates the strain rate dependence of the fracture stress, strain, Young’s modulus (GPa), and toughness ( J · m 3 ). A monotonic increasing trend in the strength, toughness, and strain of a 90° cracked SLGS is shown as the strain rate rises. However, the Young’s moduli start to decrease beyond the rate of 109, indicating the lesser need for effective stress at these strain rates. Moreover, the mechanical properties seem to converge as the strain rate decreases to a more realistic value and the system is given sufficient time to react to the applied tensile load. At room temperature and high strain rates ( 10 9   s 1 ) , the fracture strength can be fairly compared to the values reported in [66], whereas it is substantially enhanced when compared to the strength of polycrystalline graphene at various temperatures (including room temperature) and analogous range strain rates, as reported in [67].

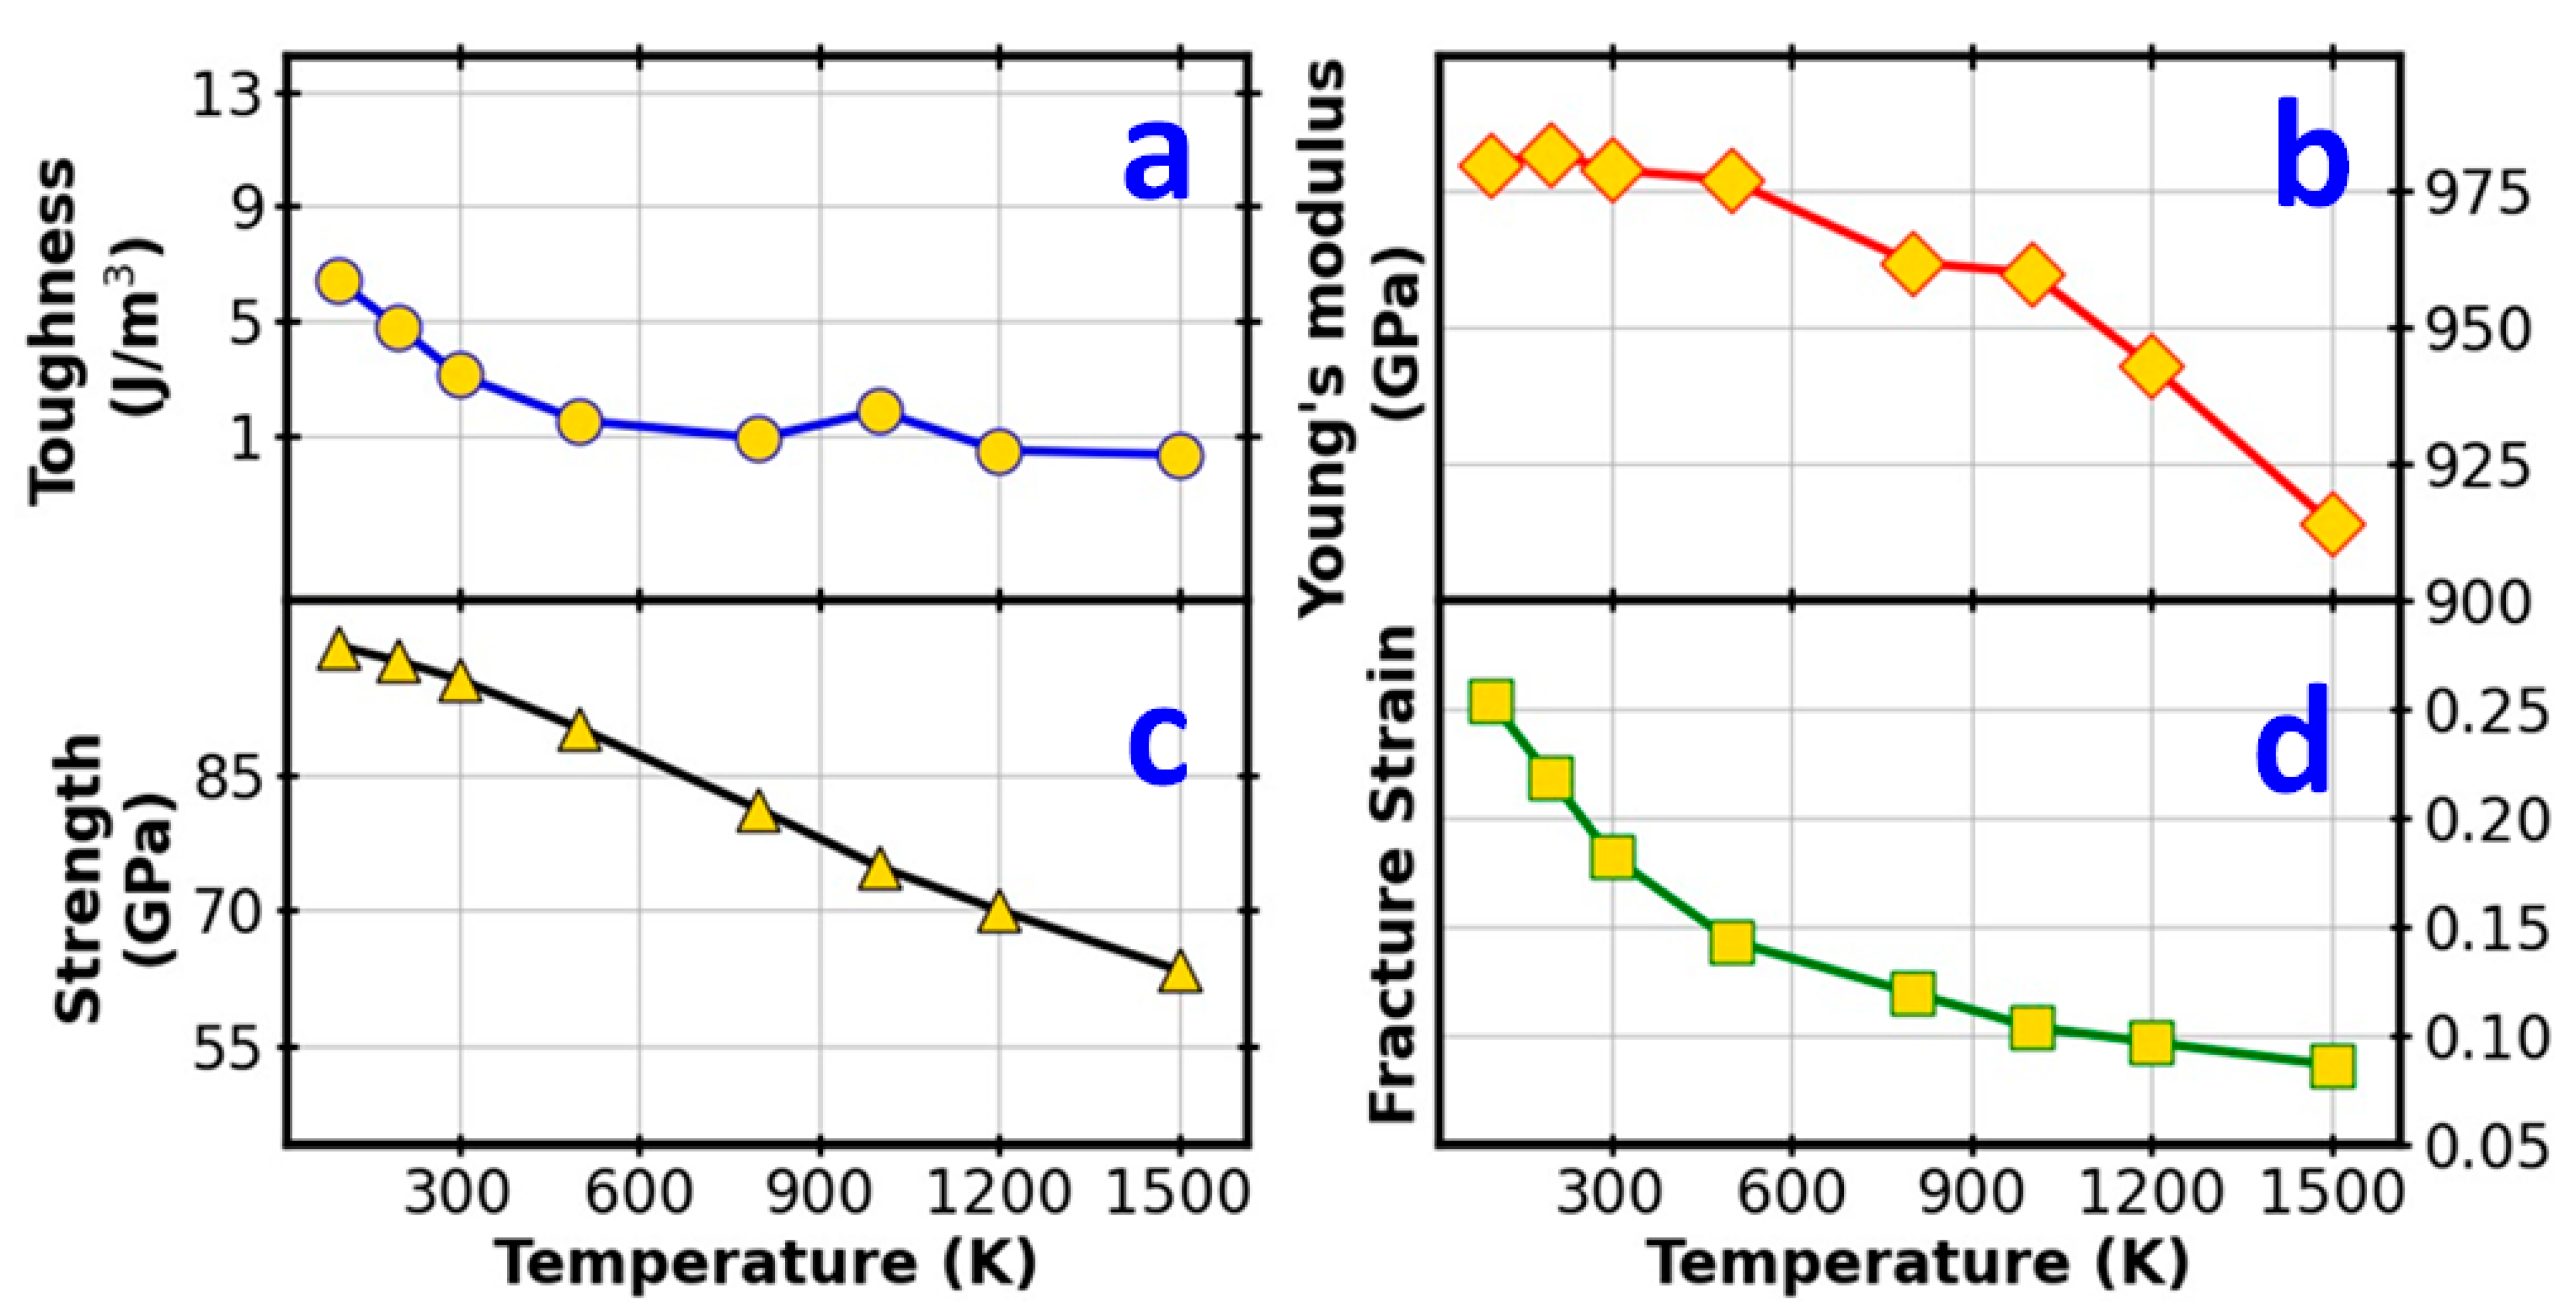
3.5. Temperature Effect

It is well established that the mechanical properties of carbon materials are considerably affected by temperature [68,69]. We investigated the temperature dependence of the mechanical properties of a triangular crack in graphene under a uniaxial tensile loading. Eight temperatures, ranging from 100 K to 1500 K, were tested using the Angle90 configuration, as shown in Figure 7. In general, each of the tested mechanical properties decreased with rising temperatures and was in line with the results of previous studies conducted on pristine graphene [70,71].
Figure 8 depicts the relationship of the toughness, Young’s modulus, fracture strength, and fracture strain with temperature. Fracture strength reduces linearly with an increase in temperature from 99.13 GPa to 63.44 GPa with a 36.0% reduction for our temperature range. This drastic behavior can be explained by analyzing the energy required for the fracture to occur, which is comprised of thermal energy and strain energy. At higher temperatures, the thermal energy contributes more to the total energy; hence, the strain energy required for the fracture to occur is lower [69]. Toughness and fracture strain follow an inversely proportional correlation with temperature and seem to converge.
When the temperature increased from 100 K to 1500 K, the toughness and fracture strain dropped from 6.39 J·m−3 to 0.33 J·m−3 and 0.253 to 0.086, respectively. This signifies a 94.8% reduction in toughness and a 66.0% reduction in fracture strain for this temperature range. The Young’s modulus obeyed a general negative correlation with temperature at ranges above 500 K, with a drop from 977 GPa to 914 GPa seen with a 6.45% reduction in fracture strain.
It is interesting to note that from 100 K to 500 K, the Young’s modulus remains relatively stable, which is in accordance with Jiang et al.’s findings [72] on pristine monolayer graphene for the same temperature range, whereas Zhao et al.’s [70] paper found a rapid decrease in Young’s modulus after 1200 K, as observed in our findings as well.

4. Conclusions

We reported on a systematic study of the influence of crack angle on the mechanical behavior of single-layer graphene. Various mechanical properties of a single-layer graphene sheet (SLGS) with a triangular crack were investigated via molecular dynamics simulations. The results showed that the investigated properties could be manipulated by taking control of variable parameters, such as the crack angle shape, system and crack sizes, temperature, and strain rate. These variables govern the mechanism controlling fracture strength and toughness. Upon increasing the crack angle, the investigated tensile properties could be cumulatively improved. The striking finding is that the triangle crack front with vertex angle of 60° is the most vulnerable crack front with the lowest fracture toughness and fracture strain. The system size variations with both constant crack shapes and sizes demonstrated minor effects on the investigated properties. These variations are important when the crack size changes along with a change in the system size.
Unlike the non-linear mechanical properties, the linear elastic properties, including fracture toughness, were assessed to be strain rate-sensitive. The major findings of this study confirm the outstanding mechanical properties of graphene with an emphasis on the accessible improvement of the fracture toughness. Monitoring these properties can be useful for many applications, including the fabrication and design of graphene-based devices for integrity and safety concerns.

Author Contributions

Conducted the MD simulations, I.I.A.; interpreted the simulation results and wrote part of the manuscript draft, S.M.A., I.A., H.S.; conceived the idea, interpreted the results, and revised the manuscript draft, Q.P.; data analysis, A.Q.A. and A.A.; All authors read and approved the final draft. All authors have read and agreed to the published version of the manuscript.

Funding

The Deanship of Scientific Research (DSR) at King Fahd University of Petroleum and Minerals (KFUPM) is acknowledged for its financial support through the project DF201020.

Data Availability Statement

The raw data generated during this study will be made available by the corresponding author without undue reservation upon request.

Acknowledgments

This research used the resources of the Supercomputing Laboratory at King Abdullah University of Science Technology (KAUST) in Thuwal, Saudi Arabia.

Conflicts of Interest

The authors declare no conflict of interest.

References

  1. Pei, Q.X.; Zhang, Y.W.; Shenoy, V.B. A molecular dynamics study of the mechanical properties of hydrogen functionalized graphene. Carbon N. Y. 2010, 48, 898–904. [Google Scholar] [CrossRef]
  2. Kim, Y.; Lee, J.; Yeom, M.S.; Shin, J.W.; Kim, H.; Cui, Y.; Kysar, J.W.; Hone, J.; Jung, Y.; Jeon, S.; et al. Strengthening effect of single-atomic-layer graphene in metal-graphene nanolayered composites. Nat. Commun. 2013, 4, 1–7. [Google Scholar] [CrossRef] [PubMed]
  3. Yang, Y.; Rigdon, W.; Huang, X.; Li, X. Enhancing graphene reinforcing potential in composites by hydrogen passivation induced dispersion. Sci. Rep. 2013, 3, 1–7. [Google Scholar] [CrossRef] [Green Version]
  4. Ahmed, T.; Das, S.; Irin, F. High performance polymer-stabilized pristine graphene based epoxy composites with enhanced mechanical and electrical properties. Macromol. Mater. Eng. 2013, 298, 339–347. [Google Scholar]
  5. Papageorgiou, D.G.; Kinloch, I.A.; Young, R.J. Mechanical properties of graphene and graphene-based nanocomposites. Prog. Mater. Sci. 2017, 90, 75–127. [Google Scholar] [CrossRef]
  6. Chen, Y.; Xie, Y.; Yan, X.; Cohen, M.L.; Zhang, S. Topological carbon materials: A new perspective. Phys. Rep. 2020, 868, 1–32. [Google Scholar] [CrossRef]
  7. Castro Neto, A.H.; Guinea, F.; Peres, N.M.R.; Novoselov, K.S.; Geim, A.K. The electronic properties of graphene. Rev. Mod. Phys. 2009, 81, 109–162. [Google Scholar] [CrossRef] [Green Version]
  8. Balandin, A.A.; Ghosh, S.; Bao, W.; Calizo, I.; Teweldebrhan, D.; Miao, F.; Lau, C.N. Superior thermal conductivity of single-layer graphene. Nano Lett. 2008, 8, 902–907. [Google Scholar] [CrossRef]
  9. Zhao, Q.; Nardelli, M.B.; Bernholc, J. Ultimate strength of carbon nanotubes: A theoretical study. Phys. Rev. B-Condens. Matter Mater. Phys. 2002, 65, 1–6. [Google Scholar] [CrossRef] [Green Version]
  10. Jing, Y.; Sun, Y.; Niu, H.; Shen, J. Chirality and size dependent elastic properties of silicene nanoribbons under uniaxial tension. In Proceedings of the 13th International Conference on Fracture 2013 (ICF-13), Beijing, China, 16–21 June 2013; Volume 7, pp. 5663–5668. [Google Scholar]
  11. Grantab, R.; Shenoy, V.B.; Ruoff, R.S. Anomalous strength characteristics of tilt grain boundaries in graphene. Science 2010, 330, 946–948. [Google Scholar] [CrossRef] [PubMed] [Green Version]
  12. Zhang, P.; Ma, L.; Fan, F.; Zeng, Z.; Peng, C.; Loya, P.E.; Liu, Z.; Gong, Y.; Zhang, J.; Zhang, X.; et al. Fracture toughness of graphene. Nat. Commun. 2014, 5, 3782. [Google Scholar] [CrossRef] [Green Version]
  13. Moura, M.J.B.; Marder, M. Tearing of free-standing graphene. Phys. Rev. E-Stat. Nonlinear Soft Matter Phys. 2013, 88, 1–10. [Google Scholar] [CrossRef] [PubMed] [Green Version]
  14. Le, M.Q.; Batra, R.C. Single-edge crack growth in graphene sheets under tension. Comput. Mater. Sci. 2013, 69, 381–388. [Google Scholar] [CrossRef]
  15. Cao, A.; Qu, J. Atomistic simulation study of brittle failure in nanocrystalline graphene under uniaxial tension. Appl. Phys. Lett. 2013, 102, 071902. [Google Scholar] [CrossRef] [Green Version]
  16. Wu, J.; Wei, Y. Grain misorientation and grain-boundary rotation dependent mechanical properties in polycrystalline graphene. J. Mech. Phys. Solids 2013, 61, 1421–1432. [Google Scholar] [CrossRef] [Green Version]
  17. Cao, Q.; Geng, X.; Wang, H.; Wang, P.; Liu, A.; Lan, Y.; Peng, Q. A Review of Current Development of Graphene Mechanics. Crystals 2018, 8, 357. [Google Scholar] [CrossRef] [Green Version]
  18. Lee, G.H.; Cooper, R.C.; An, S.J.; Lee, S.; Van Der Zande, A.; Petrone, N.; Hammerberg, A.G.; Lee, C.; Crawford, B.; Oliver, W.; et al. High-strength chemical-vapor-deposited graphene and grain boundaries. Science 2013, 340, 1074–1076. [Google Scholar] [CrossRef] [PubMed]
  19. Chen, T.; Cheung, R. Mechanical properties of graphene. In Graphene Science Handbook; CRC Press: Boca Raton, FL, USA, 2016; pp. 3–15. [Google Scholar]
  20. Agius Anastasi, A.; Ritos, K.; Cassar, G.; Borg, M.K. Mechanical properties of pristine and nanoporous graphene. Mol. Simul. 2016, 42, 1502–1511. [Google Scholar] [CrossRef] [Green Version]
  21. Dewapriya, M.A.N.; Srikantha Phani, A.; Rajapakse, R.K.N.D. Influence of temperature and free edges on the mechanical properties of graphene. Model. Simul. Mater. Sci. Eng. 2013, 21, 65017. [Google Scholar] [CrossRef]
  22. Zandiatashbar, A.; Lee, G.H.; An, S.J.; Lee, S.; Mathew, N.; Terrones, M.; Hayashi, T.; Picu, C.R.; Hone, J.; Koratkar, N. Effect of defects on the intrinsic strength and stiffness of graphene. Nat. Commun. 2014, 5, 3186. [Google Scholar] [CrossRef]
  23. Cheng, Y.; Zhou, S.; Hu, P.; Zhao, G.; Li, Y.; Zhang, X.; Han, W. Enhanced mechanical, thermal, and electric properties of graphene aerogels via supercritical ethanol drying and high-Temperature thermal reduction. Sci. Rep. 2017, 7, 1–11. [Google Scholar] [CrossRef] [Green Version]
  24. Ranjbartoreh, A.R.; Wang, B.; Shen, X.; Wang, G. Advanced mechanical properties of graphene paper. J. Appl. Phys. 2011, 109, 1–6. [Google Scholar] [CrossRef]
  25. Li, X.; Guo, J. Numerical investigation of the fracture properties of pre-cracked monocrystalline/polycrystalline graphene sheets. Materials 2019, 12, 263. [Google Scholar] [CrossRef] [PubMed] [Green Version]
  26. Akinwande, D.; Brennan, C.J.; Bunch, J.S.; Egberts, P.; Felts, J.R.; Gao, H.; Huang, R.; Kim, J.S.; Li, T.; Li, Y.; et al. A review on mechanics and mechanical properties of 2D materials—Graphene and beyond. Extrem. Mech. Lett. 2017, 13, 42–77. [Google Scholar]
  27. Peng, Q.; Liang, C.; Ji, W.; De, S. A theoretical analysis of the effect of the hydrogenation of graphene to graphane on its mechanical properties. Phys. Chem. Chem. Phys. 2013, 15, 2003–2011. [Google Scholar] [CrossRef] [PubMed]
  28. Peng, Q.; Chen, Z.; De, S. A Density Functional Theory Study of the Mechanical Properties of Graphane with van der Waals Corrections. Mech. Adv. Mater. Struct. 2015, 22, 717–721. [Google Scholar] [CrossRef]
  29. Peng, Q.; Chen, X.J.; Ji, W.; De, S. Chemically tuning mechanics of graphene by BN. Adv. Eng. Mater. 2013, 15, 718–727. [Google Scholar] [CrossRef]
  30. Shaolong, Z.; Qiang, C.; Sheng, L.; Qing, P. Ultrahigh ballistic resistance capacity of twisted bilayer graphene. Crystals 2021, 11, 206. [Google Scholar]
  31. Peng, Q.; De, S. Mechanical properties and instabilities of ordered graphene oxide C6O monolayers. RSC Adv. 2013, 3, 24337–24344. [Google Scholar] [CrossRef]
  32. Liu, X.; Bie, Z.; Wang, J.; Sun, L.; Tian, M.; Oterkus, E.; He, X. Investigation on fracture of pre-cracked single-layer graphene sheets. Comput. Mater. Sci. 2019, 159, 365–375. [Google Scholar] [CrossRef] [Green Version]
  33. Le, M.Q.; Batra, R.C. Mode-I stress intensity factor in single layer graphene sheets. Comput. Mater. Sci. 2016, 118, 251–258. [Google Scholar] [CrossRef] [Green Version]
  34. Jiang, Z.; Lin, R.; Yu, P.; Liu, Y.; Wei, N.; Zhao, J. The chirality-dependent fracture properties of single-layer graphene sheets: Molecular dynamics simulations and finite element method. J. Appl. Phys. 2017, 122, 025110. [Google Scholar] [CrossRef]
  35. Peng, Q.; Meng, F.; Yang, Y.; Lu, C.; Deng, H.; Wang, L.; De, S.; Gao, F. Shockwave generates < 100 > dislocation loops in bcc iron. Nat. Commun. 2018, 9, 4880. [Google Scholar] [CrossRef]
  36. Plimpton, S. Fast parallel algorithms for short-range molecular dynamics. J. Comput. Phys. 1995, 117, 1–19. [Google Scholar] [CrossRef] [Green Version]
  37. Hou, J.; Deng, B.; Zhu, H.; Lan, Y.; Shi, Y.; De, S.; Liu, L.; Chakraborty, P.; Gao, F.; Peng, Q. Magic auxeticity angle of graphene. Carbon N. Y. 2019, 149, 350–354. [Google Scholar] [CrossRef] [Green Version]
  38. Zheng, S.; Cao, Q.; Liu, S.; Peng, Q. Atomic Structure and Mechanical Properties of Twisted Bilayer Graphene. J. Compos. Sci. 2018, 3, 2. [Google Scholar] [CrossRef] [Green Version]
  39. Stukowski, A. Visualization and analysis of atomistic simulation data with OVITO-the Open Visualization Tool. Model. Simul. Mater. Sci. Eng. 2010, 18, 15012. [Google Scholar] [CrossRef]
  40. Xia, W.; Ruiz, L.; Pugno, N.M.; Keten, S. Critical length scales and strain localization govern the mechanical performance of multi-layer graphene assemblies. Nanoscale 2016, 8, 6456–6462. [Google Scholar] [CrossRef]
  41. Shao, T.; Wen, B.; Melnik, R.; Yao, S.; Kawazoe, Y.; Tian, Y. Temperature dependent elastic constants and ultimate strength of graphene and graphyne. J. Chem. Phys. 2012, 137, 194901. [Google Scholar] [CrossRef] [Green Version]
  42. Yu, M.F.; Lourie, O.; Dyer, M.J.; Moloni, K.; Kelly, T.F.; Ruoff, R.S. Strength and breaking mechanism of multiwalled carbon nanotubes under tensile load. Science 2000, 287, 637–640. [Google Scholar] [CrossRef] [Green Version]
  43. Frank, I.W.; Tanenbaum, D.M.; van der Zande, A.M.; McEuen, P.L. Mechanical properties of suspended graphene sheets. J. Vac. Sci. Technol. B Microelectron. Nanom. Struct. 2007, 25, 2558. [Google Scholar] [CrossRef] [Green Version]
  44. Lee, C.; Wei, X.; Kysar, J.W.; Hone, J. of Monolayer Graphene. Science 2008, 321, 385–388. [Google Scholar] [CrossRef] [PubMed]
  45. Kudin, K.N.; Scuseria, G.E.; Yakobson, B.I. (formula presented) BN, and C nanoshell elasticity from ab initio computations. Phys. Rev. B-Condens. Matter Mater. Phys. 2001, 64, 235406. [Google Scholar] [CrossRef]
  46. Peng, Q.; Zamiri, A.; Ji, W.; De, S. Elastic Properties of Hybrid Graphene/Boron Nitride Monolayer. Acta Mech. 2012, 223, 2591–2596. [Google Scholar] [CrossRef] [Green Version]
  47. Scarpa, F.; Adhikari, S.; Srikantha Phani, A. Effective elastic mechanical properties of single layer graphene sheets. Nanotechnology 2009, 20, 065709. [Google Scholar] [CrossRef] [PubMed]
  48. Brenner, D.W.; Shenderova, O.A.; Harrison, J.A.; Stuart, S.J.; Ni, B.; Sinnott, S.B. A second-generation reactive empirical bond order ( REBO ) potential energy expression for hydrocarbons. Mater. Sci. 2002, 14, 783–802. [Google Scholar] [CrossRef]
  49. Brenner, D.W. Empirical potential for hydrocarbons for use in simulating the chemical vapor deposition of diamond films. Phys. Rev. B 1990, 42, 9458–9471. [Google Scholar] [CrossRef] [PubMed]
  50. Zakharchenko, K.V.; Katsnelson, M.I.; Fasolino, A. Finite temperature lattice properties of graphene beyond the quasiharmonic approximation. Phys. Rev. Lett. 2009, 102, 2–5. [Google Scholar] [CrossRef]
  51. Konstantinova, E.; Dantas, S.O.; Barone, P.M.V.B. Electronic and elastic properties of two-dimensional carbon planes. Phys. Rev. B-Condens. Matter Mater. Phys. 2006, 74, 1–6. [Google Scholar] [CrossRef]
  52. Wu, Y.; Zhang, X.; Leung, A.Y.T.; Zhong, W. An energy-equivalent model on studying the mechanical properties of single-walled carbon nanotubes. Thin-Walled Struct. 2006, 44, 667–676. [Google Scholar] [CrossRef]
  53. Xiao, J.R.; Gama, B.A.; Gillespie, J.W. An analytical molecular structural mechanics model for the mechanical properties of carbon nanotubes. Int. J. Solids Struct. 2005, 42, 3075–3092. [Google Scholar] [CrossRef]
  54. Bu, H.; Chen, Y.; Zou, M.; Yi, H.; Bi, K.; Ni, Z. Atomistic simulations of mechanical properties of graphene nanoribbons. Phys. Lett. Sect. A Gen. At. Solid State Phys. 2009, 373, 3359–3362. [Google Scholar] [CrossRef]
  55. Huang, Y.; Wu, J.; Hwang, K.C. Thickness of graphene and single-wall carbon nanotubes. Phys. Rev. B-Condens. Matter Mater. Phys. 2006, 74, 1–9. [Google Scholar] [CrossRef]
  56. Xie, L.; Sun, T.; He, C.; An, H.; Qin, Q.; Peng, Q. Effect of angle, temperature and vacancy defects on mechanical properties of PSI-graphene. Crystals 2019, 9, 238. [Google Scholar] [CrossRef] [Green Version]
  57. Lee, S.M.; Kim, J.H.; Ahn, J.H. Graphene as a flexible electronic material: Mechanical limitations by defect formation and efforts to overcome. Mater. Today 2015, 18, 336–344. [Google Scholar] [CrossRef]
  58. Shoaib, H.; Peng, Q.; Alsayoud, A.Q. Atomic Insights into Fracture characteristics of Twisted Tri-layer Graphene. Crystals 2021, 11, 1202. [Google Scholar] [CrossRef]
  59. Wang, S.; Yang, B.; Yuan, J.; Si, Y.; Chen, H. Large-Scale Molecular Simulations on the Mechanical Response and Failure Behavior of a defective Graphene: Cases of 5-8-5 Defects. Sci. Rep. 2015, 5, 1–10. [Google Scholar] [CrossRef] [Green Version]
  60. He, L.; Guo, S.; Lei, J.; Sha, Z.; Liu, Z. The effect of Stone-Thrower-Wales defects on mechanical properties of graphene sheets-A molecular dynamics study. Carbon N. Y. 2014, 75, 124–132. [Google Scholar] [CrossRef]
  61. Sun, X.; Fu, Z.; Xia, M.; Xu, Y. Effects of vacancy defect on the tensile behavior of graphene. Theor. Appl. Mech. Lett. 2014, 4, 051002. [Google Scholar] [CrossRef] [Green Version]
  62. Wang, M.C.; Yan, C.; Ma, L.; Hu, N.; Chen, M.W. Effect of defects on fracture strength of graphene sheets. Comput. Mater. Sci. 2012, 54, 236–239. [Google Scholar] [CrossRef] [Green Version]
  63. Li, X.L.; Guo, J.G. Theoretical and numerical studies on the fracture properties of pre-cracked single-layer graphene. J. Phys. Chem. Solids 2020, 141, 109401. [Google Scholar] [CrossRef]
  64. Liu, A.; Peng, Q. A molecular dynamics study of the mechanical properties of twisted bilayer graphene. Micromachines 2018, 9, 440. [Google Scholar] [CrossRef] [PubMed] [Green Version]
  65. Zhang, H.Y.; Wu, J.Y.; He, J.Y.; Zhang, Z.L. Effect of hole size on the fracture of graphene nanomesh. In Proceedings of the 19th European Conference on Fracture, Kazan, Russia, 26–31 August 2012. [Google Scholar]
  66. Dewapriya, M.A.N.; Rajapakse, R.K.N.D. Molecular dynamics simulations and continuum modeling of temperature and strain rate dependent fracture strength of graphene with vacancy defects. J. Appl. Mech. Trans. ASME 2014, 81, 081010. [Google Scholar] [CrossRef]
  67. Chen, M.Q.; Quek, S.S.; Sha, Z.D.; Chiu, C.H.; Pei, Q.X.; Zhang, Y.W. Effects of grain size, temperature and strain rate on the mechanical properties of polycrystalline graphene-A molecular dynamics study. Carbon N. Y. 2015, 85, 135–146. [Google Scholar] [CrossRef]
  68. Huang, J.Y.; Chen, S.; Wang, Z.Q.; Kempa, K.; Wang, Y.M.; Jo, S.H.; Chen, G.; Dresselhaus, M.S.; Ren, Z.F. Superplastic carbon nanotubes. Nature 2006, 439, 281. [Google Scholar] [CrossRef]
  69. Tang, C.; Guo, W.; Chen, C. Molecular dynamics simulation of tensile elongation of carbon nanotubes: Temperature and size effects. Phys. Rev. B-Condens. Matter Mater. Phys. 2009, 79, 155436. [Google Scholar] [CrossRef]
  70. Zhao, H.; Aluru, N.R. Temperature and strain-rate dependent fracture strength of graphene. J. Appl. Phys. 2010, 108, 064321. [Google Scholar] [CrossRef] [Green Version]
  71. Zhang, Y.Y.; Gu, Y.T. Mechanical properties of graphene: Effects of layer number, temperature and isotope. Comput. Mater. Sci. 2013, 71, 197–200. [Google Scholar] [CrossRef] [Green Version]
  72. Jiang, J.-W.; Wang, J.-S.; Li, B. Young’s modulus of graphene: A molecular dynamics study. Phys. Rev. B-Condens. Matter Mater. Phys. 2009, 80, 113405. [Google Scholar] [CrossRef] [Green Version]
Figure 1. A snapshot of the configuration of Angle90, which is a single layer of graphene with a pre-crack in an isosceles triangle shape with a vertex angle of 90°. Left: the system size and the isosceles triangle sides. Right: a zoomed-in plot of the crack tip. The system of the pre-cracked single-layer graphene with the crack shape of an isosceles triangle with a vertex angle of 90° is denoted as Angle90 for convenience.
Crystals 11 01355 g001
Figure 2. Stress–strain relationships of the eight SLGSs pre-cracked in the shape of an isosceles triangle with different vertex angles ranging from 30° to 150° compared with that of pristine graphene. The tensile simulations were performed under the following conditions: The temperature was 300 K. The pressure was 0.0001 GPa (1 atm). The strain rate was 109 s−1. The model I loading was applied along the x axis (armchair direction). The insets were snapshots for the angles of (a) 30°, (b) 72°, (c) 120°.
Crystals 11 01355 g002
Figure 3. The crack angle shape dependence of cracked SLGSs’ mechanical properties: (a) toughness, (b) Young’s modulus, (c) fracture strength, and (d) fracture strain. The tensile simulations were carried out under the following conditions: The temperature was 300 K. The pressure was 0.0001 GPa (1 atm). The strain rate was 109 s−1. The model I loading was applied along the x axis (armchair direction). The eight SLGSs were pre-cracked in the shape of an isosceles triangle with different vertex angles ranging from 30° to 150° compared with that of pristine graphene.
Crystals 11 01355 g003
Figure 4. (a) Stress–strain relationships of SLGSs with different sized cracks. Three systems all with the same vertex angle of 90° are compared. The tensile simulations were carried out under the following conditions: The temperature was 300 K. The pressure was 0.0001 GPa (1 atm). The strain rate was 109 s−1. The model I loading was applied along the x axis (armchair direction). Snapshots of the x-component atomic stress distributions in the system with the size of 4 × 4 (or 20.7 nm × 20.5 nm with 16,128 lattice sites) can be seen in (b) for the system just before crack and (c) after the crack propagation. The colormap is in the middle.
Crystals 11 01355 g004
Figure 5. Stress–strain relationships of cracked SLGSs for different strain rates ( s 1 ) . The strain rate ranges from 107 s−1 to 3 × 10¹⁰ s−1. The tensile simulations were carried out under the following conditions: The temperature was 300 K. The pressure was 0.0001 GPa (1 atm). The model I loading was applied along the x axis (armchair direction). The system size was 4 × 4 (or 20.7 nm × 20.5 nm with 16,128 lattice sites). All the systems had pre-cracks in the shape of an isosceles right triangle.
Crystals 11 01355 g005
Figure 6. Strain rate dependence of cracked SLGSs’ mechanical properties: (a) toughness, (b) Young’s modulus, (c) fracture strength, and (d) fracture strain compared with that of pristine graphene. The strain rate ranges from 107 s−1 to 3 × 10¹⁰ s−1. The tensile simulations are under the following conditions: The temperature is 300 K. The pressure is 0.0001 GPa (1 atm). The model I loading is applied along the x axis (armchair direction). The system size is 4 × 4 (or 20.7 nm × 20.5 nm with 16,128 lattice sites). All the systems have the pre-crack in the shape of an isosceles right triangle.
Crystals 11 01355 g006
Figure 7. The stress–strain relationships of defective SLGSs at eight examined temperatures. The tensile simulations were carried out under the following conditions: The strain rate was 109 s−1. The pressure was 0.0001 GPa (1 atm). The model I loading was applied along the x axis (armchair direction). The system size was 4 × 4 (or 20.7 nm × 20.5 nm with 16,128 lattice sites). All the systems had the pre-crack in the shape of an isosceles right triangle.
Crystals 11 01355 g007
Figure 8. Temperature dependence of defective SLGSs’ mechanical properties, including: (a) toughness, (b) Young’s modulus, (c) fracture strength, and (d) fracture strain. The tensile simulations were carried out under the following conditions: The strain rate was 109 s−1. The pressure was 0.0001 GPa (1 atm). The model I loading was applied along the x axis (armchair direction). The system size was 4 × 4 (or 20.7 nm × 20.5 nm with 16,128 lattice sites). All the systems had a pre-crack in the shape of an isosceles right triangle.
Crystals 11 01355 g008
Table 1. The setup of the eight models. The number of atoms removed and their percentage out of the total number of atoms in the system, as summarized according to the top angle. We aim to use the same area of the triangle for comparison.
Top AngleAtoms RemovedPercentage of Defects
130°1500.930%
236°1530.949%
360°1540.959%
472°1530.949%
590°1580.980%
6108°1450.900%
7120°1560.967%
8150°1560.967%
Publisher’s Note: MDPI stays neutral with regard to jurisdictional claims in published maps and institutional affiliations.

