Article

Atomic Insights into Fracture Characteristics of Twisted Tri-Layer Graphene

1
Mechanical Engineering Department, King Fahd University of Petroleum and Minerals, Dhahran 31261, Saudi Arabia
2
Physics Department, King Fahd University of Petroleum and Minerals, Dhahran 31261, Saudi Arabia
3
K.A.CARE Energy Research Innovation Center, King Fahd University of Petroleum and Minerals, Dhahran 31261, Saudi Arabia
4
Hydrogen and Energy Storage Center, Materials Science and Engineering Department, King Fahd University of Petroleum and Minerals, Dhahran 31261, Saudi Arabia
*
Author to whom correspondence should be addressed.
Crystals 2021, 11(10), 1202; https://doi.org/10.3390/cryst11101202
Submission received: 18 September 2021 / Revised: 27 September 2021 / Accepted: 1 October 2021 / Published: 6 October 2021
(This article belongs to the Special Issue Graphene Mechanics (Volume II))

Abstract

:
Graphene twistronics have recently gained significant attention due their superconductive behavior as a consequence of their tunable electronic properties. Although the electronic properties of twisted graphene have been extensively studied, the mechanical properties and integrity of twisted trilayer graphene (tTLG) under loading is still elusive. We investigated the fracture mechanics of tTLG with a twist angle of ±1.53° utilizing molecular dynamics simulation. This twist angle was chosen because it is known to exhibit highly superconductive behavior. The results indicate that tTLG does not preserve the excellent mechanical properties typically associated with graphene, with toughness and fracture strain values much lower in comparison. The Young’s modulus was an exception with values relatively close to pristine graphene, whereas the tensile strength was found to be roughly half of the intrinsic strength of graphene. The fracture toughness, fracture strain and strength converge as the crack length increases, reaching 0.26 J/m 3 , 0.0217 and 39.9 GPa at a crack length of 8 nm, respectively. The Griffth critical strain energy is 19.98 J/m 2 and the critical stress intensity factor K c is 4.47 MPa M 1 / 2 , in good agreement with that of monolayer graphene in the experiment. Our atomic insights might be helpful in the material design of twisted trilayer graphene-based electronics.

Graphical Abstract

1. Introduction

Graphene is a carbon allotrope made up of single layer co-planar atoms arranged in a hexagonal lattice. Graphene is mainly known for its excellent mechanical properties coupled with its extraordinary thermal and electrical conductivity. Monolayer graphene was designated as the strongest material ever tested, with a Young’s modulus of 1 TPa [1]. Moreover, graphene has great potential in the electronics industry. Twisted layered graphene, or the field of “twistronics”, consists of layers of graphene that have been rotated relative to each other, as illustrated in Figure 1 [2]. The emergence of Moiré patterns at specific angles known as “magic angles” changes the material’s electronic properties [3,4] due to the lower energy requirements for free electron tunneling between the graphene layers [5]. Jarillo-Herrero et al. discovered that at 1.1°, the band of the electronic structure became flat near zero Fermi energy, causing unconventional superconductive behavior [6]. This discovery could open the possibility of superconducting transistors to be constructed where the level of superconductivity could be varied by manipulating the intensity of the applied electric field.
The discovery of superconductivity in twisted bilayer graphene was groundbreaking in the field of material science and was followed by a sudden rise in research concerning twistronic materials [7,8,9,10,11]. The scope of this discovery also extended to other Moiré-patterned 2D materials that exhibit superconductivity, such as twisted bilayer tungsten diselenide ( WSe 2 ) and boron nitride (BN) between layers of graphene [12,13].
In 2019, Ashvin Vishwanath of Harvard university predicted that multilayer graphene with alternating twist angles would also exhibit superconductivity. This was very recently confirmed, and it was found that at an average angle of ±1.56°, twisted trilayer graphene exhibited extraordinary superconductive properties and considering its low charge density, it had the strongest electron pairing ever observed [14]. tTLG was noted As superior to bilayer graphene because it was superconductive at a higher temperature and had better tunability in terms of its electronic structure and superconducting characteristics than bilayer graphene [15]. The electrical properties of tTLG are already well established, however, there is a research gap concerning the mechanical behavior of this material [16,17,18].
Hence, the purpose of this research was to study the fracture mechanics of tTLG. As demonstrated in our earlier work concerning graphene [19,20,21,22,23], this would allow us to better understand the material’s viability in terms of its potential applications. To gain atomistic insights, we used molecular dynamics simulations, which are powerful and insightful for various atomic-level large-scale finite-temperatures applications [24]. The remainder of this paper is structured as follows: in Section 2, the model and technique are provided; Section 3 contains the findings and discussions; and Section 4 includes the conclusions.

2. Model and Method

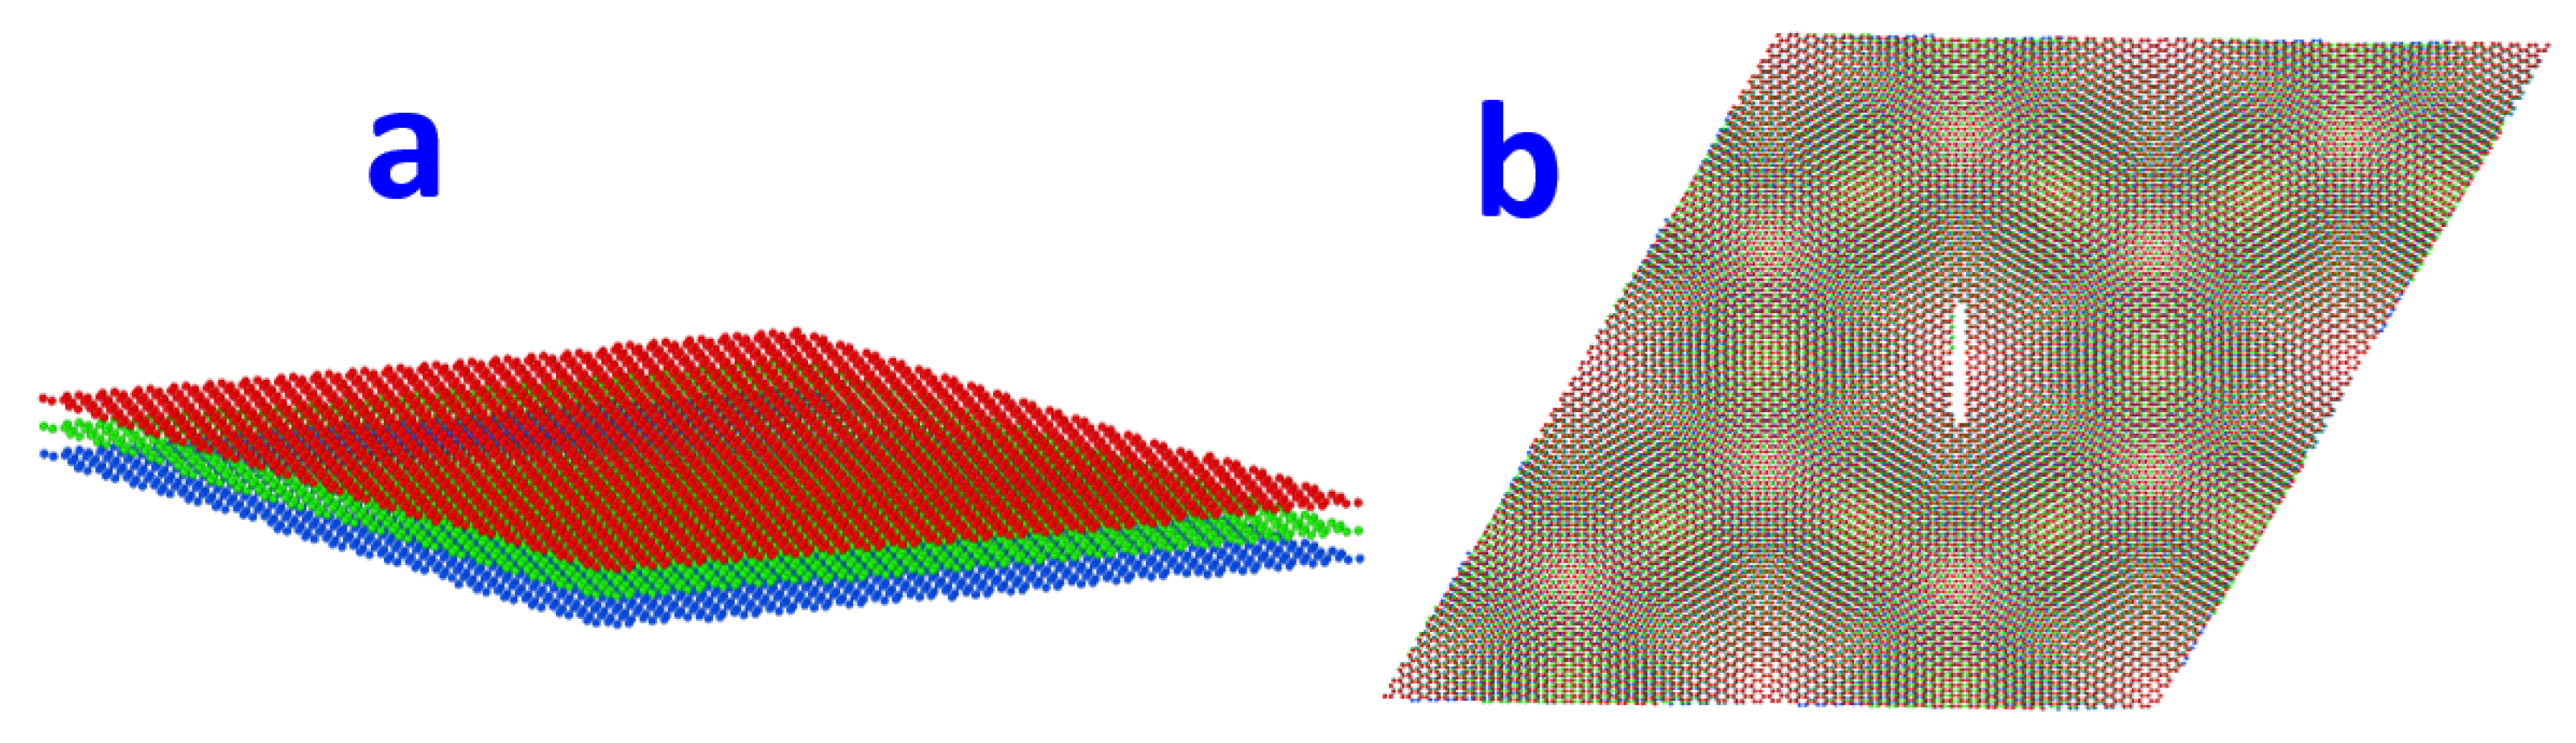
2.1. Initial Structure

To develop a twisted trilayer structure, we opted to rotate the top and bottom layers by ±1.53°, respectively, to test the material when it exhibits superconductive behavior [25]. The 1 × 1 primitive cell structure contains 8326 atoms equally divided into the three layers, which is sufficient to map out a complete repeating cell of such a low twist angle. The X and Y axes had periodic boundary conditions whereas the Z axis was fixed to accurately model the 2D graphene structure. The size of the primitive cell was 9.05 nm and 7.84 nm along the X and Y directions, respectively.
The cracked structure was obtained by removing atoms from every layer of pristine tTLG within a rectangular prism with dimensions of 2a 0 × 0.5 nm, where 2a 0 is the crack length. As mentioned in the literature, the crack length is perpendicular to the X axis which underwent tensile stress and is denoted by the armchair direction. The pristine and cracked structures are displayed in Figure 2 with the top and isometric views, respectively.

2.2. Interatomic Potential

The potential that portrays the microscopic interactions between the carbon atoms in the graphene sheet is the adaptive intermolecular reactive bond order (AIREBO) [26]. This force-field allows breaking and forming carbon–carbon covalent bonds, enabling the precise visualization of the atomic interactions within severe environments, including fracture. Therefore, this potential was suitable for investigating the mechanical properties of monolayer graphene [27,28]. In previous literary work, multilayer graphene was generally modeled by the adaptive intermolecular reactive bond order potential (AIREBO) [29,30,31]. However, it is known that while it accurately models covalent bond breaking and forming, it is not suitable for studying fracture behavior and interlayer van der Waals interactions at high pressures. The work of Mattsson et al. on Polyethylene demonstrated these limitations [32]. In order to obtain accurate results, it is critical to consider van der Waals interactions when modeling layered graphene systems [33,34]. Therefore, we utilized the modified AIREBO potential (AIREBO-M) where the LJ term was replaced with the non-divergent Morse potential. The inclusion of the Morse potential was shown to be valid for bilayer graphene over a greater pressure range while preserving performance at ambient conditions [35]. The potential consists of three terms and is described by the following:
E = 1 2 i j i E i j REBO + E i j MORSE + k i , j l i , j , k E k i j l TORSION
where the REBO term has the same functional form as the potential generated by Brenner et al. [36]. The coefficients in AIREBO are the same as Brenner’s potential. The MORSE potential covers the long-range interactions and depends on the given cutoff. The TORSION term refers to a four-body potential that describes the different dihedral angle inclinations in a hydrocarbon arrangement. We opted to use a cutoff of 3.0 to precisely model the carbon-carbon interactions. The inner and outer cutoff distances between carbon atoms were set to 0.192 nm and 0.20 nm, respectively. This parameter was well examined to prevent artificial strengthening near the fracture [25,37]. The van der Waals interactions between layers were modeled in the form of Morse potential, which can adequately capture the characteristics of interlayer interactions of multilayer graphene systems.

2.3. Molecular Dynamics Simulations

The large-scale Atomic/Molecular Massively Parallel Simulator (LAMMPS, stable version of 3-Mar-2020) was used for all the molecular dynamics (MD) simulations. We first carried out the potential energy minimization via the conjugate gradient algorithm, followed by the geometry optimization via the NPT ensemble with a temperature of T = 300 K and a pressure of 101,325 Pa (1 atm) for 50 ps. The MD timestep of the projector integration was 0.001 ps. We carried out the tensile test simulations with a strain rate of 1 × 10 9 s 1 .

3. Results and Discussion
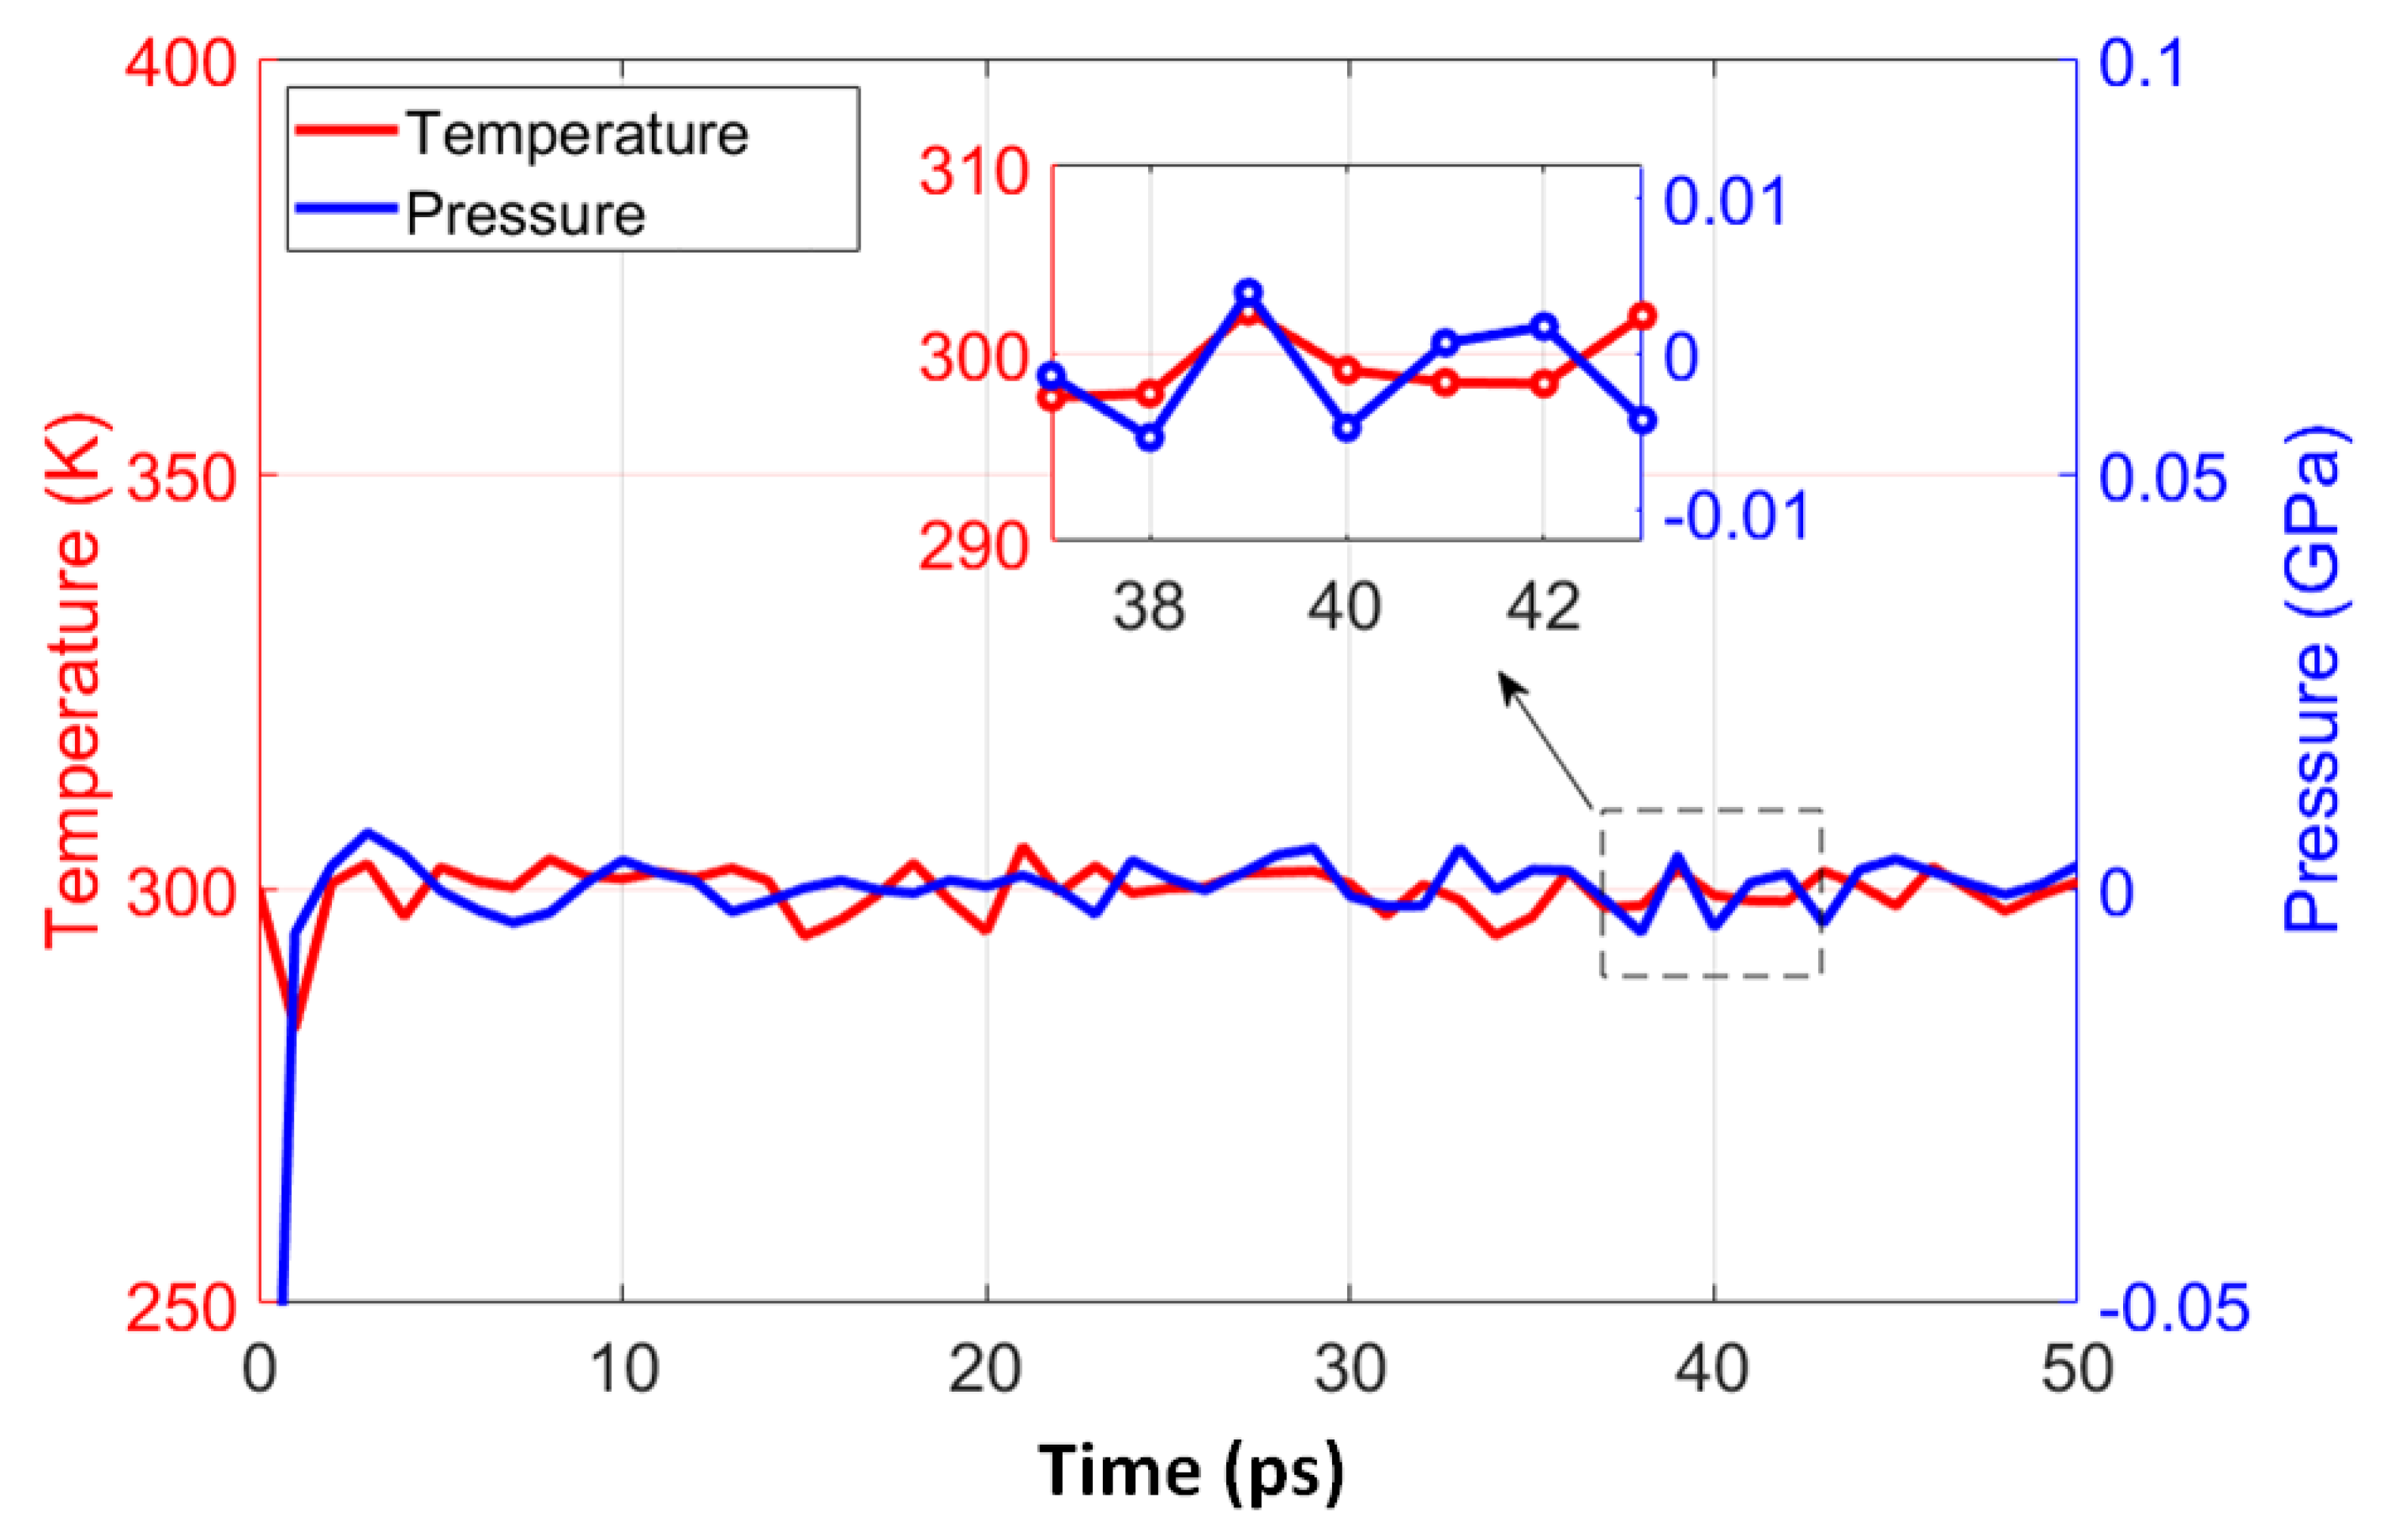
3.1. Equilibrium

The system was first equilibrated by performing an isothermal–isobaric ensemble (NPT) simulation for 50 ps at a timestep of 0.001 ps with T = 300 K and P = 0.0001 GPa to mimic ambient conditions on pristine tTLG. Figure 3 reveals that both pressure and temperature fluctuate over constant values, indicating that equilibrium has been reached.
The model was then subjected to a tensile load during the simulation with a strain rate of 1 × 10 9 s 1 to observe the stress-strain characteristics of our model. L(t) = L 0 exp (n × t) is the equation for elongation, where L 0 is the starting length, n is the strain rate, in the unit of s 1 and L(t) is the length of the simulation box at time t [38]. The stress-strain curve plays a major role in characterizing the mechanical properties of a structure and will be used to validate the model by comparing the Young’s modulus with the experiment.

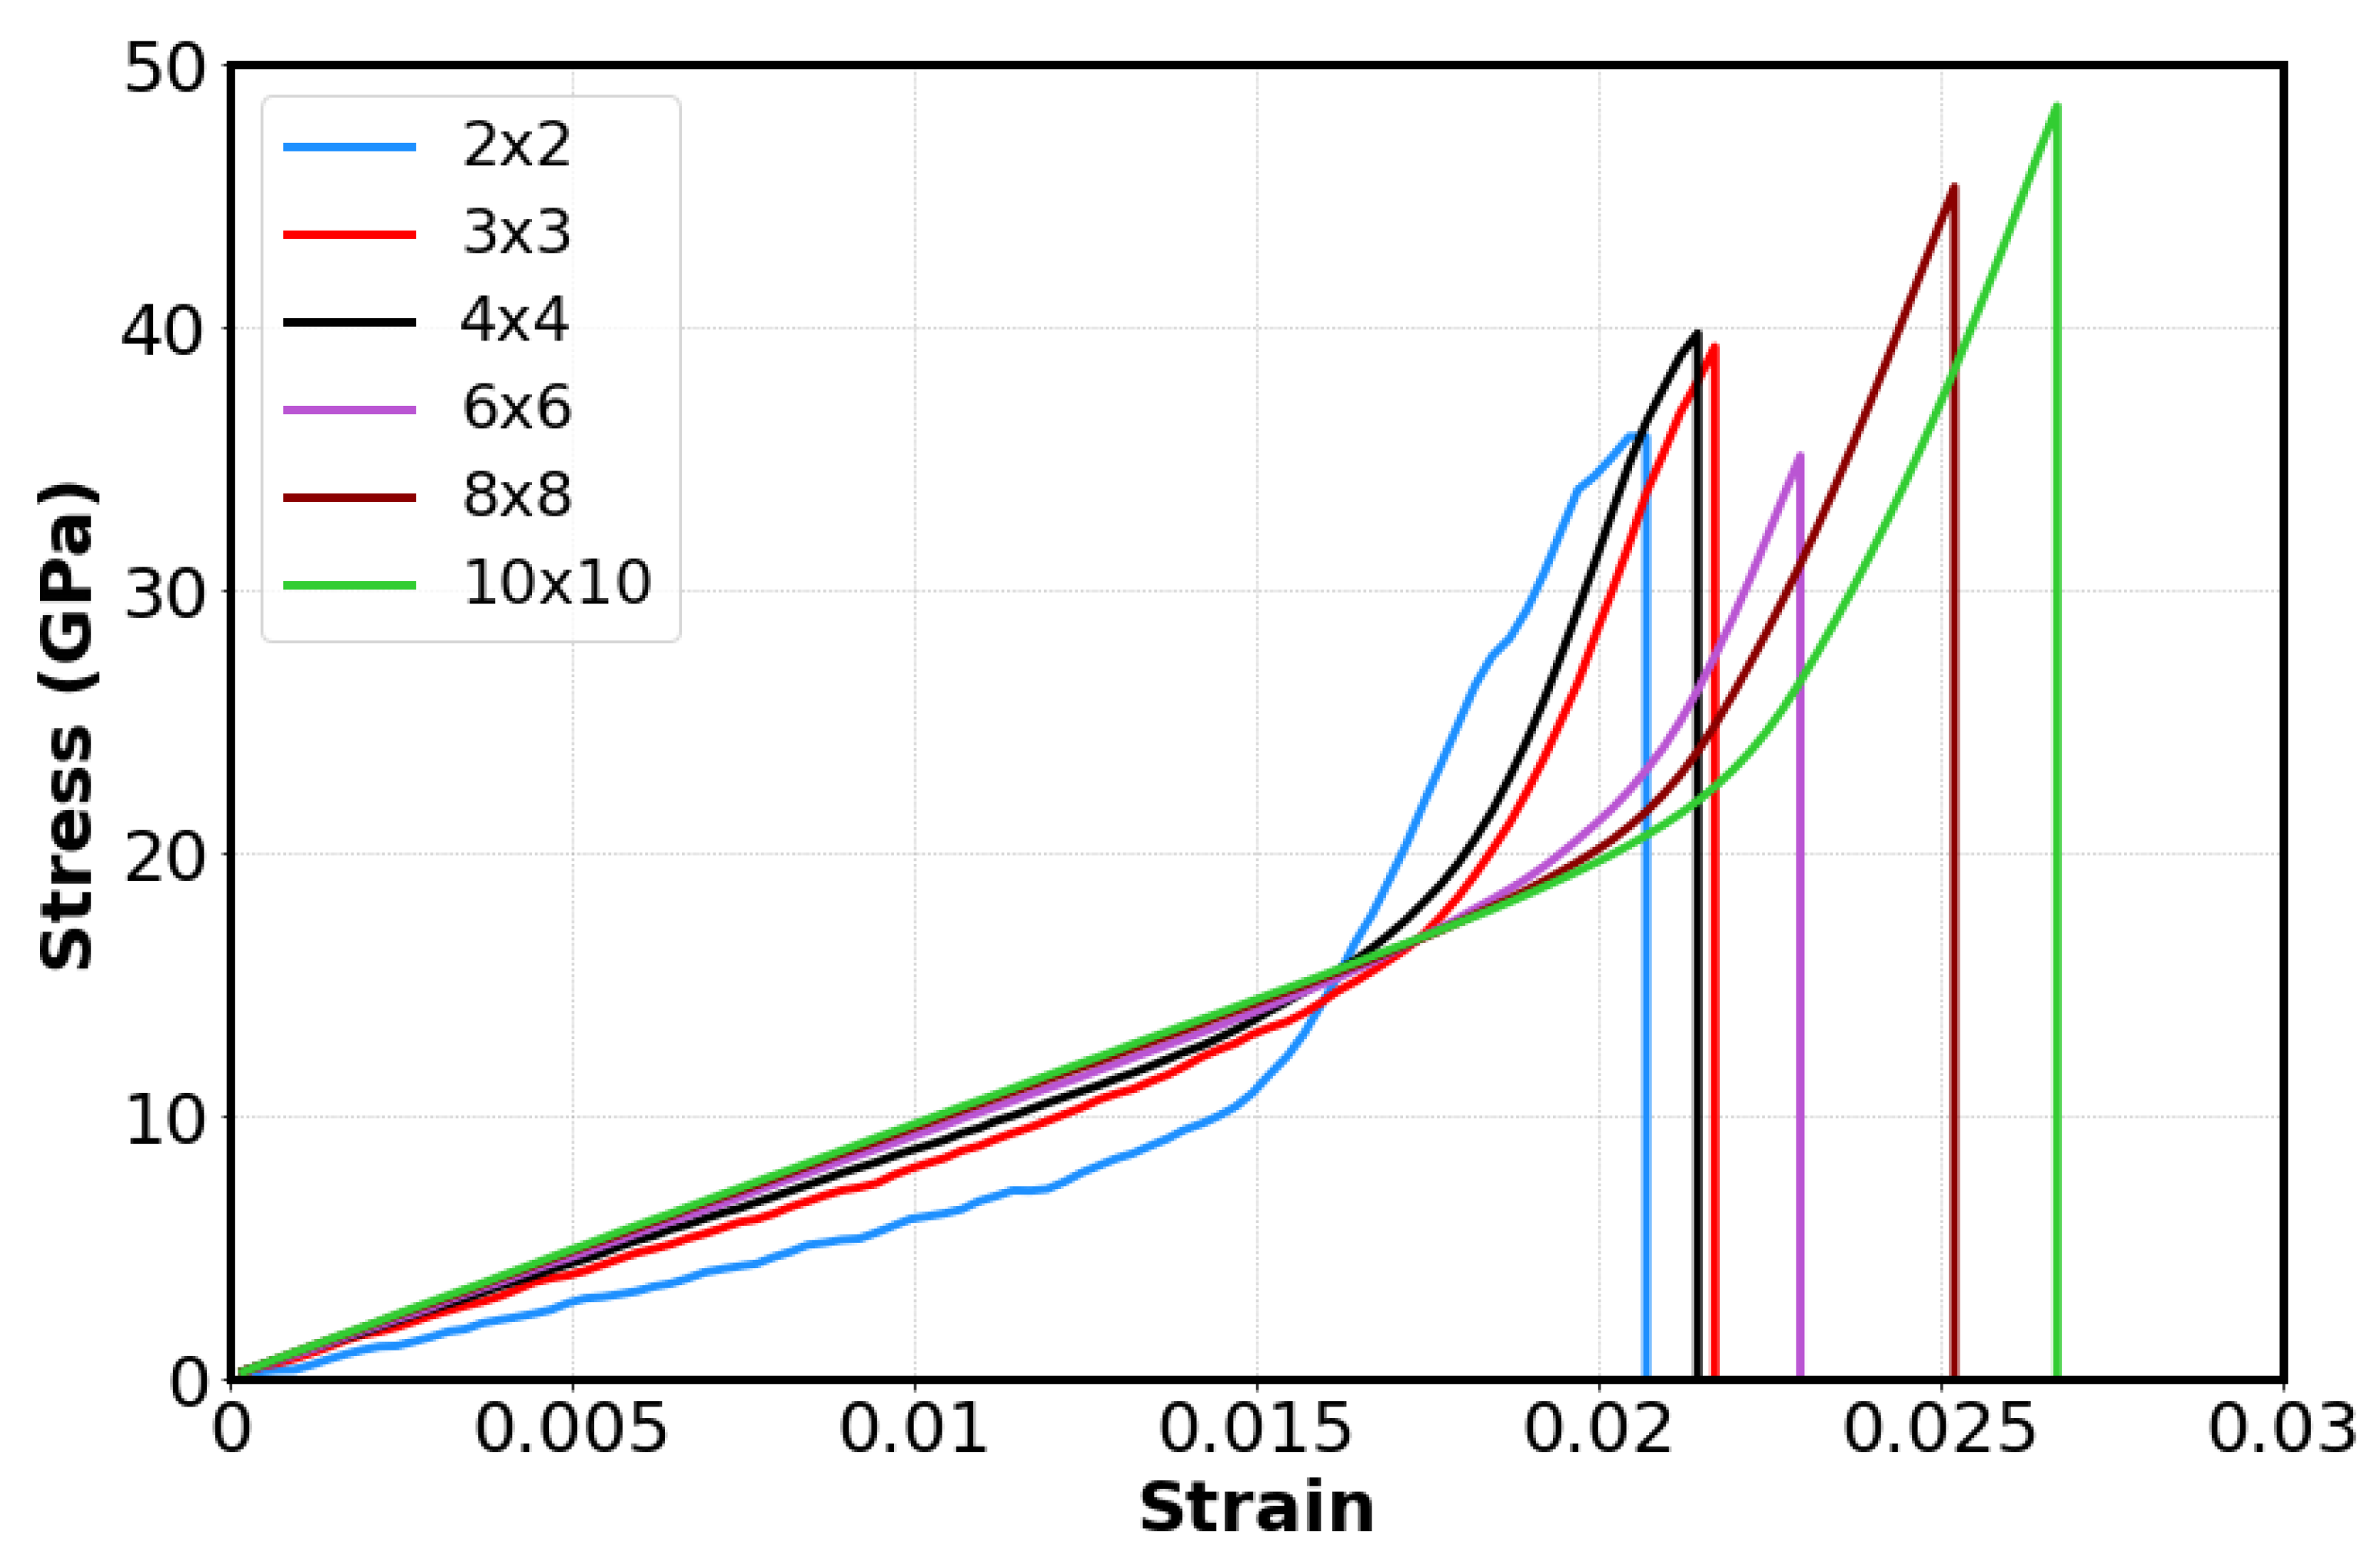
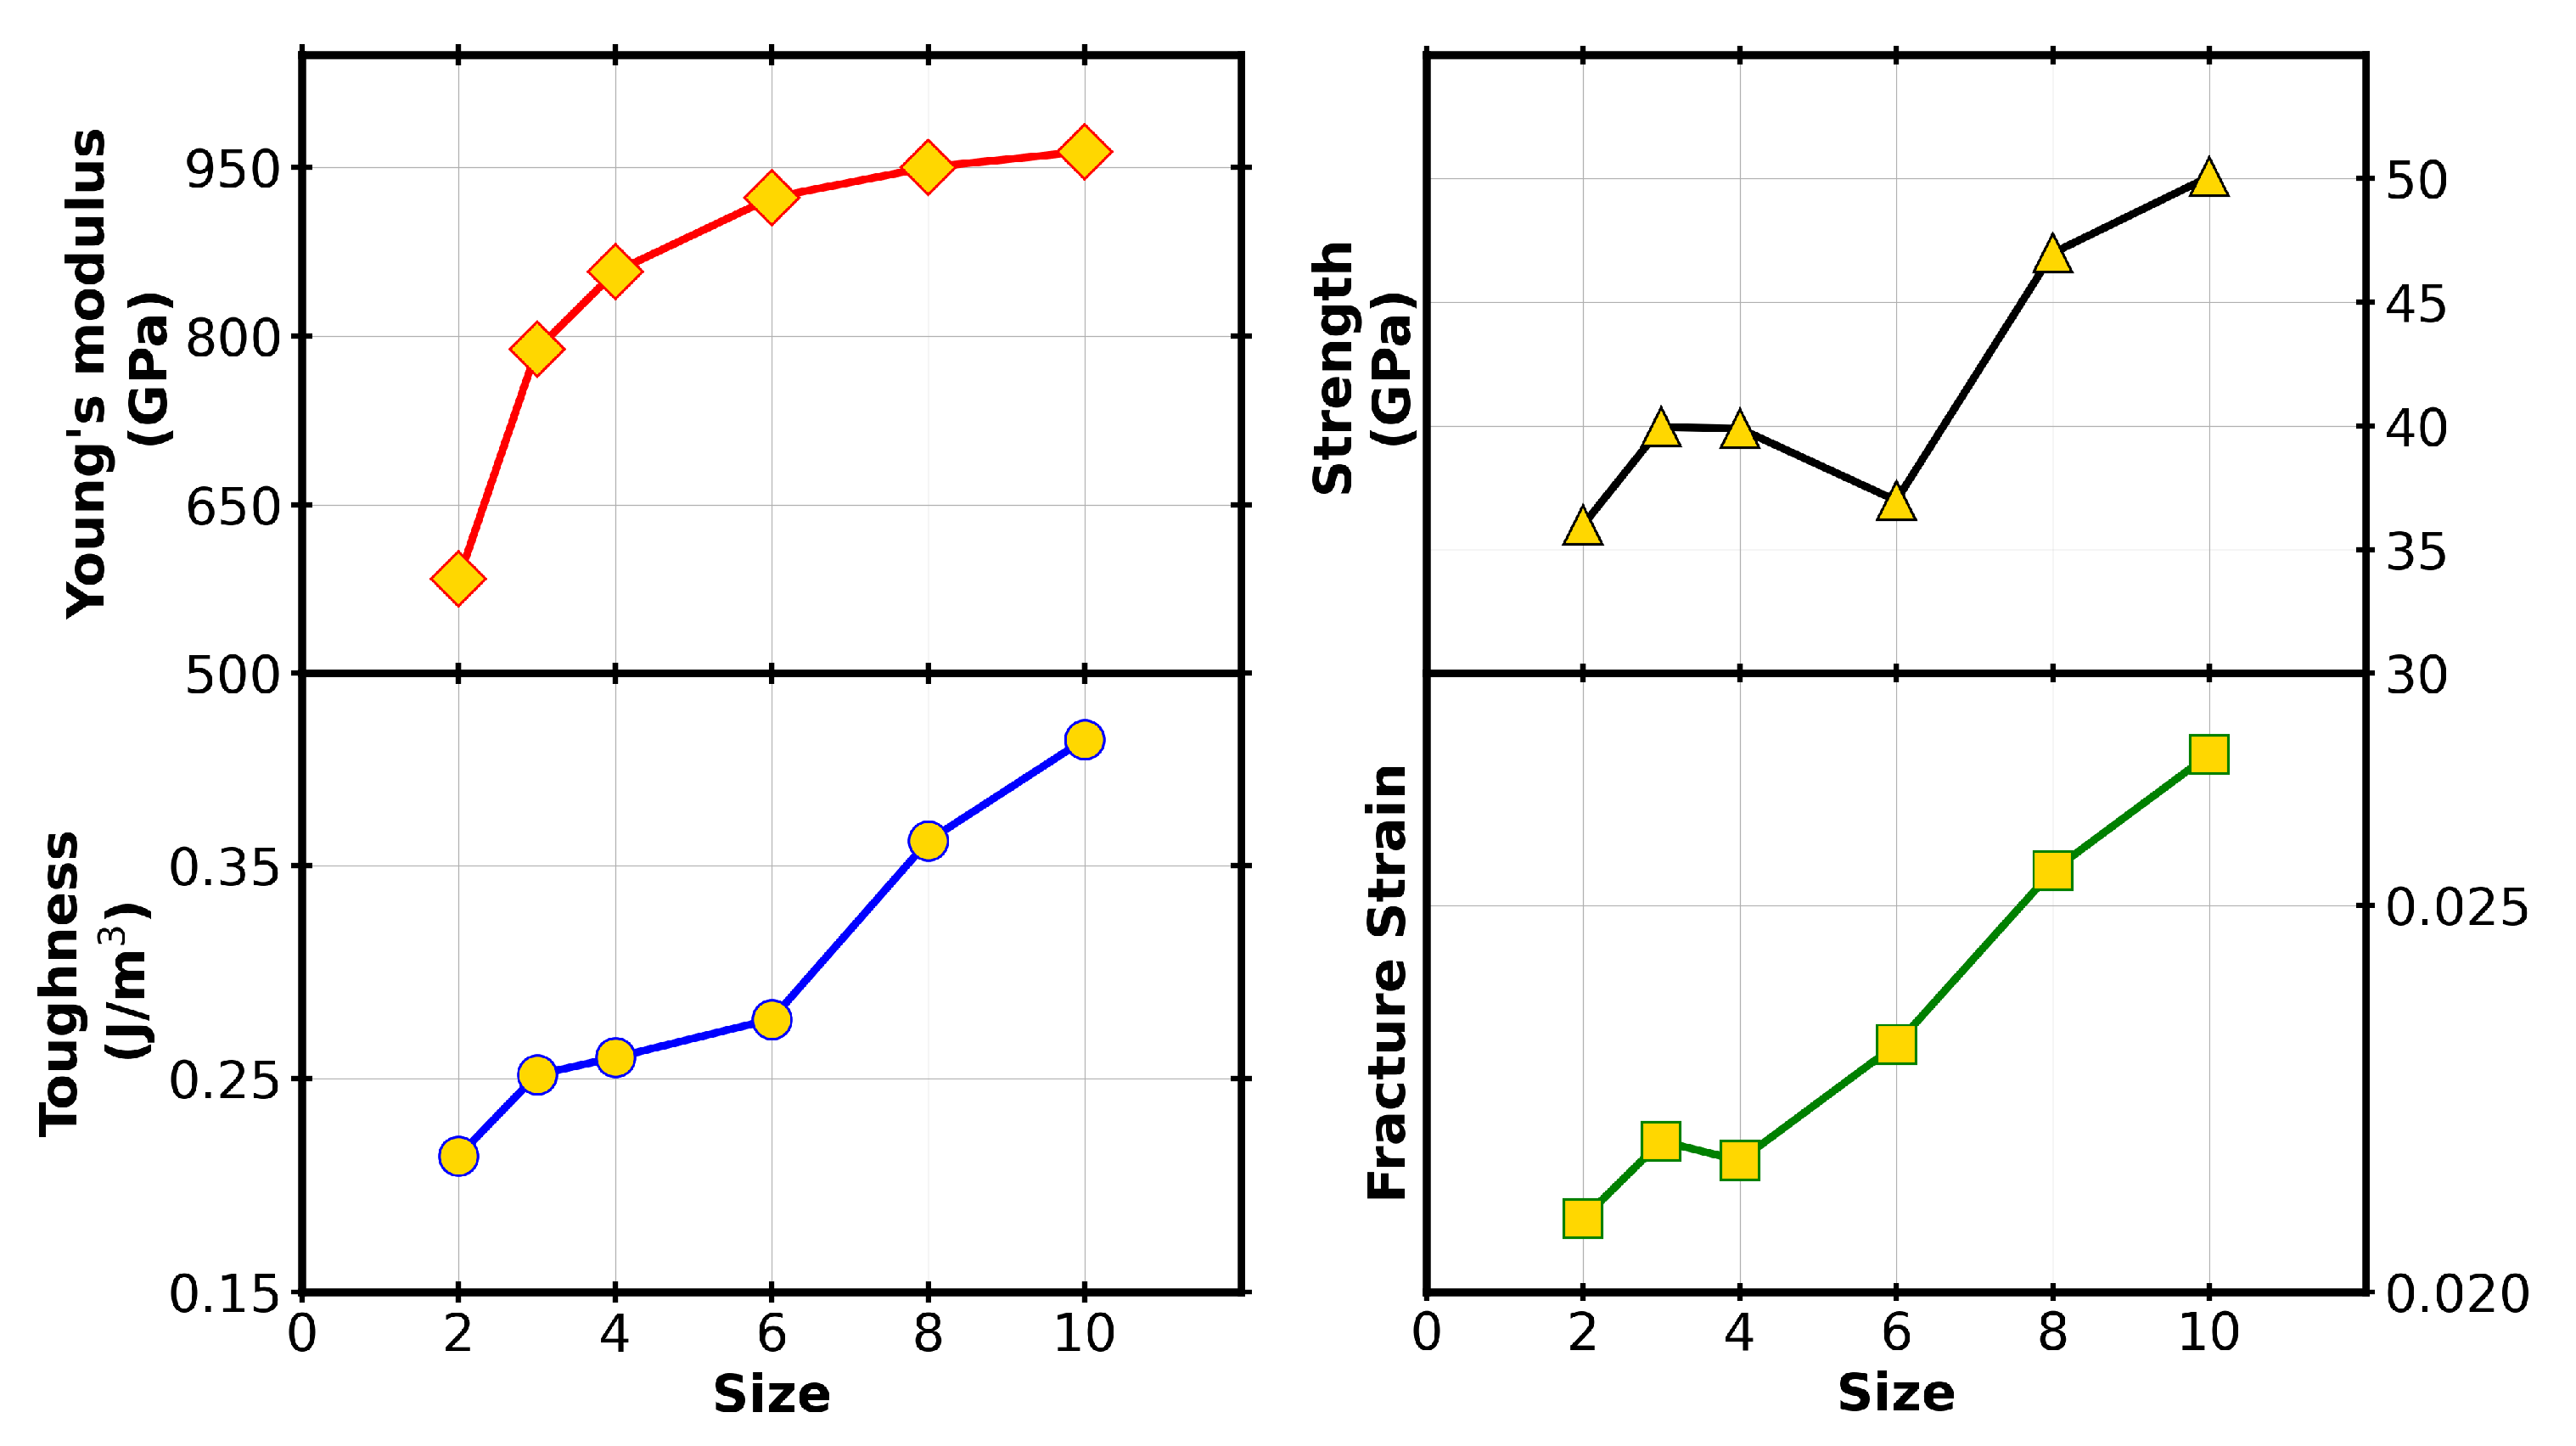
3.2. System Size Effects

The periodic boundary conditions in our simulations cause replicate image cells to interact with the simulation cell. This can drastically skew the results if our simulation size is not large enough relatively to the crack size. To analyze the effects of the simulation size, we constructed six different structures of varying sizes ranging from 2 × 2 (32,843 atoms) to 10 × 10 (832,133 atoms) while keeping a constant crack size of a 0 = 4 nm (so the full crack length is 2a 0 = 8 nm). Figure 4 illustrates the stress-strain relation in the different cell sizes. The graph indicates that sizes larger than 2 × 2 exhibit similar fracture behavior with a linear increase in stress initially followed by plastic behavior until the material fractures. The 2 × 2 system behaves erratically and we suspect that the structure is not large enough to accurately depict the tensile fracture of the tTLG structure.
Figure 5 indicates the effects of the system size on Young’s modulus (GPa), strength (GPa), toughness (J/m 3 ) and fracture strain. The Young’s modulus seems to be converging as the system size becomes larger, increasing from 584 GPa to 964 GPa, resulting in a 65% increase over our system size range. The toughness and fracture strain follow a general linear trend with the system size, increasing from 0.214 (J/m 3 ) to 0.409 (J/m 3 ), and 0.021 to 0.027, respectively. This signifies a 91.1% increase in toughness and a 28.6% increase in fracture strain for this system size range. The strength also seems to generally increase from 36.0 GPa to 50.1 GPa with a 39.1% increase. However, there is a sharp drop in strength for the 6 × 6 structure which can be treated as an anomaly. Overall, the mechanical properties tend to improve as the system size increases, which is expected as the crack size occupies a smaller space relative to the total simulation size and is projected to be closer to the values observed under pristine conditions.

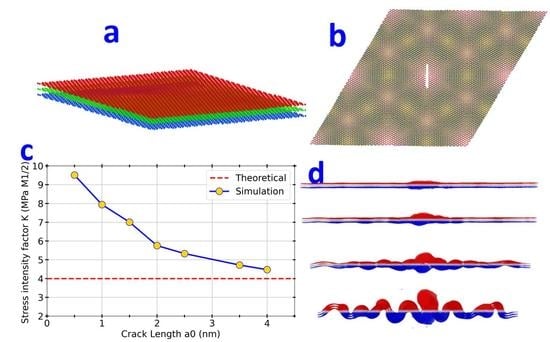
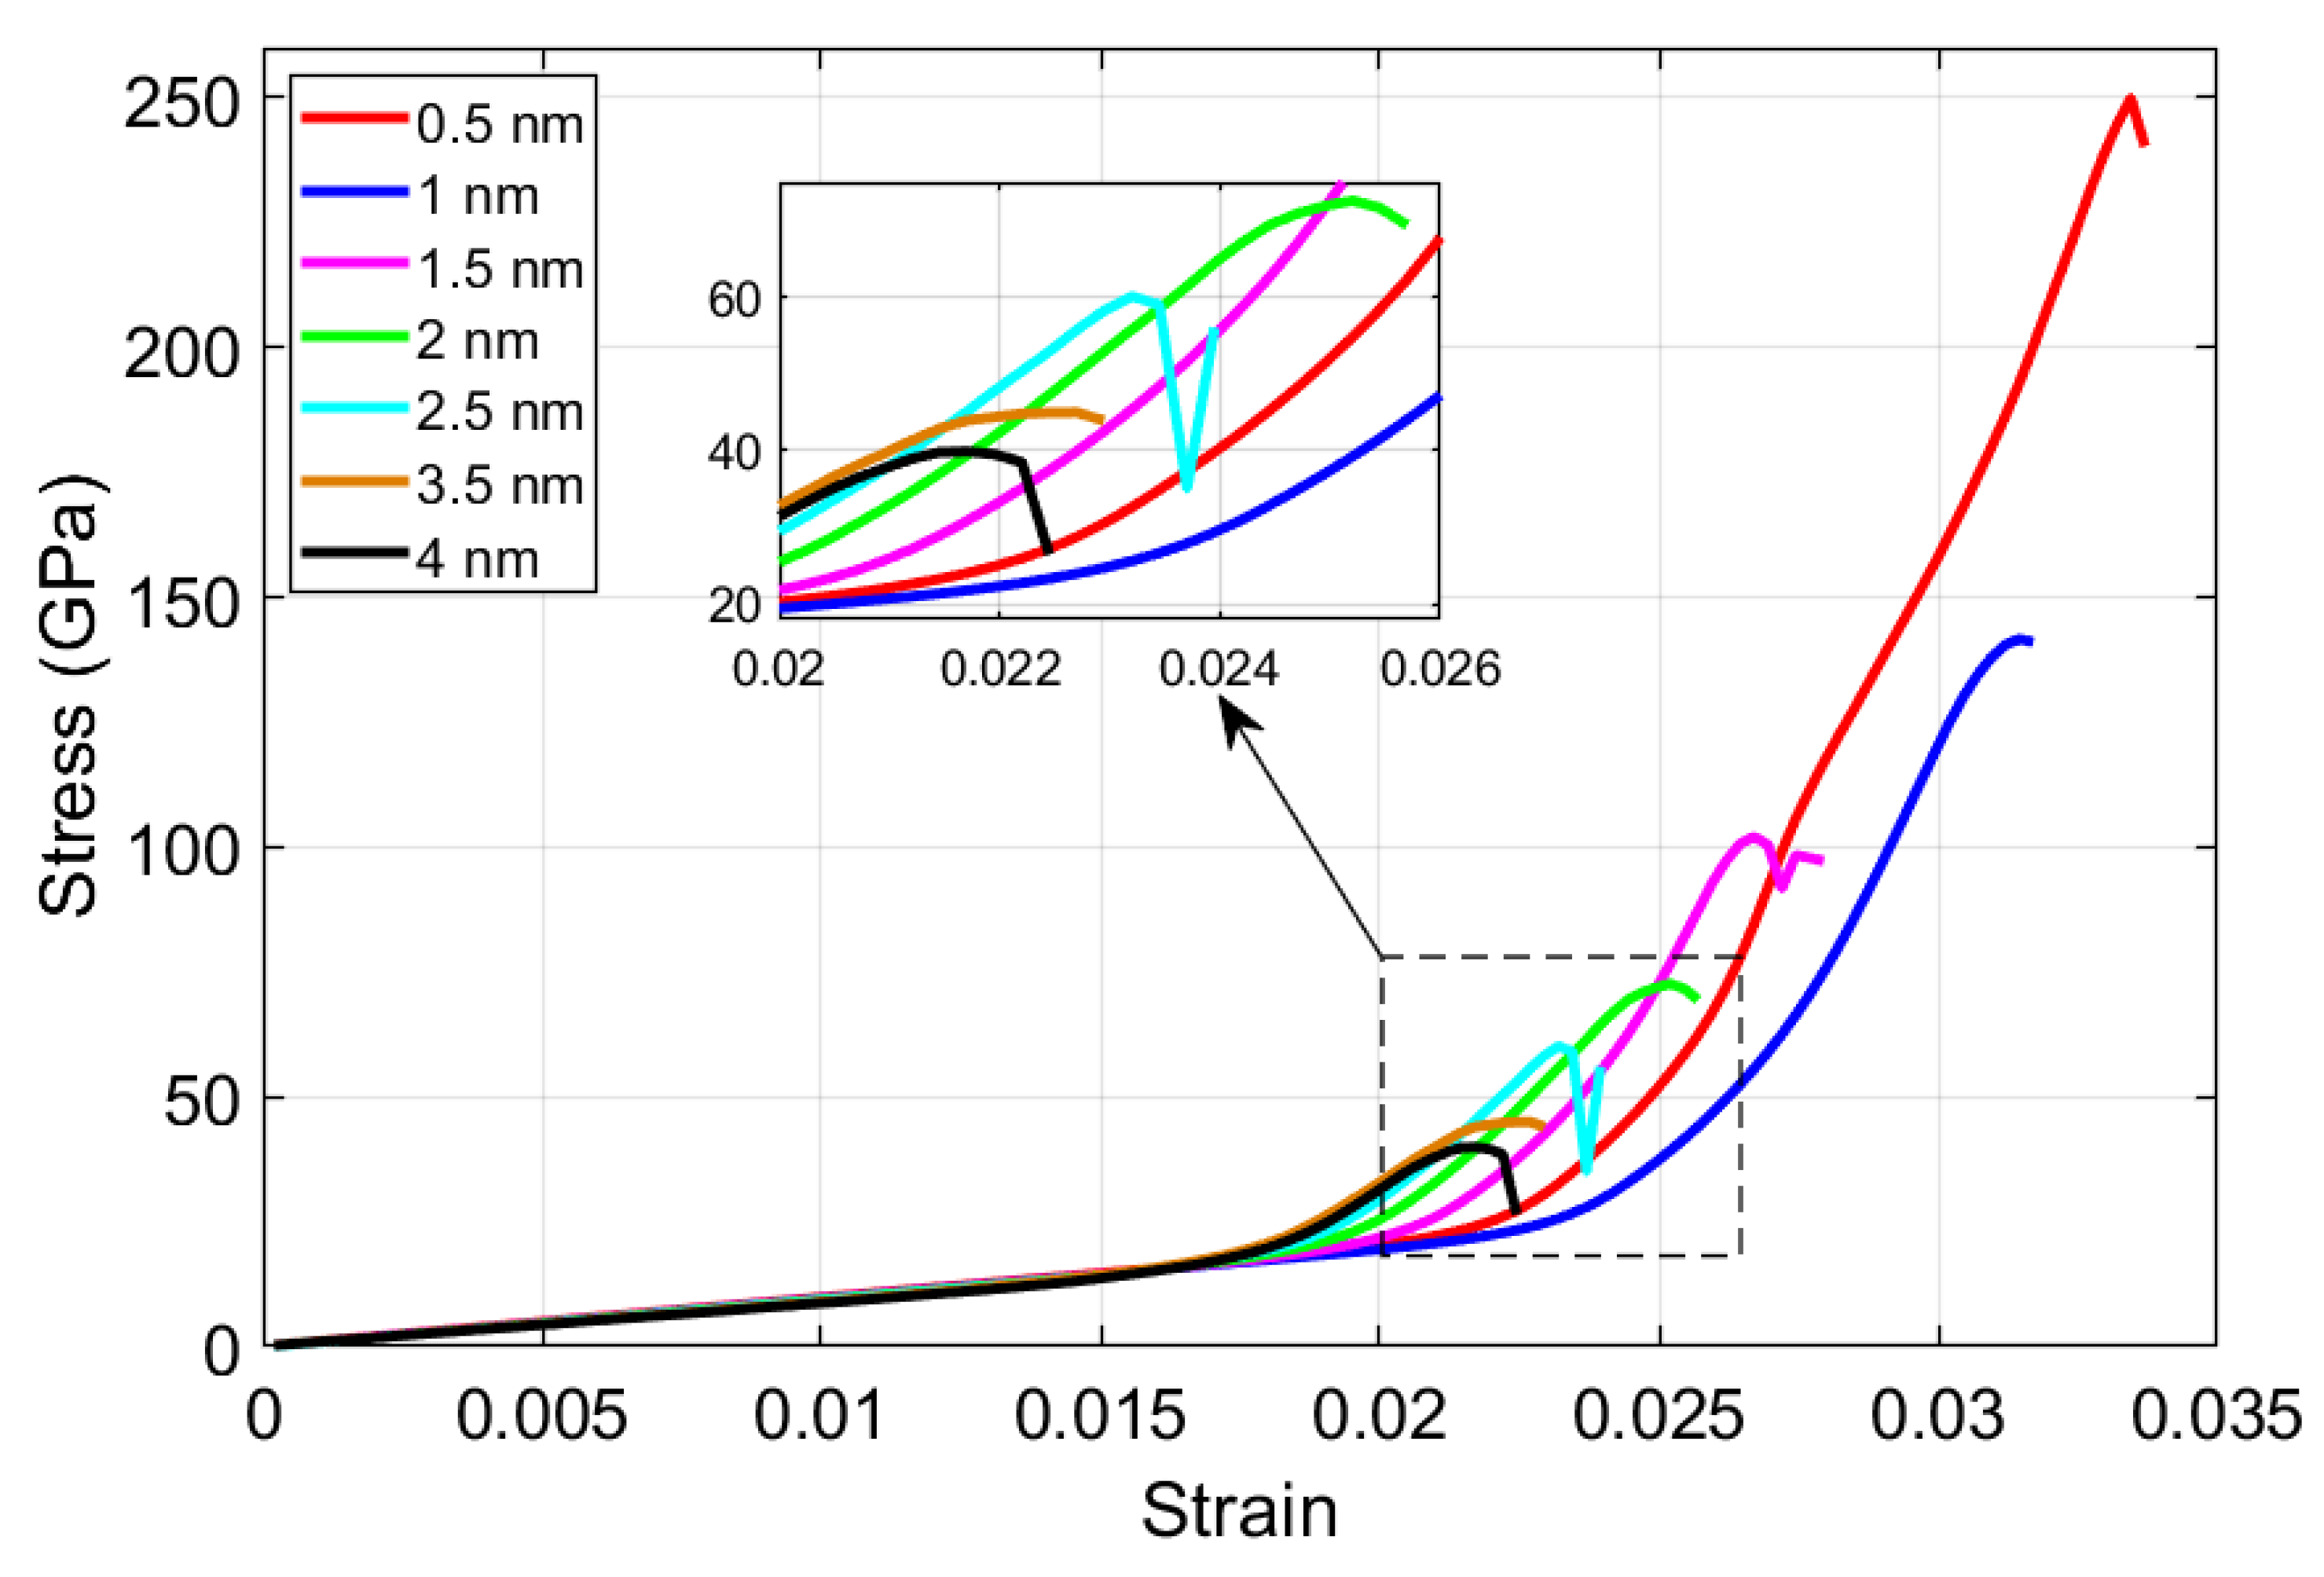
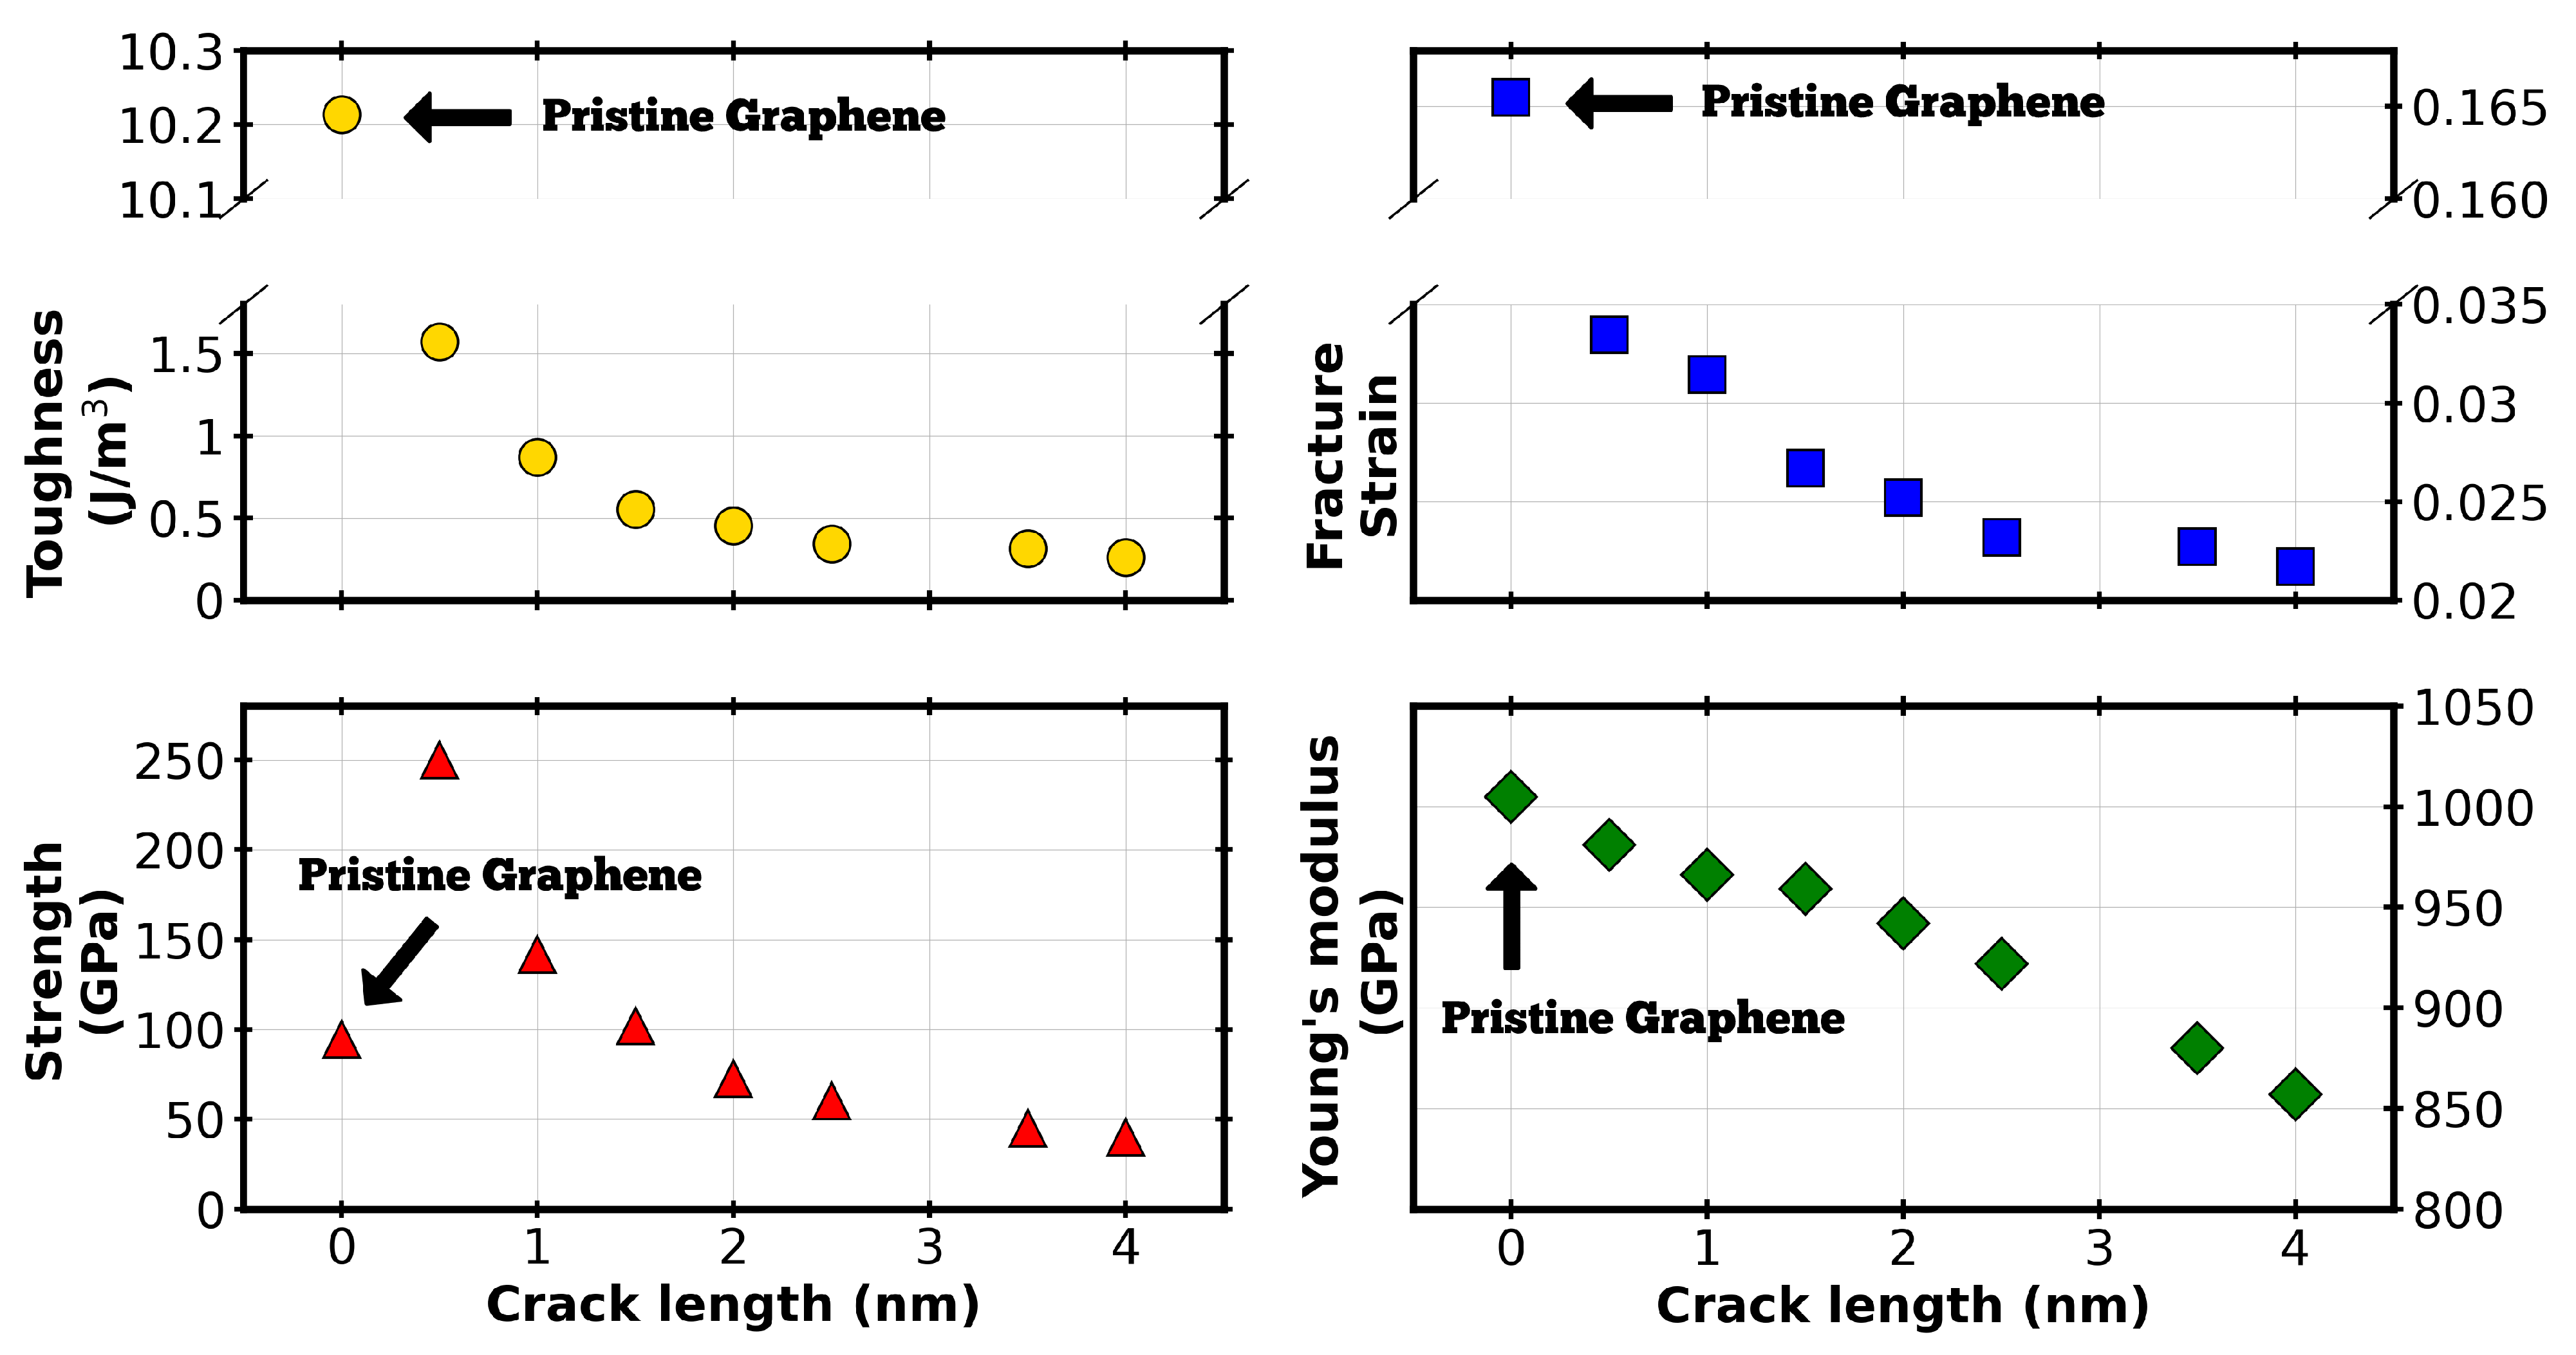
3.3. Crack Size Effect

The size of the crack plays an important role in the characteristics of a material [39,40,41,42]. In real applications, fracture properties carry great significance as cracks and defects are common in materials. Cracks also exist in various different sizes and affect mechanical properties to varying degrees. Therefore, by simulating such features, we will have a better understanding of the engineering qualities of this material. We varied the half length a 0 of the pre-crack. We generated a pre-crack in the shape of a rectangular prism with dimensions 2a 0 × 0.5 nm, where the half crack size a 0 varied from 0.5 nm to 4 nm. To evaluate the material’s Mode-I stress intensity factor, the length of the crack was perpendicular to the axis of the strain [43,44]. The tensile test was then performed uni-axially in the zig-zag direction to assess the stress-strain response of the pre-cracked structures. Our results of the stress-strain relationships of the eight structures are displayed in Figure 6 to examine the crack size effect.
The eight different structures share the same stress-strain pattern and trend: initially, the stress values linearly rise with strain, plastically deform and then abruptly fracture after reaching the maximum tensile strength. The plastic component of the stress-strain curve reduces in range as the crack length increases and the structure starts behaving in a more brittle manner. Interestingly, the plastic behavior starts at around the same strain values across the different systems, irrespectively of the crack length.
The relations between the crack length and the toughness J/m 3 , fracture strain, strength GPa and Young’s modulus GPa are demonstrated in Figure 7. The results are compared and benchmarked against pristine monolayer graphene. The toughness, fracture strain and strength appear to be converging as the crack length increases, reaching 0.26 J/m 3 , 0.0217 and 39.9 GPa at a crack length of 8 nm, respectively. The drop in these mechanical properties quantifies a reduction of 83.46% in toughness, 35.03% in strain and 84.06% in strength values over the crack length range. The toughness and fracture strain are quite low compared to pristine monolayer graphene with fracture strain values quite comparable to the values found in highly brittle materials such as silicate glasses [45]. These findings can potentially limit this material’s applicability in cases where graphene usually excels. The Young’s modulus decreases in a roughly linear manner as the crack length increases, from 981 GPa to 857 GPa, representing a 12.64% decrease. These values are quite comparable to pristine graphene’s Young’s modulus of 1005 GPa.

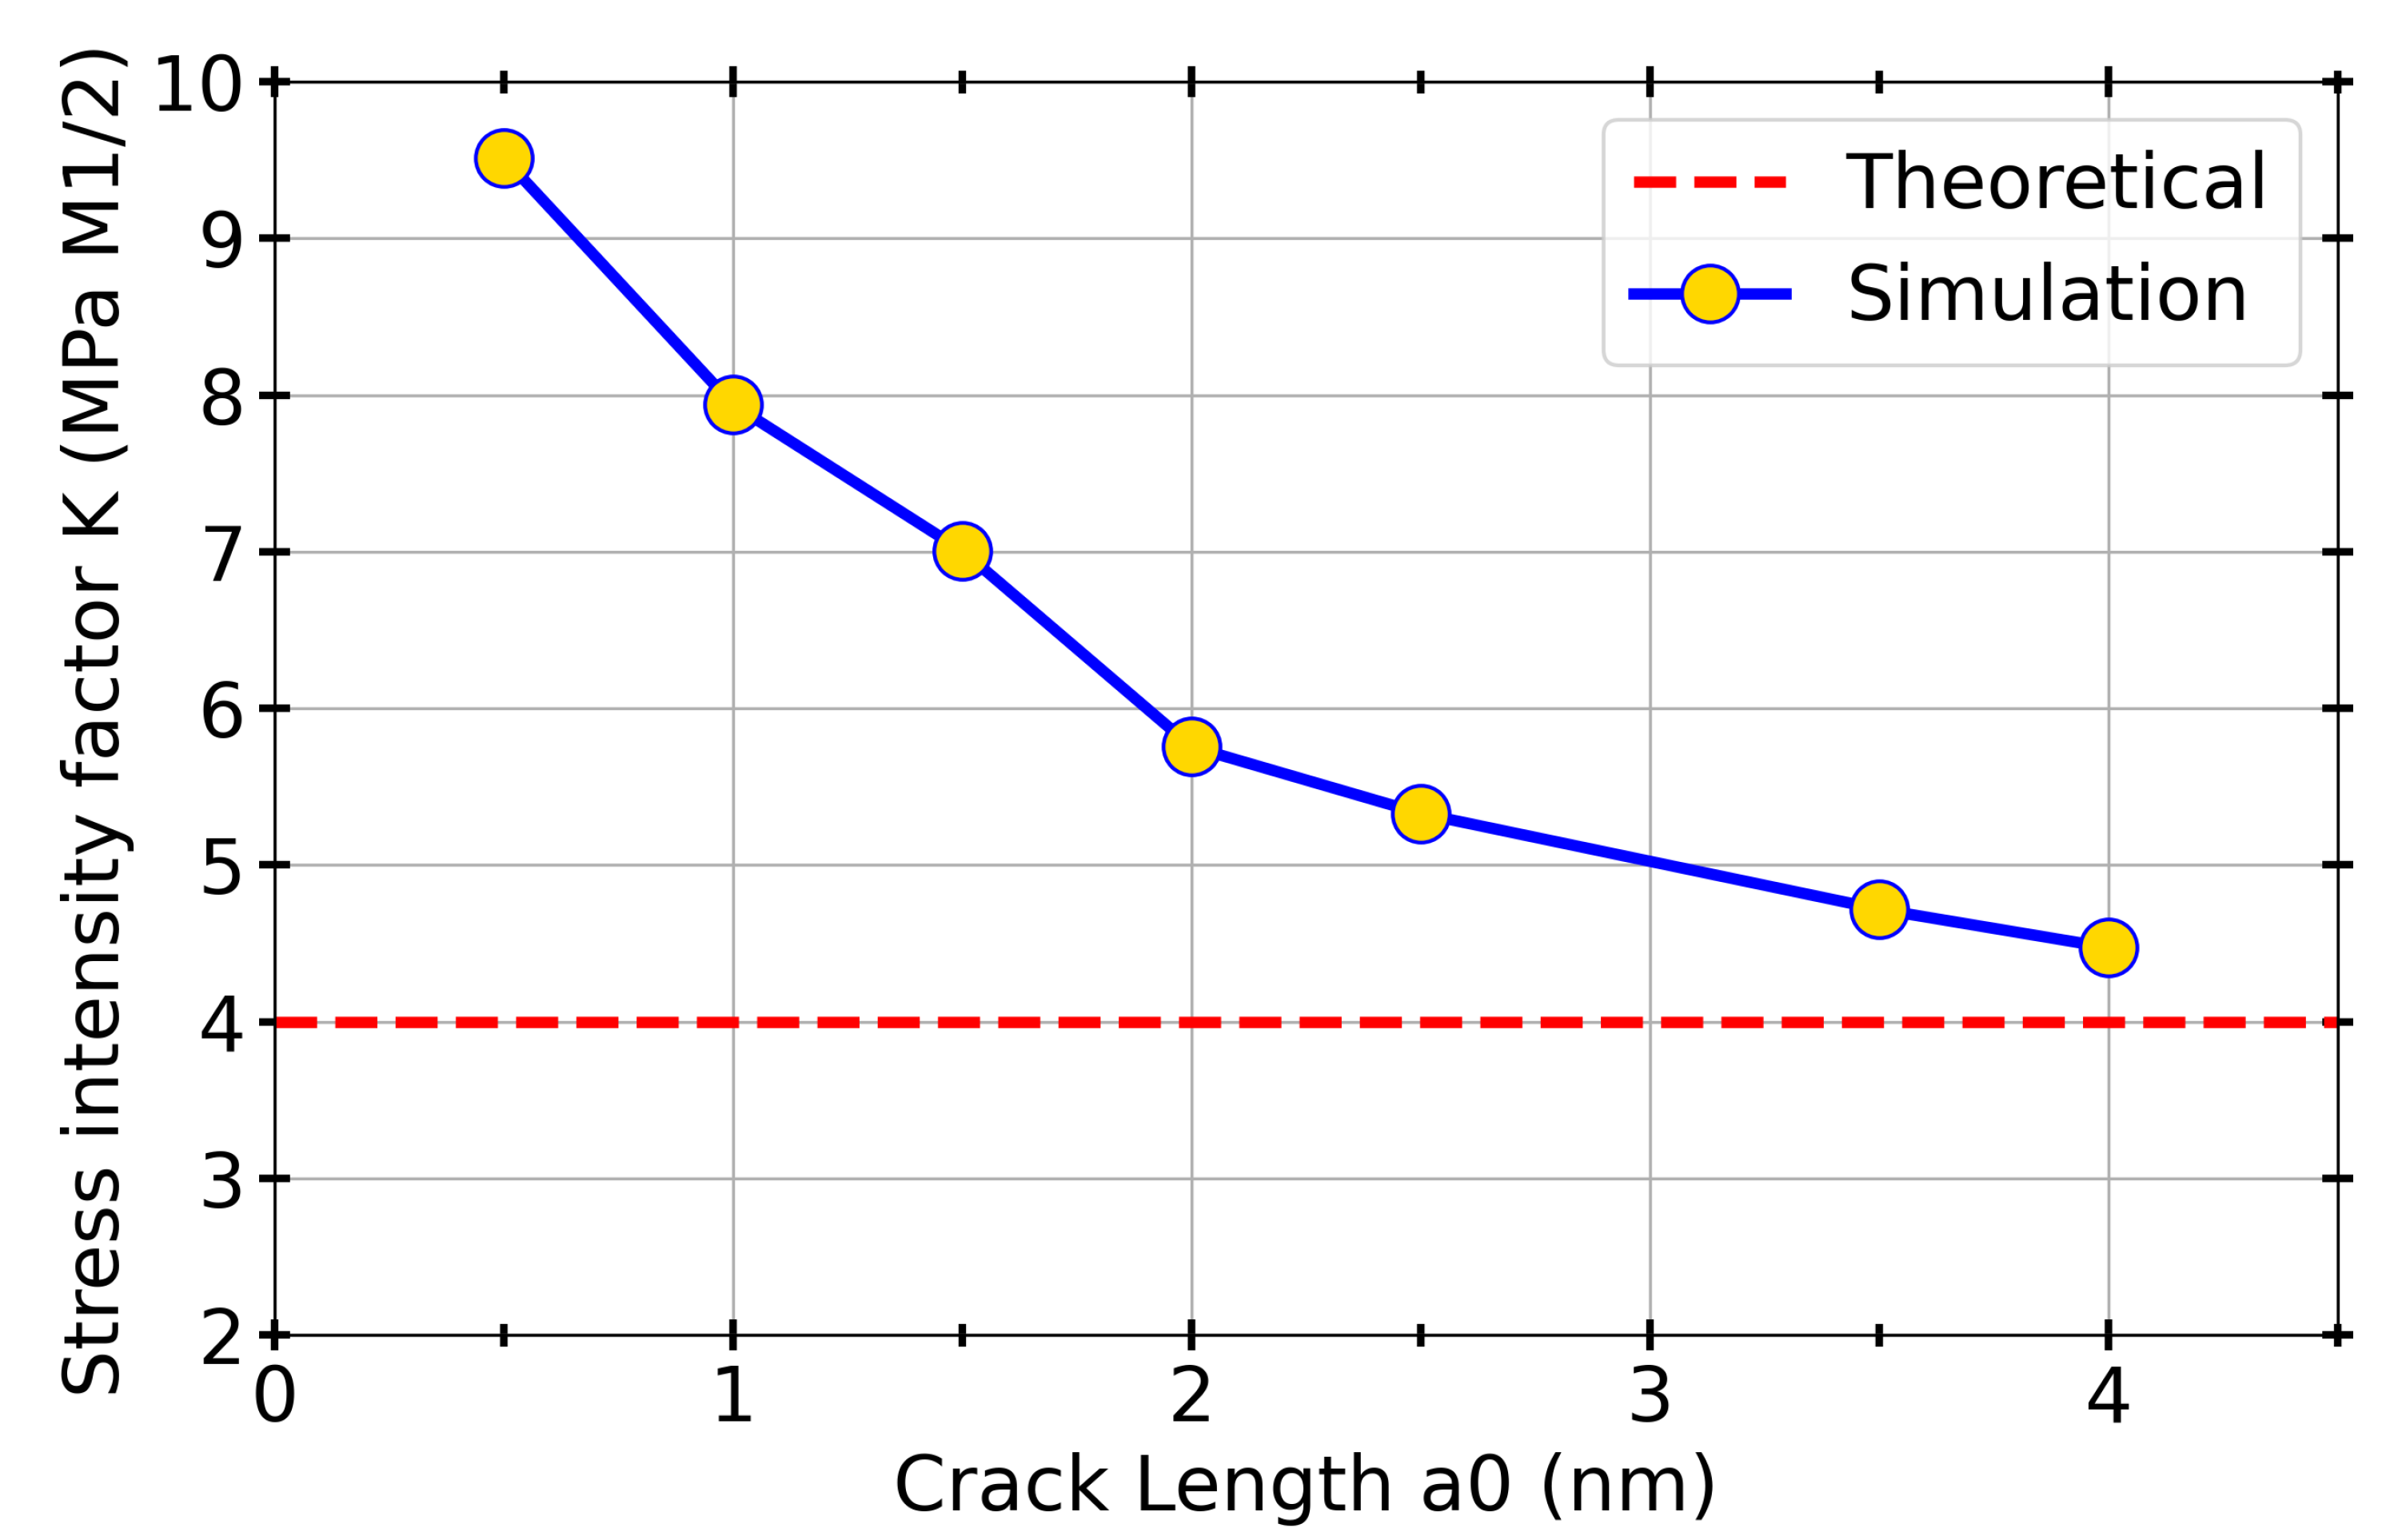
3.4. Fracture Toughness

We studied the fracture toughness of tTLG in terms of critical stress intensity factor K c under varying crack sizes. The stress intensity factor enabled us to gauge the properties and trends of tTLG under different conditions. The fracture toughness is described as an intrinsic property of a material to withstand crack growth under stress. The Griffith theory of brittle fracture was demonstrated to be applied to graphene, and thus is suitable for analyzing the fracture in our system [46]. The Griffith criterion is expressed as Equation (2) and describes the critical stress of the inception of rapid fracture. Previously, we evaluated the stress-strain response of the different structures containing a pre-crack. The results from those findings were used in the equations below to determine the critical stress intensity factor:
σ C = 2 γ s E π a 0
where γ s is the surface energy density taken as 8.0 J/m 2 [46], E is the Young’s modulus found to be approximately 1 TPa from pristine tTLG simulations, and a 0 = L/2 is the crack slit’s half-length. The stress intensity factor, which is commonly used to describe fracture toughness, is represented by the following equation:
K c = σ c π a 0
The theoretical value for K c was calculated as 4 MPa M 1 / 2 while the value obtained from our MD simulations for the longest crack length of 8 nm was found to be 4.47 MPa M 1 / 2 , which signifies a difference of 11.75%. The theoretical value was calculated using Equation (2) and the simulation value using Equation (3). The stress intensity factor was evaluated under varying crack sizes and the results were compared with the theoretical value in Figure 8. The results suggest that K c is approaching the theoretical value of 2 γ s E as the cracks become longer. This was expected as a longer crack more closely resembles the ideal Griffith crack which is characterized as long and sharp. These findings demonstrate that the Griffith theory can be applied to multilayered graphene structures. The corresponding critical strain energy release rate of a fracture, G c = σ c 2 π a o from MD is 19.98 J/m 2 , which is in relative agreement with an experimental study conducted on monolayer graphene, stating G c as 15.9 J/m 2 [46]. This is caused by the layers comprising of much stronger C-C covalent bonds than the weak van der Waals interactions observed between the layers. Hence, the addition of layers causes negligible effects to the fracture response.
Coupling numerical data with visualization is required for the complete analysis of a material’s fracture mechanics. Hence, the 8 nm cracked tTLG structure is displayed at different stages of tensile loading in Figure 9. After equilibrium, the initial structure (a) comprises of interlayer bonds around the crack boundaries as the carbon atoms reach a more stable configuration due to the removal of atoms forming the crack. Wrinkle formation is observed in (c) which coincides with the start of the material’s plastic behavior. This topological wrinkling phenomenon is well documented to also exist in other graphene systems [47,48,49,50,51]. The amplitude of the wrinkles increase with strain as the crack propagates in the direction of the crack length until the material fractures at a strain of 0.022 (d). This trend of strain-correlated corrugation was also observed in monolayer and bilayer graphene, and has been demonstrated to influence their electronic and chemical properties [52,53,54,55]. The same fracture mechanism is observed in all the other samples tested consisting of different crack lengths, system sizes and strain rates.
The interlayer interactions play a key role in the characteristics of the material. The presence of sp 3 bonding between the layers has been shown to have a minor negative impact on the Young’s modulus, ultimate tensile strength and the facture strain, while significantly increasing the interlayer shear modulus and load transfer rate, resulting in higher axial compression stability [56]. Mirparizi et al. demonstrated that interlayer shear interactions have also a considerable effect on the vibrational behavior of bilayer graphene and increase the material’s natural frequencies by restricting lateral displacements [57]. Figure 10 shows carbon atoms near the crack site after equilibrium (a and b) and just before failure (c and d) from a top-down and side view. Interlayer sp 3 bonding was observed near the crack site and increased in spatial density as the structure approached failure. The ductile fracture behavior identified in our system is similarly connected to a higher interlayer bonding density [19].

4. Conclusions

We investigated the mechanical properties of pre-crack twisted trilayer graphene via molecular dynamics simulations. The pre-crack tTLG graphene systems exhibited a rapid brittle fracture behavior with toughness and fracture strain values which were orders of magnitude lower than that of monolayer graphene and on par with those observed in highly brittle silicate glass materials. Similarly, the fracture stress was found to be roughly half of that the intrinsic strength of graphene, whereas the Young’s modulus was favorable with values relatively close to pristine graphene. The mechanical properties seem to be converging at longer crack lengths apart from the Young’s modulus. The fracture toughness described by the critical stress intensity factor K c was consistent with the theoretical results with a difference of only 11.75% using the Griffith equations. Interestingly, the associated critical strain energy release rate of fracture G c was found to be in good agreement with G c values of monolayer graphene [46]. Overall, this study demonstrated the applicability of Griffith criteria for multilayer graphene systems and characterized the fracture response of tTLG, which could be helpful in determining the viability of the material for various applications.

Author Contributions

Conceptualization, Q.P.; methodology, H.S. and Q.P.; simulation and data analysis, H.S.; writing–original draft preparation, H.S.; writing–review and editing, Q.P. and A.Q.A.; supervision, Q.P. and A.Q.A.; funding acquisition, Q.P. All authors have read and agreed to the published version of the manuscript.

Funding

We would like to acknowledge the support provided by the Deanship of Scientific Research (DSR) at King Fahd University of Petroleum & Minerals (KFUPM) through project DF201020.

Data Availability Statement

The datasets generated during and/or analyzed during the current study are available from the corresponding author on reasonable request.

Acknowledgments

We would like to acknowledge the computing resources of the Supercomputing Laboratory at King Abdullah University of Science Technology (KAUST) in Thuwal, Saudi Arabia.

Conflicts of Interest

The authors declare no conflict of interest.

References

  1. Lee, C.; Wei, X.; Kysar, J.W.; Hone, J. Measurement of the elastic properties and intrinsic strength of monolayer graphene. Science 2008, 321, 385–388. [Google Scholar] [CrossRef]
  2. Huang, Y.; Li, X.; Cui, H.; Zhou, Z. Bi-layer Graphene: Structure, Properties, Preparation and Prospects. Curr. Graphene Sci. 2019, 2, 97–105. [Google Scholar] [CrossRef]
  3. Carr, S.; Massatt, D.; Fang, S.; Cazeaux, P.; Luskin, M.; Kaxiras, E. Twistronics: Manipulating the electronic properties of two-dimensional layered structures through their twist angle. Phys. Rev. B 2017, 95, 075420. [Google Scholar] [CrossRef] [Green Version]
  4. Bistritzer, R.; MacDonald, A.H. Moiré bands in twisted double-layer graphene. Proc. Natl. Acad. Sci. USA 2011, 108, 12233–12237. [Google Scholar] [CrossRef] [PubMed] [Green Version]
  5. Morell, E.S.; Correa, J.; Vargas, P.; Pacheco, M.; Barticevic, Z. Flat bands in slightly twisted bilayer graphene: Tight-binding calculations. Phys. Rev. B 2010, 82, 121407. [Google Scholar] [CrossRef] [Green Version]
  6. Cao, Y.; Fatemi, V.; Fang, S.; Watanabe, K.; Taniguchi, T.; Kaxiras, E.; Jarillo-Herrero, P. Unconventional superconductivity in magic-angle graphene superlattices. Nature 2018, 556, 43–50. [Google Scholar] [CrossRef]
  7. Chen, G.; Sharpe, A.L.; Gallagher, P.; Rosen, I.T.; Fox, E.J.; Jiang, L.; Lyu, B.; Li, H.; Watanabe, K.; Taniguchi, T.; et al. Signatures of tunable superconductivity in a trilayer graphene moiré superlattice. Nature 2019, 572, 215–219. [Google Scholar] [CrossRef]
  8. Lu, X.; Stepanov, P.; Yang, W.; Xie, M.; Aamir, M.A.; Das, I.; Urgell, C.; Watanabe, K.; Taniguchi, T.; Zhang, G.; et al. Superconductors, orbital magnets and correlated states in magic-angle bilayer graphene. Nature 2019, 574, 653–657. [Google Scholar] [CrossRef]
  9. Uri, A.; Grover, S.; Cao, Y.; Crosse, J.A.; Bagani, K.; Rodan-Legrain, D.; Myasoedov, Y.; Watanabe, K.; Taniguchi, T.; Moon, P.; et al. Mapping the twist-angle disorder and Landau levels in magic-angle graphene. Nature 2020, 581, 47–52. [Google Scholar] [CrossRef]
  10. Stepanov, P.; Das, I.; Lu, X.; Fahimniya, A.; Watanabe, K.; Taniguchi, T.; Koppens, F.H.; Lischner, J.; Levitov, L.; Efetov, D.K. Untying the insulating and superconducting orders in magic-angle graphene. Nature 2020, 583, 375–378. [Google Scholar] [CrossRef]
  11. Peng, Q.; Peng, S.; Cao, Q. Ultrahigh Ballistic Resistance of Twisted Bilayer Graphene. Crystals 2021, 11, 206. [Google Scholar] [CrossRef]
  12. An, L.; Cai, X.; Pei, D.; Huang, M.; Wu, Z.; Zhou, Z.; Lin, J.; Ying, Z.; Ye, Z.; Feng, X.; et al. Interaction effects and superconductivity signatures in twisted double-bilayer WSe 2. Nanoscale Horiz. 2020, 5, 1309–1316. [Google Scholar] [CrossRef] [PubMed]
  13. Sharpe, A.L.; Fox, E.J.; Barnard, A.W.; Finney, J.; Watanabe, K.; Taniguchi, T.; Kastner, M.; Goldhaber-Gordon, D. Emergent ferromagnetism near three-quarters filling in twisted bilayer graphene. Science 2019, 365, 605–608. [Google Scholar] [CrossRef] [PubMed] [Green Version]
  14. Hao, Z.; Zimmerman, A.; Ledwith, P.; Khalaf, E.; Najafabadi, D.H.; Watanabe, K.; Taniguchi, T.; Vishwanath, A.; Kim, P. Electric field–tunable superconductivity in alternating-twist magic-angle trilayer graphene. Science 2021, 371, 1133–1138. [Google Scholar] [CrossRef] [PubMed]
  15. Park, J.M.; Cao, Y.; Watanabe, K.; Taniguchi, T.; Jarillo-Herrero, P. Tunable strongly coupled superconductivity in magic-angle twisted trilayer graphene. Nature 2021, 590, 249–255. [Google Scholar] [CrossRef]
  16. Morell, E.S.; Pacheco, M.; Chico, L.; Brey, L. Electronic properties of twisted trilayer graphene. Phys. Rev. B 2013, 87, 125414. [Google Scholar] [CrossRef] [Green Version]
  17. Zhu, Z.; Carr, S.; Massatt, D.; Luskin, M.; Kaxiras, E. Twisted trilayer graphene: A precisely tunable platform for correlated electrons. Phys. Rev. Lett. 2020, 125, 116404. [Google Scholar] [CrossRef]
  18. Shi, Y.; Xu, S.; Ezzi, M.M.A.; Balakrishnan, N.; Garcia-Ruiz, A.; Tsim, B.; Mullan, C.; Barrier, J.; Xin, N.; Piot, B.A.; et al. Tunable van Hove singularities and correlated states in twisted trilayer graphene. arXiv 2020, arXiv:2004.12414. [Google Scholar]
  19. Cao, Q.; Geng, X.; Wang, H.; Wang, P.; Liu, A.; Lan, Y.; Peng, Q. A review of current development of graphene mechanics. Crystals 2018, 8, 357. [Google Scholar] [CrossRef] [Green Version]
  20. Peng, Q.; Chen, X.J.; Ji, W.; De, S. Chemically tuning mechanics of graphene by BN. Adv. Eng. Mater. 2013, 15, 718–727. [Google Scholar] [CrossRef]
  21. Peng, Q.; Zamiri, A.; Ji, W.; De, S. Elastic Properties of Hybrid Graphene/Boron Nitride Monolayer. Acta Mech. 2012, 223, 2591–2596. [Google Scholar] [CrossRef] [Green Version]
  22. Peng, Q.; Liang, C.; Ji, W.; De, S. A theoretical analysis of the effect of the hydrogenation of graphene to graphane on its mechanical properties. Phys. Chem. Chem. Phys. 2013, 15, 2003–2011. [Google Scholar] [CrossRef] [PubMed]
  23. Peng, Q.; De, S. Mechanical properties and instabilities of ordered graphene oxide C6O monolayers. RSC Adv. 2013, 3, 24337–24344. [Google Scholar] [CrossRef]
  24. Peng, Q.; Meng, F.; Yang, Y.; Lu, C.; Deng, H.; Wang, L.; De, S.; Gao, F. Shockwave generates <100> dislocation loops in bcc iron. Nat. Commun. 2018, 9, 4880. [Google Scholar] [CrossRef]
  25. Deng, B.; Hou, J.; Zhu, H.; Liu, S.; Liu, E.; Shi, Y.; Peng, Q. The normal-auxeticity mechanical phase transition in graphene. 2D Mater. 2017, 4, 021020. [Google Scholar] [CrossRef]
  26. Plimpton, S. Fast parallel algorithms for short-range molecular dynamics. J. Comput. Phys. 1995, 117, 1–19. [Google Scholar] [CrossRef] [Green Version]
  27. Xie, L.; Sun, T.; He, C.; An, H.; Qin, Q.; Peng, Q. Effect of angle, temperature and vacancy defects on mechanical properties of psi-graphene. Crystals 2019, 9, 238. [Google Scholar] [CrossRef] [Green Version]
  28. Zheng, S.; Cao, Q.; Liu, S.; Peng, Q. Atomic structure and mechanical properties of twisted bilayer graphene. J. Compos. Sci. 2019, 3, 2. [Google Scholar] [CrossRef] [Green Version]
  29. Zhang, X.; Zhang, J.; Yang, M. Molecular dynamics study on the thermal conductivity of bilayer graphene with nitrogen doping. Solid State Commun. 2020, 309, 113845. [Google Scholar] [CrossRef]
  30. Zhang, X.; Chen, Z.; Chen, H.; Xu, L. Comparative studies of thermal conductivity for bilayer graphene with different potential functions in molecular dynamic simulations. Res. Phys. 2021, 22, 103894. [Google Scholar] [CrossRef]
  31. Guinea, F.; Walet, N.R. Continuum models for twisted bilayer graphene: Effect of lattice deformation and hopping parameters. Phys. Rev. B 2019, 99, 205134. [Google Scholar] [CrossRef] [Green Version]
  32. Mattsson, T.; Lane, J.M.D.; Cochrane, K.; Desjarlais, M.; Thompson, A.; Pierce, F.; Grest, G. First-principles and classical molecular dynamics simulation of shocked polymers. Phys. Rev. B 2010, 81, 054103. [Google Scholar] [CrossRef]
  33. Peng, Q.; Chen, Z.; De, S. A Density Functional Theory Study of the Mechanical Properties of Graphane with van der Waals Corrections. Mech. Adv. Mater. Struct. 2015, 22, 717–721. [Google Scholar] [CrossRef]
  34. Peng, Q.; Wang, G.; Liu, G.; De, S. Van der Waals Density Functional Theory vdW-DFq for Semihard Materials. Crystals 2019, 9, 243. [Google Scholar] [CrossRef] [Green Version]
  35. O’Connor, T.; Andzelm, J.; Robbins, M. AIREBO-M: A reactive model for hydrocarbons at extreme pressures. J. Chem. Phys. 2015, 142, 024903. [Google Scholar] [CrossRef] [PubMed]
  36. Brenner, D.; Shenderova, O.; Harrison, J.; Stuart, S.; Ni, B.; Sinnott, S. A Second-Generation Reactive Empirical Bond Order (REBO) Potential Energy Expression for Hydrocarbons. J. Phys. Condens. Matter 2002, 14, 783–802. [Google Scholar] [CrossRef]
  37. Hou, J.; Deng, B.; Zhu, H.; Lan, Y.; Shi, Y.; De, S.; Liu, L.; Chakraborty, P.; Gao, F.; Peng, Q. Magic auxeticity angle of graphene. Carbon 2019, 149, 350–354. [Google Scholar] [CrossRef] [Green Version]
  38. Liu, A.; Peng, Q. A molecular dynamics study of the mechanical properties of twisted bilayer graphene. Micromachines 2018, 9, 440. [Google Scholar] [CrossRef] [Green Version]
  39. Wang, M.; Yan, C.; Ma, L.; Hu, N.; Chen, M. Effect of defects on fracture strength of graphene sheets. Comput. Mater. Sci. 2012, 54, 236–239. [Google Scholar] [CrossRef] [Green Version]
  40. Chai, P.; Li, S.; Li, Y.; Liang, L.; Yin, X. Mechanical Behavior Investigation of 4H-SiC Single Crystal at the Micro–Nano Scale. Micromachines 2020, 11, 102. [Google Scholar] [CrossRef] [Green Version]
  41. Han, C.C.; He, P.F.; Zheng, B.l. Numerical Simulation of the Effect of Crack on the Tensile Mechanical Properties of Graphene. In Proceedings of the 2012 Third International Conference on Digital Manufacturing Automation, Guilin, China, 31 July–2 August 2012; pp. 562–565. [Google Scholar] [CrossRef]
  42. Datta, D.; Nadimpalli, S.; Li, Y.; Shenoy, V. Effect of crack length and orientation on the mixed-mode fracture behavior of graphene. Extrem. Mech. Lett. 2015, 5, 10–17. [Google Scholar] [CrossRef]
  43. Cartwright, D.; Rooke, D. Evaluation of stress intensity factors. J. Strain Anal. 1975, 10, 217–224. [Google Scholar] [CrossRef]
  44. Liu, M.; Gan, Y.; Hanaor, D.; Liu, B.; Chen, C. An improved semi-analytical solution for stress at round-tip notches. Eng. Fract. Mech. 2015, 149, 134–143. [Google Scholar] [CrossRef]
  45. Yu, Y.; Wang, B.; Lee, Y.; Bauchy, M. Fracture Toughness of Silicate Glasses: Insights from Molecular Dynamics Simulations. MRS Proc. 2015, 1757, 47–58. [Google Scholar] [CrossRef] [Green Version]
  46. Zhang, P.; Ma, L.; Fan, F.; Zeng, Z.; Peng, C.; Loya, P.E.; Liu, Z.; Gong, Y.; Zhang, J.; Zhang, X.; et al. Fracture toughness of graphene. Nat. Commun. 2014, 5, 3782. [Google Scholar] [CrossRef] [Green Version]
  47. Deng, S.; Berry, V. Wrinkled, rippled and crumpled graphene: An overview of formation mechanism, electronic properties, and applications. Mater. Today 2015, 19, 197–212. [Google Scholar] [CrossRef]
  48. Shen, X.; Lin, X.; Yousefi, N.; Jia, J.; Kim, J.K. Wrinkling in graphene sheets and graphene oxide papers. Carbon 2014, 66, 84–92. [Google Scholar] [CrossRef]
  49. Pacakova, B.; Verhagen, T.; Bousa, M.; Hübner, U.; Vejpravova, J.; Kalbác, M.; Frank, O. Mastering the Wrinkling of Self-supported Graphene. Sci. Rep. 2017, 7, 10003. [Google Scholar] [CrossRef]
  50. Zhao, C.; Liu, F.; Kong, X.; Yan, T.; Ding, F. The wrinkle formation in graphene on transition metal substrate: A molecular dynamics study. Int. J. Smart Nano Mater. 2020, 11, 277–287. [Google Scholar] [CrossRef]
  51. Wang, C.; Lan, L.; Tan, H. The physics of wrinkling in graphene membranes under local tension. Phys. Chem. Chem. Phys. 2013, 15, 2764–2773. [Google Scholar] [CrossRef]
  52. Wang, C.; Liu, Y.; Lan, L.; Tan, H. Graphene wrinkling: Formation, evolution and collapse. Nanoscale 2013, 5, 4454–4461. [Google Scholar] [CrossRef] [PubMed]
  53. Thiemann, F.L.; Rowe, P.; Zen, A.; Müller, E.A.; Michaelides, A. Defect-Dependent Corrugation in Graphene. Nano Lett. 2021, in press. [Google Scholar] [CrossRef] [PubMed]
  54. Rossi, A.; Piccinin, S.; Pellegrini, V.; de Gironcoli, S.; Tozzini, V. Nano-Scale Corrugations in Graphene: A Density Functional Theory Study of Structure, Electronic Properties and Hydrogenation. J. Phys. Chem. C 2015, 119, 7900–7910. [Google Scholar] [CrossRef]
  55. Ho, S.C.; Chang, C.H.; Hsieh, Y.C.; Lo, S.T.; Huang, B.; Vu, T.H.Y.; Ortix, C.; Chen, T.M. Hall effects in artificially corrugated bilayer graphene without breaking time-reversal symmetry. Nat. Electron. 2021, 4, 116–125. [Google Scholar] [CrossRef]
  56. Zhang, Y.; Wang, C.; Cheng, Y.; Xiang, Y. Mechanical properties of bilayer graphene sheets coupled by sp3 bonding. Carbon 2011, 49, 4511–4517. [Google Scholar] [CrossRef]
  57. Mirparizi, M.; Aski, F. Interlayer shear effect on vibrational behavior of bilayer graphene using the molecular mechanics simulation. Propuls. Power Res. 2016, 5, 250–260. [Google Scholar] [CrossRef] [Green Version]
Figure 1. A schematic plot of the twisted tri-layer graphene (tTLG) structure with a twist angle θ .
Crystals 11 01202 g001
Figure 2. (a) Pristine tTLG structure; and (b) cracked tTLG structure (top view).
Crystals 11 01202 g002
Figure 3. A typical process of system equilibration. The temperature and pressure fluctuate to achieve equilibrium at approximately 10 ps. The target temperature is T = 300 K, and the target pressure is P = 0.0001 GPa. The timestep is 0.001 ps.
Crystals 11 01202 g003
Figure 4. Size effects on stress-strain relationships under the condition of temperature T = 300 K, pressure P = 0.0001 GPa, strain rate 1 × 10 9 s 1 , and crack length 2a 0 = 8 nm.
Crystals 11 01202 g004
Figure 5. Size effects on mechanical properties under the condition of temperature T = 300 K, pressure P = 0.0001 GPa, strain rate 1 × 10 9 s 1 , and crack length 2a 0 = 8 nm.
Crystals 11 01202 g005
Figure 6. Crack size effect on the stress-strain relationship: A rectangular crack is generated in tTLG before tensile simulations under the conditions of temperature T = 300 K, pressure P = 0.0001 GPa, system size 4 × 4, and strain rate 1 × 10 9 s 1 .
Crystals 11 01202 g006
Figure 7. Crack length effect on mechanical parameters under conditions of temperature T = 300 K, pressure P = 0.0001 GPa, strain rate = 1 × 10 9 s 1 , and size = 4 × 4 (31.35 nm × 36.20 nm).
Crystals 11 01202 g007
Figure 8. Crack length a 0 effects on fracture toughness. The tensile simulations are performed under the parameters of temperature T = 300 K; pressure P = 0.0001 GPa; strain rate = 1 × 10 9 s 1 .
Crystals 11 01202 g008
Figure 9. Fracture mechanics of brittle fracture in twisted trilayer graphene with a pre-crack: (A) structure of 4 nm pre-crack tTLG; (B) stress-strain response of 4 nm pre-crack tTLG; (C) top-down view of the fracture at different stages; (D) side view of the fracture at different stages; During the tensile, we have four snapshots of the selected 4 stage: (a) strain = 0; (b) strain = 0.012; (c) strain = 0.017; (d) strain = 0.022. The tensile simulation is under the following conditions: temperature T = 300 K, pressure P = 0.0001 GPa, strain rate = 1 × 10 9 s 1 , and crack length (2a 0 ) = 8 nm.
Crystals 11 01202 g009
Figure 10. Crack site: (a) top-down view, strain = 0; (b) side view, strain = 0; (c) top-down view, strain = 0.019; (d) side view, strain = 0.019. The conditions of the tensile simulation are follows: temperature T = 300 K, pressure P = 0.0001 GPa, strain rate = 1 × 10 9 s 1 , crack length (2a 0 ) = 8 nm.
Crystals 11 01202 g010
Publisher’s Note: MDPI stays neutral with regard to jurisdictional claims in published maps and institutional affiliations.

