Brief Report

Morphological: Optical, and Mechanical Characterizations of Non-Activated and Activated Nanocomposites of SG and MWCNTs

King Abdulaziz City for Science and Technology (KACST), Riyadh 11442, Saudi Arabia
*
Author to whom correspondence should be addressed.
Crystals 2021, 11(11), 1280; https://doi.org/10.3390/cryst11111280
Submission received: 7 September 2021 / Revised: 16 October 2021 / Accepted: 20 October 2021 / Published: 22 October 2021

Abstract

:
Nanocomposites of silica gel (SG) and multiwalled carbon nanotubes (MWCNTs) of relatively low concentrations (0.25, 0.50, and 0.75 wt%) were characterized before and after annealing. Adsorption is a surface phenomenon, and based on this, the morphology of the composites was investigated by scanning electron microscopy (SEM). The produced images show that the MWCNTs were embedded into the silica gel base material. Fourier transform infrared (FTIR) transmittance spectroscopy showed that MWCNTs were not functionalized within the matrix of silica gel and MWCNT composites. However, after annealing the composites at 400 °C for 4 h in air, evidence of activation was observed in the FTIR spectrum. The effects of the embedding of MWCNTs on porosity, specific surface area, and pore size distribution were studied using Raman spectroscopy. The Raman spectra of the prepared composites were mainly dominated by characteristic sharp scattering peaks of the silica gel at 480, 780, and 990 cm−1 and a broad band centered at 2100 cm−1. The scattering peaks of MWCNTs were not well pronounced, as the homogeneity of the composite is always questionable. Nanosizer analysis showed that at 0.25 wt%, the distribution of MWCNTs within the silica gel was optimal. Vickers hardness measurements showed that the hardness increased with the increasing weight percent of MWCNTs within the composite matrix, while annealing enhanced the mechanical properties of the composites. Further studies are required to investigate the pore structure of silica gel within the matrix of MWCNTs to be deployed for efficient cooling and water purification applications.

Graphical Abstract

1. Introduction

The identity of the discoverers of carbon nanotubes (CNT) is a subject of some controversy. For years, scientists assumed that Sumio Iijima had discovered CNTs in 1991 [1], however, researchers had repeatedly reported their observation of CNTs and Multi Walled Carbon Nanotubes (MWCNTs) for decades, going all the way back to 1952 [2,3]. CNTs were first synthesized by the members of the Institute of Physical chemistry and Electrochemistry of Russian Academy of Sciences, Radushkevich and Lukyanovich [2]. The contribution of Iijima was significant, as the main properties of CNT were systematically investigated by his research group, where they observed MWCNTs as a by product of fullerene synthesis and investigated their characteristics using various techniques, including TEM [3].
CNTs have played a crucial role and have been widely utilized in a range of scientific disciplines, including chemistry, materials science, electrical engineering, and physics. The potential applications of CNTs have been investigated extensively, as they are appealing for a variety of technological and scientific areas [4,5]. Multiwalled carbon nanotubes (MWCNTs) are now becoming increasingly attractive from a practical point of view, due to their greater diameter and reduced strain in addition to their economic value. Moreover, they have superior mechanical properties, electrical conductivity [4], and high heat transfer performance [6]; based on these properties, they have been deemed appropriate for use as reinforcing fillers for high-performance polymer nanocomposites [7,8].
Silica gel is one of the most common porous materials used in commercial adsorption chillers because it has a porous structure and is nontoxic, nonpolluting, and abundant [6,7]. It has been observed that introducing MWCNTs, with their high surface area along with other physical properties, to the porous structure of SiO2 results in the enhanced adsorbing performance of cooling chillers [8]. Additionally, it is worth mentioning that nanosilica (nano-SiO2) has outstanding qualities such as its tiny particle diameter, higher surface area, and consequently higher activity and superior mechanical properties [9,10].
It is of great interest to study the morphology of MWCNT/SiO2 composites, and several studies have presented their observations on the physical structures of prepared composites [11,12] using SEM. SEM micrographs showed that MWCNT/SiO2 composites accumulate spherical structures with an average diameter of 226 nm. Energy-dispersive X-ray spectroscopy (EDX) was used to determine the elemental proportions of the composites, whereby MWCNT/SiO2 nanocomposites were found to be composed of oxygen (51.38 wt%), silicon (40.74 wt%), and carbon (8.18 wt%). Fourier transform infrared transmittance spectroscopy (FTIR) was used to investigate the structural properties of MWCNTs and MWCNT/SiO2. More detailed SEM investigations [12,13,14] have reported that the majority of MWCNTs tend to interweave with one another; however, the surface characteristics of SiO2/MWCNTs are distinct. Moreover, multiple SiO2 nanoparticles are densely and consistently dispersed on the surface of MWCNTs, significantly improving the roughness of the surface.
The EDX data of various MWCNTs demonstrate that, when they are coated with a nano-SiO2 layer, the C content is dramatically reduced, but the O and Si content is increased, as predicted. Raman spectroscopy was used to better characterize the surface properties of MWCNTs and SiO2/MWCNTs. The characteristic scattering Raman bands of carbonaceous materials, namely the D-band and G-band, were observed at approximately 1343 and 1580 cm−1, respectively. All of the results indicated that the modification method has a reasonably benign effect on the ordered crystal structure of MWCNTs and is advantageous for the preservation of their superior mechanical capabilities [15]. Functionalizing MWCNTs has been part of SEM studies [16], which have shown a uniform coating of amorphous SiO2 [17] with a thickness of 10 nm. Additionally, elemental mapping of the composites using EDX showed signals of C, Si, and O, which demonstrates that SiO2 is uniformly deposited onto MWCNTs. It has been observed that MWCNT/SiO2 disperses well in water, whereas pristine MWCNTs settle to the bottom [16].
The current study was conducted as part of an ongoing effort to characterize silica gel composites, where the lowest studied concentration of MWCNTs previously studied was 1 wt%. However, this study looks closely at the effect of relatively low concentrations of the nano-additives of MWCNTs (0.25, 0.5, and 0.75 wt%), thereby avoiding the accumulation of MWCNTs observed in previous studies. The morphology and optical properties, along with the effect of annealing on the mechanical properties, were determined to investigate the possible functioning of the composites. The study will allow us to determine how to further employ the current composites or, otherwise, develop an efficient cooling system and other related applications.

2. Chemicals and Methodology

The average width was about 100 nm, and more than 75% of the particles were around 10 to 20 µm with an aspect ratio of more than three, 12–16 nm in diameter and the carbon purity of approximately 90%. The nanotube compounds are generated by merging MWCNTs in a silica gel matrix at three weight percentages (0.25, 0.50, and 0.75 wt%). This produces translucent nanotube compounds following gelation. When treated at 7.7 GPa pressure and 25 °C, this results in compounds that are thick and tough, with no crack formation. Such an approach was earlier described in some detail by de Andrade et al. [18]. Here, the materials were characterized using scanning electron microscopy (SEM) along with energy-dispersive X-ray spectroscopy (EDX), Fourier transform infrared spectroscopy (FTIR), Raman spectroscopy (RS), zeta potential (ZP) analysis, and microhardness testing. Annealing was carried out at 400 °C for 4 h in an air environment in a Carbolite annealing furnace (Chamber Furnace CWF 1200, Cambridge, UK), whereby the rate of temperature increase was 20 °C/min, and the cooling rate was sensibly slow at less than 2 °C/min.

2.1. Materials: Silica Gel (SG) and Multiwalled Carbon Nanotubes (MWCNTs)

Granules of Fuji RD silica gel were purchased from Fuji Silysia Chemical Ltd. (Kasugai Aichi, Japan) and had the specifications described in Table 1. Multiwalled carbon nanotubes (MWCNTs) were obtained from (SkySpring Nanomaterials Inc., Leeds, UK) (product #0553CA, Lot #0553–090916). The purity of the MWCNTs was above 95%, with average diameters ranging between 10 and 20 nm.

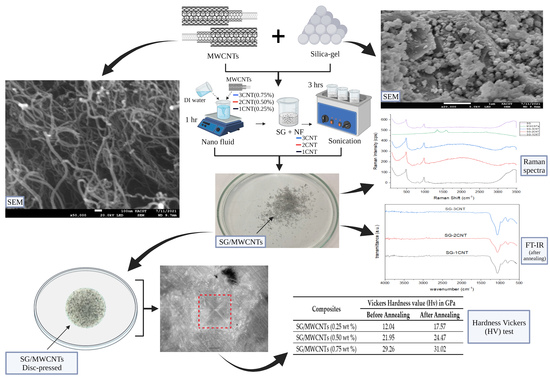
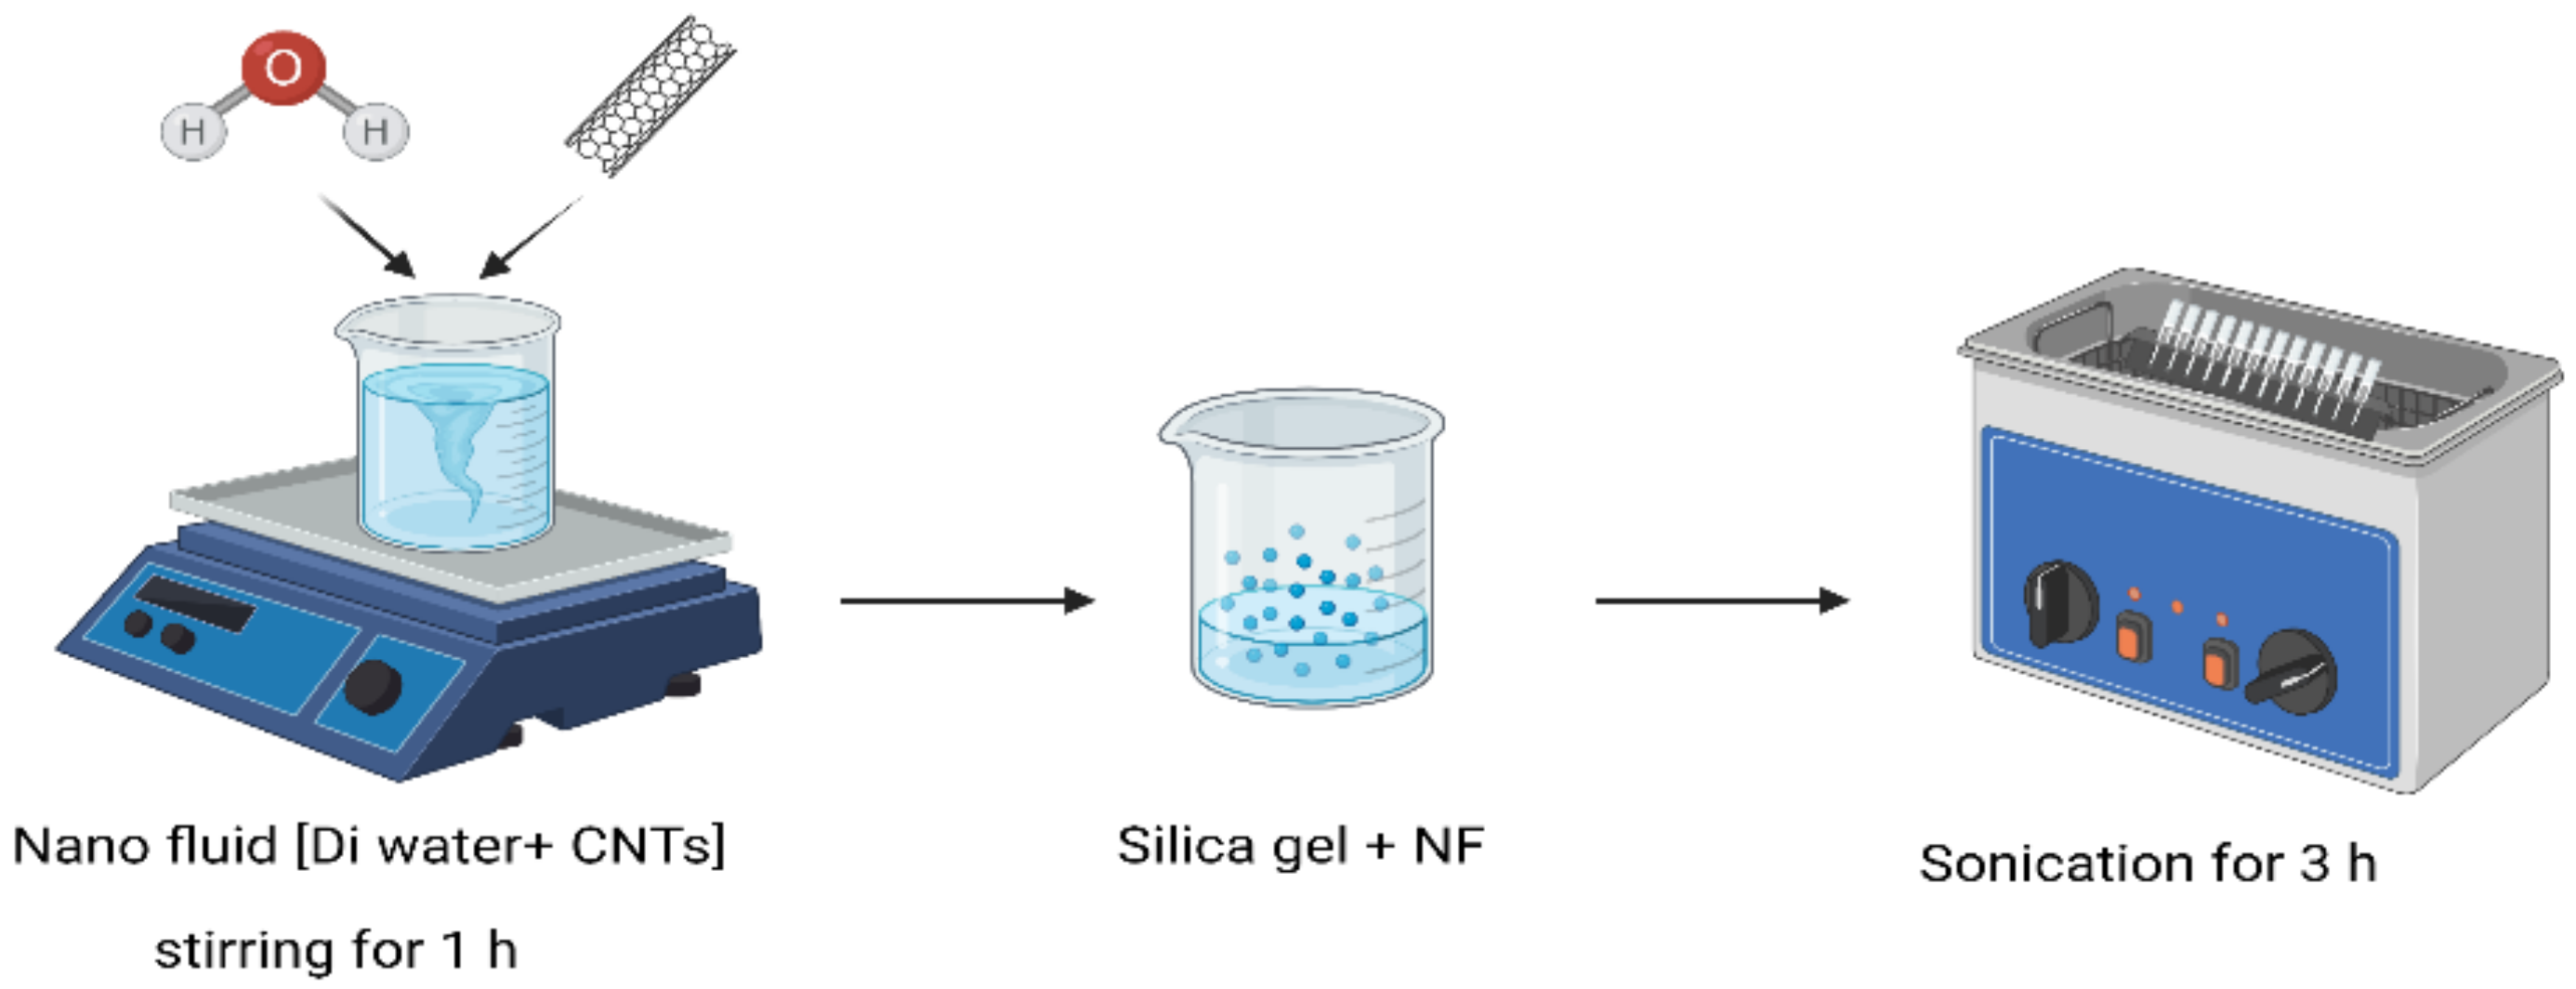
2.2. Preparation of SG with MWCNTs Using Mechanical Dispersion

Silica gel/MWCNT composites were prepared by adding MWCNTs to silica gel using the mechanical dispersion method [19]. The samples were prepared with different fractions of nanoparticles, corresponding to 0.25% (SG-1CNT), 0.5% (SG-2CNT), and 0.75% (SG-3CNT) by mass (Table 2). Different proportions of MWCNTs were weighed and added to deionized water. Magnetic stirring was applied for 1 h, and the nanofluid was then added directly to the silica gel, followed by sonication for 3 h (Figure 1).

3. Characterization Tools, Results, and Discussion

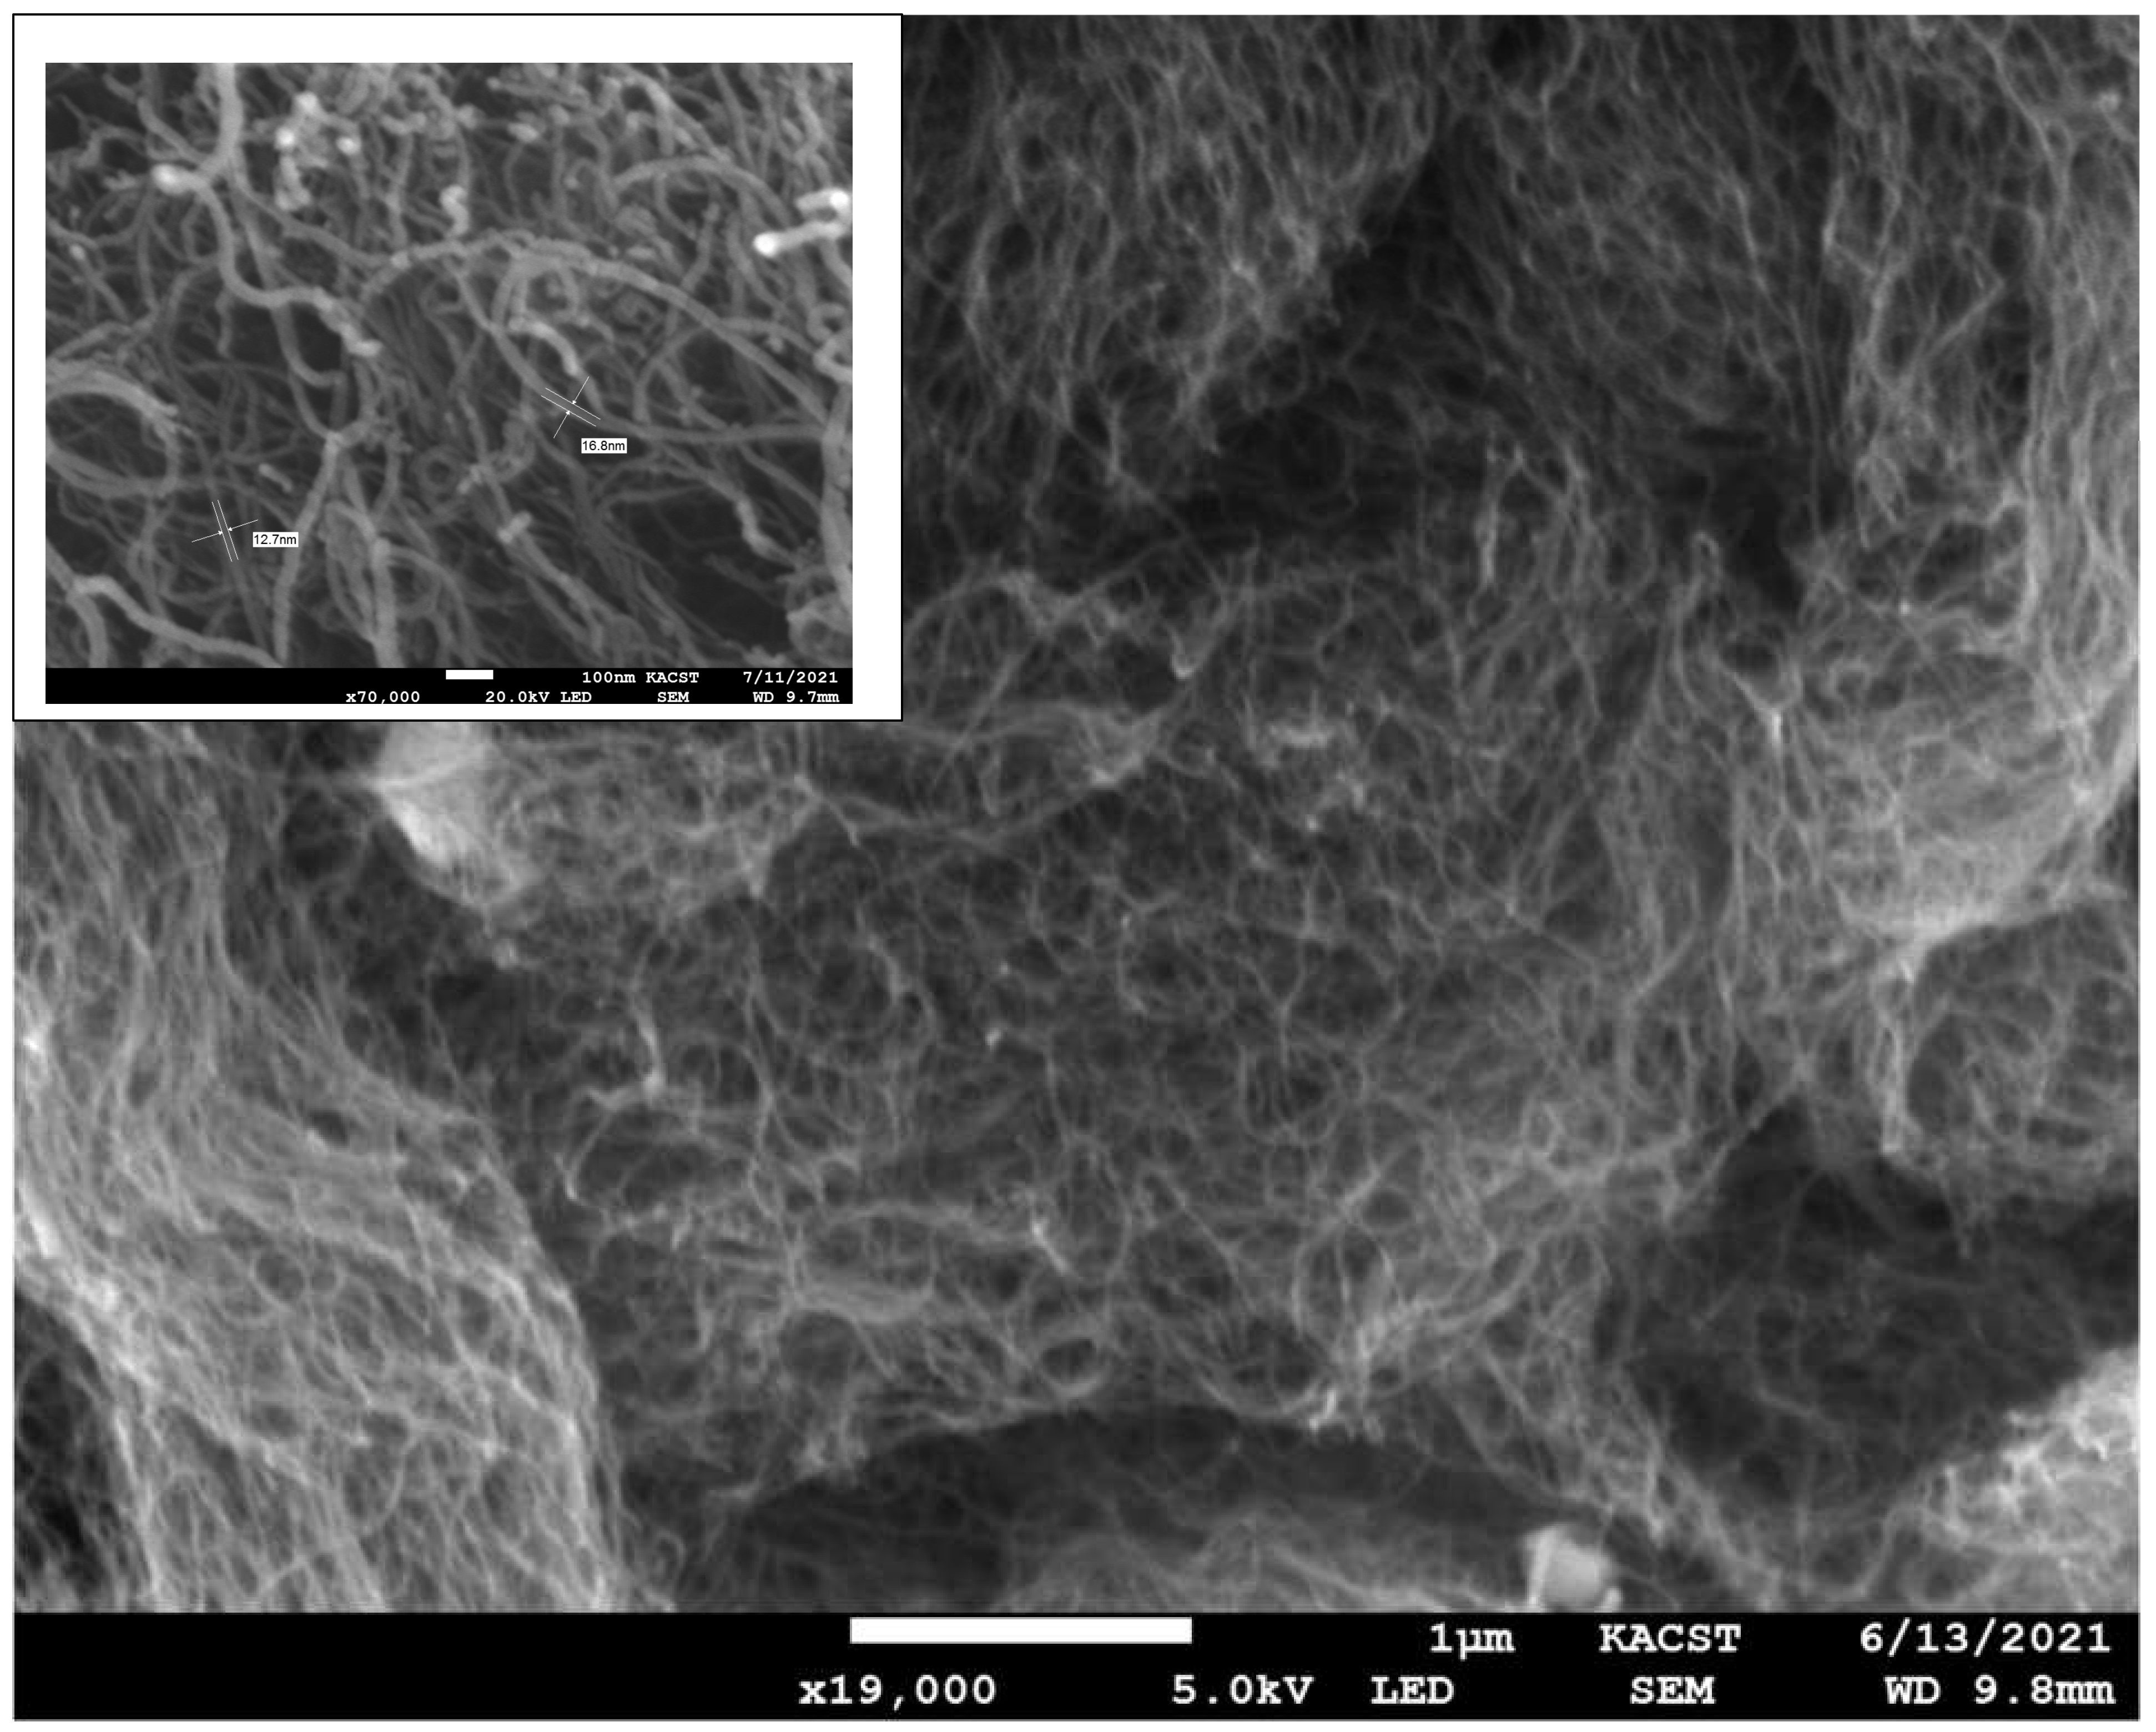
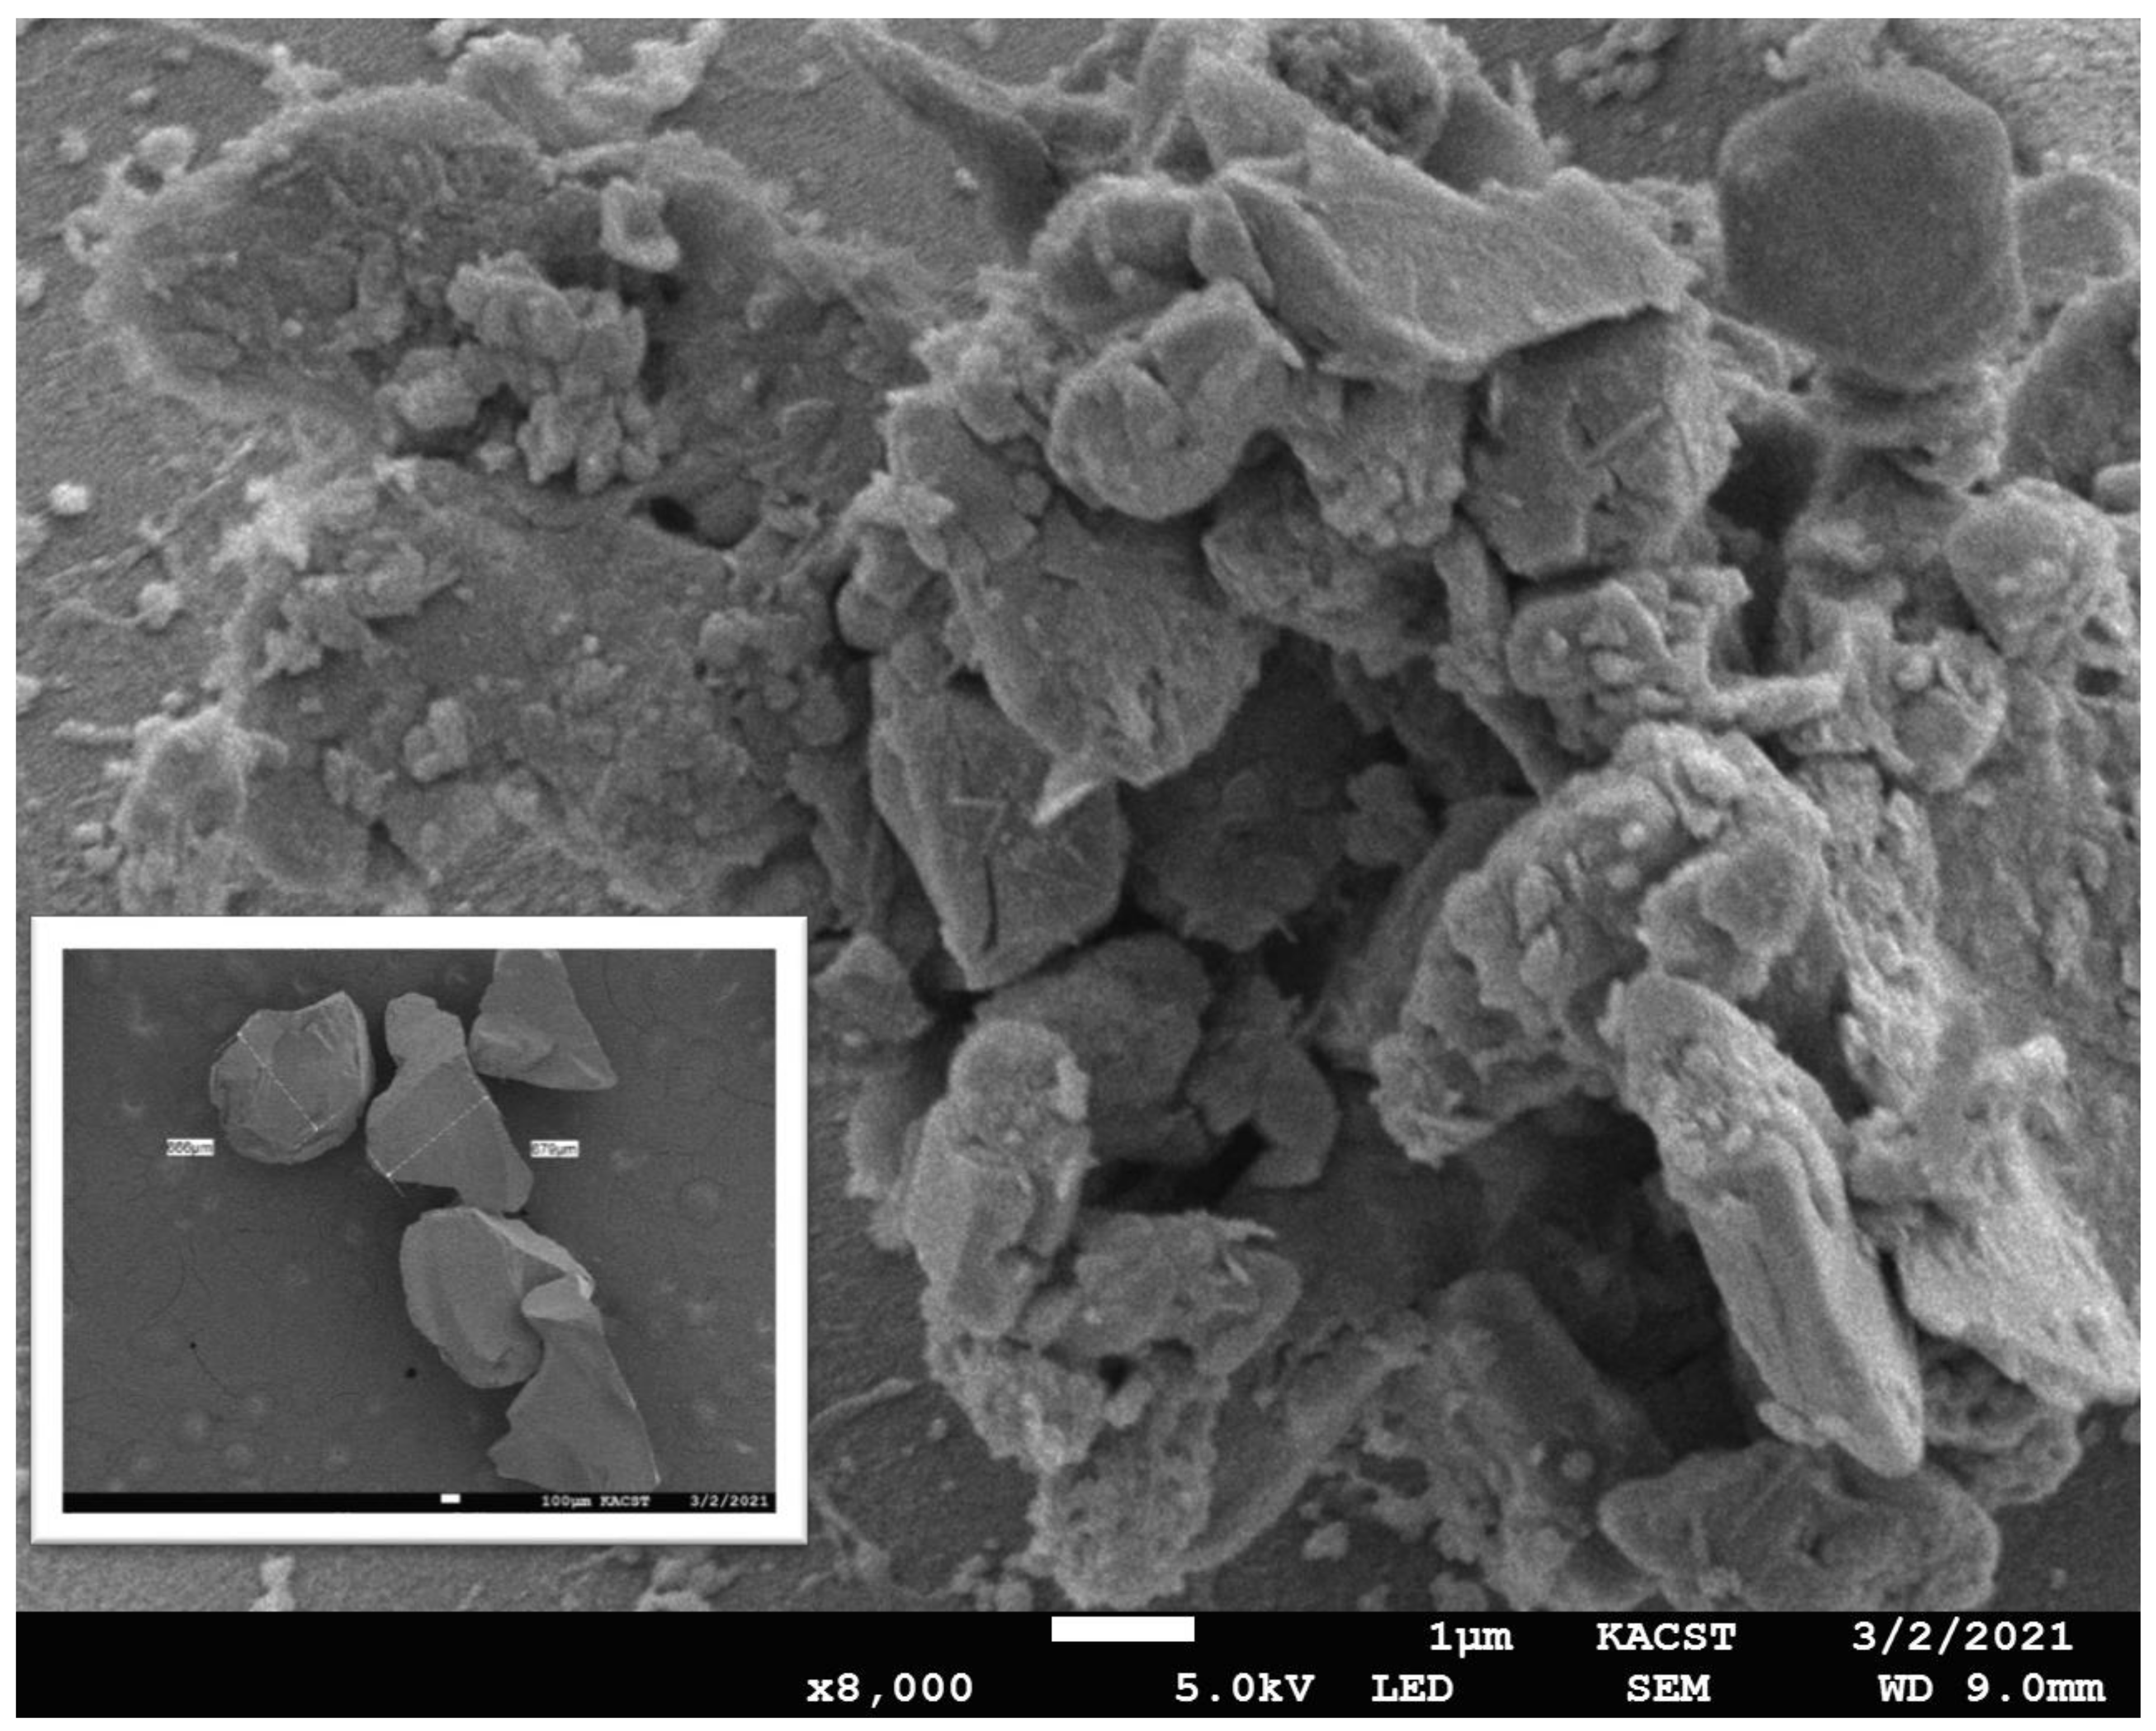
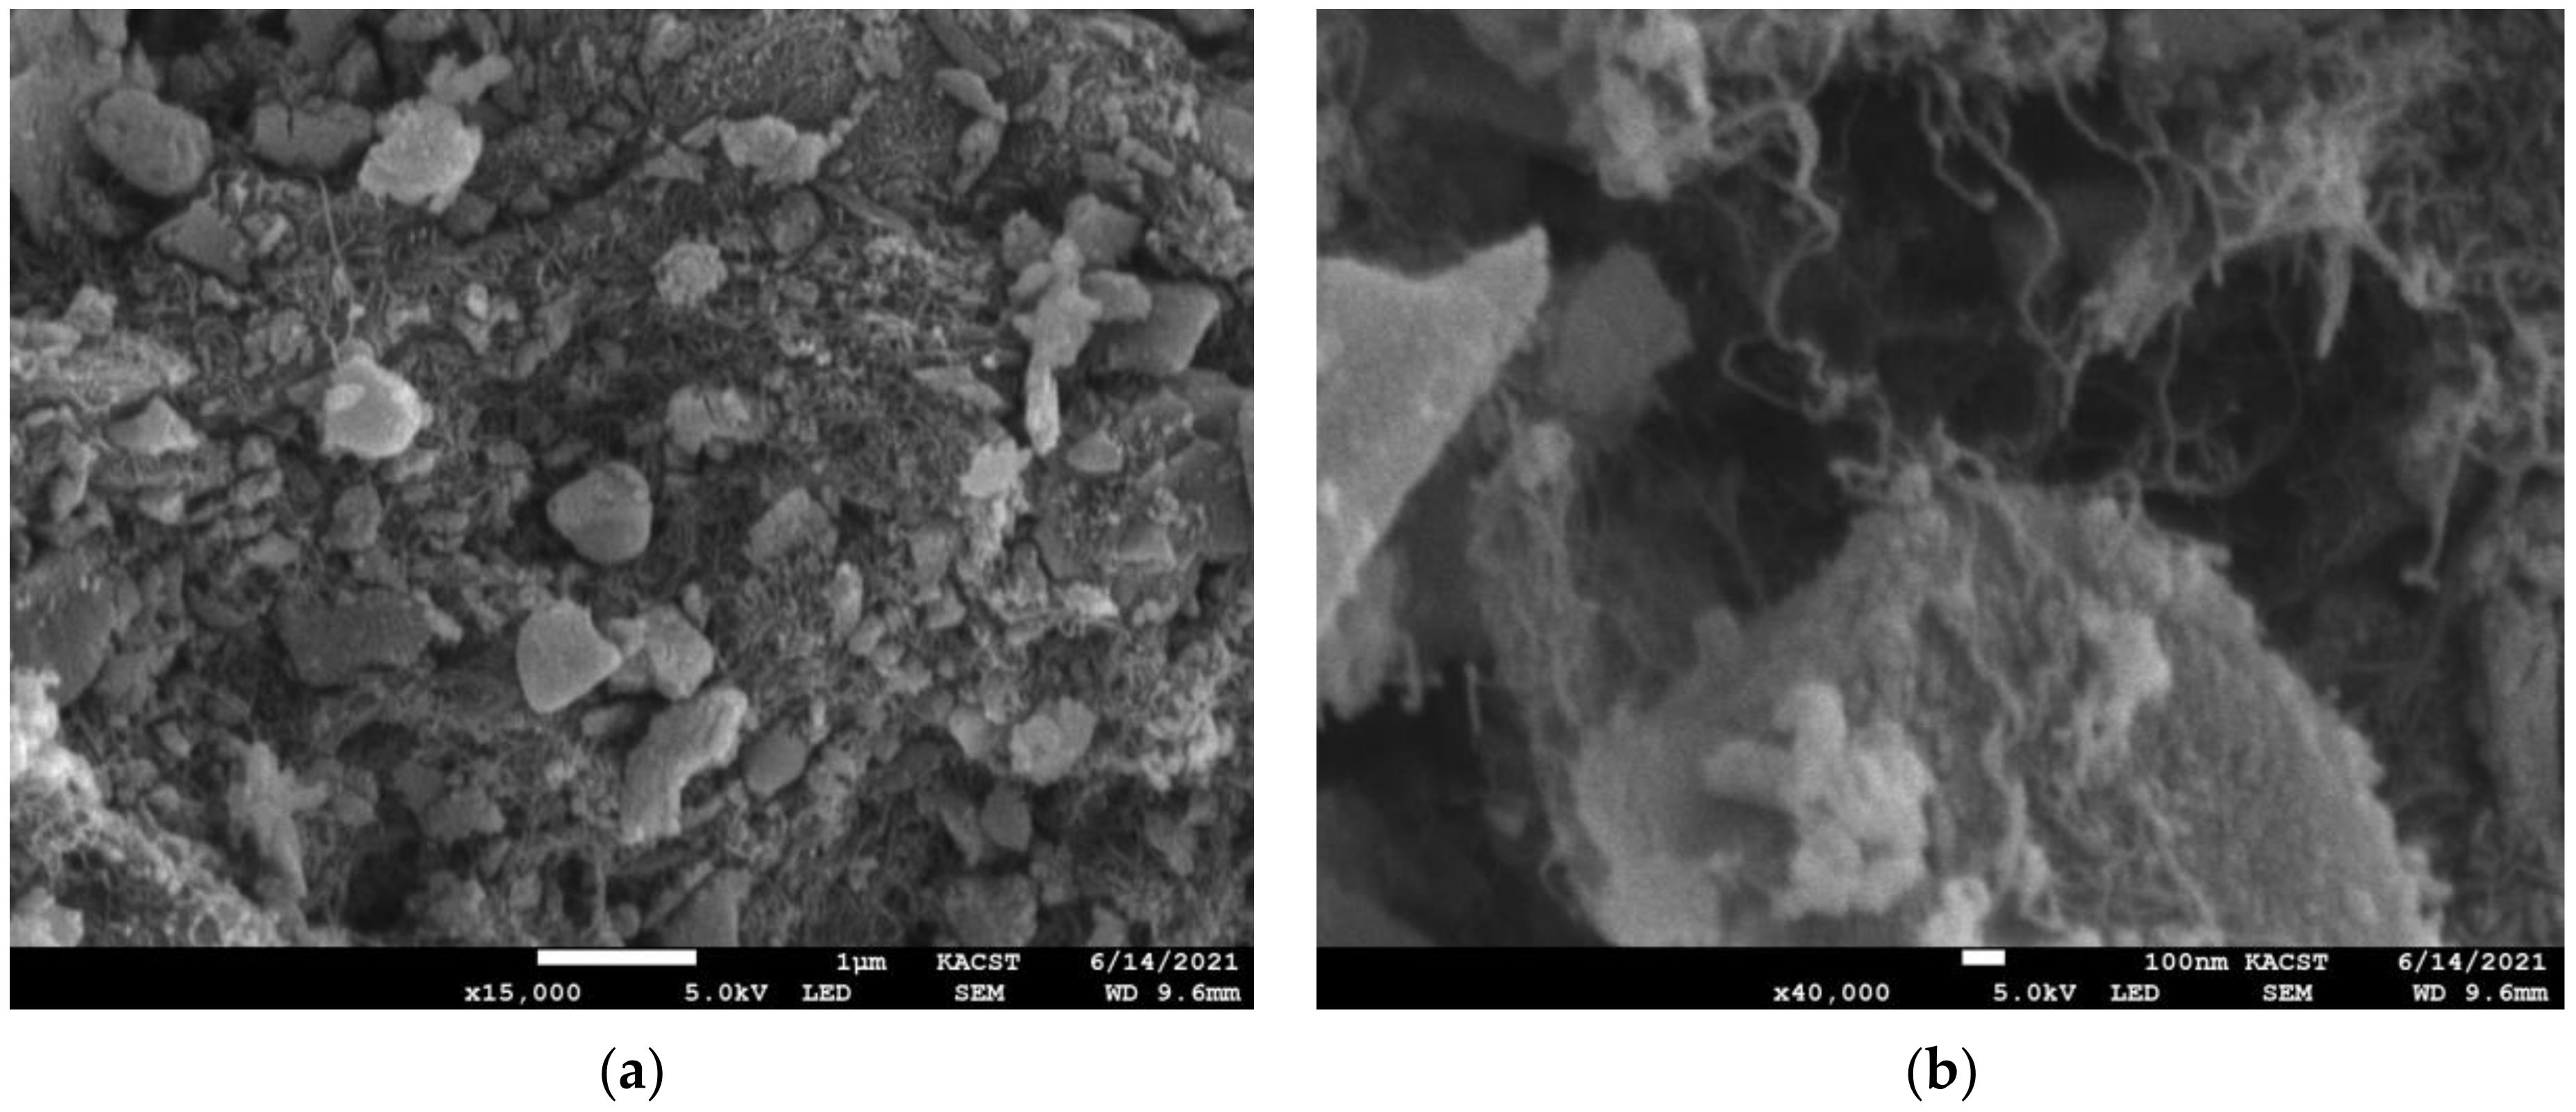
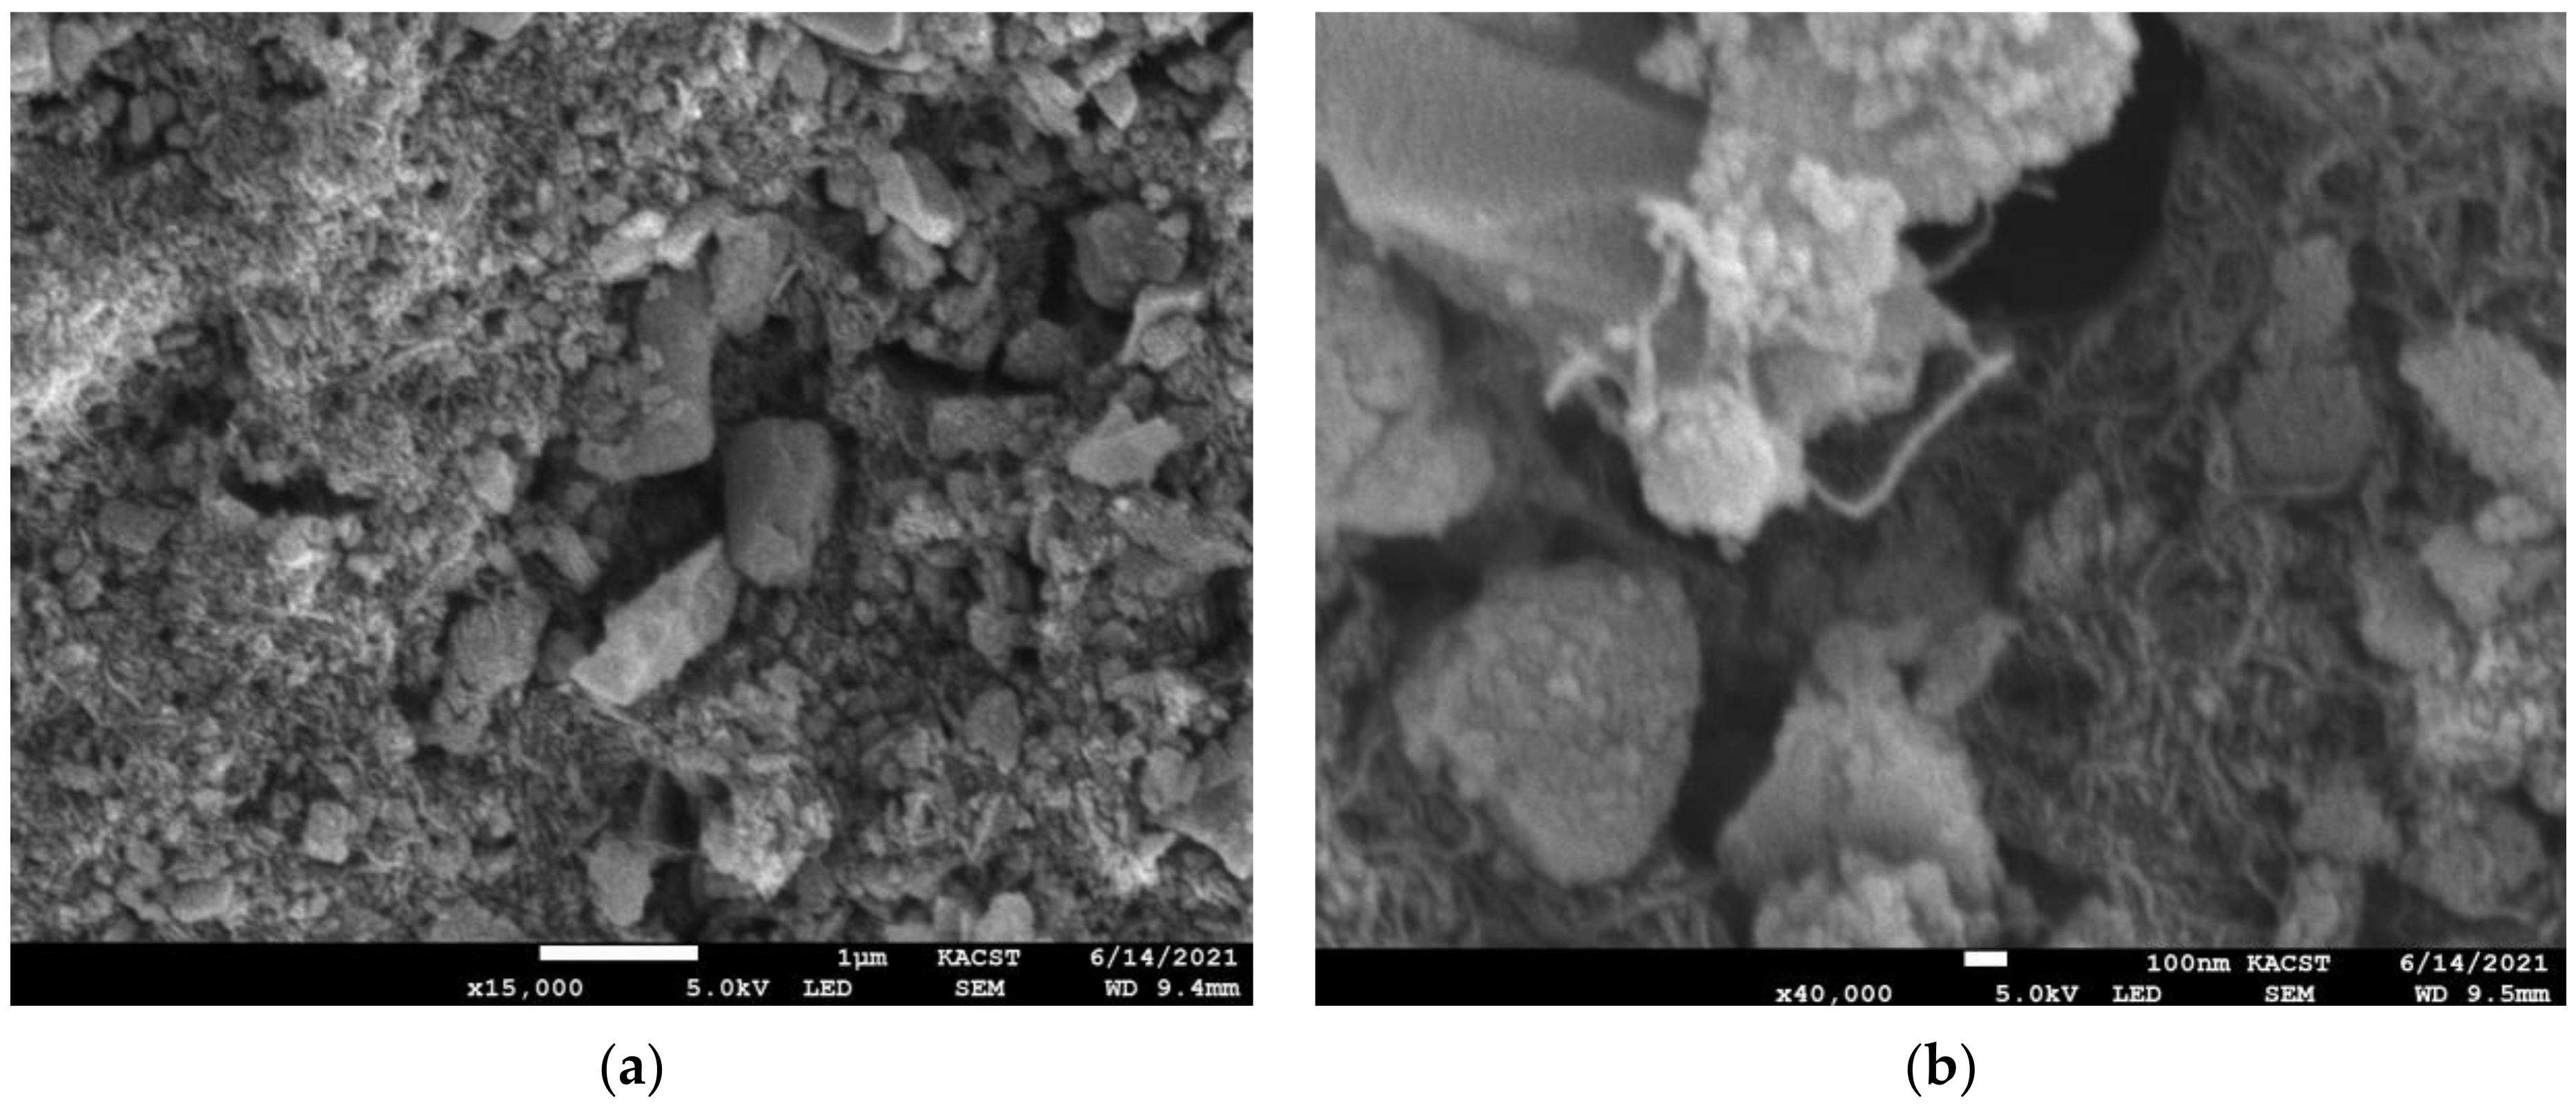
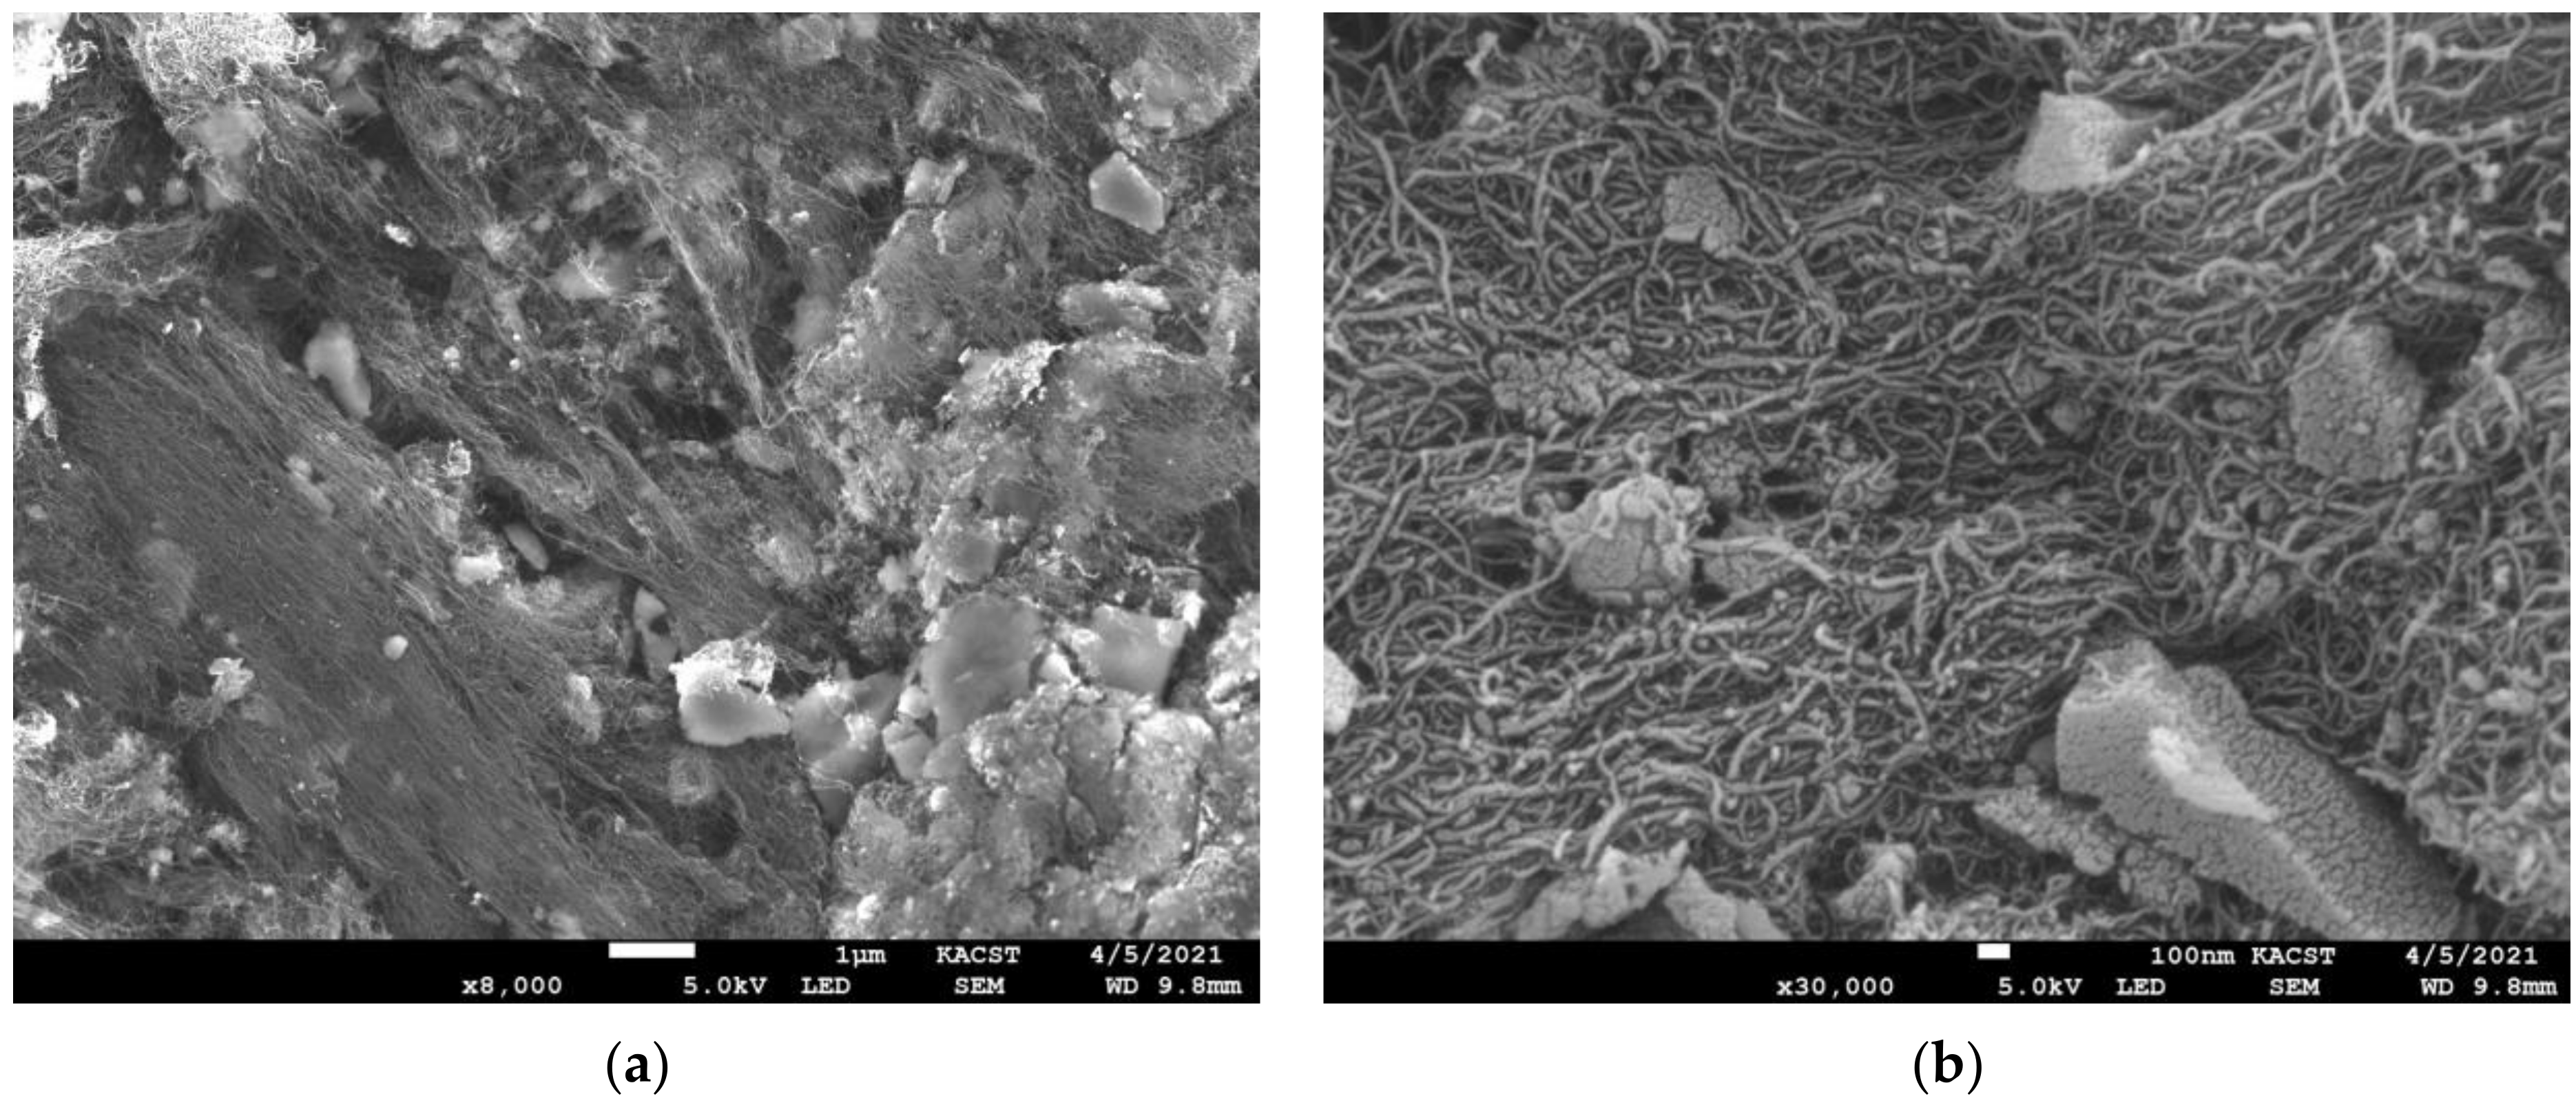
3.1. Scanning Electron Microscopy (SEM)

A scanning electron microscope uses electrons accelerated by tens to hundreds of kilovolts as the imaging component. A high resolution arises from the shorter wavelength λ e   of electrons, which is dependent on the electron acceleration voltage V 0 , given by the following equation:
λ e A = 150 V 0 kV
The magnification of the microscope M can be obtained from the following ratio:
M = I S
where I is the trace length on the display image and S is its length on the sample. Primary electrons interact with the sample, producing several signals. One possible interaction is with the electrons within the shell of the target atoms to gain energy from the collision, break away, and then be detected. These are called secondary electrons, which have low energy.
R = 0.0552 V 0 1.67 / ρ
where R is the average electron range in µm, V 0 is the applied voltage in kV, and ρ is the density of the material in g/cm3. Because secondary electrons have low energy, only those very close to the surface are able to reach the detector, which is held at a positive voltage to draw them away from the sample. The intensity variations of the secondary electrons are the basis for the contrast in images of various features in the sample [20].
The samples were mounted on a flat surface with a conducting material (adhesive tape). This establishes a good electrical path to the ground, which is a requirement to prevent the buildup of negative charges delivered by the electron beam. On the other hand, electrically nonconductive specimens require evaporating treatment in general so as to make them conductive. By directing the focused beam of electrons across the sample surface and identifying secondary or backscattered electron signals, SEM produces detailed, high-resolution pictures of the sample. Additionally, an Energy-Dispersive X-Ray Analyzer (EDX or EDA) is utilized to determine the elements and their quantitative composition.
EDX examines the distribution of energy and intensity of X-rays created by electron beam excitation on the sample surface, from which the composition of elements throughout the specified area covered by the electron beams can be estimated with a high degree of accuracy [21]. As a result, this approach to compositional characterization is extremely effective and advantageous [22].
Figure 2 presents an SEM preview of MWCNTs at a 1 μm scale, with close-up images that allow us to estimate that their diameter is no less than 12 nm. The tangled appearance does not allow us to measure their length. SEM images of the various composites of MWCNTs of 0.25, 0.5, and 0.75 wt% show a randomly oriented network of nanotubes. The surfaces of the MWCNTs support the intermittent distribution of silica gel particles.
The SEM images of the pristine separate MWCNTs (Figure 2) and silica gel (Figure 3) and of the composites (Figure 4, Figure 5 and Figure 6) show the topography of the composites in relation to their original topography. The SEM micrographs of the composites show that at relatively low concentrations, the MWCNTs connect the isolated particles of silica gel (see Figure 4, Figure 5 and Figure 6). Silica gel was found to be fully attached to the MWCNTs, and in some cases it fully surrounded them, particularly at the higher concentration (0.75 wt%; Figure 6) [23,24]. As can be seen in Figure 3, with silica gel particles with an average size above 500 μm, as the concentration of MWCNTs increased, the incorporation of silica gel particles within the lengthy MWCNTs increased (see Figure 4, Figure 5 and Figure 6). These observations agree with the detailed SEM investigations undertaken recently by Li et al. [12]. It has been reported that most MWCNTs tend to interweave with one another; however, the surface characteristics of SiO2/MWCNTs are distinct. EDX analysis of silica gel showed that there were two main elements, oxygen (O) and silicon (Si). The concentrations of these elements were 58 to 65% and 30 to 35%, respectively, in addition to minor concentrations of nitrogen (N), boron (B), and aluminum (Al).

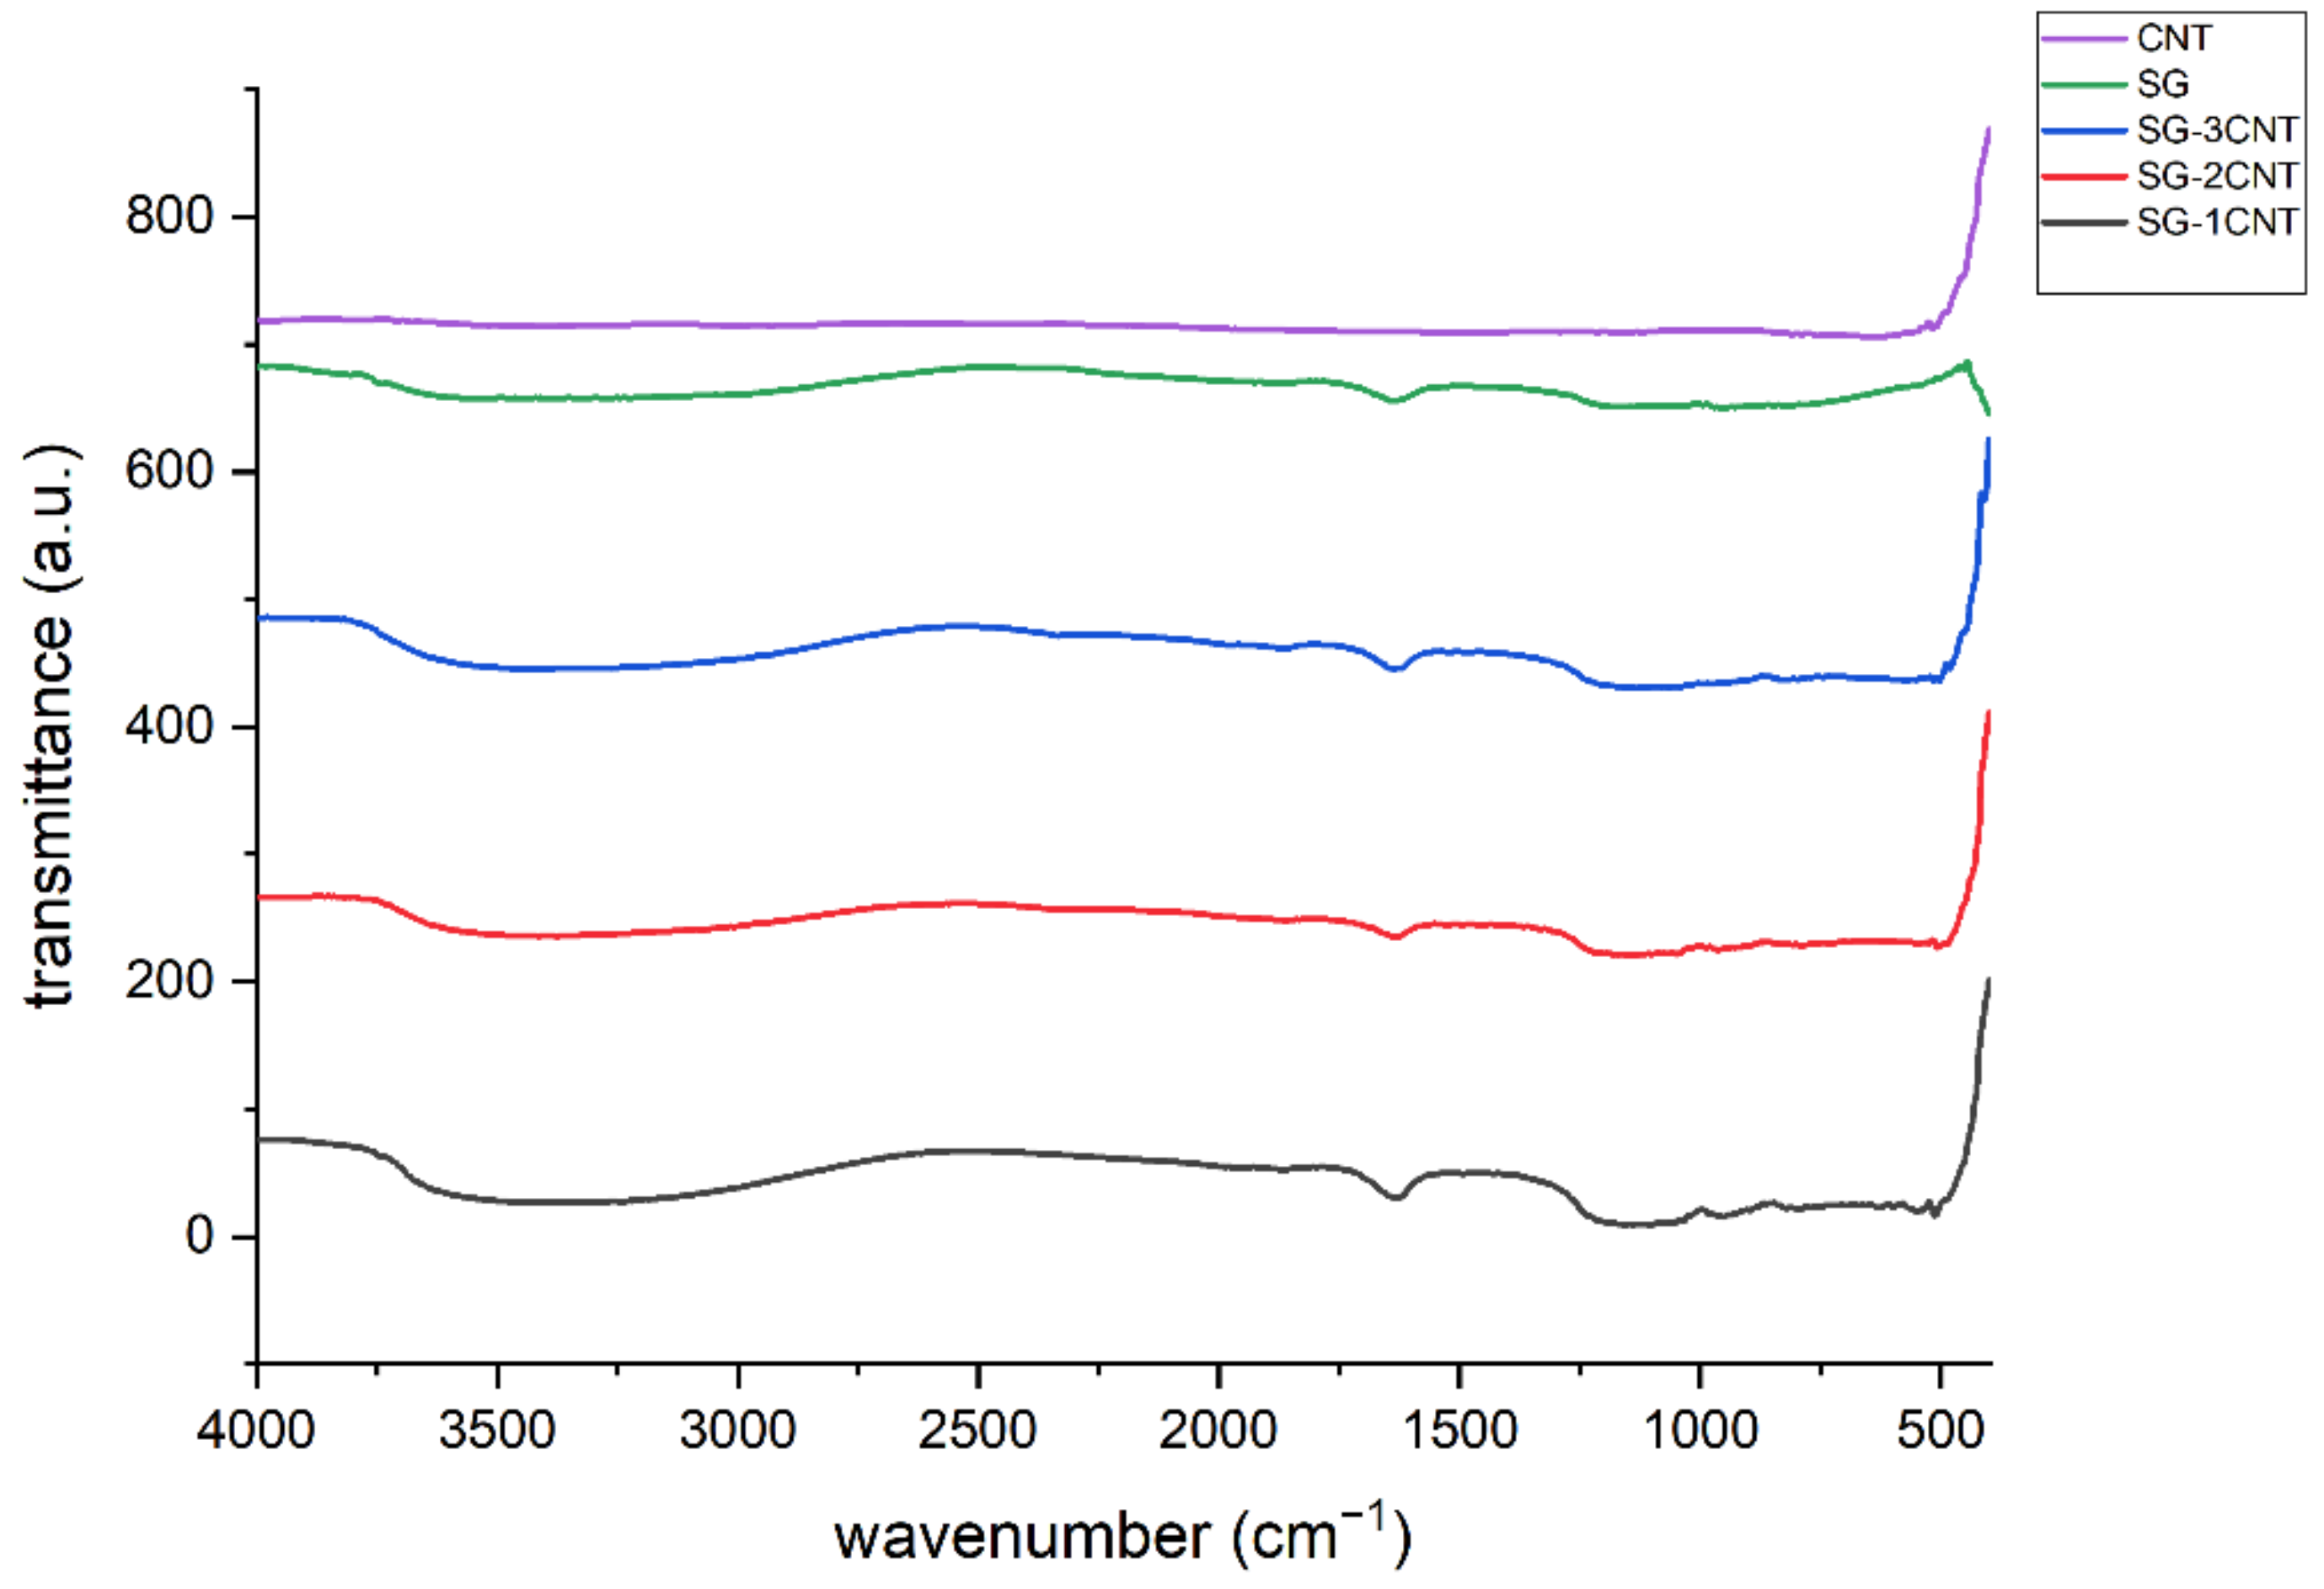
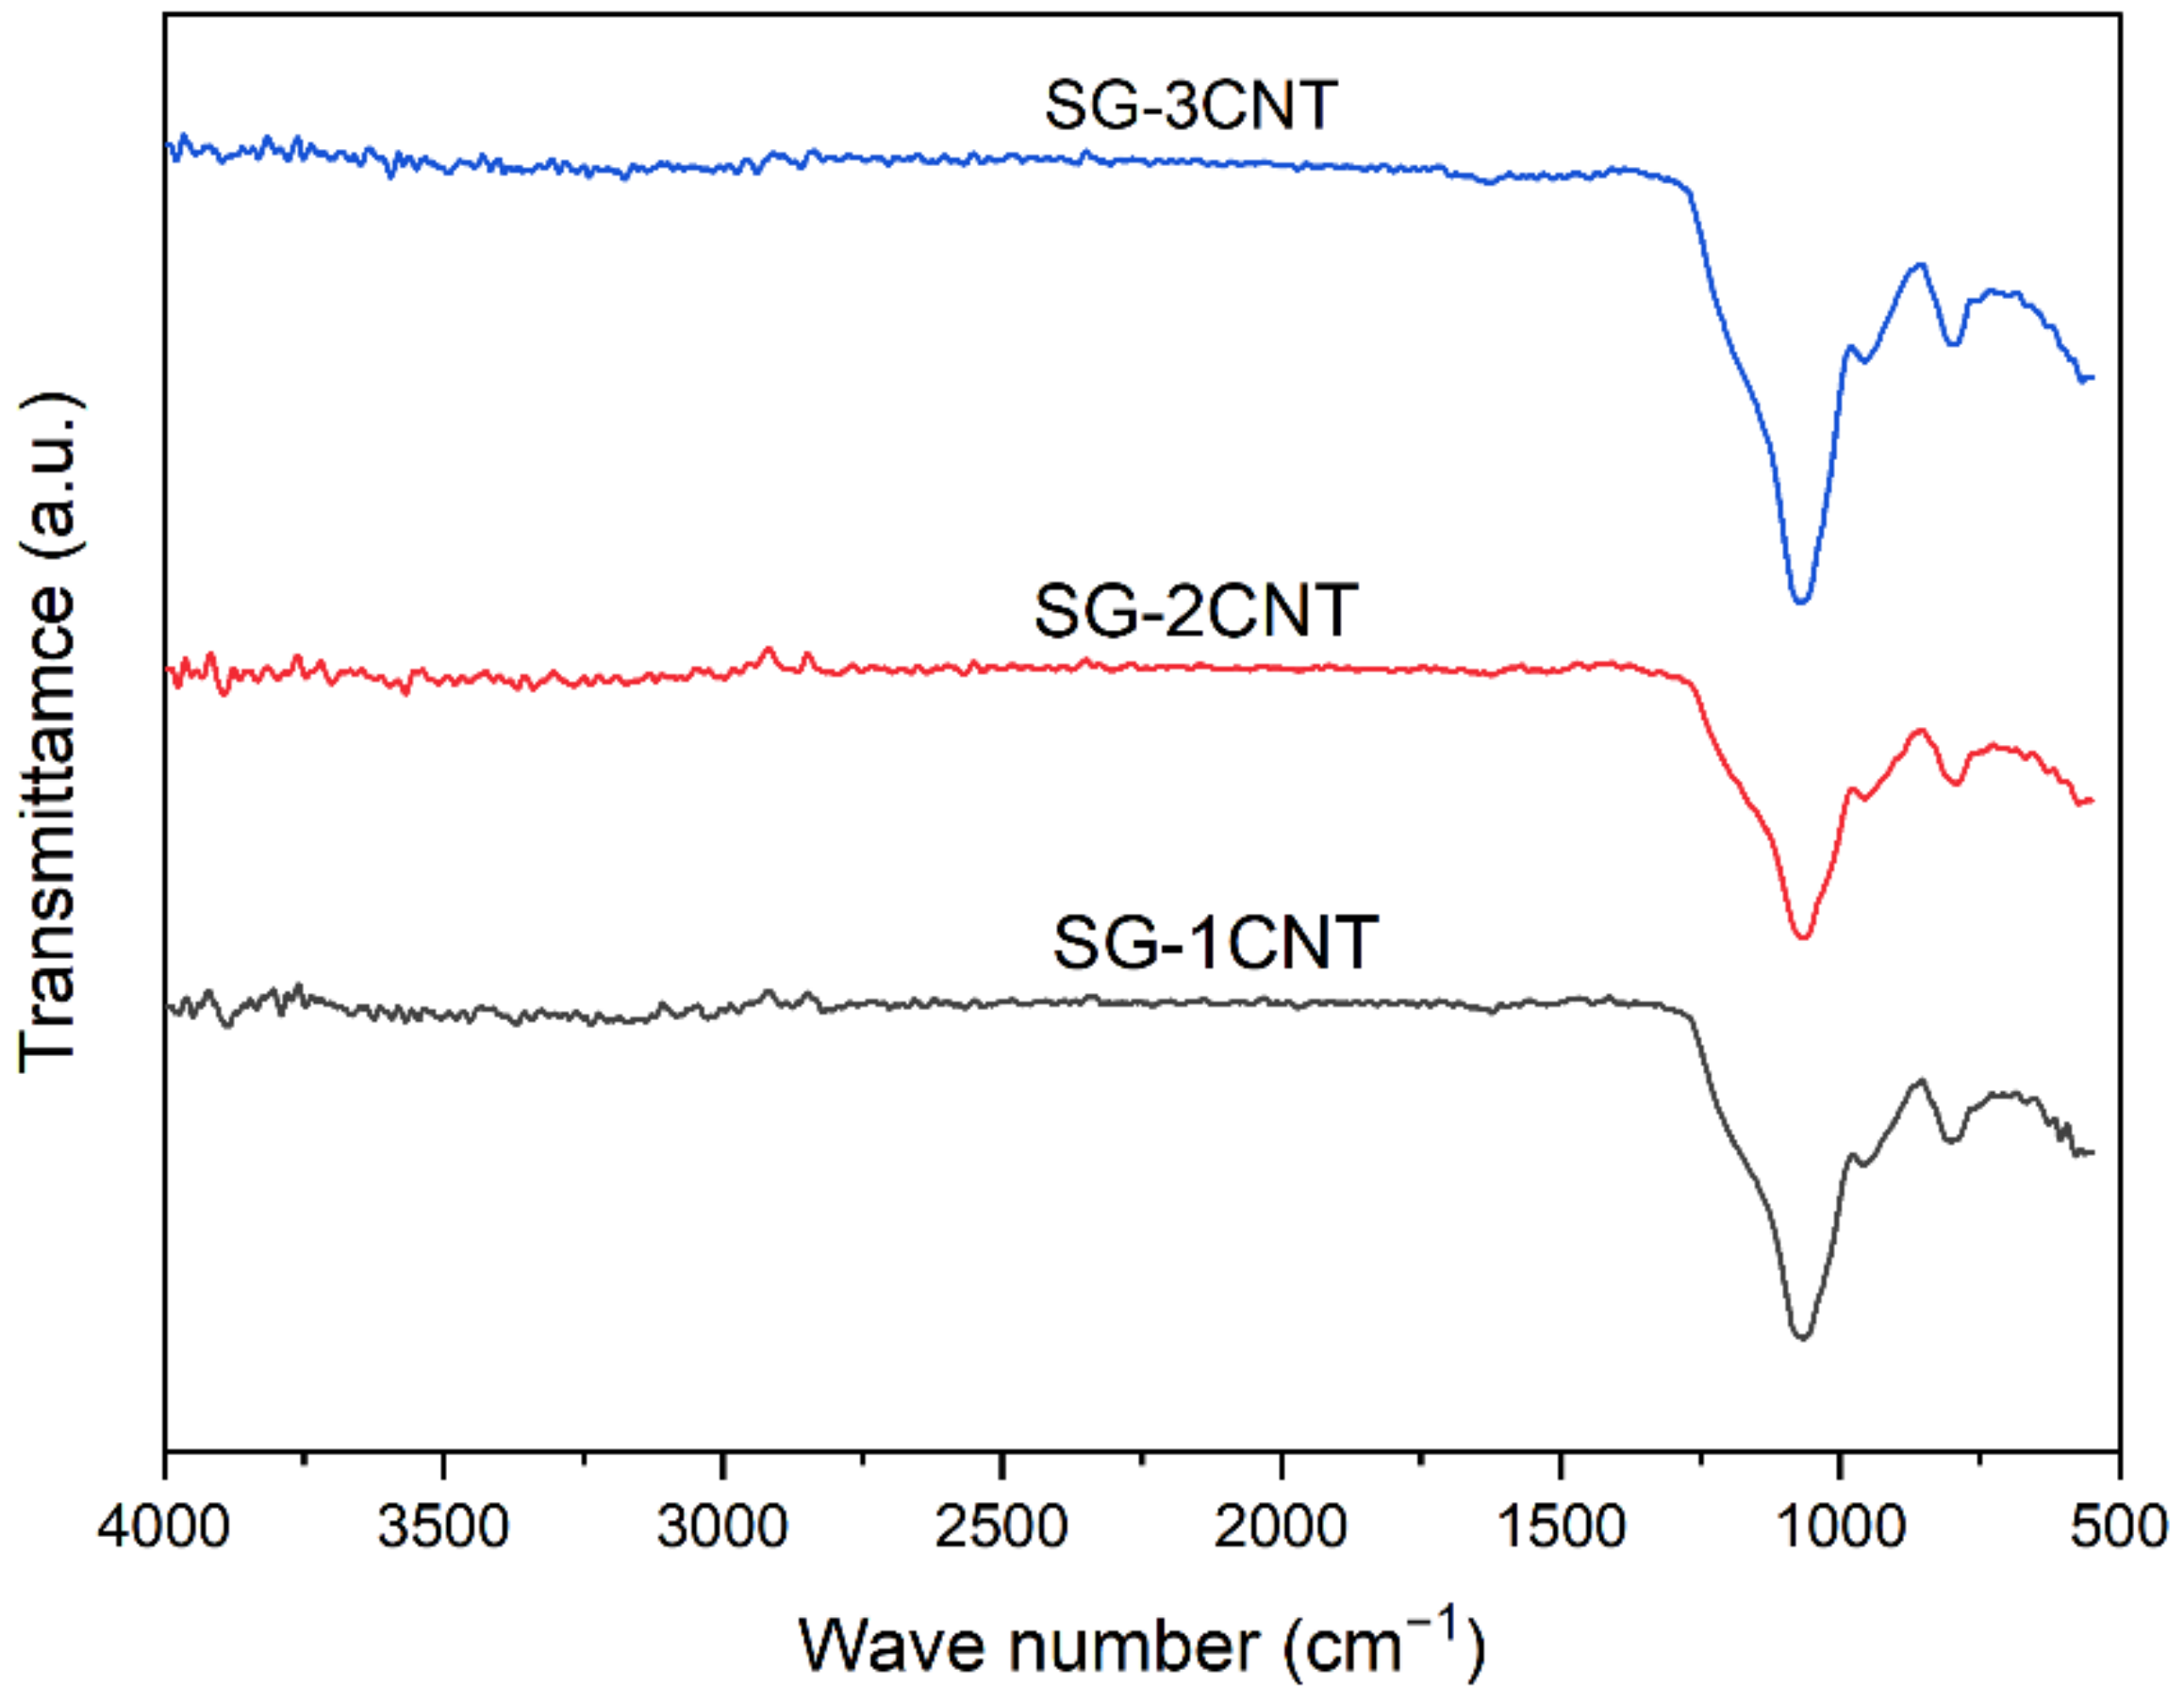
3.2. FTIR Measurements

The samples were analyzed using Fourier transform infrared spectroscopy (FTIR) with a PerkinElmer Spectrum GX device (Hopkinton, MA, USA), which has a spectral resolution greater than 0.15 cm−1. FTIR analysis is a technique that utilizes infrared light to examine test samples and determine their chemical properties.
The FTIR instrument delivers infrared radiation with a wavelength of around 10,000 to 100 cm−1 through the material, with some of the radiation being absorbed and some passing through. The sample molecules convert the absorbed radiation to rotational and/or vibrational energy. The resulting signal at the detector is a spectrum, typically between 4000 and 400 cm−1, which represents the sample’s molecular fingerprint. Because each molecule or chemical structure generates a unique spectral fingerprint, FTIR analysis is an excellent tool for chemical characterization. The absorbance intensity is proportional to the amount of functionality present in the material [25].
FTIR measurements, as shown in Figure 7, confirmed that the MWCNTs were not activated [26] within the matrix of silica gel composite [27]. For pristine silica gel, MWCNTs, and MWCNT/SiO2 composites, the FTIR analysis clearly reveals the structure of the latter. Previous studies examined the transmittance spectrum of the composites, which also confirmed that the MWCNT/SiO2 composite structures could be successfully synthesized using a similar method [11]. Moreover, the functionalization of these MWCNTs enhanced the transmittance FTIR peaks [28].
FTIR of the annealed composites of various concentrations showed various absorption peaks and shoulders at wavenumbers between 500 and 1300 cm−1, confirming the functionalization of the composites at various concentrations of SG occurred physically through annealing. Comparing the FTIR transmittance spectra of the composites before and after annealing (Figure 7 and Figure 8, respectively), the presence of the multiple peaks and shoulders in the region of wavenumber between 500 to 1750 cm−1 confirms functionalizing MWCNTs [29,30].

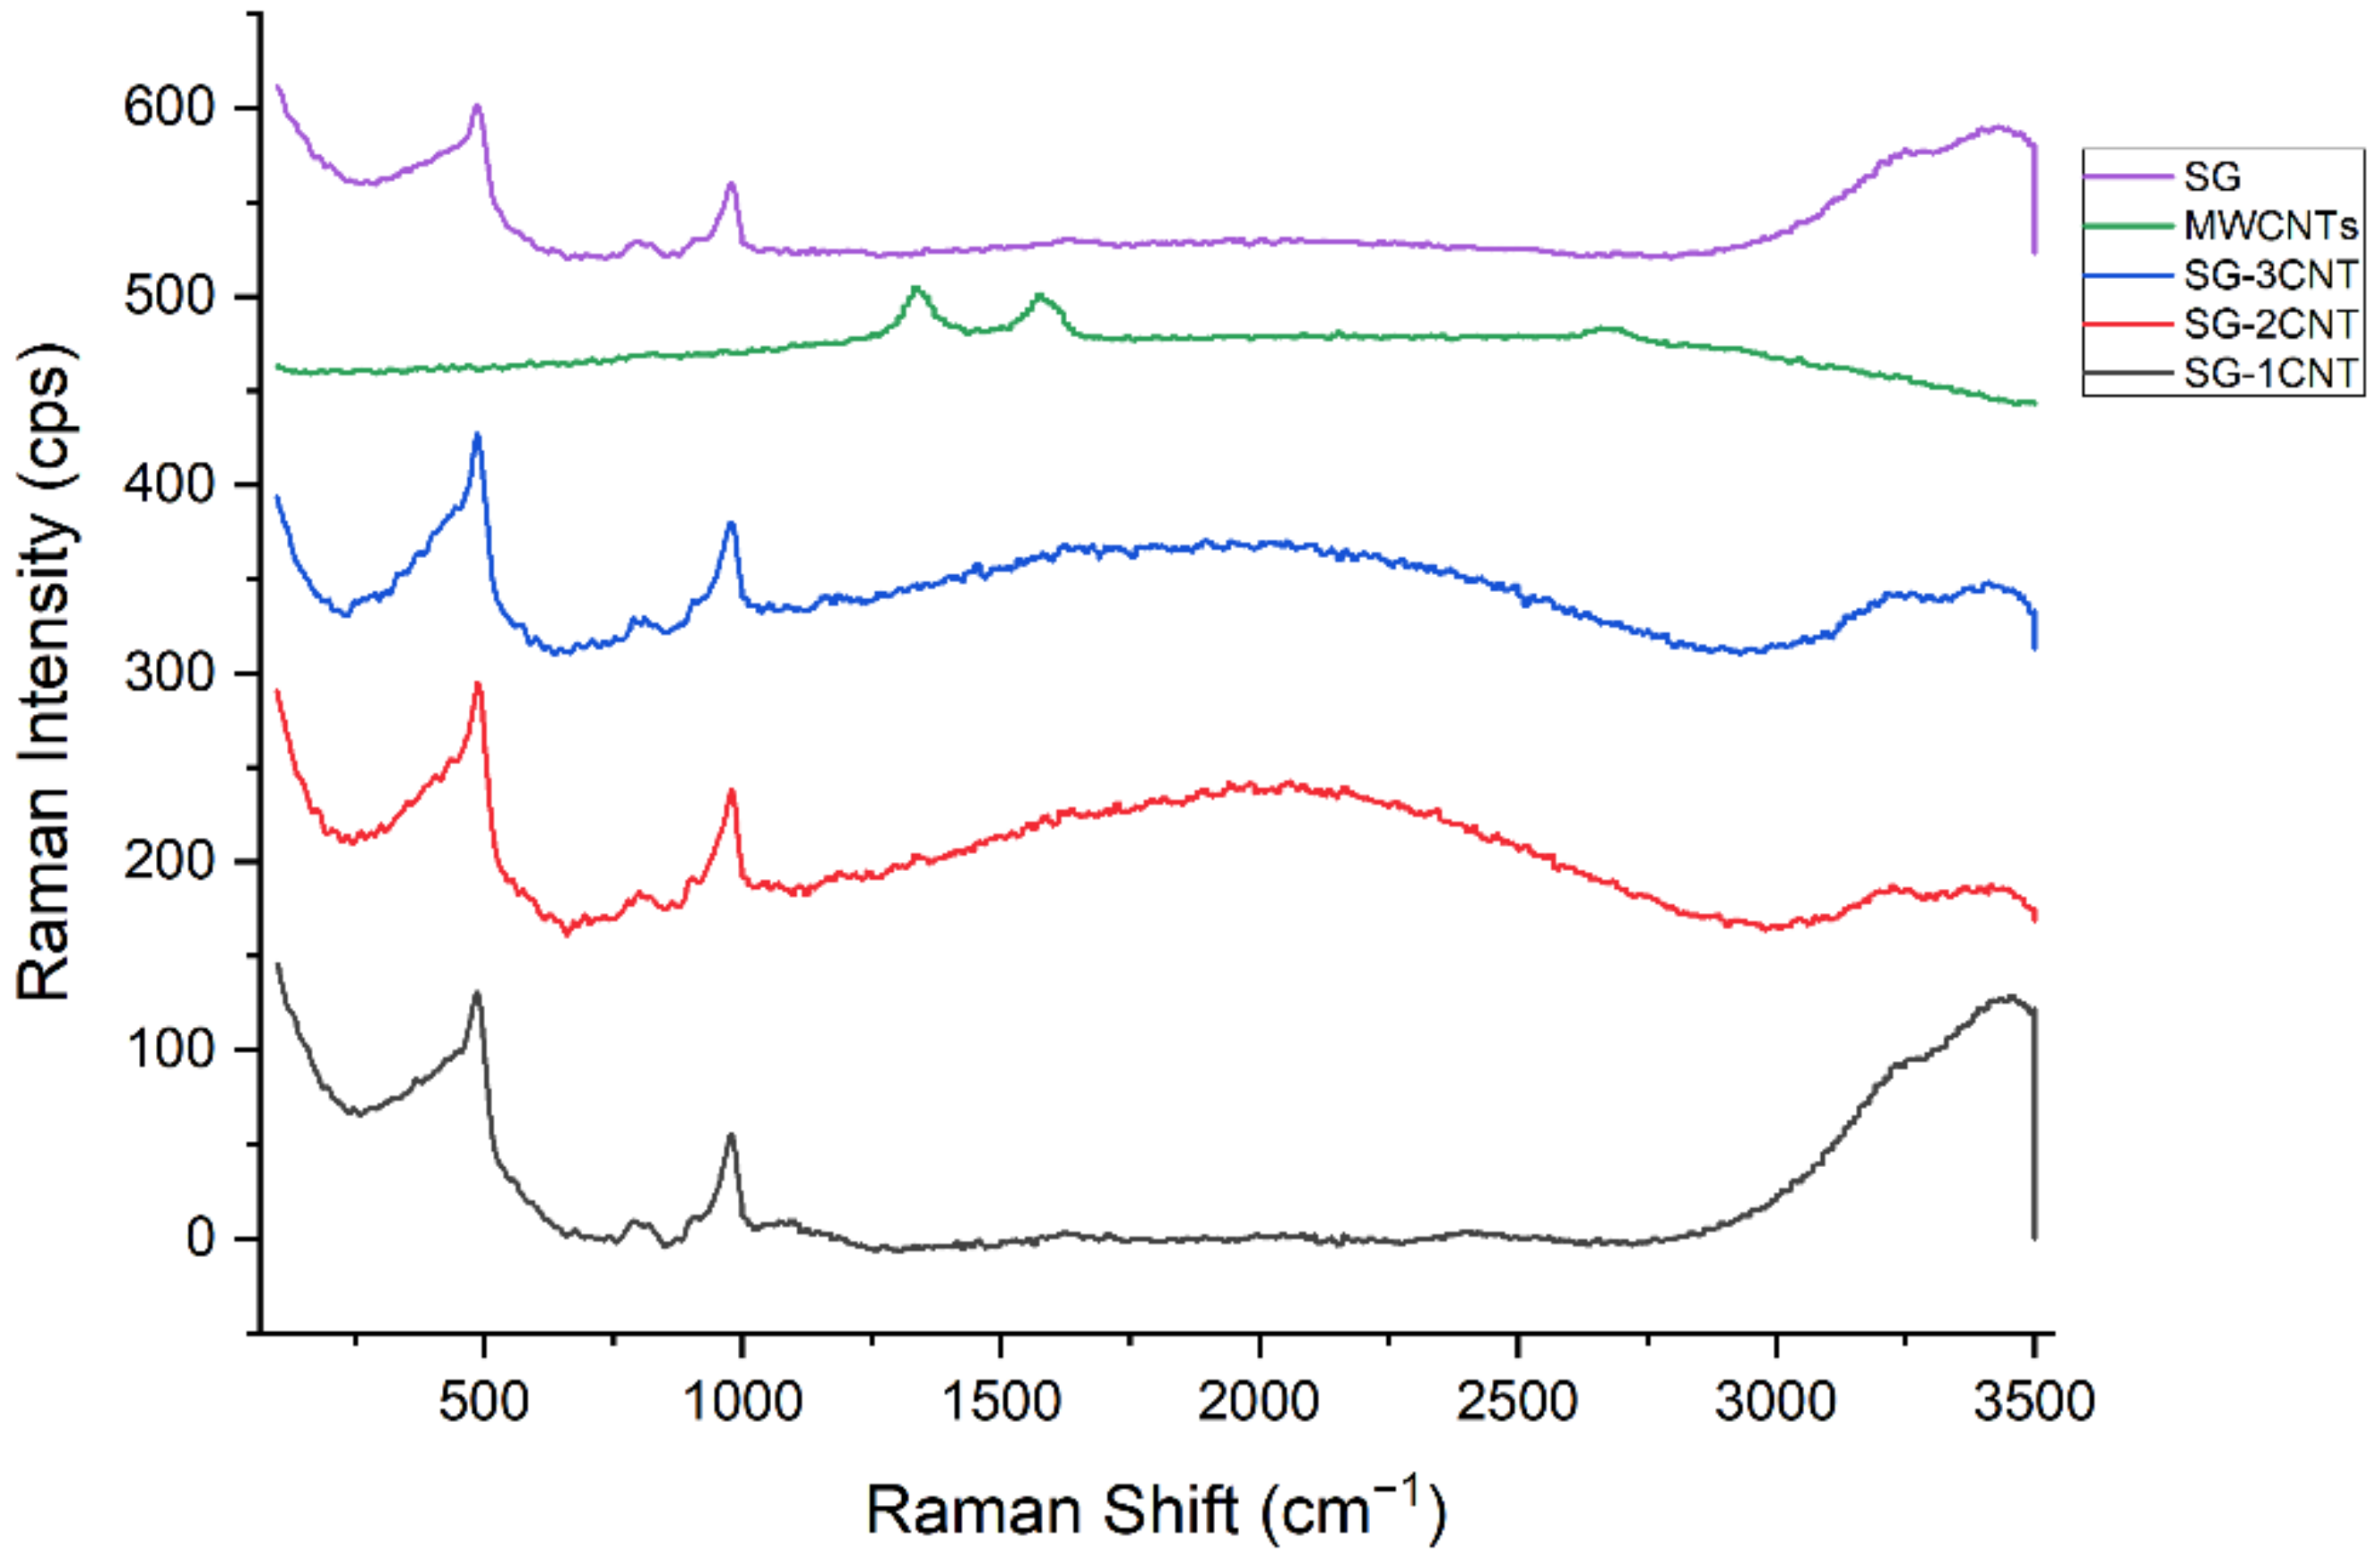
3.3. Raman Spectroscopy

The micro-Raman spectrometer offers a critical means for investigating the fundamental properties of flaws in composite systems. The regulated use of flaws to modify the chemical and physical characteristics of graphene, comparable to the silicon industry’s use of doping, ought to be expanded upon [29].
In brief, a Raman microscope (RM2000) from Renishaw UK Sales Ltd. (New Mills, Gloucestershire, UK) consists of a 25 mW air-cooled laser source and a mirror that reflects the laser beam onto the notch filter and into an optical microscope to deliver the beam to the sample and then transmit the Raman signal to the spectrometer. The notch filter blocks the scattered laser radiation but allows the Raman signals to go through to the spectrometer. The measurements were performed in backscattering configuration, which has become standard for Raman spectroscopy measurements.
The size of the focal plane spot is determined by excitatory laser wavelength λ and the objective’s numerical aperture N A ; the diameter of spot D is given by the following equation [20]:
D = 1.22 λ N A
Raman spectroscopy was used to investigate possible changes in the scattering spectra of pristine silica gel and pristine MWCNTs and their composites. Further investigation of the possible structural phase transformations within Vickers residual indentations made in silica gel and MWCNT composites is suggested. A DPSS laser beam was used, and a diode-pumped solid-state laser was employed to excite the sample. The laser power delivered at the sample point in all experiments was 9 mW, as measured with a calibrated power meter (FieldMaster GS, Coherent, Inc., Santa Clara, CA, USA). The specifications were as follows: diameter of the laser spot on specimen surface: ~2.1 µm; aperture: 25 µm pinhole; grating: 900 lines/mm; estimated resolution 2.7–4.2 cm−1; range limit for wavelength: 50–3500 cm−1. The peak positions were measured to 1 cm−1 accuracy. The acquisition time varied from a few seconds to a few minutes depending on the neutral density filters used [30].
The observed Raman scattering peaks of silica gel (see Figure S1 in Supplementary Materials) are in accordance with those in previous works [31,32]. The Raman bands of silica were observed at 495 and 605 cm−1 and showed Si–H rocking vibrations.
When Raman analysis of CNTs is conducted, three sharp peaks are routinely observed: the tangential stretching G mode (1500–1600 cm−1), the D mode (1350 cm−1), and the radial breathing modes (RBMs) (100–400 cm−1). These characteristic scattering peaks were assigned by Rao et al. [33] and later summarized by Akbar et al. [34]. The ratio of the intensities of the D and G bands can be used to evaluate the disorder density of the nanotube walls. The Raman spectrum of silica gel shown in Figure 9 exhibits sharp peaks at 480, 780, and 990 cm−1 and a broad band centered at 2100 cm−1 in addition to two superimposed peaks at 3250 and 3400 cm−1. The Raman spectrum of the as-received MWCNTs was fitted using two Lorentzian peaks at 1250 cm−1 (D band) and 1750 cm−1 (G band) and a Gaussian peak at 2700 cm−1 (D0 band), superimposed on a broad band. Figures S2–S4 show scattering peaks characterizing the silica gel, where there is no clear presence of scattering peaks of MWCNTs, particularly at 0.25 wt%. The Raman scattering spectra of 0.5 and 0.75 wt% show traces of the broad band at 2000 cm−1, one of the characteristics of the amorphous bands of MWCNTs [2], or it might from amorphous SG as adding MWCNTs could reduce crystallization of SG as it has been reported in other polymers [32,33]. Figure 9 summarizes Raman spectra of the previous samples under consideration, pure SG, pure MWCNTs, the composites of various MWCNTs weight percents.

3.4. Particle Size Distribution

The electrophoretic mobility measurements were performed using a Zetasizer Nano ZS (Malvern Panalytical Ltd., Malvern, Worcestershire, UK) working in the particle size range from 0.6 nm to 6 μm and using a 4 mW He–Ne (633 nm) laser [35]. We obtained true measurements of the size distribution, particle concentration, particle charge, and charge distribution. We carried out complex analyses of heterogeneous samples and performed real-time measurements of particle properties to assess subtle changes over time with high precision for quality control and the assessment of product stability. The electrophoretic mobility measurements were performed using a dynamic light scattering (DLS) Zetasizer Nano ZS instrument (Model ZEN3600, Malvern Instruments Ltd., Cambridge, UK), working in the particle size range from 0.6 nm to 6 μm and a 4 mW He–Ne (633 nm) laser with a scattering angle of 173°. Measurements were performed at room temperature (300 K). The distribution of MWCNTs within the silica gel matrix and MWCNT composites were characterized with the Zetasizer, which provided information about the MWCNTs’ nanoparticle size distribution, dispersion properties, stability, and propensity. Particle size analysis is a key element because many properties of nanomaterials are size-dependent. These data of aggregation are important for designing and tailoring new nanomaterials for specific applications. The distribution of MWCNTs in 0.25 wt% concentration is centered, approximately symmetrically, around 250 nm. A higher intensity of distribution among the various MWCNT concentrations was seen at 0.25 wt%. Improved dispersion and homogeneity on the fractured surface at 0.25 wt% were observed with a higher tendency for reproducibility. Generally, MWCNTs remain agglomerated, number or intensity is a beneficial parameter when MWCNTs are in dispersed form.

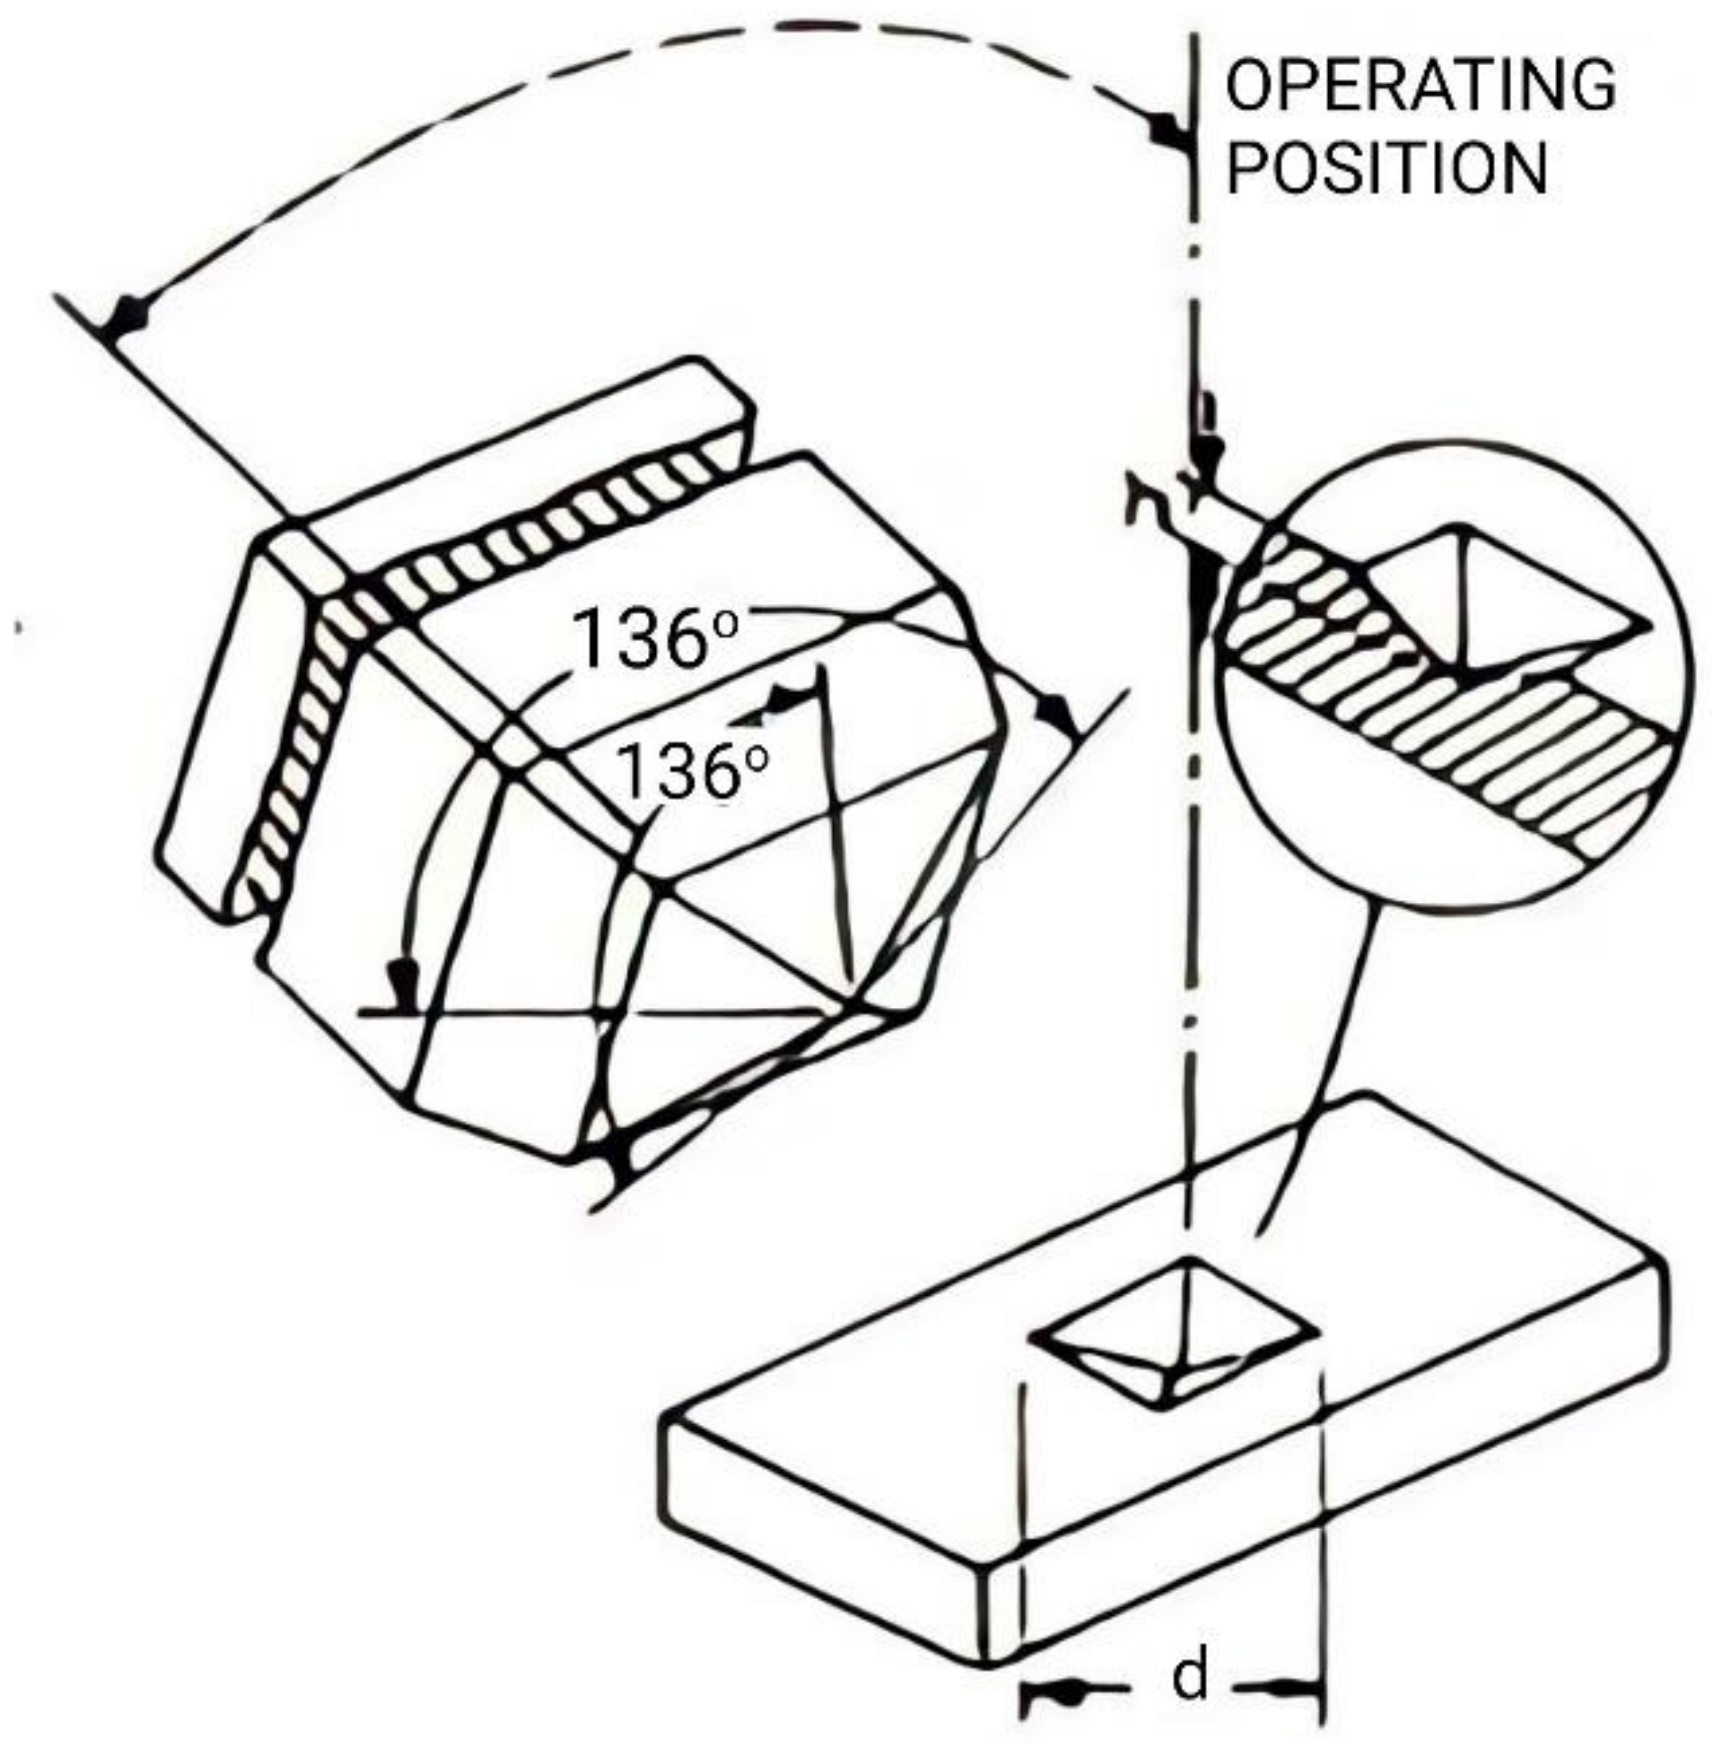
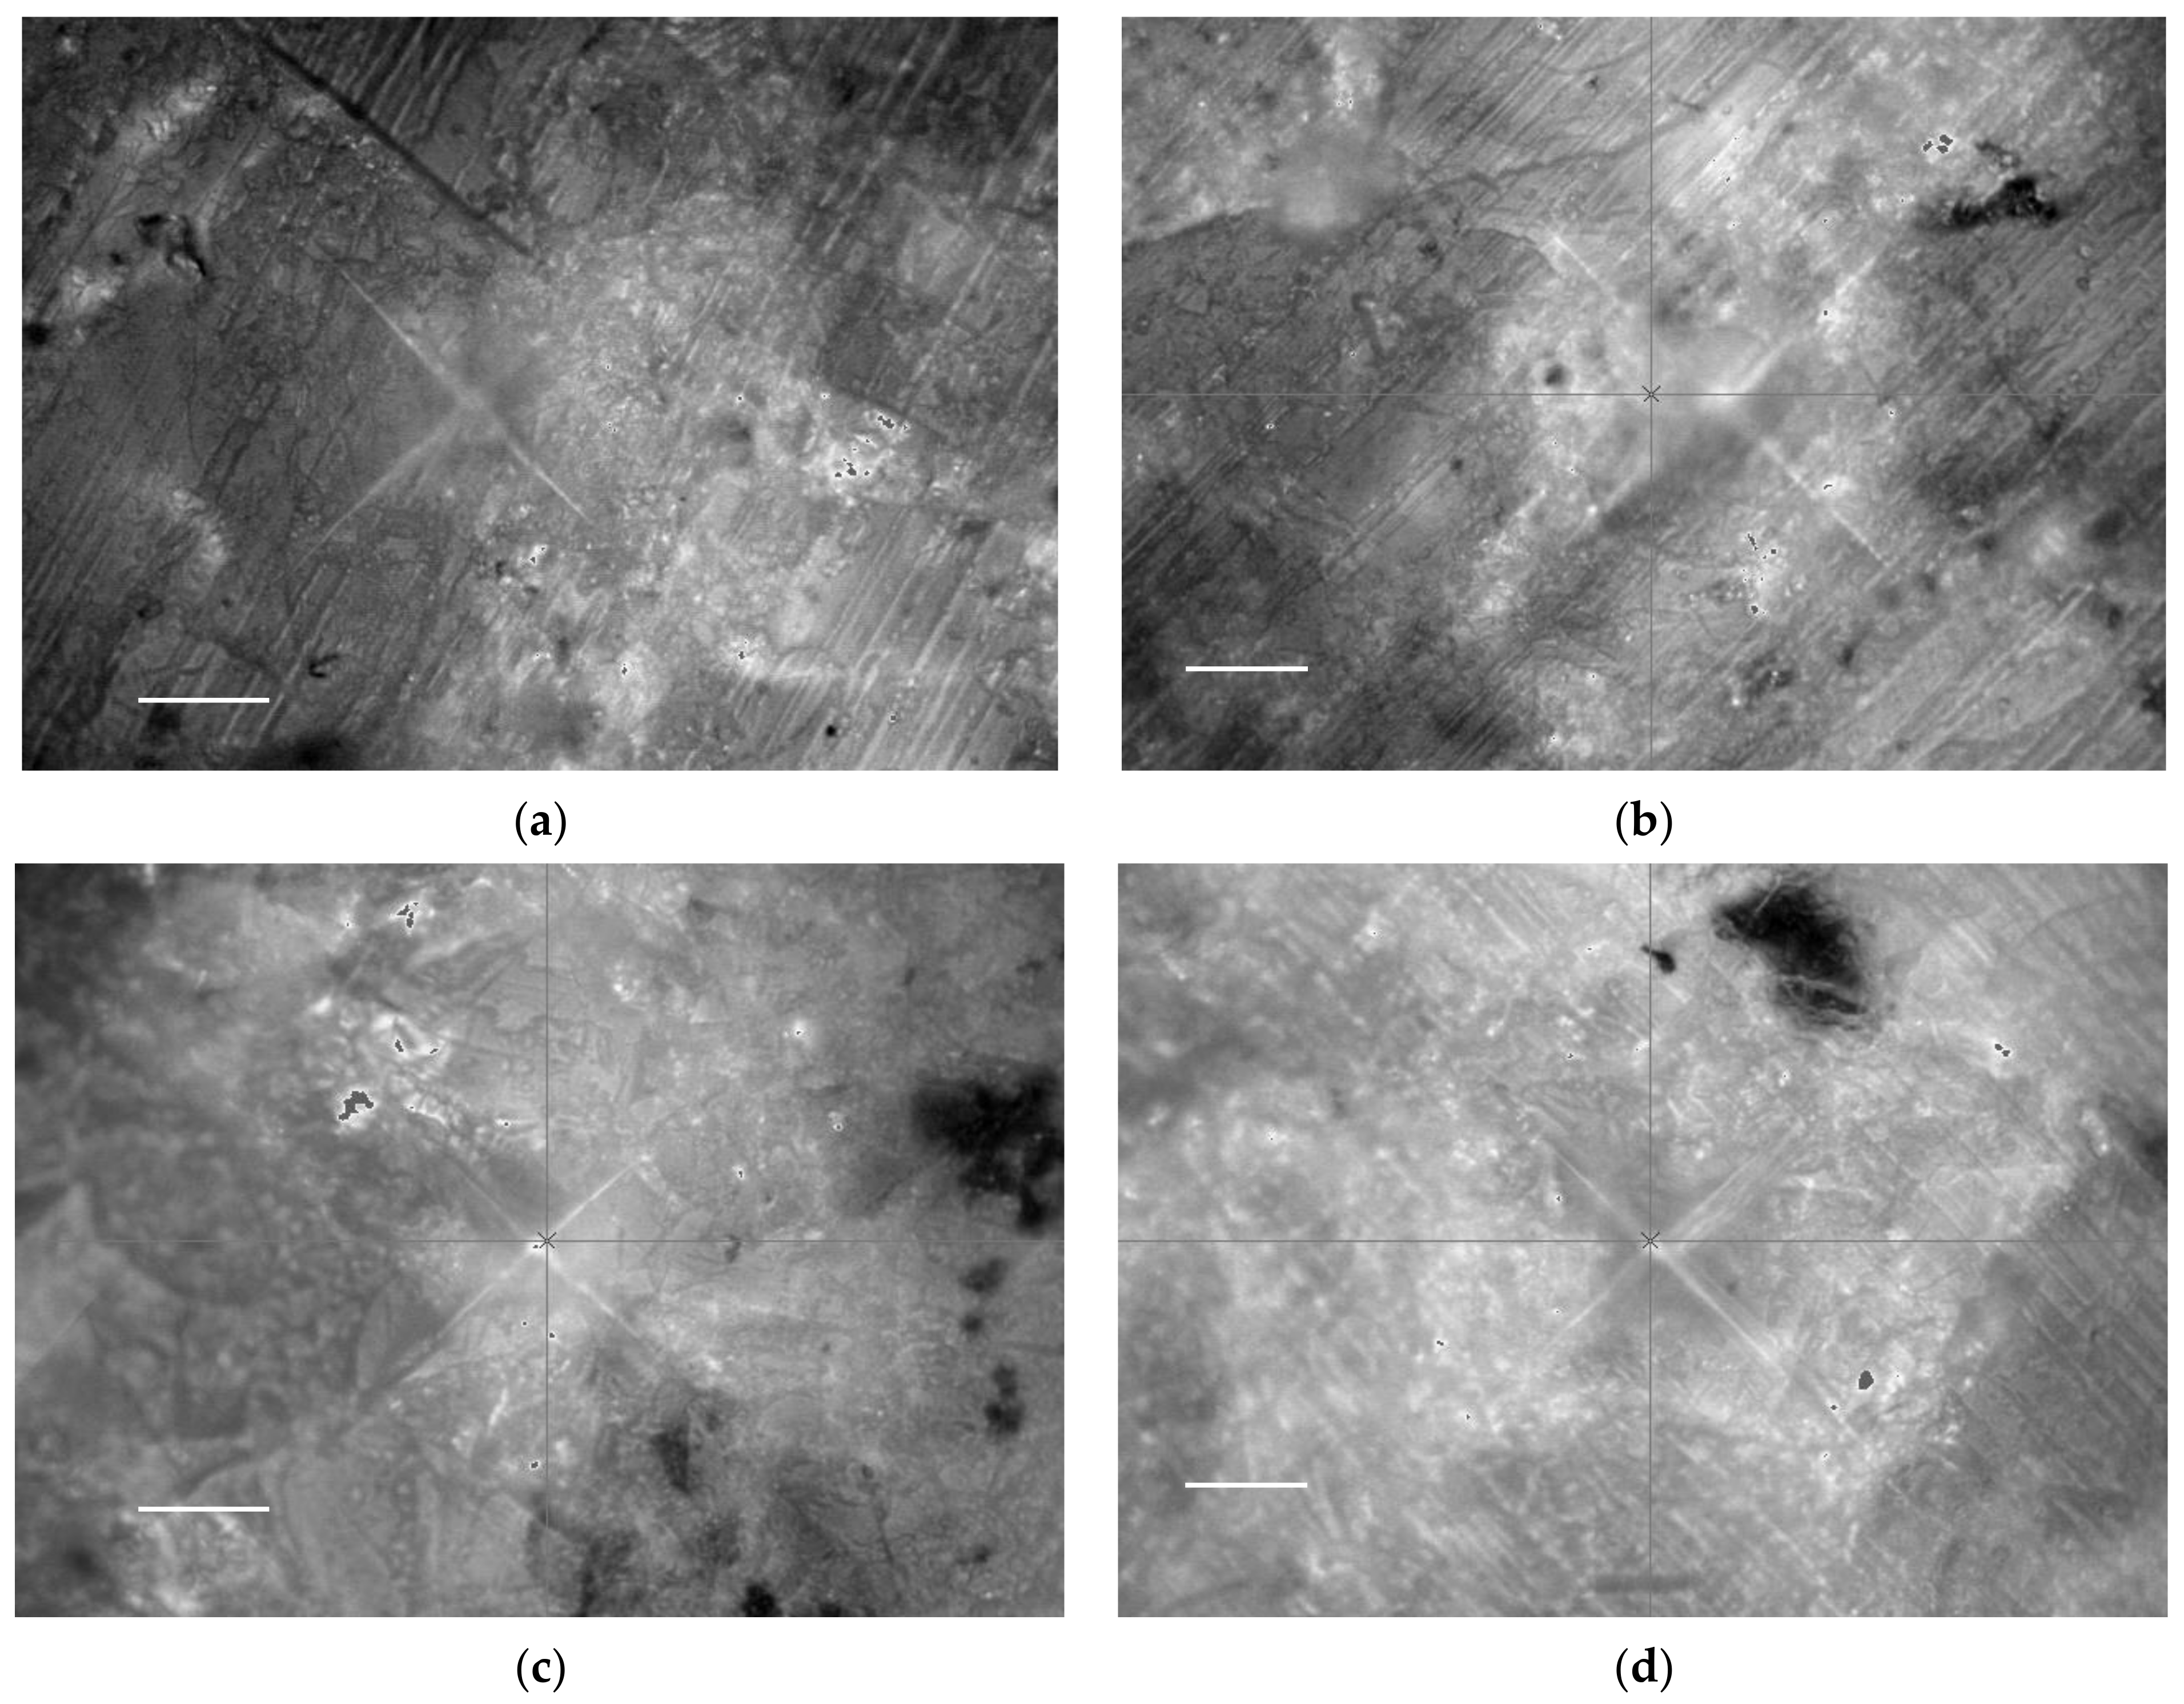
3.5. Vickers Hardness Test

High pressure occurs at the centers of planets and in explosions. High pressure can also be applied to laboratory samples in a controlled way using high-pressure instruments, such as a diamond anvil cell or an indentation test. The Vickers hardness test was conducted using a four-sided pyramidal diamond indenter with an angle of 136° between two opposite faces, as shown in Figure 10.
Vickers hardness H ν is defined as load P divided by surface area A of the indentation. From the geometry of the shape (see Figure 10), we derived surface area A of an indentation as follows:
A = a 2 s i n 136 2
d 2 = 2 a 2
A = d 2 2 s i n 136 2
H v = 1854.4 × p d 2
These composites of silica gel and MWCNTs were characterized to evaluate the effect of MWCNTs on the composites’ mechanical characteristics [36,37,38]. Indentation tests (see Figure 10) were performed on these composites to obtain the variation in hardness by varying the composition of MWCNTs in the silica gel. The hardness of silica gel and MWCNTs is illustrated in Figure 11, along with the effect of adding various weights of MWCNTs on the overall hardness when compared to pure silica gel base substance. Vickers hardness measurements were undertaken using the Reichert Microhardness tester. There are three measurements were made on each sample at the specified load, the diameters of residual indentations were measured. The corresponding hardness was calculated then the average was taken. The results of the Vickers hardness analysis indicate that when silica gel was supported by 1CNT, 2CNT, and 3CNT, the hardness increased as the concentration of MWCNTs increased [38].
As can been seen in Table 3, annealing increases composite hardness, which can possibly be attributed to the developed cross-linked structures and good dispersion of CNTs in the composite matrix [39]. Annealing might suppress the formation of voids and consequently improve the hardness or mechanical strength and lower MWCNT aggregation [40].
In summary, Table 4 shows several studies on composites of base materials (including SG) and MWCNTs, where chemical and/or physical functionalization was undertaken along with several characterization techniques for possible application along with the current study. The hardness of the composites of SG and MWCNTs increased with increased contents of MWCNTs, in good agreement with previous work [39,41]. Previous studies also reported that as the temperature of annealing increases hardness increases [39]. Udah et al. [39] reported that the hardness of CNTs/Se80Te16Cu4 glassy composites at 400 °C to be 35 GPa. Wang et al., [41] showed that the hardness of Ti3AlC2-MWCNTs composites at a high percent weight of MWCNTs (2 wt%) without annealing is 37.4 GPa.

4. Conclusions and Future Work

The study examined and characterized composites of silica gel and MWCNTs of 0.25, 0.50, and 0.75 wt%. Based on the morphological, optical, and mechanical characterizations and annealing, the following conclusions can be made:
(1)
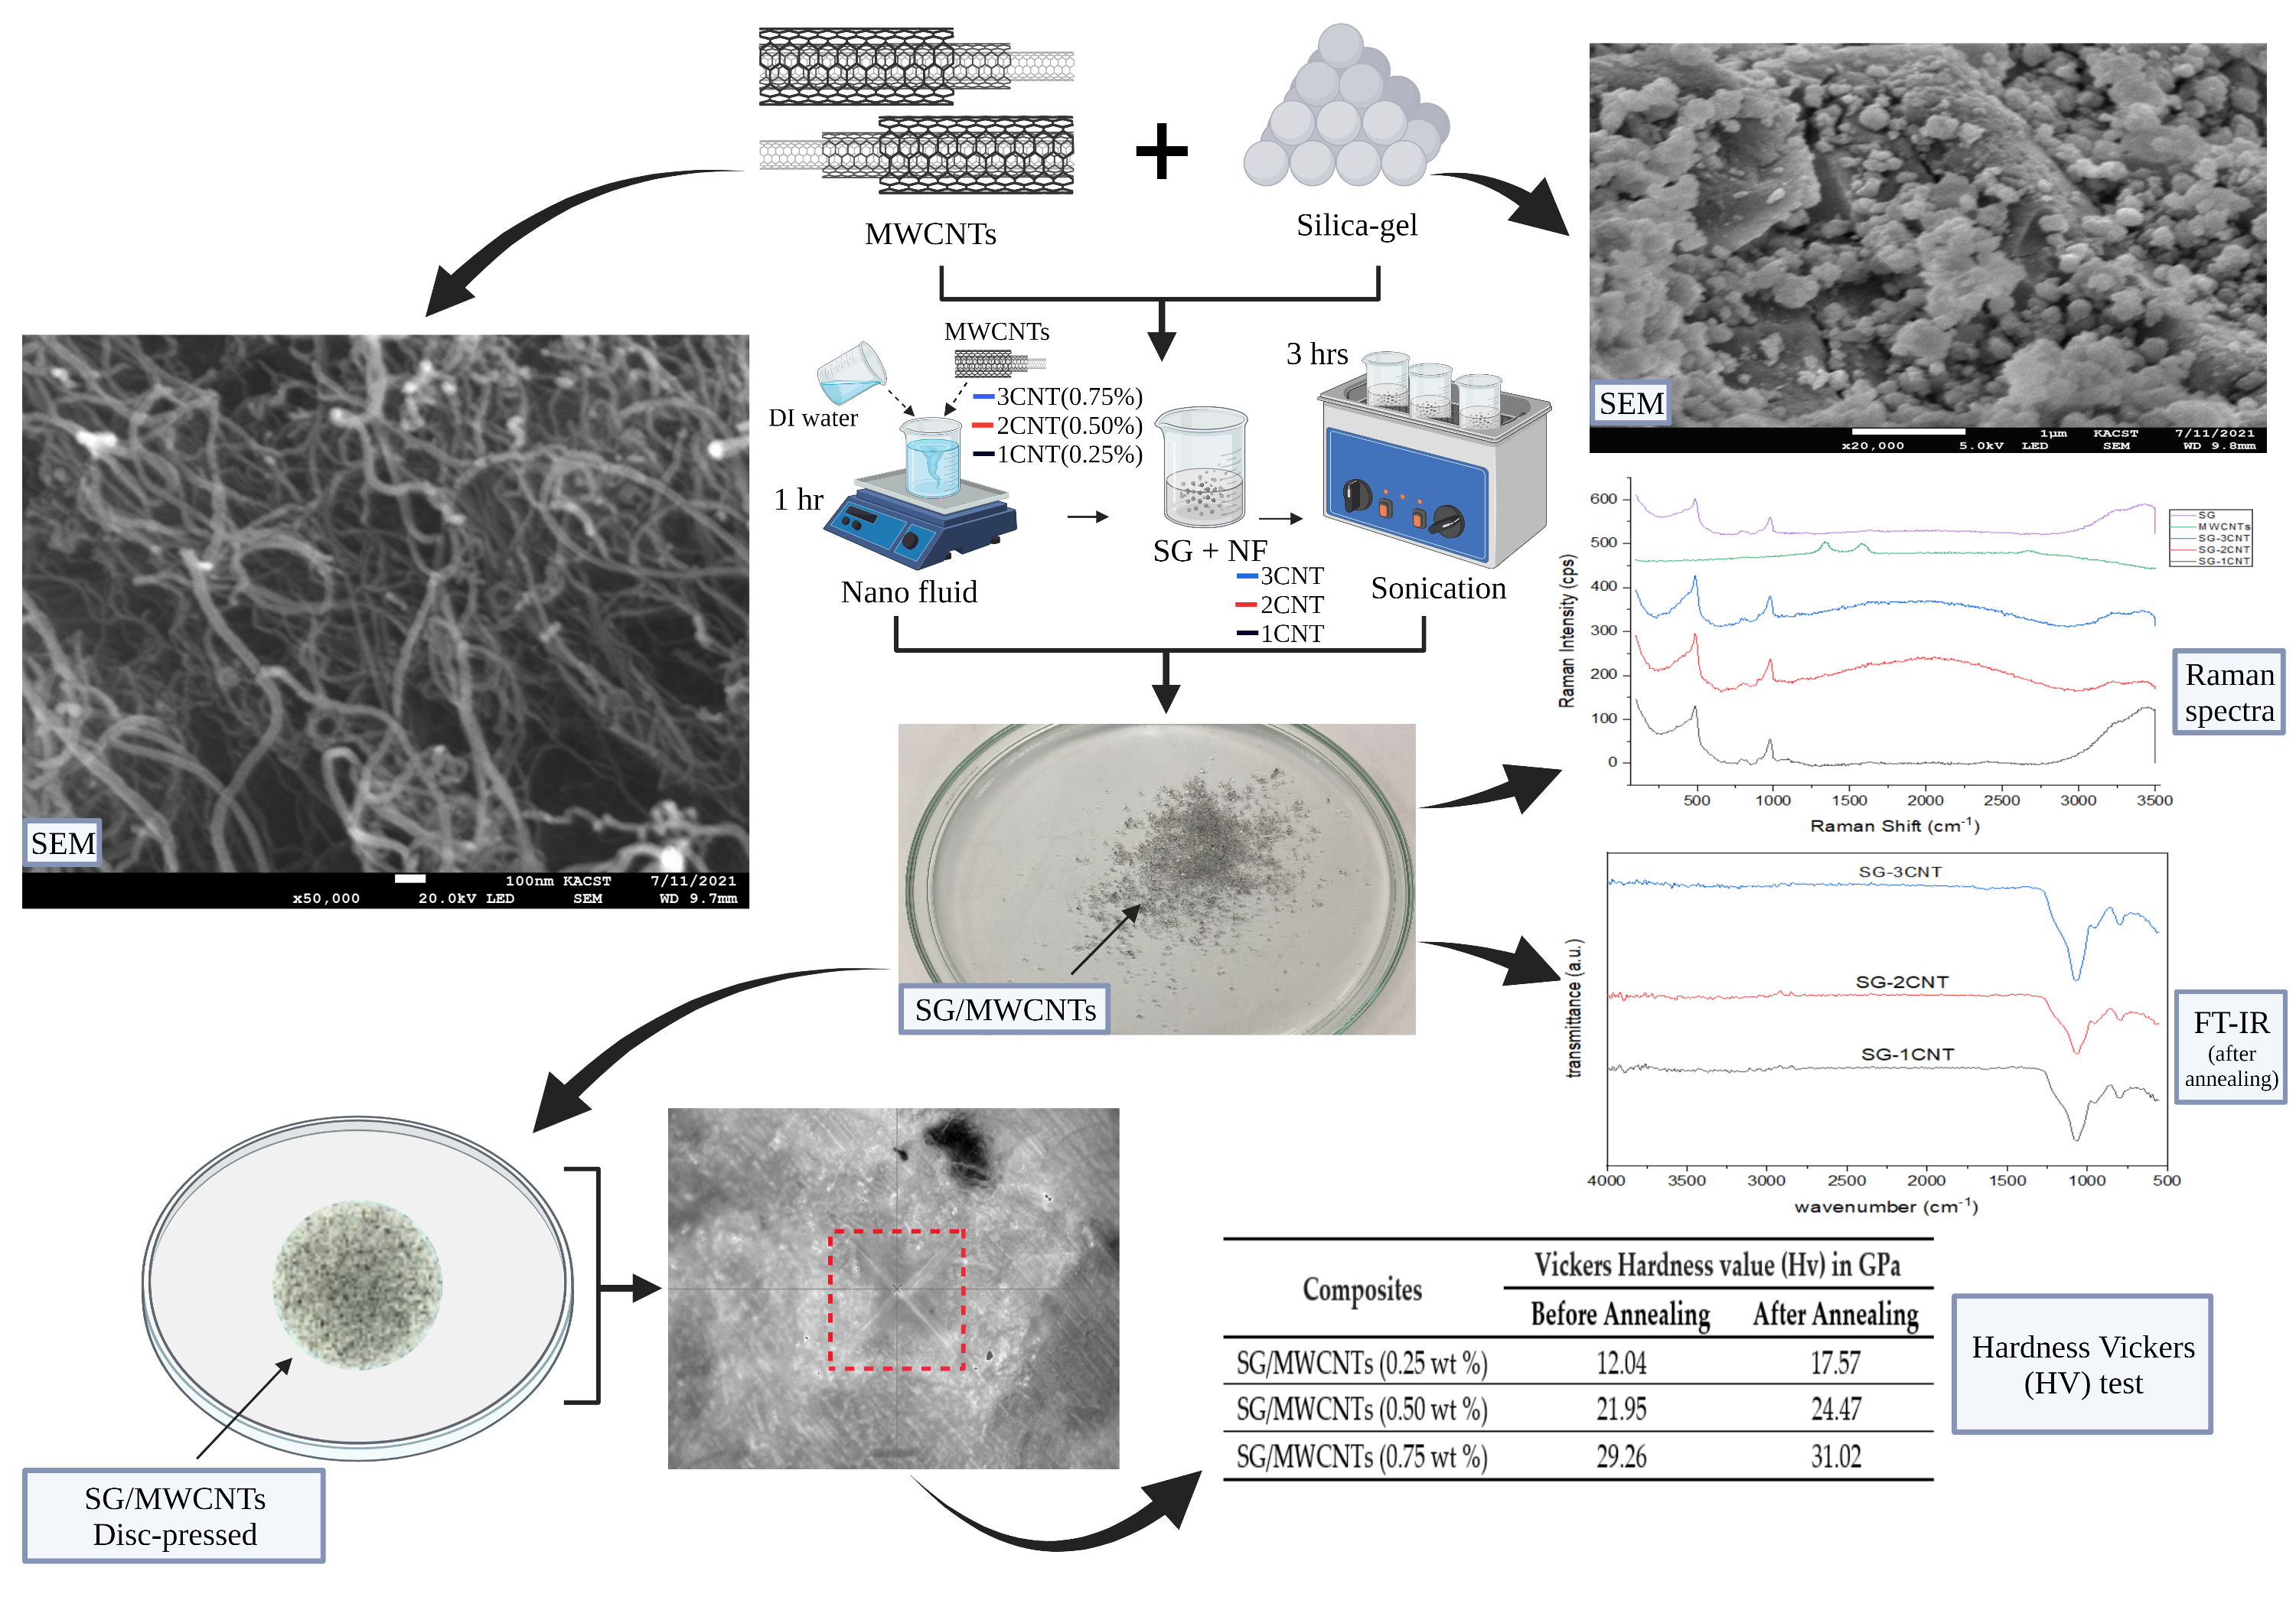
SEM micrographs and EDX showed that silica gel and MWCNT composites were mixed, with the lengthy MWCNTs tangled and the silica gel particulates immersed between the nanotubes. Low concentrations of MWCNTs are sufficient to produce balanced composites.
(2)
Annealing at 400 °C confirmed the functionalization of the composites, as shown by the FTIR measurements.
(3)
Raman spectra were mainly dominated by the base materials, due to the presence of MWCNTs in very low concentrations.
(4)
The Nanosizer showed that the best distribution of MWCNTs in the composite matrix occurred at 0.25 wt%, with high reproducibility rates.
(5)
As the percent weight of MWCNTs increased within the matrix of silica gel composites, the Vickers hardness value increased. Annealing further improved the strength of the composites.
(6)
Further studies are required to investigate the pore structure of silica gel within the matrix of MWCNTs, as the enhancement of cooling and water purification is very much associated with these micro- and nanosized particulates.
Finally, these findings should encourage further studies of these composites of silica gel and MWCNTs to be deployed for various designed applications.

Supplementary Materials

The following are available online at https://www.mdpi.com/article/10.3390/cryst11111280/s1, Figure S1. Raman spectrum of silica gel. There are sharp peaks at 480, 780, and 990 cm−1 and a broad band centered at 2100 cm−1 in addition to two superimposed peaks at 3250 and 3400 cm−1. Figure S2. Raman scattering spectrum of silica gel and 0.25 wt% MWCNT composite. Figure S3. Raman scattering spectrum of silica gel and 0.50 wt% MWCNT composite. Figure S4. Raman scattering spectrum of silica gel and 0.75 wt% MWCNT composite. Figure S5. Zetasizer spectra of intensity vs. particle size distribution at various concentrations of MWCNTs in the silica gel composites: (a) 0.25 wt%; (b) 0.5 wt%; (c) 0.75 wt%. (d) Bar chart shows statistical analysis size distributions of MWCNTs in composites; marks on each bar indicate standard deviations in size measurements.

Author Contributions

Conceptualization, experimental work, analysis, data presentation, writing—review and editing, M.S.A.; experimental work, analysis, and methodology, N.H.A.; editing, M.A.A.; conceptualization, methodology, design, interpretation of results, writing—original draft, review and editing, M.K.; conceptualization, F.S.A.; methodology, N.H.K. All authors have read and agreed to the published version of the manuscript.

Funding

This work was done at the National Energy Storage center within the framework of the Joint National Excellence Center of King Abdulaziz City of Science Technology (KACST) and the Saudi Electrical Company (SEC).

Institutional Review Board Statement

Not applicable.

Informed Consent Statement

Not applicable.

Data Availability Statement

The obtained results are presented in the current article, and any further details can be provided by the corresponding author.

Acknowledgments

The authors would like to thank their colleagues at KACST for help with lab access and measurements, particularly Khaled A. AlOgab, Rawan M. Alsulami, the National Center of Composites and Advanced Materials, Materials Science Research Institute, and Yasser M. Alhindi at the National Center for Pharmaceutical Technology, Life Science, and Environmental Research Institute.

Conflicts of Interest

The authors declare that the research was conducted in the absence of any commercial or financial relationships that could be construed as a potential conflict of interest.

References

  1. Iijima, S. Helical Microtubules of Graphitic Carbon. Nature 1991, 354, 56–58. [Google Scholar] [CrossRef]
  2. Radushkevich, L.V.; Lukyanovich, V.M. On the structure of carbon produced at thermal decomposition of carbon monoxide on an iron contact. J. Phys. Chem. 1952, 26, 88–95. [Google Scholar]
  3. Oberlin, A.; Endo, M. Filamentous Growth of Carbon Through Benzene Decomposition. J. Cryst. Growth 1976, 32, 335–349. [Google Scholar] [CrossRef]
  4. Singer, G.; Siedlaczek, P.; Sinn, G.; Rennhofer, H.; Mičušík, M.; Omastová, M.; Unterlass, M.M.; Wendrinsky, J.; Milotti, V.; Fedi, F.; et al. Acid Free Oxidation and Simple Dispersion Method of MWCNT for High-Performance CFRP. Nanomaterials 2018, 8, 912. [Google Scholar] [CrossRef] [Green Version]
  5. Singer, G.; Sinn, G.; Rennhofer, H.; Schuller, R.; Grünewald, T.A.; Unterlass, M.M.; Windberger, U.; Lichtenegger, H.C. High performance functional composites by in-situ orientation of carbon nanofillers. Compos. Struct. 2019, 215, 178–184. [Google Scholar] [CrossRef]
  6. Freni, A.; Calabrese, L.; Malara, A.; Frontera, P.; Bonaccorsi, L. Silica Gel Microfibres by Electrospinning for Adsorption Chillers. Energy 2019, 187. [Google Scholar] [CrossRef]
  7. Pan, Q.W.; Wang, R.Z. Study on Boundary Conditions of Adsorption Heat Pump Systems Using Different Working Pairs for Heating Application. Energy Convers. Manag. 2017, 154, 322–335. [Google Scholar] [CrossRef]
  8. Qadir, N.U.; Said, S.A.M.; Mansour, R.B.; Mezghani, K.; Ul-Hamid, A. Synthesis, Characterization, and Water Adsorption Properties of a Novel Multi-Walled Carbon Nanotube/MIL-100(Fe) Composite. Dalt. Trans. 2016, 45, 15621–15633. [Google Scholar] [CrossRef]
  9. Zhang, P.; Yang, L.C.; Li, L.L.; Ding, M.L.; Wu, Y.P.; Holze, R. Enhanced Electrochemical and Mechanical Properties of P(VDF-HFP)-Based Composite Polymer Electrolytes with SiO2 Nanowires. J. Memb. Sci. 2011, 379, 80–85. [Google Scholar] [CrossRef]
  10. Jin, F.; Feng, M.; Huang, X.; Long, C.; Jia, K.; Liu, X. Effect of SiO2 Grafted MWCNTs on the Mechanical and Dielectric Properties of PEN Composite Films. Appl. Surf. Sci. 2015, 357, 704–711. [Google Scholar] [CrossRef]
  11. Kocyigit, A.; Orak, I.; Karteri, İ.; Uruş, S. The Structural Analysis of MWCNT-SiO2 and Electrical Properties on Device Application. Curr. Appl. Phys. 2017, 17, 1215–1222. [Google Scholar] [CrossRef]
  12. Li, S.; Zhang, Y.; Lin, S.; Yan, J.; Du, S. Effects of Nano-SiO2 Coated Multi-Walled Carbon Nanotubes on Mechanical Properties of Cement-Based Composites. Constr. Build. Mater. 2021, 281, 122577. [Google Scholar] [CrossRef]
  13. Sharma, N.; Alam, S.N.; Ray, B.C.; Yadav, S.; Biswas, K. Silica-Graphene Nanoplatelets and Silica-MWCNT Composites: Microstructure and Mechanical Properties. Diam. Relat. Mater. 2018, 87, 186–201. [Google Scholar] [CrossRef]
  14. Piao, Y.; Tondare, V.N.; Davis, C.S.; Gorham, J.M.; Petersen, E.J.; Gilman, J.W.; Scott, K.; Vladár, A.E.; Hight Walker, A.R. Comparative Study of Multiwall Carbon Nanotube Nanocomposites by Raman, SEM, and XPS Measurement Techniques. Compos. Sci. Technol. 2021, 208. [Google Scholar] [CrossRef]
  15. Sharma, N.; Alam, S.N. Influence of Surface Roughness on Wear Behaviour of Ceramic Nanocomposites. Mater. Today Proc. 2018, 5, 28051–28060. [Google Scholar] [CrossRef]
  16. Zeng, X.; Yu, S.; Ye, L.; Li, M.; Pan, Z.; Sun, R.; Xu, J. Encapsulating Carbon Nanotubes with SiO2: A Strategy for Applying Them in Polymer Nanocomposites with High Mechanical Strength and Electrical Insulation. J. Mater. Chem. C 2015, 3, 187–195. [Google Scholar] [CrossRef]
  17. He, Y.; Chen, C.; Zhong, F.; Chen, H. Synthesis and Characterization: Silicon Oxide-Coated Multiwalled Carbon Nanotubes and Properties of Composite Coating Research. High Perform. Polym. 2015, 27, 352–361. [Google Scholar] [CrossRef] [Green Version]
  18. de Andrade, M.J.; Lima, M.D.; Bergmann, C.P.; de O Ramminger, G.; Balzaretti, N.M.; Costa, T.M.H.; Gallas, M.R. Carbon Nanotube/Silica Composites Obtained by Sol–Gel and High-Pressure Techniques. Nanotechnology 2008, 19, 265607. [Google Scholar] [CrossRef]
  19. Contreras-Navarrete, J.J.; Ambriz-Torres, J.M.; Gutiérrez-García, C.J.; Granados-Martínez, F.G.; Flores-Ramírez, N.; Vásquez-García, S.R.; Mondragón-Sánchez, M.L.; García-González, L.; Zamora-Peredo, L.; Domratcheva-Lvova, L. Electrical Conductivity and Vickers Hardness Enhancement by Pristine and Functionalized MWCNTs Incorporation in Polycaprolactam Matrix. J. Mater. Sci. Mater. Electron. 2018, 29, 15776–15783. [Google Scholar] [CrossRef]
  20. Khayyat, M. Structural Phase Transformation of Semiconductors. Ph.D. Thesis, University of Cambridge, Cambridge, UK, 2004. [Google Scholar]
  21. Dresselhaus, M.; Lin, Y.-M.; Rabin, O.; Black, M.; Kong, J.; Dresselhaus, G. Nanowires. In Springer Handbook of Nanotechnology; Bhushan, B., Ed.; Springer: Berlin/Heidelberg, Germany, 2007; pp. 113–160. ISBN 978-3-540-29857-1. [Google Scholar]
  22. Wu, Y.; Fan, R.; Yang, P. Block-by-Block Growth of Single-Crystalline Si/SiGe Superlattice Nanowires. Nano Lett. 2002, 2, 83–86. [Google Scholar] [CrossRef]
  23. Atchudan, R.; Pandurangan, A.; Joo, J. Effects of Nanofillers on the Thermo-Mechanical Properties and Chemical Resistivity of Epoxy Nanocomposites. J. Nanosci. Nanotechnol. 2015, 15, 4255–4267. [Google Scholar] [CrossRef]
  24. Wang, B.; Song, K.; Han, Y.; Zhang, T. Synthesis and Characterization of Multi-Walled Carbon Nanotube Doped Silica Aerogels. J. Wuhan Univ. Technol. Mater. Sci. Ed. 2012, 27, 512–515. [Google Scholar] [CrossRef]
  25. Hanzel, O.; Sedláček, J.; Hadzimová, E.; Šajgalík, P. Thermal Properties of Alumina-MWCNTs Composites. J. Eur. Ceram. Soc. 2015, 35, 1559–1567. [Google Scholar] [CrossRef]
  26. Javed, M.; Abbas, S.M.; Hussain, S.; Siddiq, M.; Han, D.; Niu, L. Amino-Functionalized Silica Anchored to Multiwall Carbon Nanotubes as Hybrid Electrode Material for Supercapacitors. Mater. Sci. Energy Technol. 2018, 1, 70–76. [Google Scholar] [CrossRef]
  27. Kulakowska, A.; Pajdak, A.; Krzywanski, J.; Grabowska, K.; Zylka, A.; Sosnowski, M.; Wesolowska, M.; Sztekler, K.; Nowak, W. Effect of Metal and Carbon Nanotube Additives on the Thermal Diffusivity of a Silica-Gel-Based Adsorption Bed. Energies 2020, 16, 1391. [Google Scholar] [CrossRef] [Green Version]
  28. David, M.E.; Ion, R.-M.; Grigorescu, R.M.; Iancu, L.; Andrei, E.R.; Somoghi, R.; Frone, A.N.; Stirbescu, R.M. Chemical Synthesis of Multi-Walled Carbon Nanotubes and Their Functionalization with Carboxylated Groups. Proceedings 2020, 57, 45. [Google Scholar] [CrossRef]
  29. Terrones, M.; Botello-Méndez, A.R.; Campos-Delgado, J.; López-Urías, F.; Vega-Cantú, Y.I.; Rodríguez-Macías, F.J.; Elías, A.L.; Muñoz-Sandoval, E.; Cano-Márquez, A.G.; Charlier, J.-C.; et al. Graphene and Graphite Nanoribbons: Morphology, Properties, Synthesis, Defects and Applications. Nano Today 2010, 5, 351–372. [Google Scholar] [CrossRef]
  30. Malekfar, R.; Rajabi, M.H.; Ara, M.H.M. Structural and Optical Characteristics of Silica Nano- Tubes Using CNTs as Template. Nano-Micro Lett. 2010, 2, 268–271. [Google Scholar] [CrossRef]
  31. Bertoluzza, A.; Fagnano, C.; Antonietta Morelli, M.; Gottardi, V.; Guglielmi, M. Raman and Infrared Spectra on Silica Gel Evolving toward Glass. J. Non. Cryst. Solids 1982, 48, 117–128. [Google Scholar] [CrossRef]
  32. Matsui, K.; Satoh, H.; Kyoto, M. Raman Spectra of Silica Gel Prepared from Triethoxysilane and Tetraethoxysilane by the Sol-Gel Method. J. Ceram. Soc. Japan 1998, 106, 528–530. [Google Scholar] [CrossRef] [Green Version]
  33. Rao, A.M.; Richter, E.; Smalley, R.E.; Dresselhaus, G.; Dresselhaus, M.S.; Bandow, S.; Chase, B.; Eklund, P.C.; Williams, K.; Fang, S.; et al. Diameter-Selective Raman Scattering from Vibrational Modes in Carbon Nanotubes. Science 1997, 275, 187–191. [Google Scholar] [CrossRef] [Green Version]
  34. Akbar, S.; Beyou, E.; Chaumont, P.; Mazzolini, J.; Espinosa, E.; D’agosto, F.; Boisson, C. Synthesis of Polyethylene-Grafted Multiwalled Carbon Nanotubes via a Peroxide-Initiating Radical Coupling Reaction and by Using Well-Defined TEMPO and Thiol End-Functionalized Polyethylenes. J. Polym. Sci. A Polym. Chem. 2011, 49, 957–965. [Google Scholar] [CrossRef]
  35. Gao, W.; Qi, Q.; Dong, L.; Lv, X.; Huang, W. Experimental Evaluation of the Lubrication Performance of Milling Al7075 with Different Nano-Fluids MQL. J. Phys. Conf. Ser. 2021, 1744. [Google Scholar] [CrossRef]
  36. Lamnini, S.; Károly, Z.; Bódis, E.; Balázsi, K.; Balázsi, C. Influence of Structure on the Hardness and the Toughening Mechanism of the Sintered 8YSZ/MWCNTs Composites. Ceram. Int. 2019, 45, 5058–5065. [Google Scholar] [CrossRef]
  37. Luo, J.T.; Wen, H.C.; Chou, C.P.; Wu, W.F.; Wan, B.Z. Reinforcing Porous Silica with Carbon Nanotubes to Enhance Mechanical Performance. J. Compos. Mater. 2007, 41, 979–991. [Google Scholar] [CrossRef]
  38. Winarto, W.; Priadi, D.; Sofyan, N.; Wicaksono, A. Wear Resistance and Surface Hardness of Carbon Nanotube Reinforced Alumina Matrix Nanocomposite by Cold Sprayed Process. Procedia Eng. 2017, 170, 108–112. [Google Scholar] [CrossRef]
  39. Upadhyay, A.N.; Tiwari, R.S.; Singh, K. Annealing Effect on Thermal Conductivity and Microhardness of Carbon Nanotube Containing Se80Te16Cu4 Glassy Composites. Mater. Res. Express 2018, 5. [Google Scholar] [CrossRef]
  40. Nemeth, K.; Varro, N.; Reti, B.; Berki, P.; Adam, B.; Belina, K.; Hernadi, K. Synthesis and Investigation of SiO2-MgO Coated MWCNTs and Their Potential Application. Sci. Rep. 2019, 9, 1–12. [Google Scholar] [CrossRef] [Green Version]
  41. Wang, K.; Zhou, Y.; Yu, C.; Xiang, M.; Huang, D.; Xu, W. Synthesis and Strengthening of Ti3AlC2 by Doping with Carbon Nanotubes. J. Alloys Compd. 2016, 654, 120–125. [Google Scholar] [CrossRef]
  42. Li, A.; Li, W.; Ling, Y.; Gan, W.; Brady, M.A.; Wang, C. Effects of Silica-Coated Carbon Nanotubes on the Curing Behavior and Properties of Epoxy Composites. RSC Adv. 2016, 6, 23318–23326. [Google Scholar] [CrossRef] [Green Version]
Figure 1. Preparation procedure for silica gel with MWCNTs.
Crystals 11 01280 g001
Figure 2. SEM micrograph of MWCNTs used in preparing composites. The scale bar indicates 1 μm. The inset image of MWCNTs shows that the average diameter is not less than 12 nm.
Crystals 11 01280 g002
Figure 3. SEM image of silica gel particles; image scale bar indicates 1 μm. The inset image shows that their average size is above 500 μm.
Crystals 11 01280 g003
Figure 4. SEM images of 0.25 wt% MWCNT and silica gel composite at (a) 1 μm and (b) 100 nm scale.
Crystals 11 01280 g004
Figure 5. SEM images of 0.5 wt% MWCNT and silica gel composite at (a) 1 μm and (b) 100 nm scale.
Crystals 11 01280 g005
Figure 6. SEM images of 0.75 wt% MWCNT and silica gel composite at (a) 1 μm and (b) 100 nm scale.
Crystals 11 01280 g006
Figure 7. Results of FTIR test for MWCNTs, silica gel composites, and SG/xMWCNTs (x = 0.25, 0.50, and 0.75 wt%).
Crystals 11 01280 g007
Figure 8. FTIR spectra of SG/MWCNT composites at various concentrations after annealing.
Crystals 11 01280 g008
Figure 9. Raman spectra were acquired from original control samples of silica gel and MWCNTs, and three composites of both: SG-1CNT (0.25 wt%), SG-2CNT (0.50 wt%), and SG-3CNT (0.75 wt%).
Crystals 11 01280 g009
Figure 10. Some details of the Vickers indenter (angle of interfacial 136°), together with its impression, where d is the diagonal’s average length in μm.
Crystals 11 01280 g010
Figure 11. Optical micrographs of Vickers residual indentations of silica gel and MWCNT composites at 300 K: (a) SG. CNT silica gel at (b) 0.25 wt%, (c) 0.5 wt%, and (d) 0.75 wt%. Edges of indentation along with diagonal cracks are clearly defined. See scale bar is a 100 µm.
Crystals 11 01280 g011
Table 1. Silica gel specifications.
ItemsUnitSpecTest Method
Adsorption Capacity20% RH%10 ↑KS T 1084
50% RH25 ↑KS T 1084
90% RH35 ↑KS T 1084
Bulk Densityg/cc670–750KS T 1084
pH Value-4.0–6.0KS T 1084
Specific ResistanceΩ·cm3000 ↑KS T 1084
Moisture Content%2 ↓KS T 1084
Surface Aream2/g670–770BET
Pore VolumemL/g0.35–0.55BET
Pore Volume per GramA20–28-
Particle Size
Size20 mesh over%5.0 ↓KS T 1084
40 mesh under%5.0 ↓KS T 1084
Table 2. Concentrations of various prepared composites of silica gel and MWCNTs and the amounts used in preparation.
NoSilica GelMWCNTs
14.9875 g
(99.75 w/w %)
0.0125 g
(0.25 w/w %)
24.975 g
(99.5 w/w %)
0.025 g
(0.5 w/w %)
34.9625 g
(99.25 w/w %)
0.0375 g
(0.75 w/w %)
Table 3. Vickers hardness values (Hv), at 200 gf load and 15 s loading time, of various composites of SG/MWCNTs (CN1, CN2, and CN3) with different concentrations of MWCNTs (0.25, 0.50, and 0.75 wt%) as is (before annealing), and after annealing at 400 °C for 4 h.
CompositeVickers Hardness Value (Hv) in GPa
Before AnnealingAfter Annealing
SG/MWCNTs (0.25 wt%)12.0417.57
SG/MWCNTs (0.50 wt%)21.9524.47
SG/MWCNTs (0.75 wt%)29.2631.02
Table 4. Summary of characterizations of nanocomposites including MWCNTs in the current study and in previous work.
MaterialFunctionalizationCharacterization TechniquesObservationsApplications and OutcomesReferences
SG/MWCNTsAnnealing (physical functionalization)(1) SEM and EDX
(2) FTIR
(3) Raman spectroscopy
(4) Micro-hardness test
(1) MWCNTs incorporated within SG matrix at low concentrations
(2) Annealing functionalizing composites
(3) Dominated mainly by MWCNTs
(4) Hv increased with MWCNTs and annealing
Annealing at 400 °C for 4 h was sufficient for optimum results and improved optical and mechanical propertiesCurrent study, 2021
SiO2-MgO coated MWCNTsChemical functionalization via sol–gel
Physical functionalization,
annealing in air at 400 °C for 4 h
(1) Raman spectroscopy
(2) SEM
(1) Scattering peaks at 1345, 1574, and 2685 cm−1 corresponding to D, G, and G’ modes.
(2) Incorporated in different types of polymer matrices, kept polymer parts together
Dispersion of MWCNTs increased in polymer matricesNemeth et al., 2019
[40]
CNTs/Se80Te16Cu4 glassy compositesCNTs incorporated into Se80Te16Cu4 glassy matrix via melt-quenched technique(1) Vickers microhardness test
(2) SEM
(1) Hardness increased with increased annealing temperature
(2) Thermal annealing with successive increase in temperature could improve dispersion of CNTs
Greater mechanical strengthUpadhyay et al., 2018
[39]
Ti3AlC2-MWCNTs compositesHot pressing method in Ar atmosphere at 1300 °C under a pressure of 20 MPa.(1) Vickers Hardness
(2) SEM
(1) Hardness increased with increased content of MWCNTs up to 2 wt%
(2) MWCNTs enwrapped in Ti3AlC2 grains were observed in SEM micrographs
Mechanical properties of Ti3AlC2 ceramic were greatly enhanced by MWCNTsWang et al., 2016
[41]
MWCNTs/MIL-100(Fe) compositeCarboxylic acid-functionalized MWCNTs(1) FTIR
(2) SEM
(1) Chemical integrity of structure preserved upon incorporation of MWCNTs using proposed synthesis method
(2) MWCNTs can also be seen implanted in surrounding MIL-100(Fe) matrix
Adsorption and cyclic stabilityQadir et al. 2016
[8]
SiO2/MWCNTsSiO2/MWCNTs prepared by sol–gel method(1) FTIR
(2) SEM
(1) Absorbance peaks at 1065, 964, and 793 cm−1 observed
(2) Better dispersion of MWCNTs in matrix
Optimized property needed in electronic packaging applicationsLi et al., 2016
[42]
Publisher’s Note: MDPI stays neutral with regard to jurisdictional claims in published maps and institutional affiliations.

