
Spectroscopic Identification of Amber Imitations: Different Pressure and Temperature Treatments of Copal Resins


Abstract
:1. Introduction
2. Materials and Methods
2.1. Samples
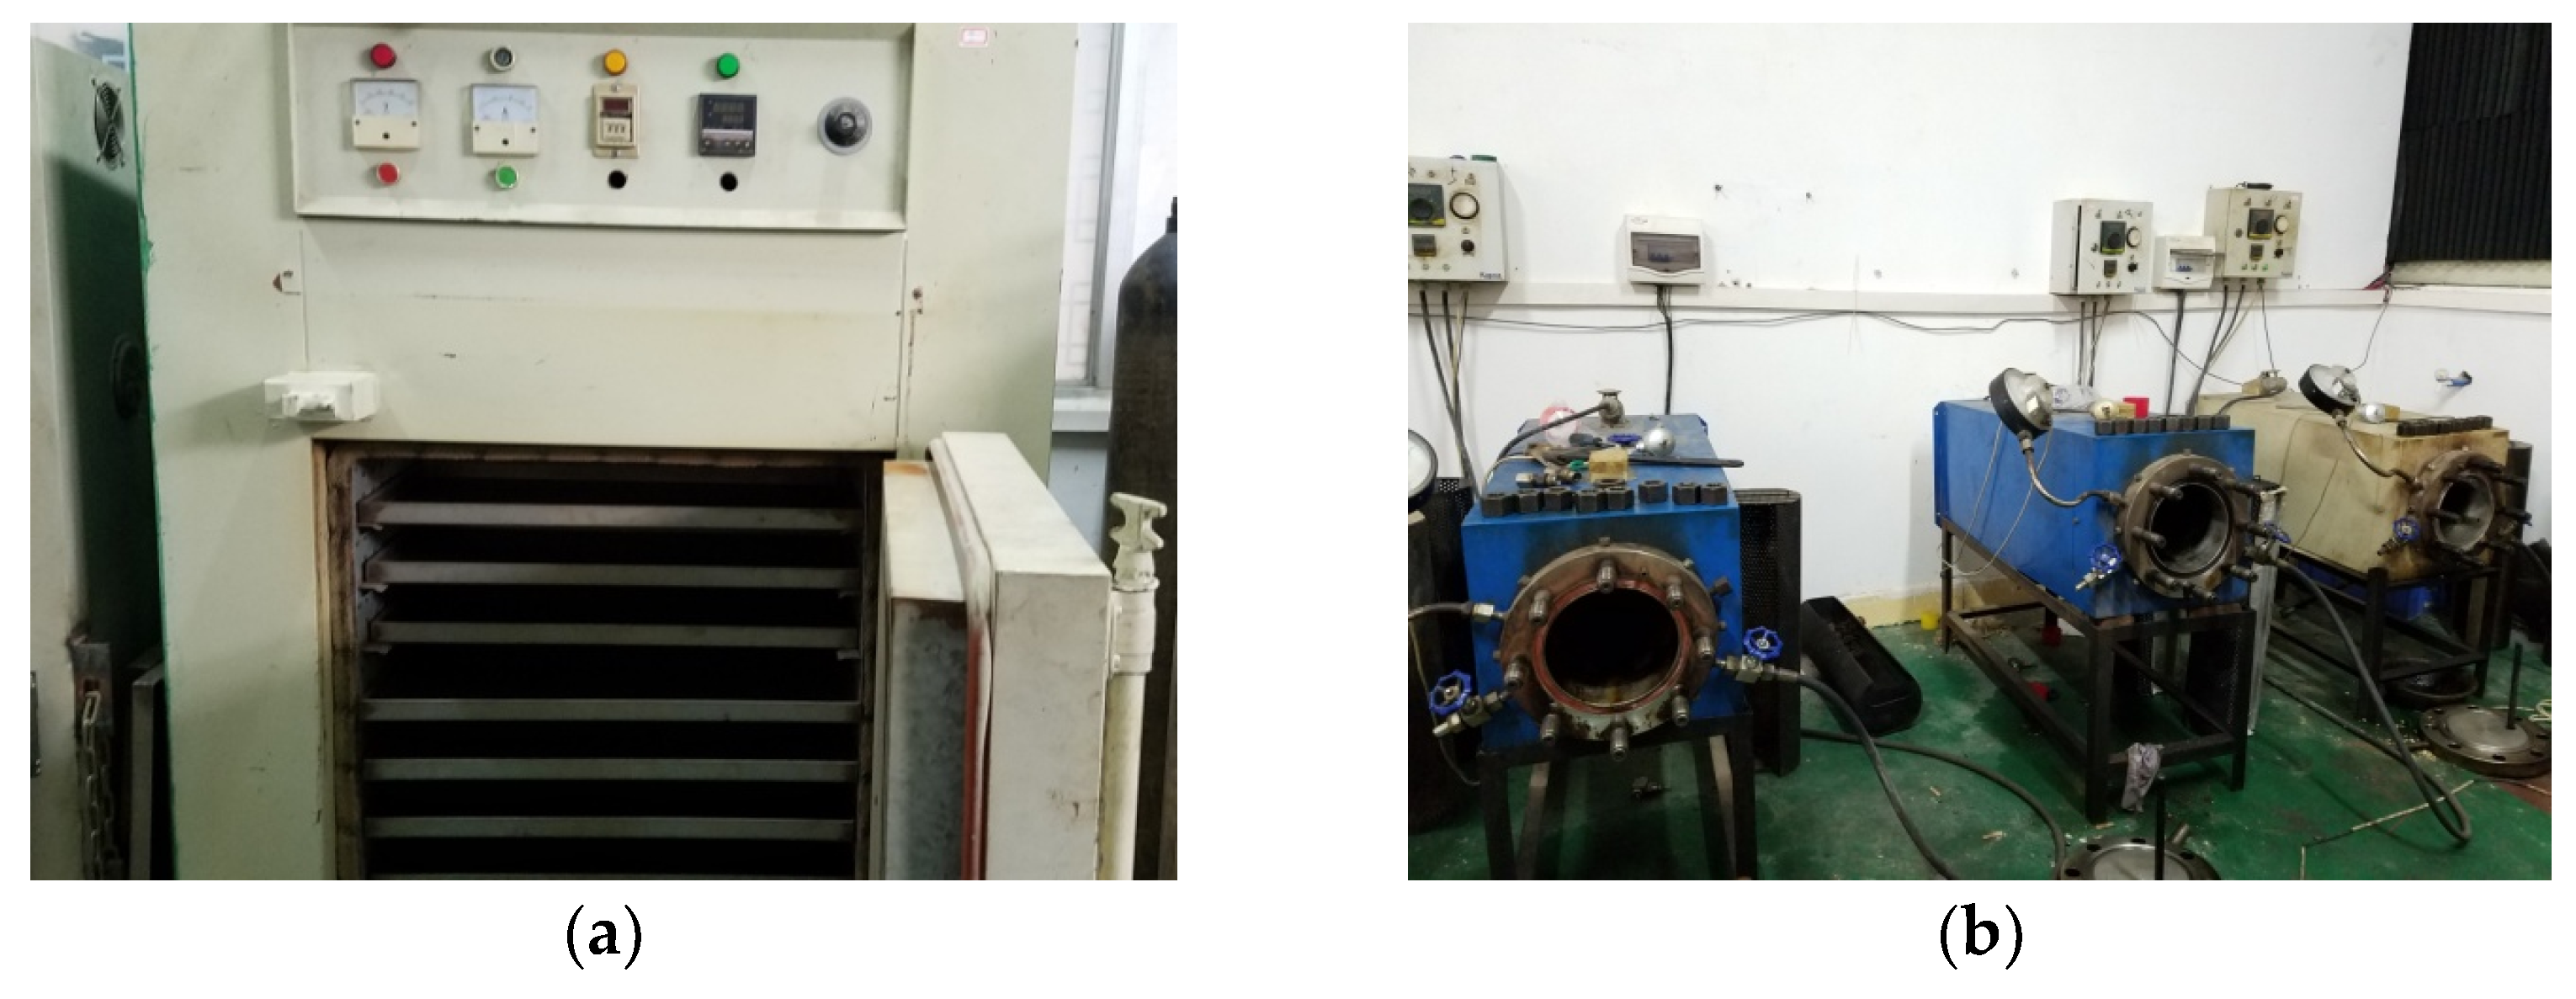
2.2. Temperature–Pressure Conditions
2.3. Analytical Methods
2.3.1. Fourier Transform Infrared Spectroscopy
2.3.2. Raman Spectroscopy
2.3.3. Nuclear Magnetic Resonance Spectroscopy
3. Results and Discussion
3.1. Colombia and Madagascar Copal Resins
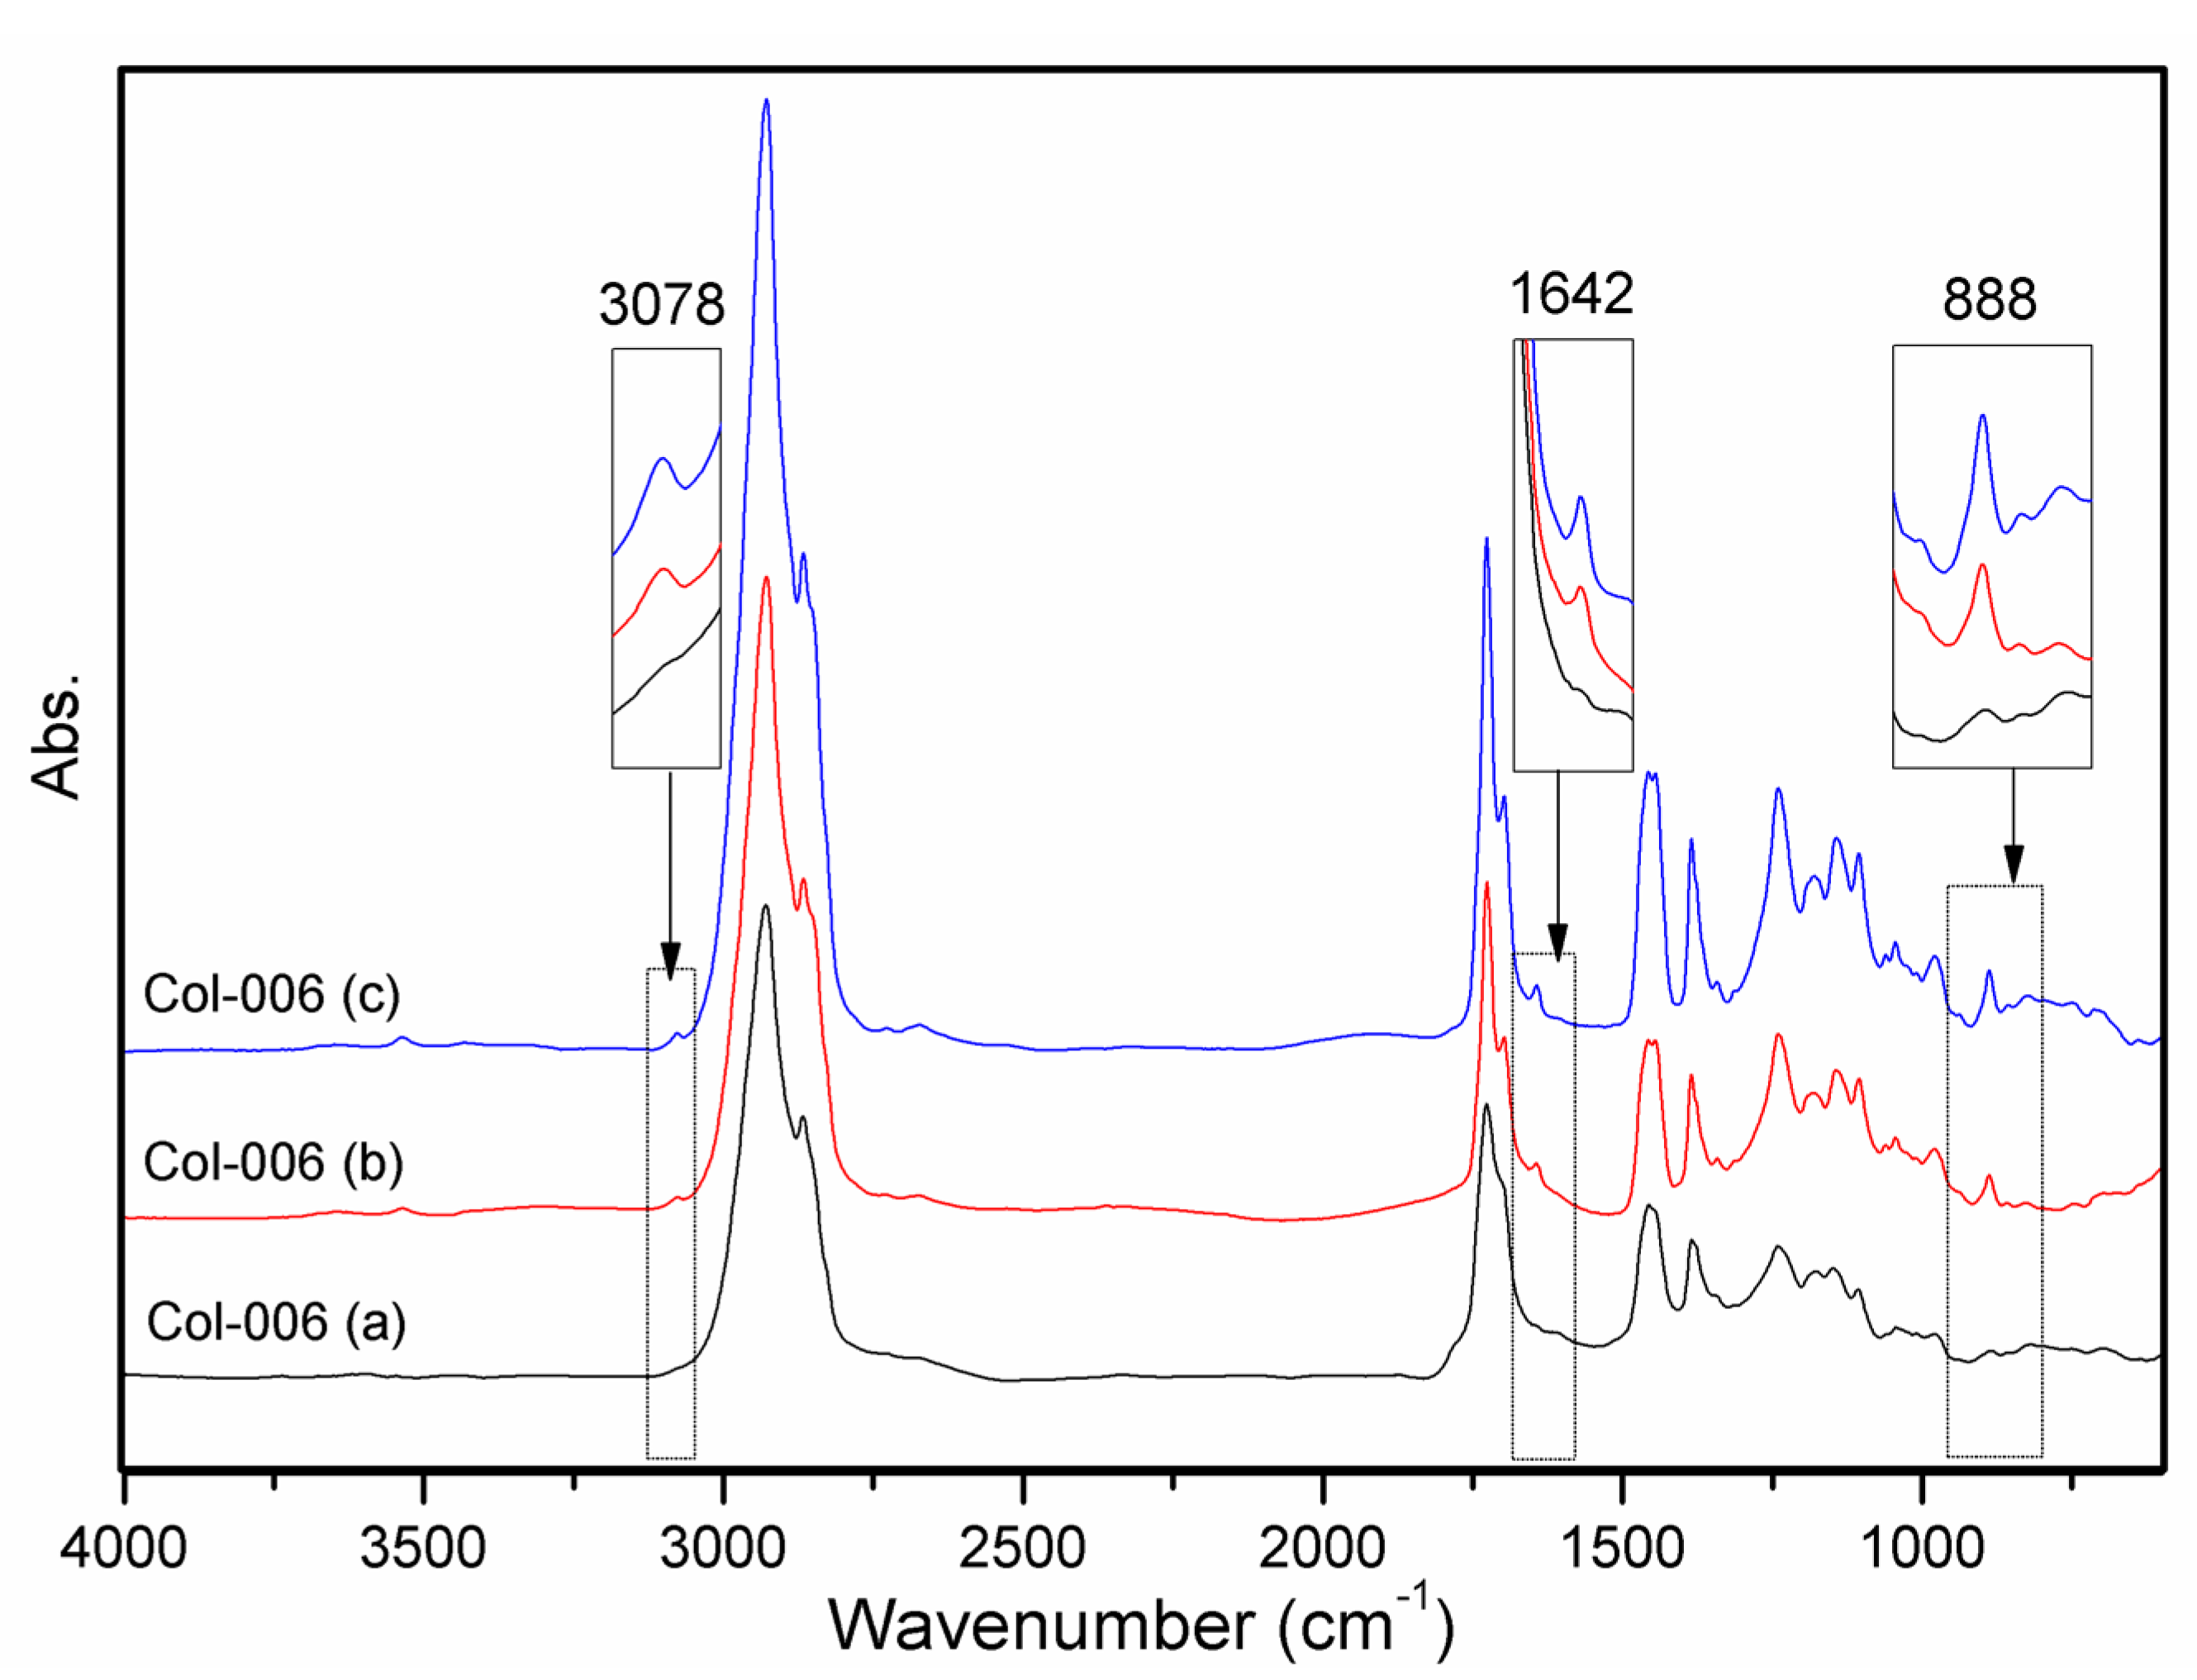
3.1.1. FTIR Spectroscopy
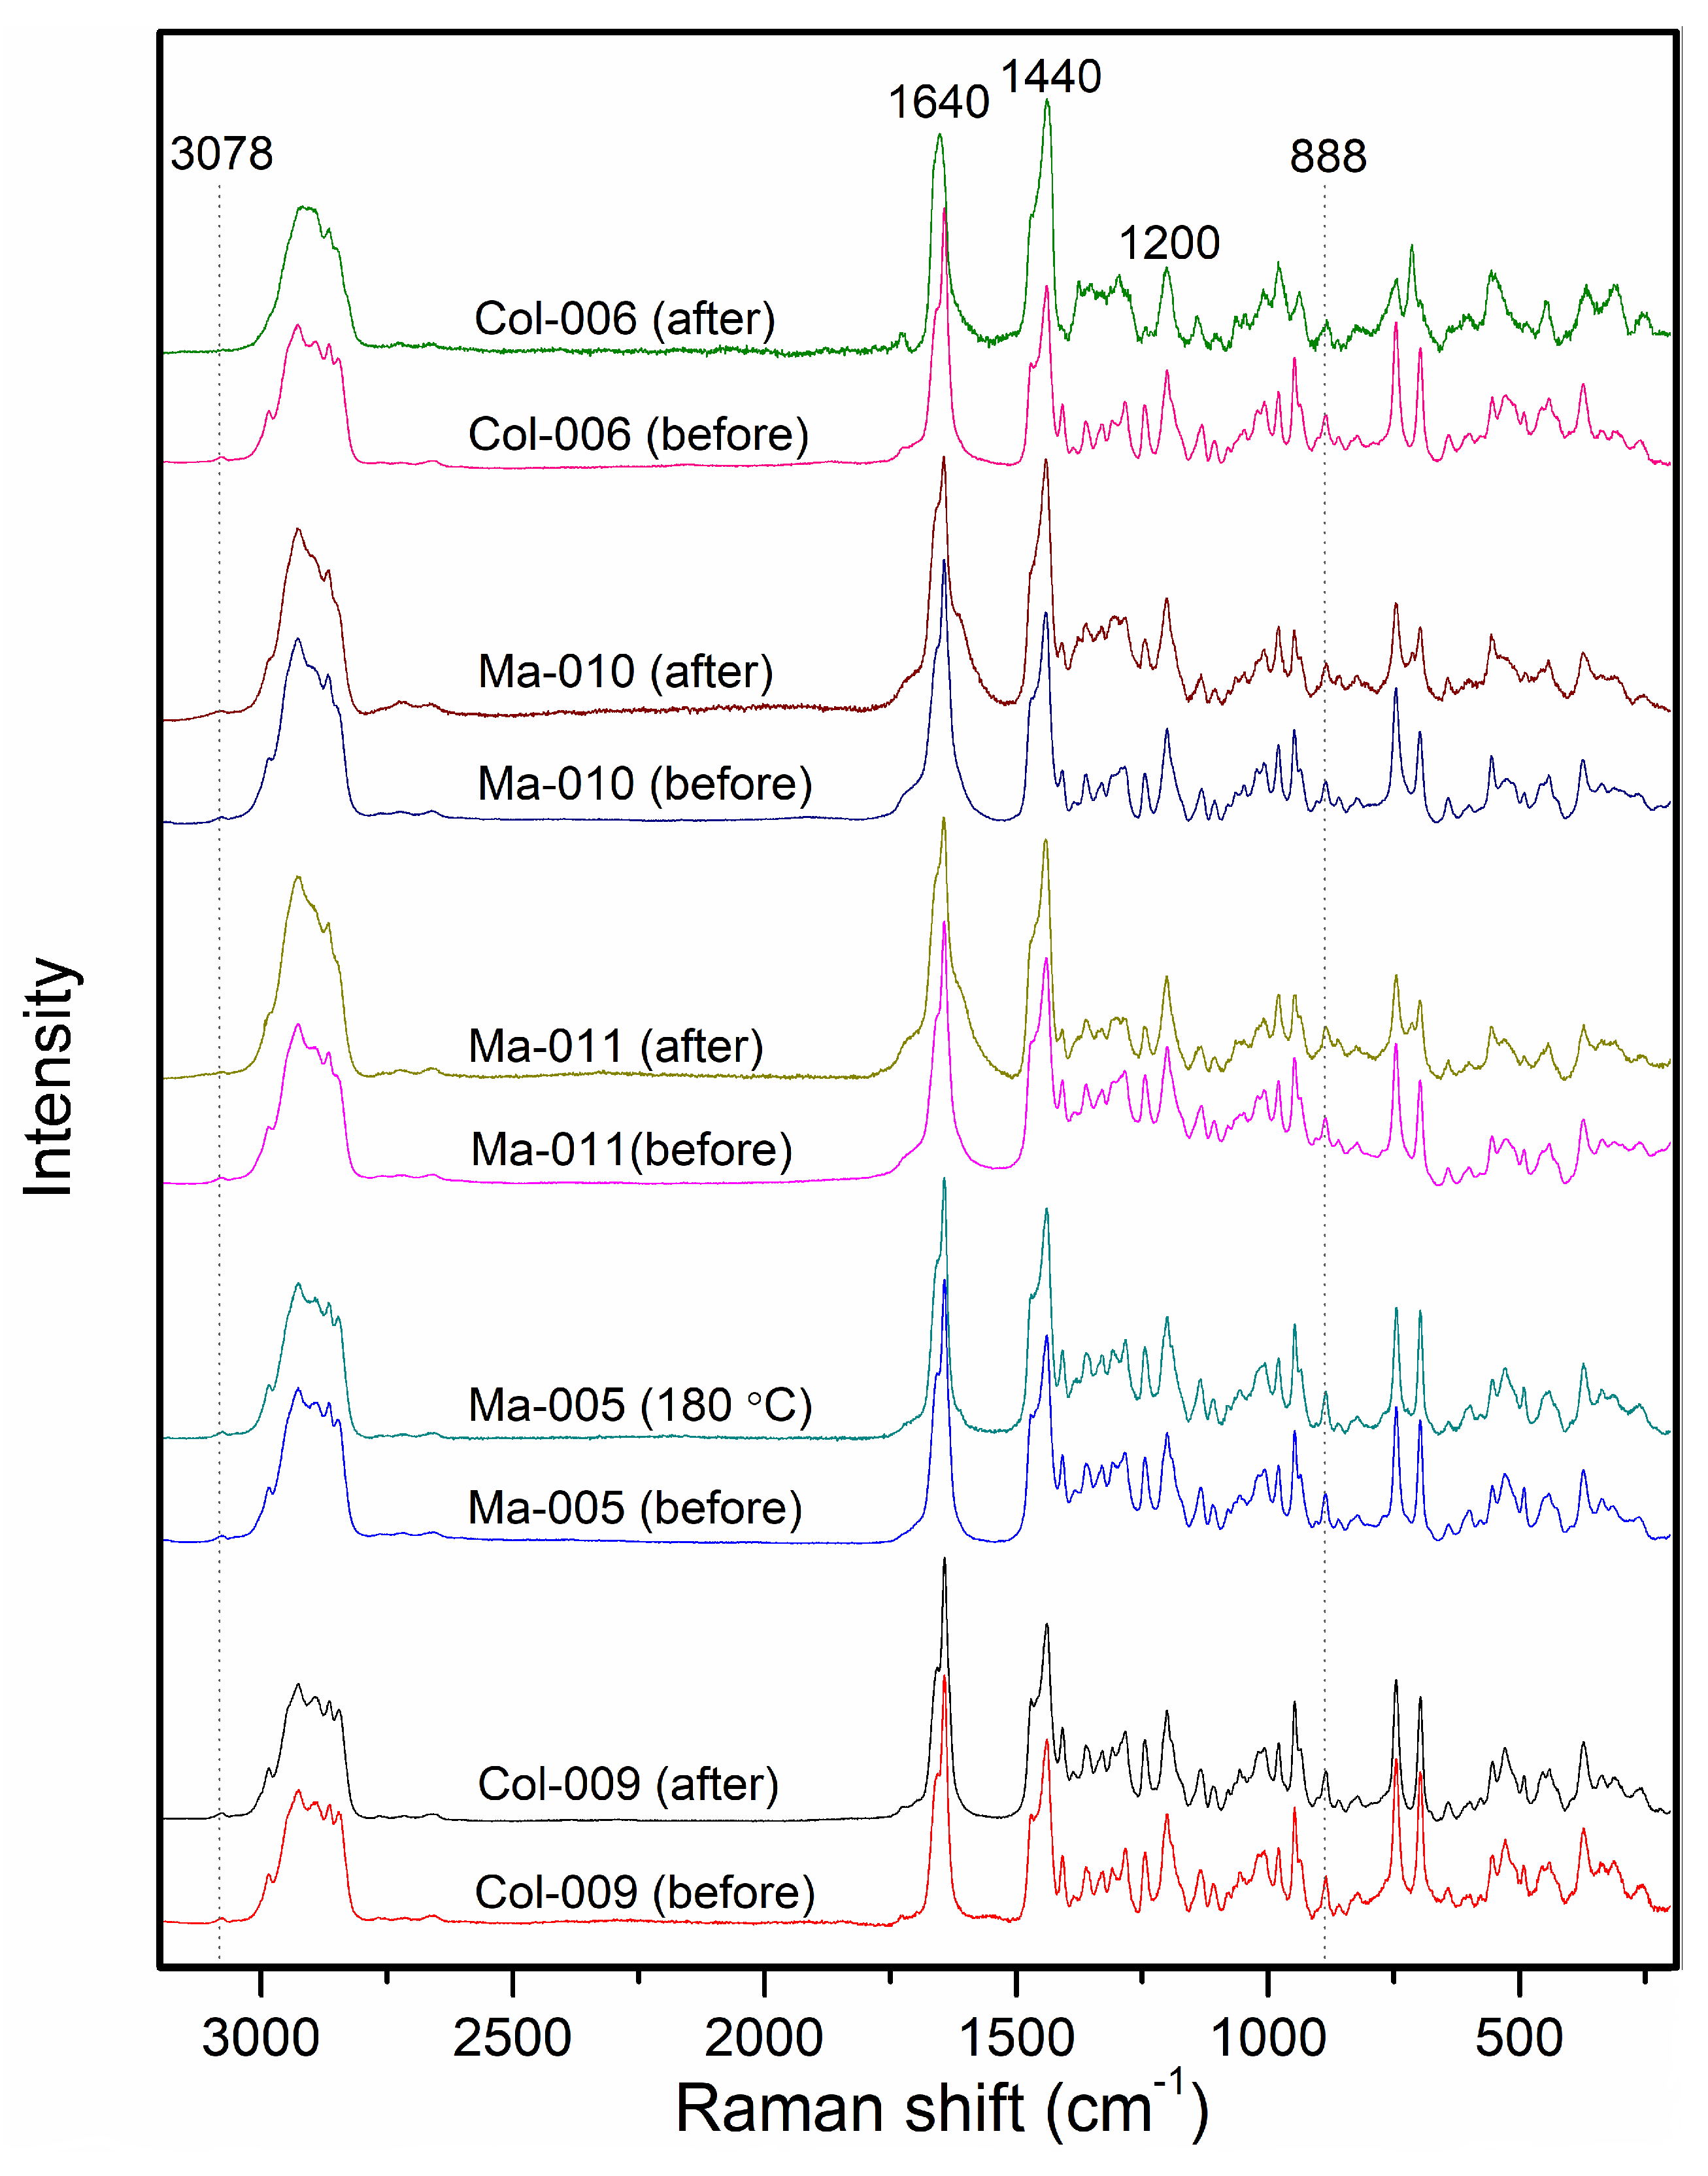
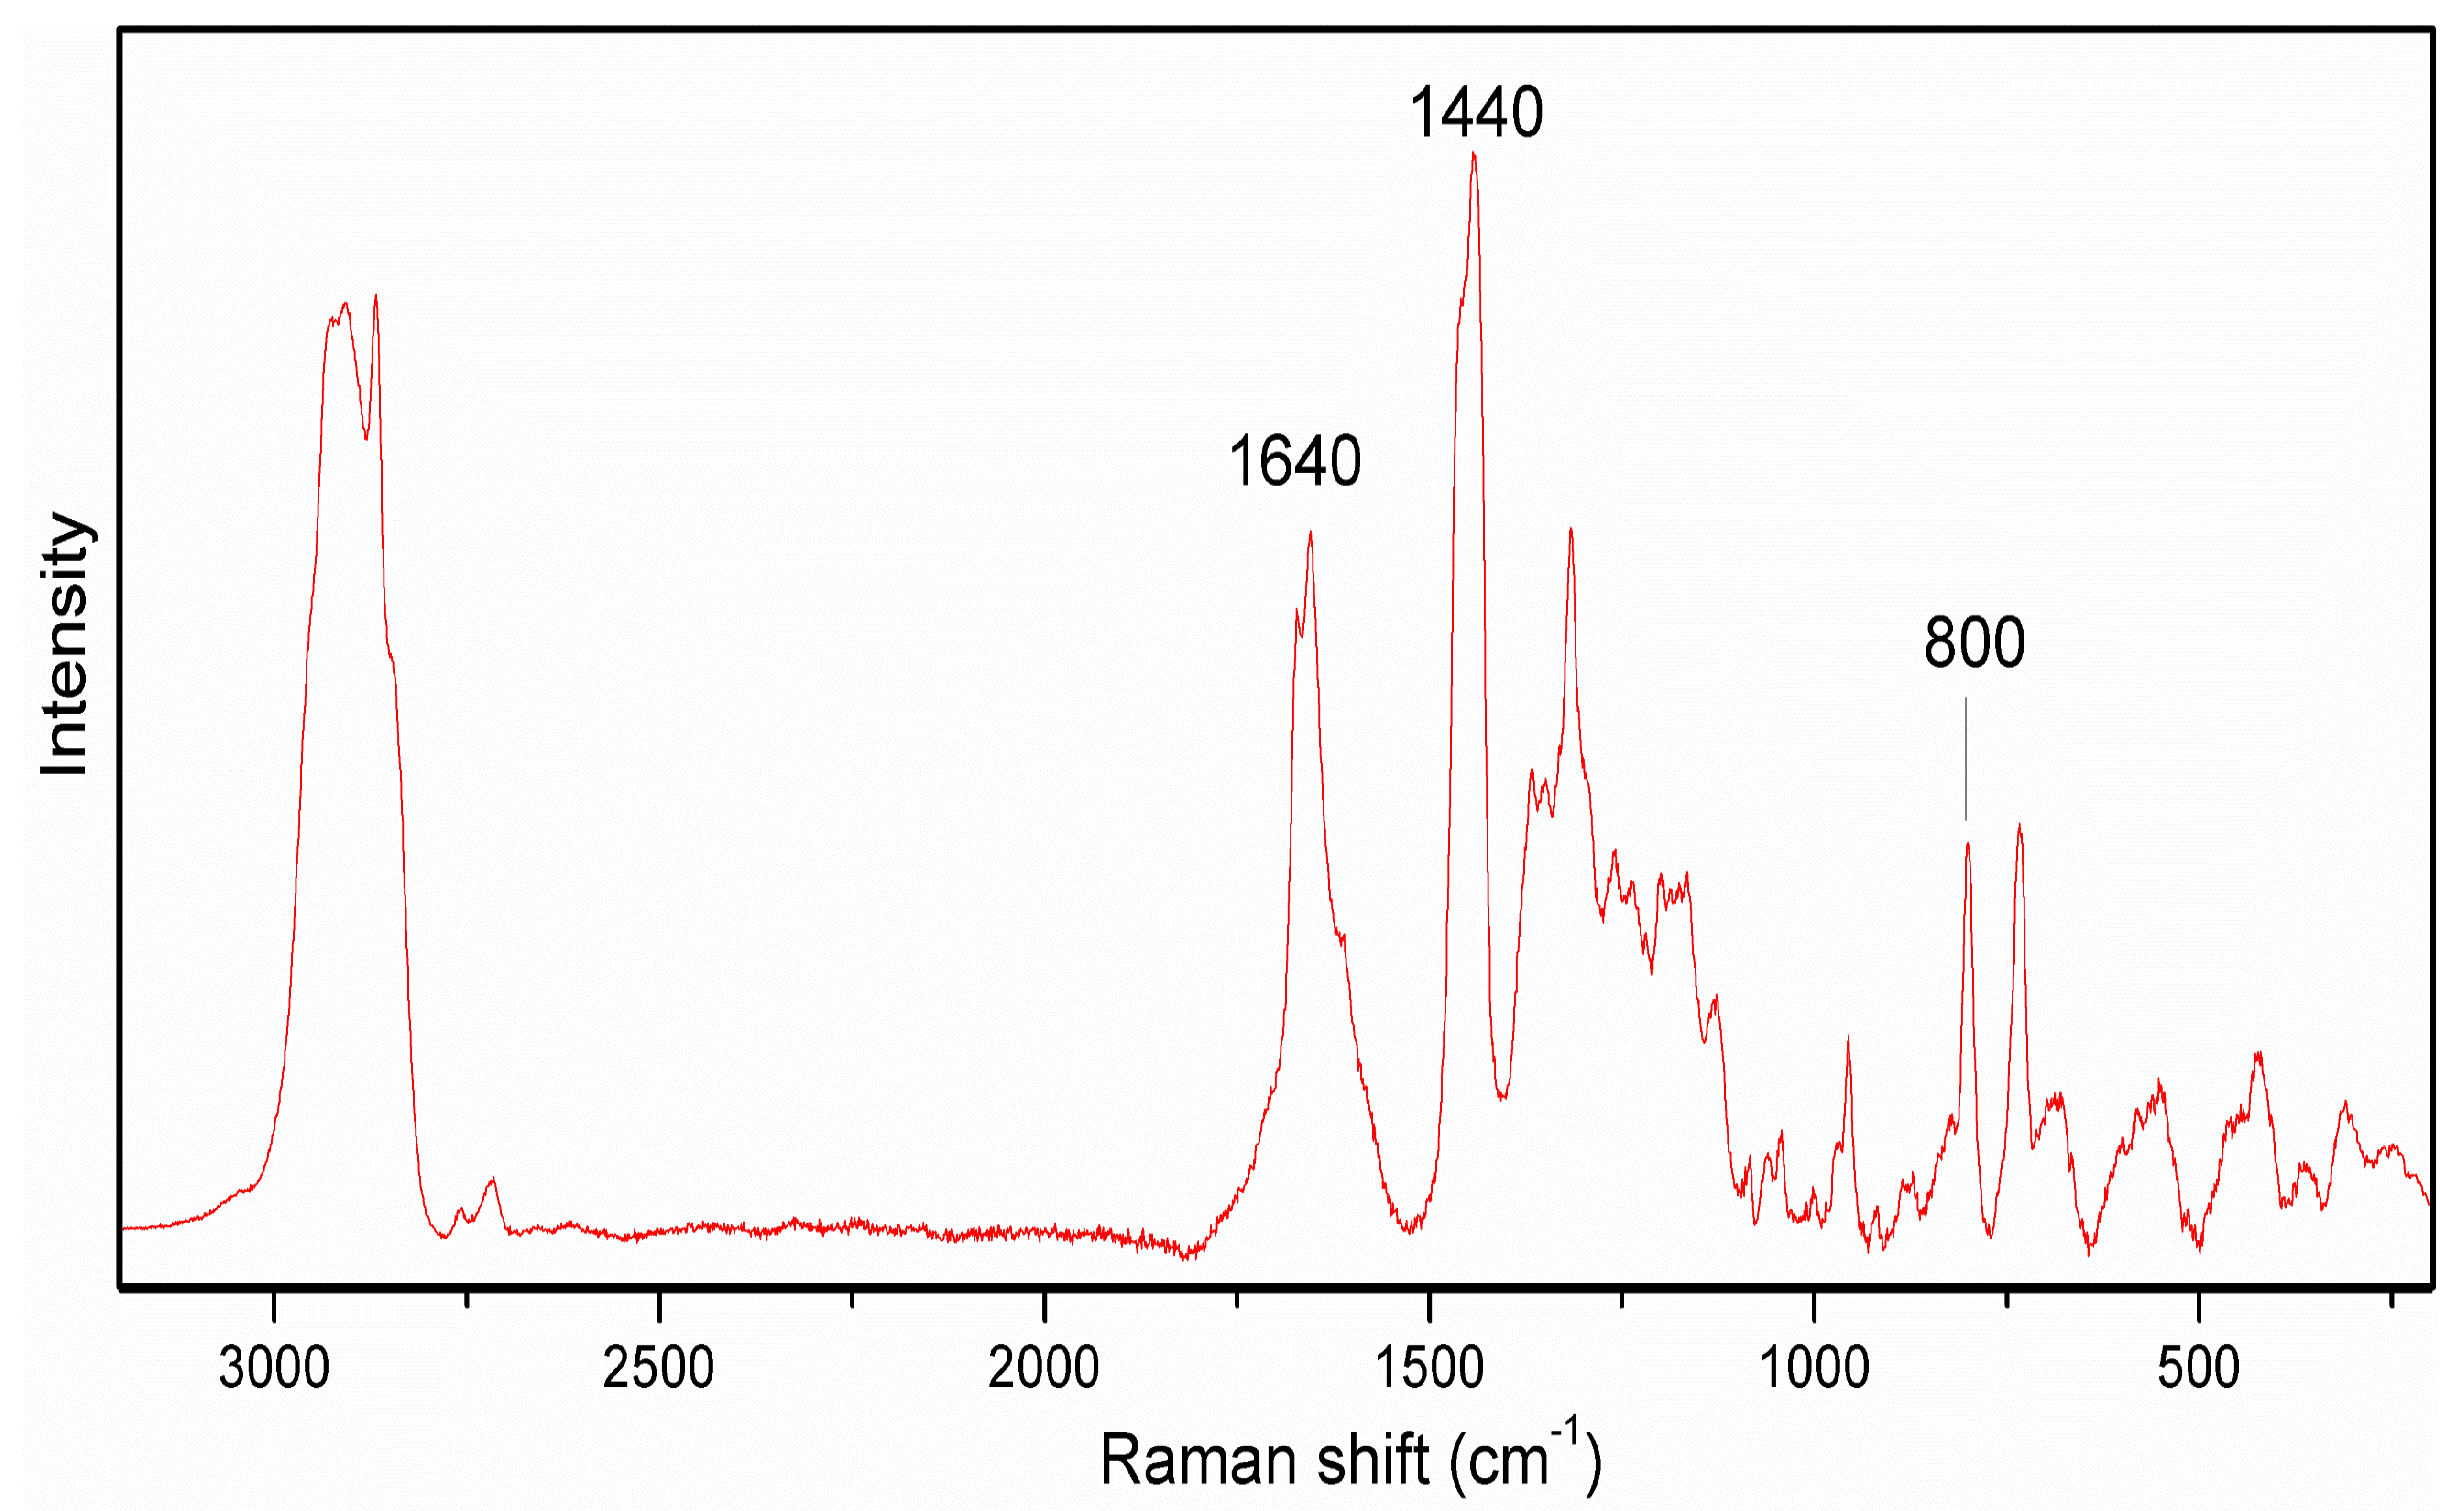
3.1.2. Raman Spectroscopy
3.1.3. NMR Spectroscopy
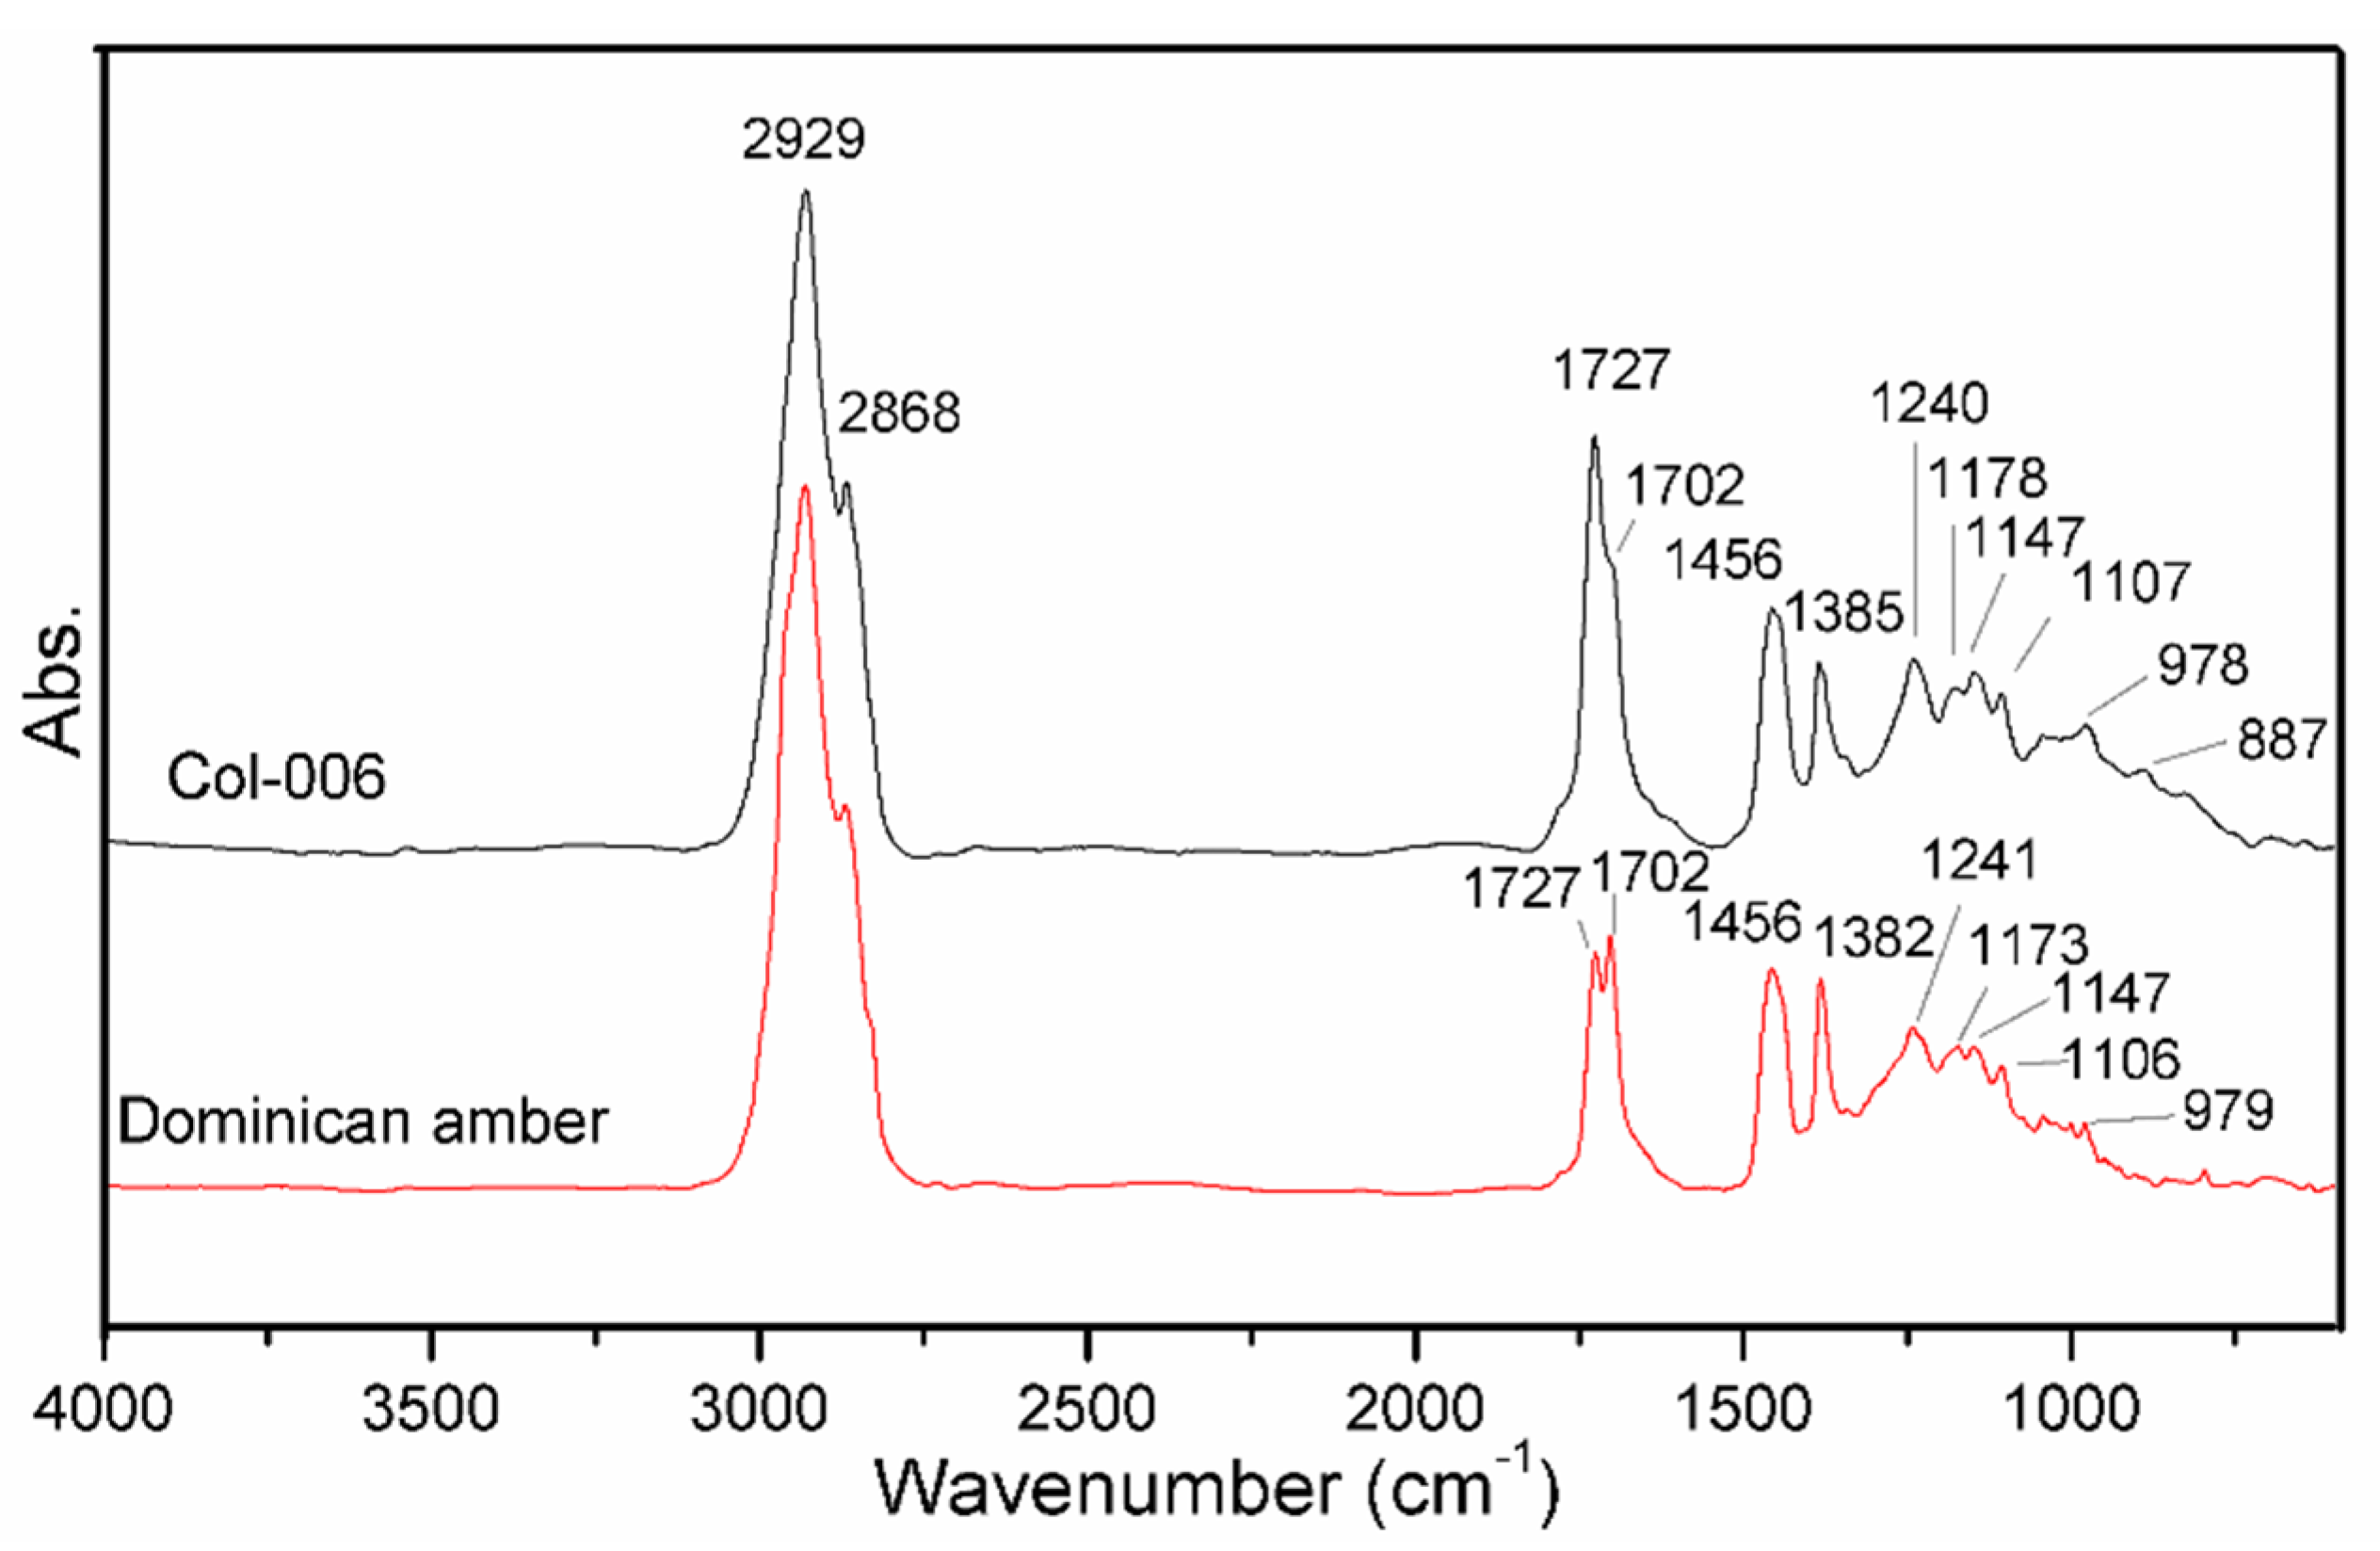
3.1.4. Comparison of Copal and Amber Spectra
3.2. Borneo Copal Resin
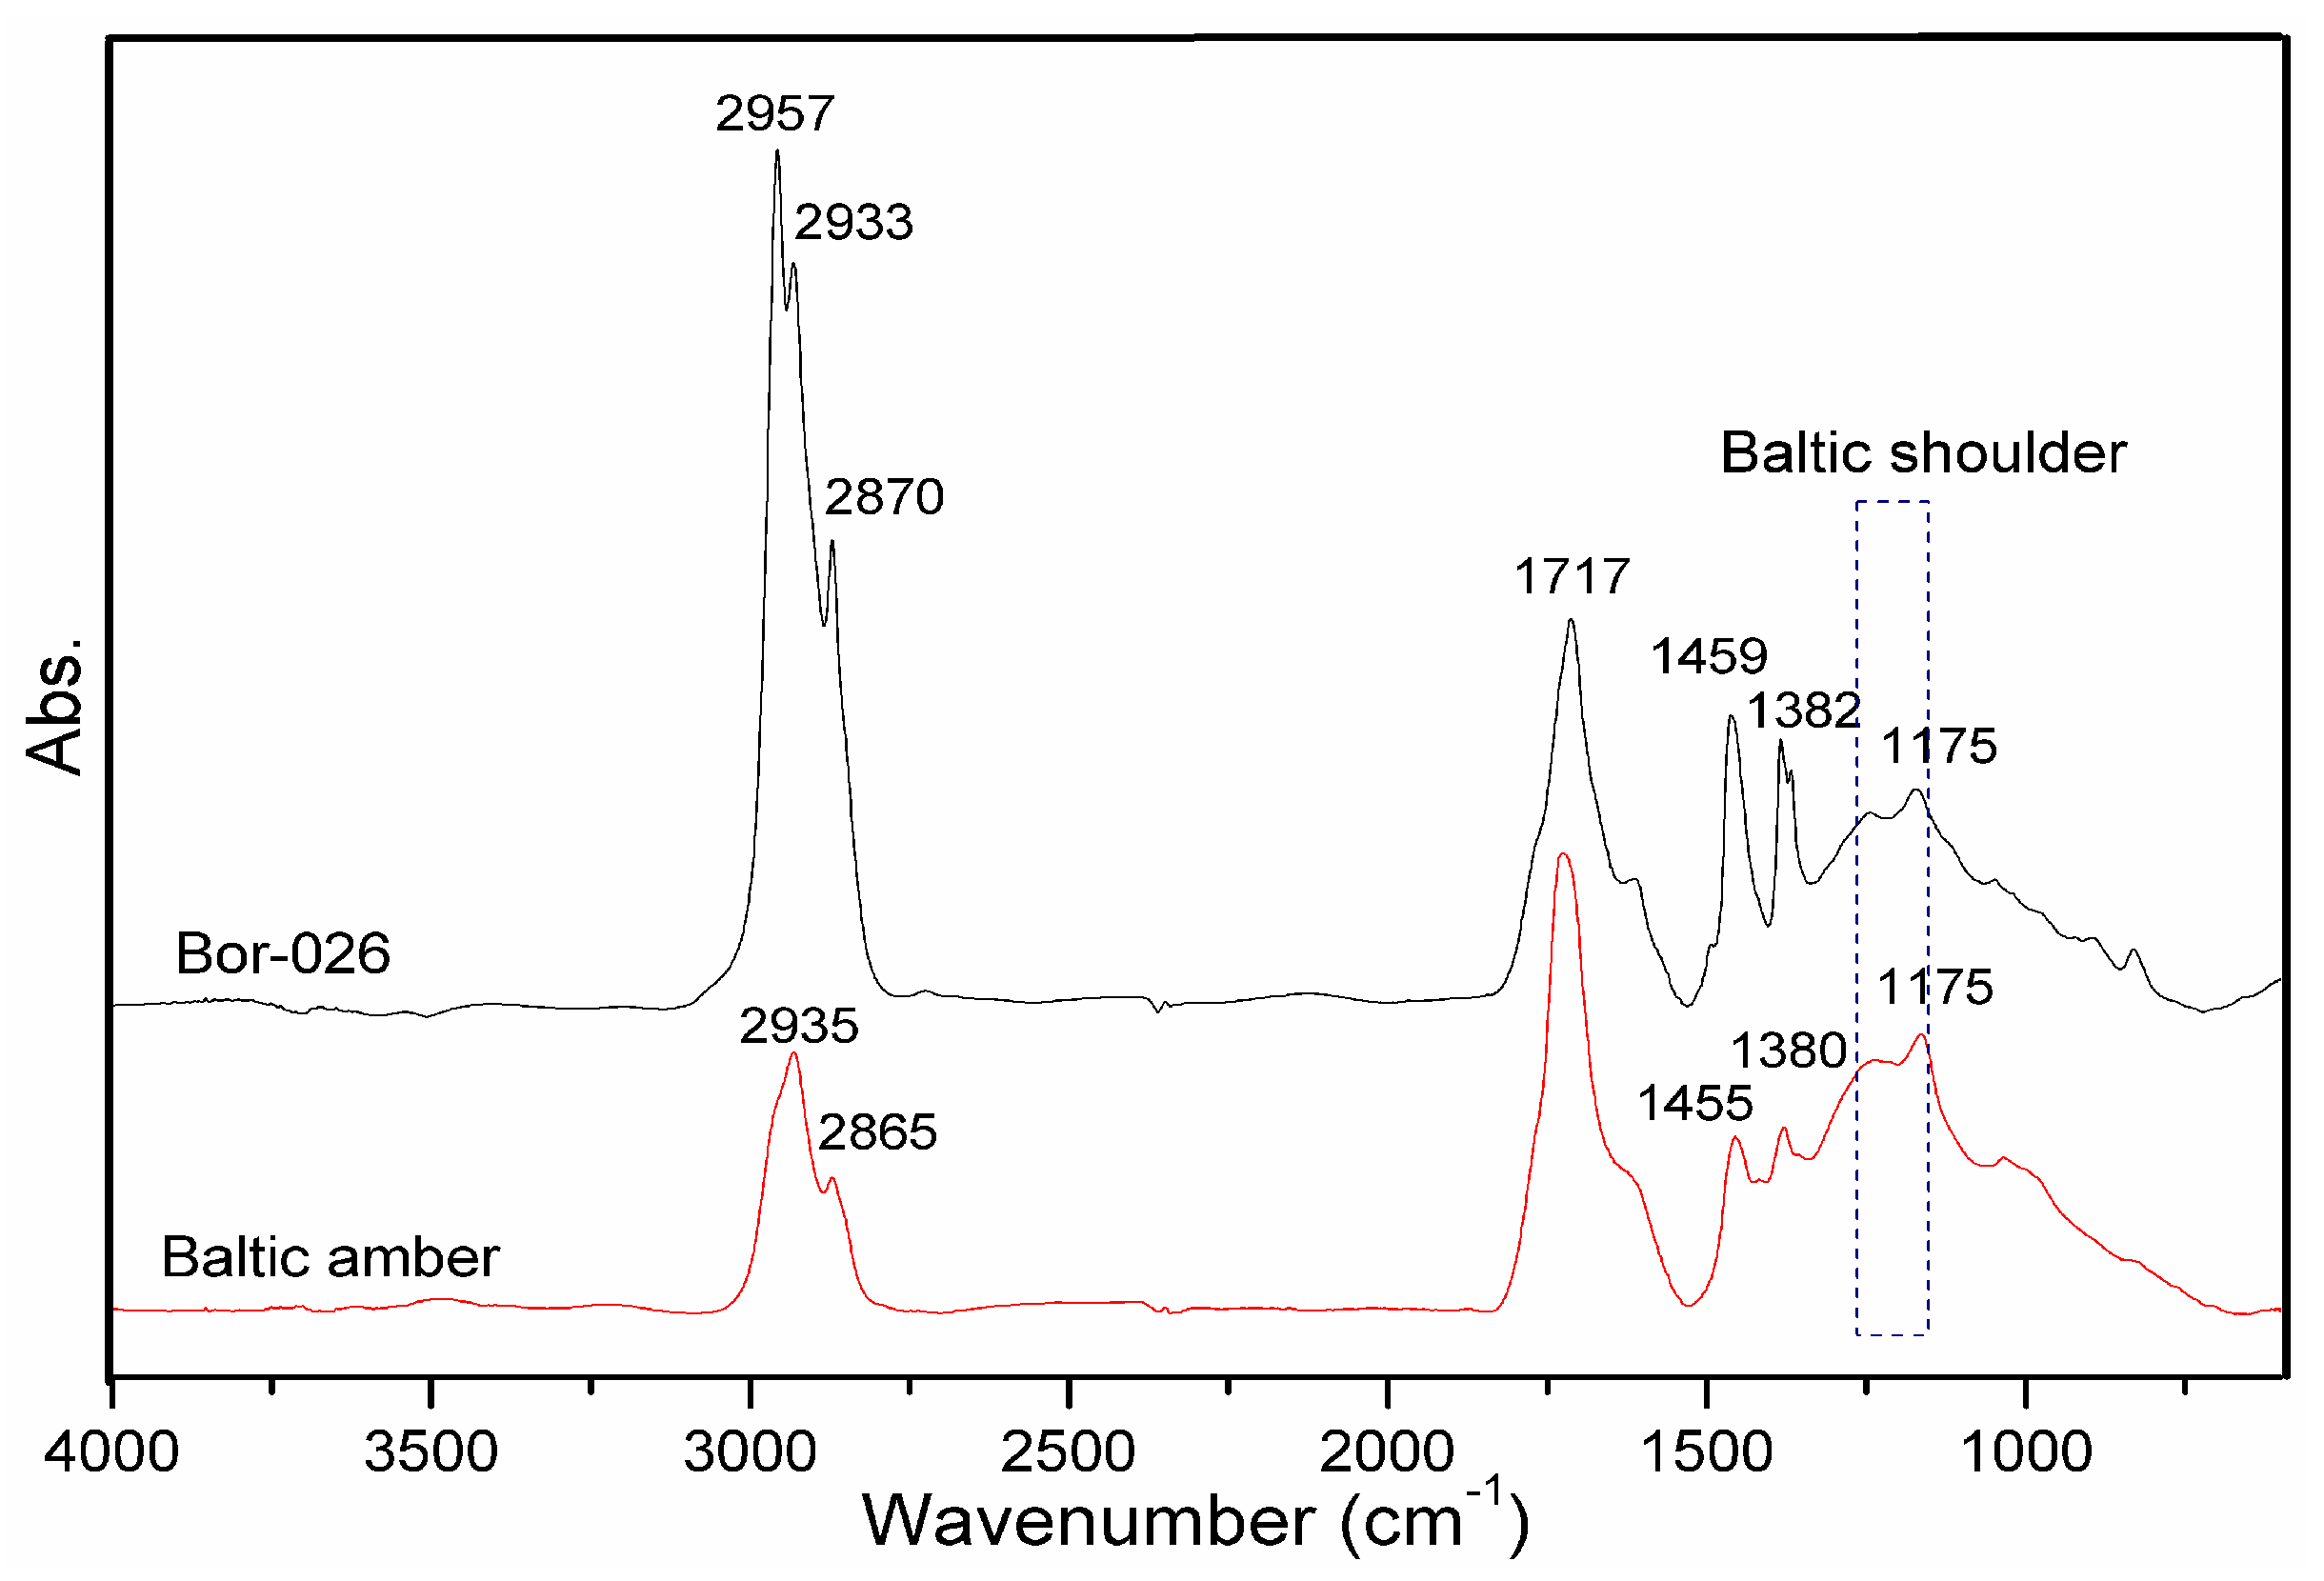
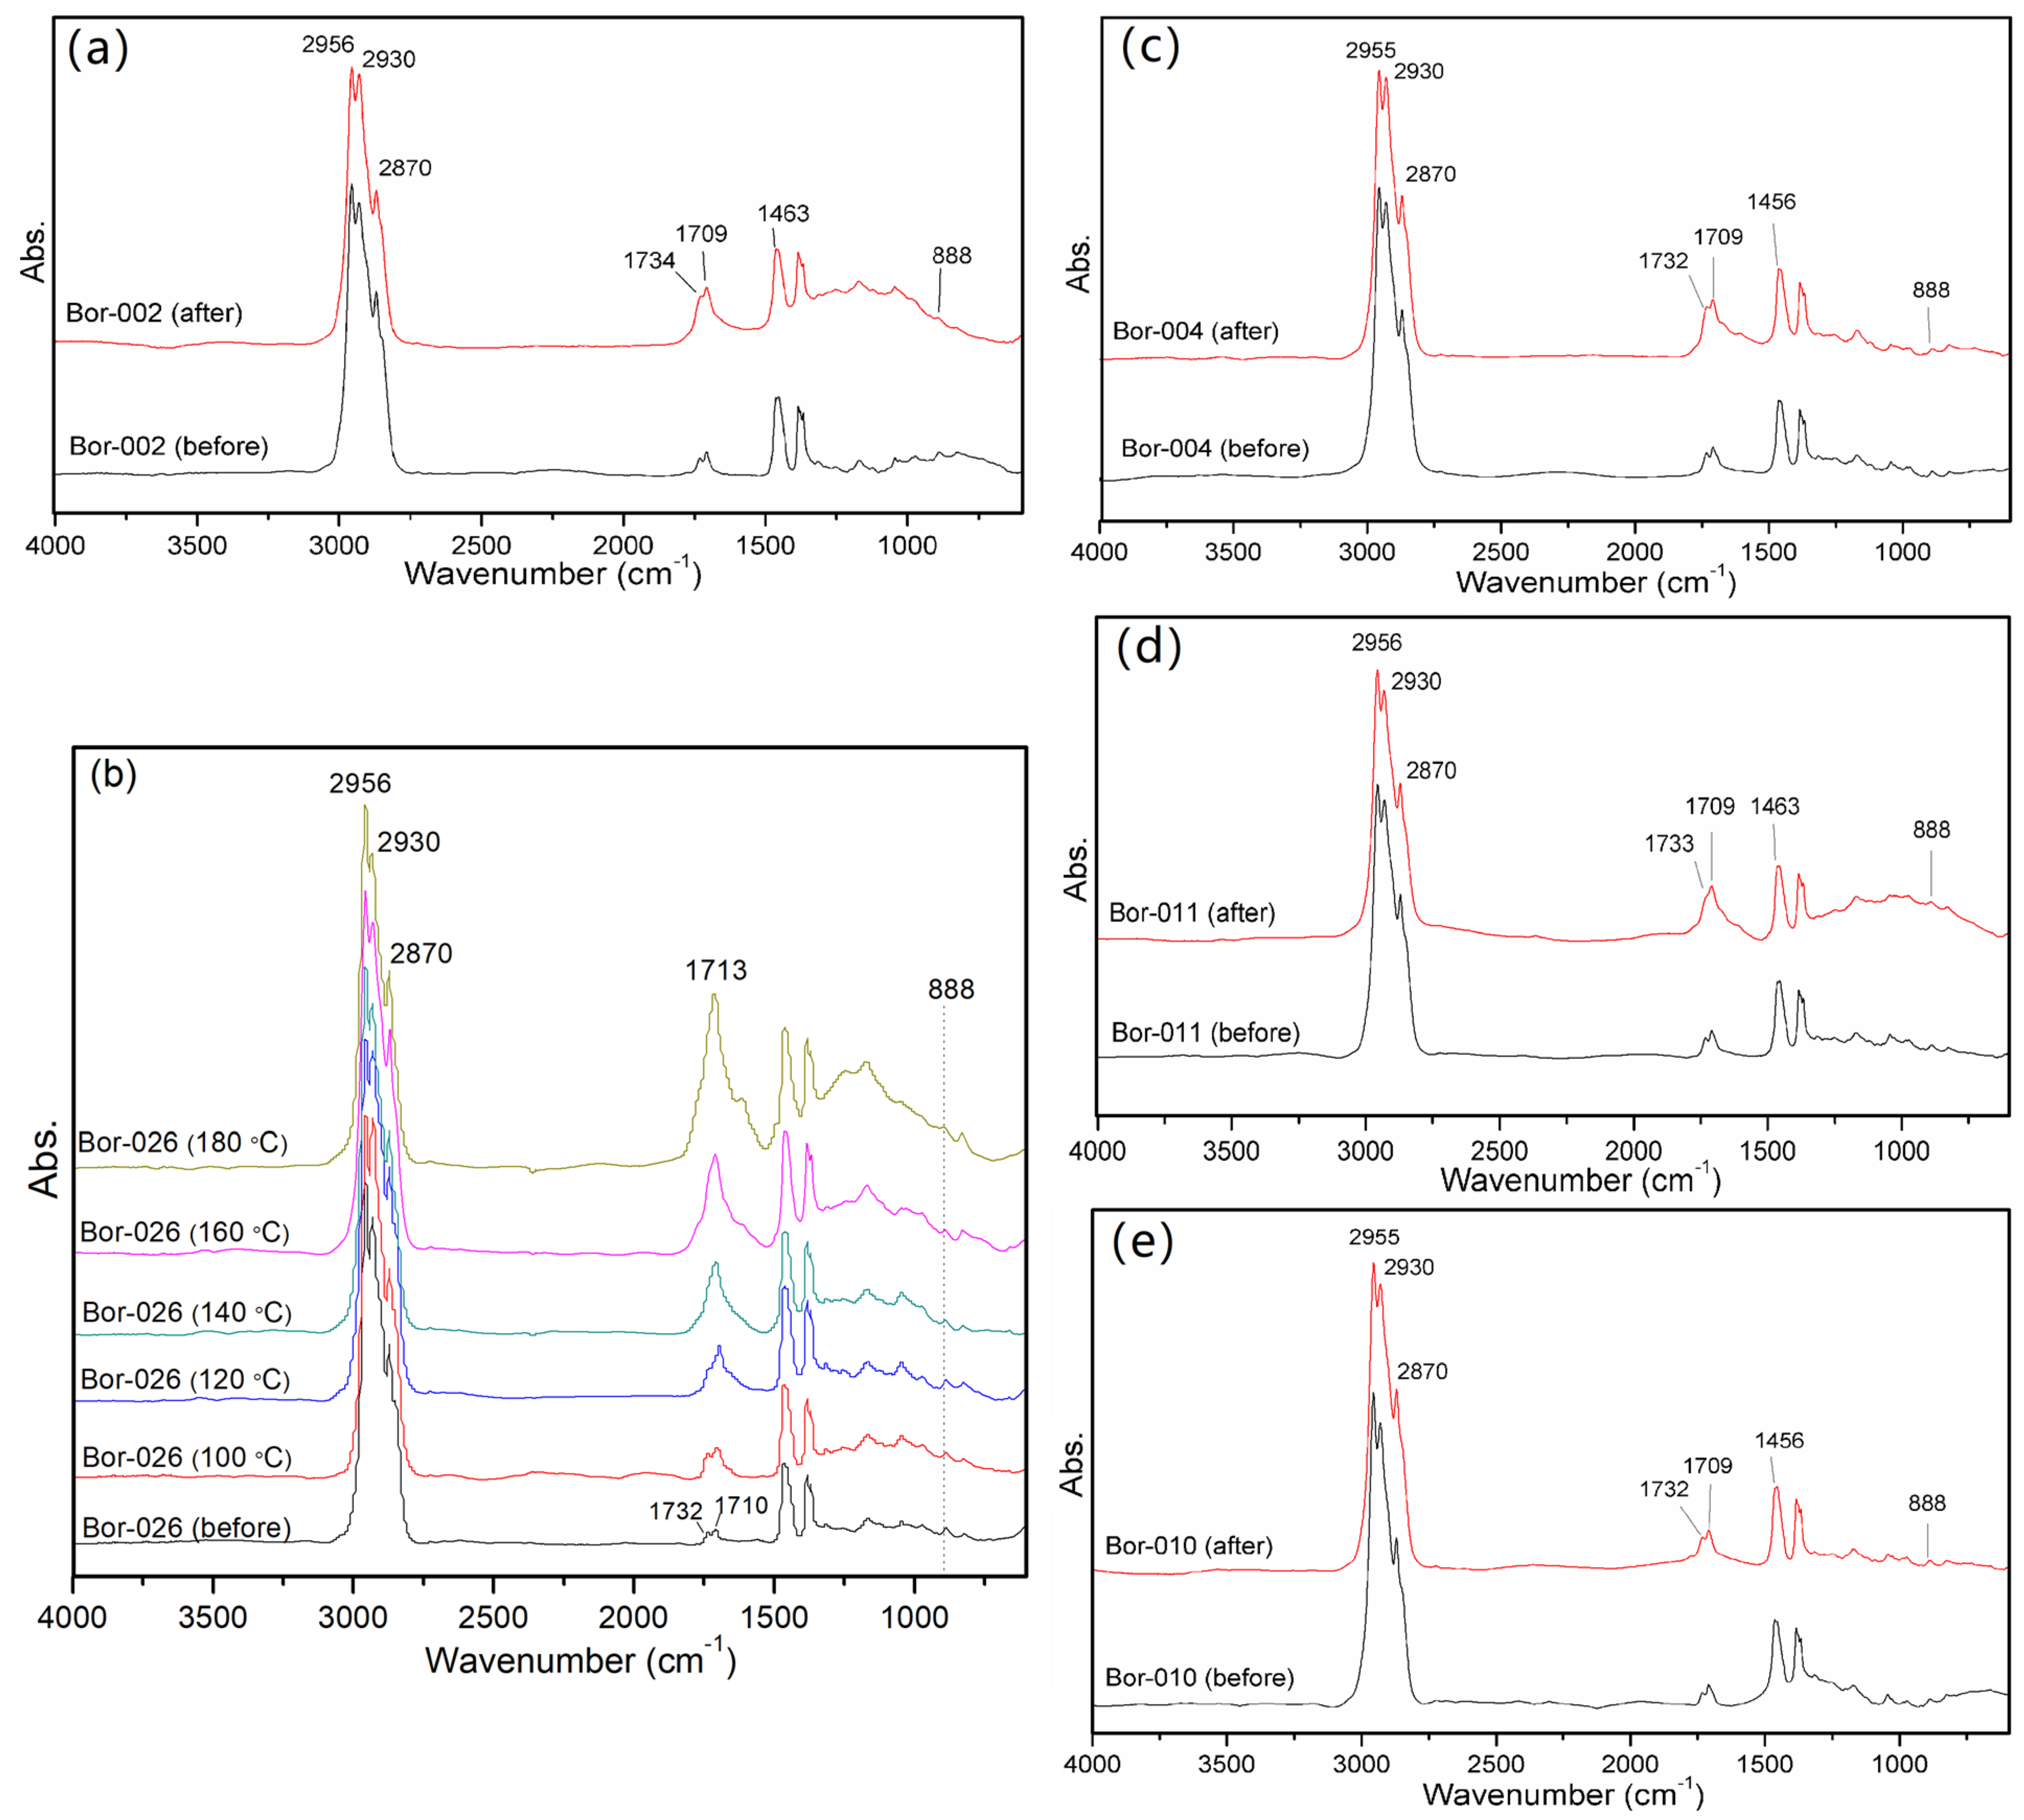
3.2.1. FTIR Spectroscopy
3.2.2. Raman Spectroscopy
3.2.3. NMR Spectroscopy
3.2.4. Comparison of Copal and Amber Spectra
4. Conclusions
Author Contributions
Funding
Institutional Review Board Statement
Informed Consent Statement
Acknowledgments
Conflicts of Interest
References
- Abduriyim, A.; Kimura, H.; Yokoyama, Y.; Nakazono, H.; Wakatsuki, M.; Shimizu, T.; Tansho, M.; Ohki, S. Characterization of “Green Amber” with Infrared and Nuclear Magnetic Resonance Spectroscopy. Gems Gemol. 2009, 45, 158–177. [Google Scholar] [CrossRef] [Green Version]
- Qi, L.; Yuan, X.; Chen, M.; Lin, S. ESR Behavior and ¹³C NMR Representation of Treated Amber and Resin. J. Gems Gemmol. 2003, 2. Available online: https://en.cnki.com.cn/Article_en/CJFDTotal-BSHB200302000.htm (accessed on 6 September 2021).
- Qi, L.; Zhou, Z.; Liao, G.; Xiong, Z. Polymerization Behavior and ¹³C NMR Representation of Green Copal Resins under Heat-Pressurized Process. J. Gems Gemmol. 2010, 12, 9–13. [Google Scholar]
- Stach, P.; Martinkutė, G.; Šinkūnas, P.; Natkaniec-Nowak, L.; Drzewicz, P.; Naglik, B.; Bogdasarov, M. An Attempt to Correlate the Physical Properties of Fossil and Subfossil Resins with Their Age and Geographic Location. J. Polym. Eng. 2019, 39, 716–728. [Google Scholar] [CrossRef]
- Montoro, Ó.; Lobato, Á.; Garcia Baonza, V.; Taravillo, M. Infrared Spectroscopic Study of the Formation of Fossil Resin Analogs with Temperature Using Trans -Communic Acid as Precursor. Microchem. J. 2018, 141, 294–300. [Google Scholar] [CrossRef]
- Kimura, H.; Tsukada, Y.; Mita, H.; Yamamoto, Y.; Chujo, R.; Yukawa, T. A Spectroscopic Index for Estimating the Age of Amber. Bull. Chem. Soc. Jpn. 2006, 79, 451–453. [Google Scholar] [CrossRef]
- Solórzano Kraemer, M.M.; Delclòs, X.; Engel, M.; Peñalver, E. A Revised Definition for Copal and Its Significance for Palaeontological and Anthropocene Biodiversity-Loss Studies. Sci. Rep. 2020, 10, 19904. [Google Scholar] [CrossRef]
- Kocsis, L.; Usman, A.; Jourdan, A.-L.; Hassan, S.; Jumat, N.; Daud, D.; Briguglio, A.; Slik, F.; Rinyu, L.; Futó, I. The Bruneian Record of “Borneo Amber”: A Regional Review of Fossil Tree Resins in the Indo-Australian Archipelago. Earth-Sci. Rev. 2019, 201, 103005. [Google Scholar] [CrossRef]
- Delclòs, X.; Peñalver, E.; Ranaivosoa, V.; Solórzano Kraemer, M.M. Unravelling the Mystery of “Madagascar Copal”: Age, Origin and Preservation of a Recent Resin. PLoS ONE 2020, 15, e0232623. [Google Scholar] [CrossRef]
- Wang, Y.; Yang, Y.; Yang, M. Experimental Study on Enhancement Technique of Amber. J. Gems Gemmol. 2010, 46, 218–240. [Google Scholar]
- Wang, Y.; Yang, M.; Yang, Y.; Niu, P. Critical Evidences for Identification of Heated Ambers. J. Gems Gemmol. 2010, 4. Available online: https://en.cnki.com.cn/Article_en/CJFDTotal-BSHB201004009.htm (accessed on 6 September 2021).
- Lambert, J.; Nguyen, T.; Levy, A.; Wu, Y.; Santiago-Blay, J. Structural Changes from Heating Amber and Copal as Observed by Nuclear Magnetic Resonance Spectroscopy. Magn. Reson. Chem. 2020, 58. [Google Scholar] [CrossRef]
- Anderson, K.; Winans, R.; Botto, R.E. The Nature and Fate of Natural Resins in the Geosphere—II. Identification, Classification and Nomenclature of Resinites. Org. Geochem. 1992, 18, 829–841. [Google Scholar] [CrossRef] [Green Version]
- Mccoy, V.; Boom, A.; Solórzano Kraemer, M.M.; Gabbott, S. The Chemistry of American and African Amber, Copal, and Resin from the Genus Hymenaea. Org. Geochem. 2017, 113, 43–54. [Google Scholar] [CrossRef] [Green Version]
- Lambert, J.; Santiago-Blay, J.; Wu, Y.; Levy, A. Examination of Amber and Related Materials by NMR Spectroscopy. Magn. Reson. Chem. 2015, 53, 2–8. [Google Scholar] [CrossRef]
- Langenheim, J.H. Plant Resins: Chemistry, Evolution, Ecology, and Ethnobotany; Timber Press: Portland, OR, USA, 2003; ISBN 0-88192-574-8. [Google Scholar]
- Dai, L.; Shi, G.; Yuan, Y.; Wang, M.; Wang, Y. Infrared Spectroscopic Characteristics of Borneo and Madagascar Copal Resins and Rapid Identification between Them and Ambers with Similar Appearances. Spectrosc. Spectr. Anal. 2018, 38, 2123–2131. [Google Scholar]
- Brody, R.; Edwards, H.; Pollard, A. A Study of Amber and Copal Samples Using FT-Raman Spectroscopy. Spectrochim. Acta A Mol. Biomol. Spectrosc. 2001, 57, 1325–1338. [Google Scholar] [CrossRef]
- Guiliano, M.; Asia, L.; Onoratini, G.; Mille, G. Applications of Diamond Crystal ATR FTIR Spectroscopy to the Characterization of Ambers. Spectrochim. Acta A Mol. Biomol. Spectrosc. 2007, 67, 1407–1411. [Google Scholar] [CrossRef]
- Edwards, H.; Farwell, D.; Jorge-Villar, S. Raman Microspectroscopic Studies of Amber Resins with Insect Inclusions. Spectrochim. Acta A Mol. Biomol. Spectrosc. 2008, 68, 1089–1095. [Google Scholar] [CrossRef] [PubMed]
- Winkler, W.; Kirchner, E.; Asenbaum, A.; Musso, M. A Raman Spectroscopic Approach to the Maturation Process of Fossil Resins. J. Raman Spectrosc. 2001, 32, 59–63. [Google Scholar] [CrossRef]
- Vandenabeele, P.; Grimaldi, D.; Edwards, H.; Moens, L. Raman Spectroscopy of Different Types of Mexican Copal Resins. Spectrochim. Acta A Mol. Biomol. Spectrosc. 2003, 59, 2221–2229. [Google Scholar] [CrossRef]
- Naglik, B.; Mroczkowska-Szerszeń, M.; Dumanska-Slowik, M.; Natkaniec-Nowak, L.; Drzewicz, P.; Stach, P.; Żukowska, G. Fossil Resins-Constraints from Portable and Laboratory Near-Infrared Raman Spectrometers. Minerals 2020, 10, 104. [Google Scholar] [CrossRef] [Green Version]
- Montoro, O.; Taravillo, M.; Moya, M.; Roja, J.; Barrero, A.; Arteaga, P.; Garcia Baonza, V. Raman Spectroscopic Study of the Formation of Fossil Resin Analogues. J. Raman Spectrosc. 2014, 45, 1230–1235. [Google Scholar] [CrossRef]
- Xing, Y.; Qi, L.; Mai, Y.; Xie, M. FTIR and ~(13)C NMR Spectrum Characterization and Significance of Amber from Different Origins. J. Gems Gemmol. 2015, 17, 8–16. [Google Scholar]
- Lambert, J.; Frye, J. Carbon Functionalities in Amber. Science 1982, 217, 55–57. [Google Scholar] [CrossRef] [PubMed]
- Lambert, J.; Frye, J.; Poinar, G. Analysis of North American Amber by Carbon-13 NMR Spectroscopy. Geoarchaeology 1990, 5, 43–52. [Google Scholar] [CrossRef]
- Lambert, J.; Frye, J.; Poinar, G. Amber from the Dominican Republic: Analysis by Nuclear Magnetic Resonance Spectroscopy. Archaeometry 1985, 27, 43–51. [Google Scholar] [CrossRef]
- Park, J.; Yun, E.Y.; Kang, H.; Ahn, J.; Kim, G. IR and Py/GC/MS Examination of Amber Relics Excavated from 6th Century Royal Tomb in Korean Peninsula. Spectrochim. Acta A Mol. Biomol. Spectrosc. 2016, 165, 114–119. [Google Scholar] [CrossRef] [PubMed]
- Jehlička, J.; Jorge-Villar, S.; Edwards, H. Fourier Transform Raman Spectra of Czech and Moravian Fossil Resins from Freshwater Sediments. J. Raman Spectrosc. 2004, 35, 761–767. [Google Scholar] [CrossRef]
- Lambert, J.; Levy, A.; Santiago-Blay, J.; Wu, Y. Nuclear Magnetic Resonance Characterization of Indonesian Amber. Life Excit. Biol. 2013, 1, 136–155. [Google Scholar] [CrossRef]
- Yang, Y.; Wang, Y. Summary on Organic Components and Relevant Spectral Characteristics of Amber and Copal. J. Gems Gemmol. 2010, 12, 16–22. [Google Scholar]


| Characteristics | Heat Treatments | Heat–Pressure Treatments | ||||
|---|---|---|---|---|---|---|
| Slow Low-Temperature Treatment | Rapid High-Temperature Treatment | Single-Stage Heat–Pressure Treatment (140/25) | Single-Stage Heat–Pressure Treatment (180/35) | Multi-Stage Heat–Pressure Treatment | ||
| Sample preparation | Cut into 3 pieces | Cut into 6 pieces | Cut into 3 pieces | Cut into 3 pieces | Cut into 3 pieces | |
| Temperature (°C) | 90 | 100/120/140/160/180 | 140 | 180 | – | |
| Pressure (bar) | (atmospheric) | (atmospheric) | 25 | 35 | – | |
| Heating time (days) | 90 | 1 | 7 | 7 | – | |
| Ventilation of N2 | – | – | once a day | once a day | – | |
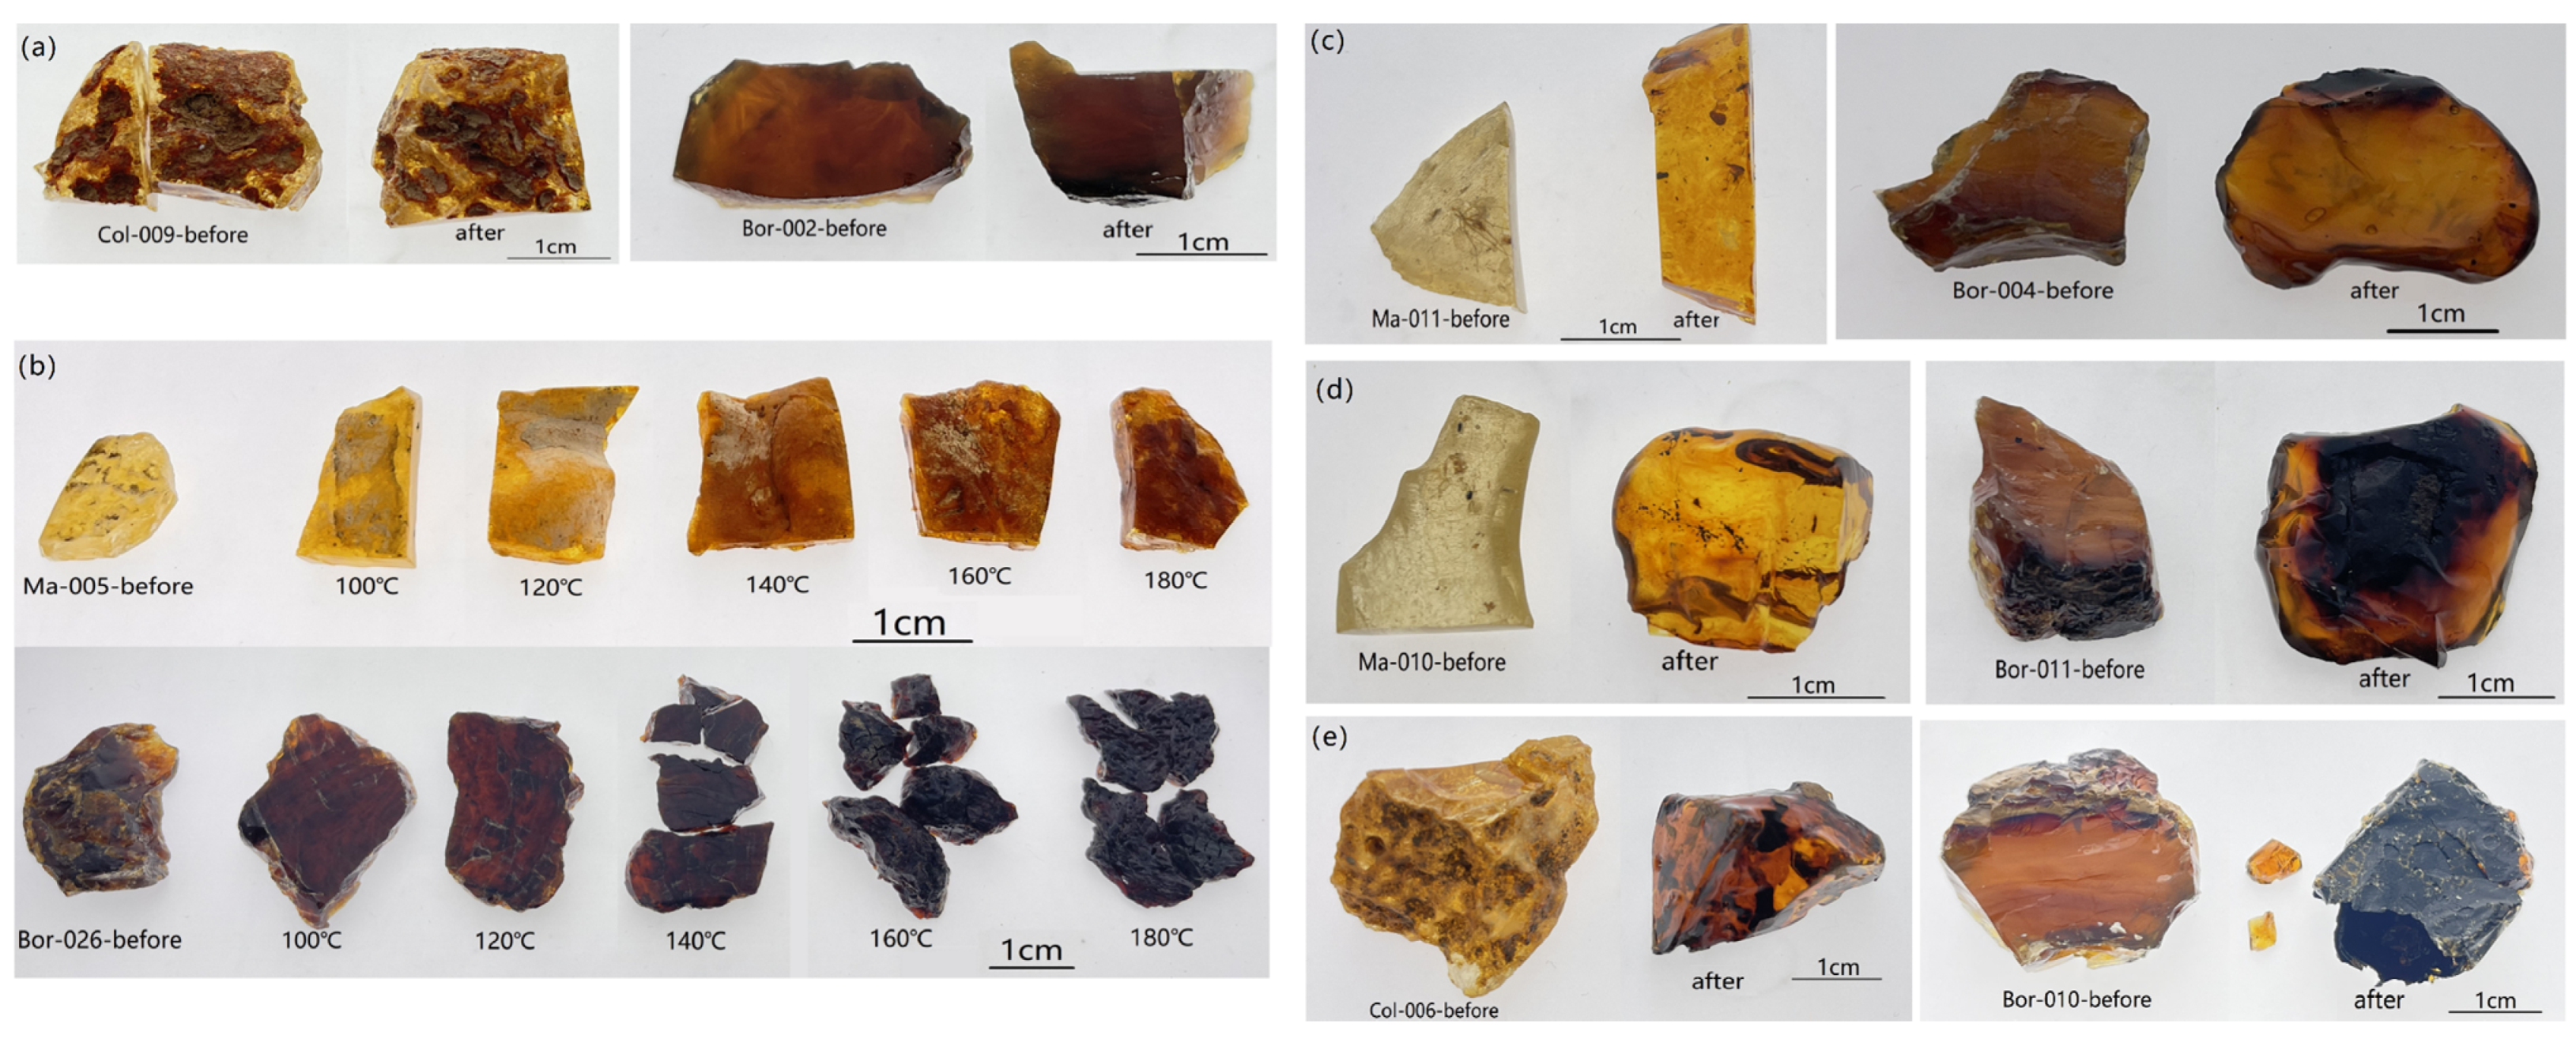
| Samples from Colombia | Col-009 * | Col-005 Col-013 * | – | – | Col-003 Col-004 Col-006 * | Col-007 Col-008 Col-010 |
| Samples from Madagascar | Ma-002 Ma-009 Ma-013 Ma-014 * | Ma-005 * Ma-025 | Ma-003 Ma-011 Ma-016 Ma-019 | Ma-007 Ma-010 Ma-012 Ma-020 | Ma-004 * Ma-006 Ma-008 | Ma-015 Ma-017 Ma-018 |
| Samples from Borneo | Bor-001 Bor-002 * Bo-007 Bor-019 | Bor-024 Bor-026 * | Bor-003 Bor-004 Bor-005 Bor-006 | Bor-011 Bor-013 Bor-015 Bor-017 | Bor-008 Bor-009 Bor-010 * Bor-012 | |
| Sample | Modification Method | Changes in IR Spectra | ||||
|---|---|---|---|---|---|---|
| Before Treatment | After Treatment | |||||
| C=O Related to Esters (cm−1) | Absorption of 3078, 1642, 888 cm−1 | C=O Related to Esters (cm−1) | Absorption of 3078, 1642 and 888 cm−1 | |||
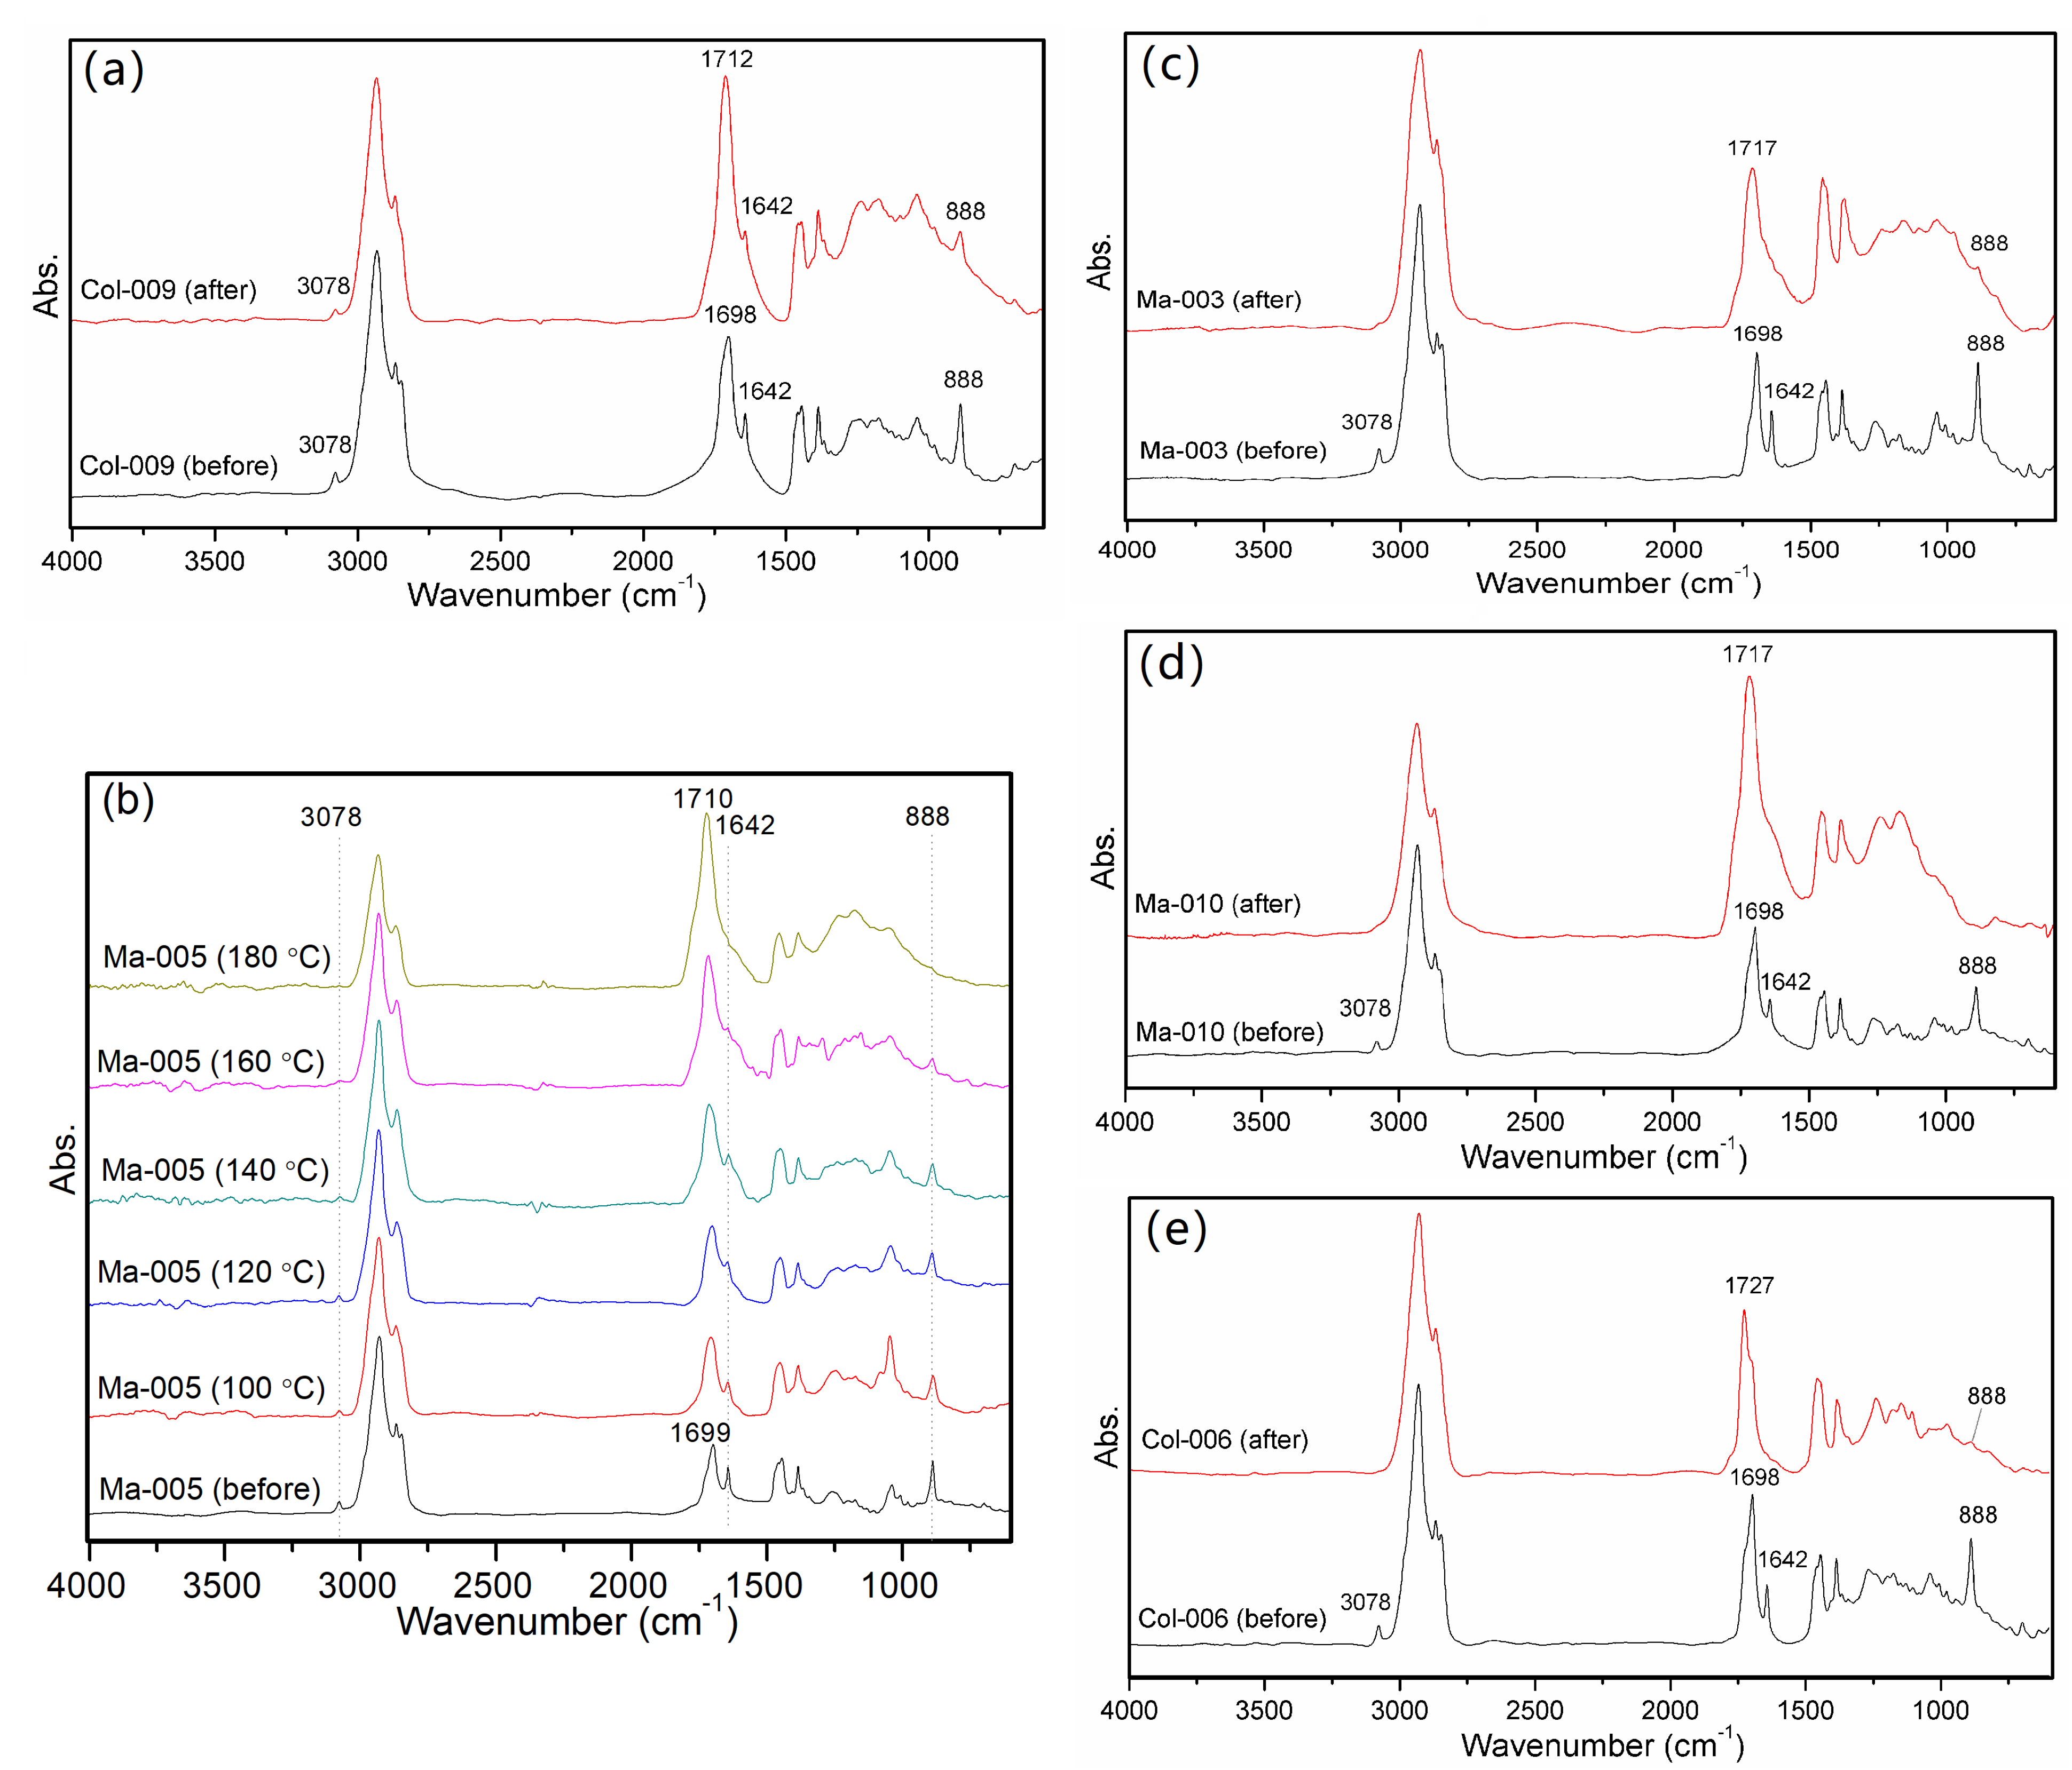
| Col-009 | Slow low-temperature treatment | 1697 | strong | 1712 | moderate | |
| Ma-005 | Rapid high-temperature treatment | 1697 | super strong | 100 °C | 1699 | strong |
| 120 °C | 1699 | strong | ||||
| 140 °C | 1702 | moderate | ||||
| 160 °C | 1708 | moderate | ||||
| 180 °C | 1710 | very weak | ||||
| Ma-003 | Single-stage heat–pressure treatment (140/25) | 1697 | strong | 1717 | Peaks at 3078 and 1642 cm−1 disappeared, weak peak at 888 cm−1 | |
| Ma-010 | Single-stage heat–pressure treatment (180/35) | 1697 | strong | 1717 | Peaks at 3078, 1642 and 888 cm−1 disappeared | |
| Col-006 | Multi-stage heat–pressure treatment | 1697 | strong | 1727 | Peaks at 3078 and 1642 cm−1 disappeared, very weak peak at 888 cm−1 | |
| Colombia | Madagascar | Borneo | Assignment [18,20,21,22,23,24] |
|---|---|---|---|
| 3078 | 3080 | ν(CH) C=CH2 | |
| 2986 | 2984 | ν(CH2) | |
| 2926 | 2926 | 2926 | ν(CH2) |
| 2893 | 2889 | 2908 | ν(CH2) |
| 2865 | 2867 | 2869 | ν(CH2) |
| 2845 | 2848 | ν(CH2) | |
| 1708 | ν(C=O) | ||
| 1672 | |||
| 1655 | ν(C=C) trans conjugated | ||
| 1642 | 1643 | ν(C=C) non-conjugated | |
| 1470 | 1470 | δ(CH2), δ(CH3) | |
| 1440 | 1440 | 1443 | δ(CH2), δ(CH3) |
| 1408 | 1408 | δ(CH2), δ(CH3) | |
| 1386 | 1383 | δ(CH2), δ(CH3) | |
| 1361 | 1361 | 1368 | δ(CH2), δ(CH3) |
| 1328 | 1330 | δ(CH2), δ(CH3) | |
| 1317 | δ(CH2), δ(CH3) | ||
| 1309 | 1309 | δ(CH2), δ(CH3) | |
| 1283 | 1284 | ||
| 1260 | |||
| 1243 | 1244 | 1237 | |
| 1200 | 1200 | δ(CCH), δ(C–O) | |
| 1133 | 1133 | ν(CC) ring breathing, δ(C–O) | |
| 1127 | |||
| 1108 | 1109 | ν(C–C) | |
| 1079 | 1079 | 1084 | |
| 1056 | 1056 | 1061 | |
| 1043 | |||
| 1007 | 1006 | ||
| 1002 | ν(CC) aromatic | ||
| 979 | 980 | ρ(CH2), ρ(CH3) | |
| 956 | |||
| 946 | 946 | ||
| 935 | 936 | ρ(CH2), ρ(CH3), ν(CC) | |
| 885 | 886 | 885 | ρ(CH2) of C=C double bonds |
| 859 | 860 | ||
| 821 | 821 | 823 | |
| 801 | aromatic hydrocarbon deformation | ||
| 745 | 745 | ν(CC) isolated | |
| 734 | ν(CC) isolated | ||
| 697 | 697 | ||
| 680 | |||
| 642 | 641 | ||
| 600 | 600 | ||
| 577 | 577 | ||
| 554 | 554 | 552 | δ(CCO), δ(COC) in-plane deformation |
| 529 | 529 | ||
| 491 | 491 | ||
| 464 |
| Sample Number | H1640/H1440 (Before) | H1640/H1440 (After) | Decrease in Ratio (%) | Sample Number | H1640/H1440 (Before) | H1640/H1440 (After) | Decrease in Ratio (%) |
|---|---|---|---|---|---|---|---|
| Col-009 | 1.52 | 1.41 | 7.3 | Bor-002 | 0.67 | – * | – |
| Col-006 | 1.44 | 0.84 | 42 | Bor-026 | – * | – * | – |
| Ma-014 | 1.47 | 1.36 | 7.5 | Bor-005 | 0.58 | – * | – |
| Ma-005 | 1.46 | 1.25 | 14 | Bor-015 | 0.73 | – * | – |
| Ma-004 | 1.44 | 0.83 | 42 | Bor-010 | 0.52 | – * | – |
| Ma-010 | 1.31 | 1.13 | 14 | Bor-002 | 0.67 | – * | – |
| Ma-011 | 1.37 | 1.12 | 18 | Bor-026 | – * | – * | – |
| Chemical Shift Range (ppm) | Assignment [2,3,25,26,27] | Colombia (Represented by Col-006) | Madagascar (Represented by Ma-004) | Borneo (Represented by Bor-002) |
|---|---|---|---|---|
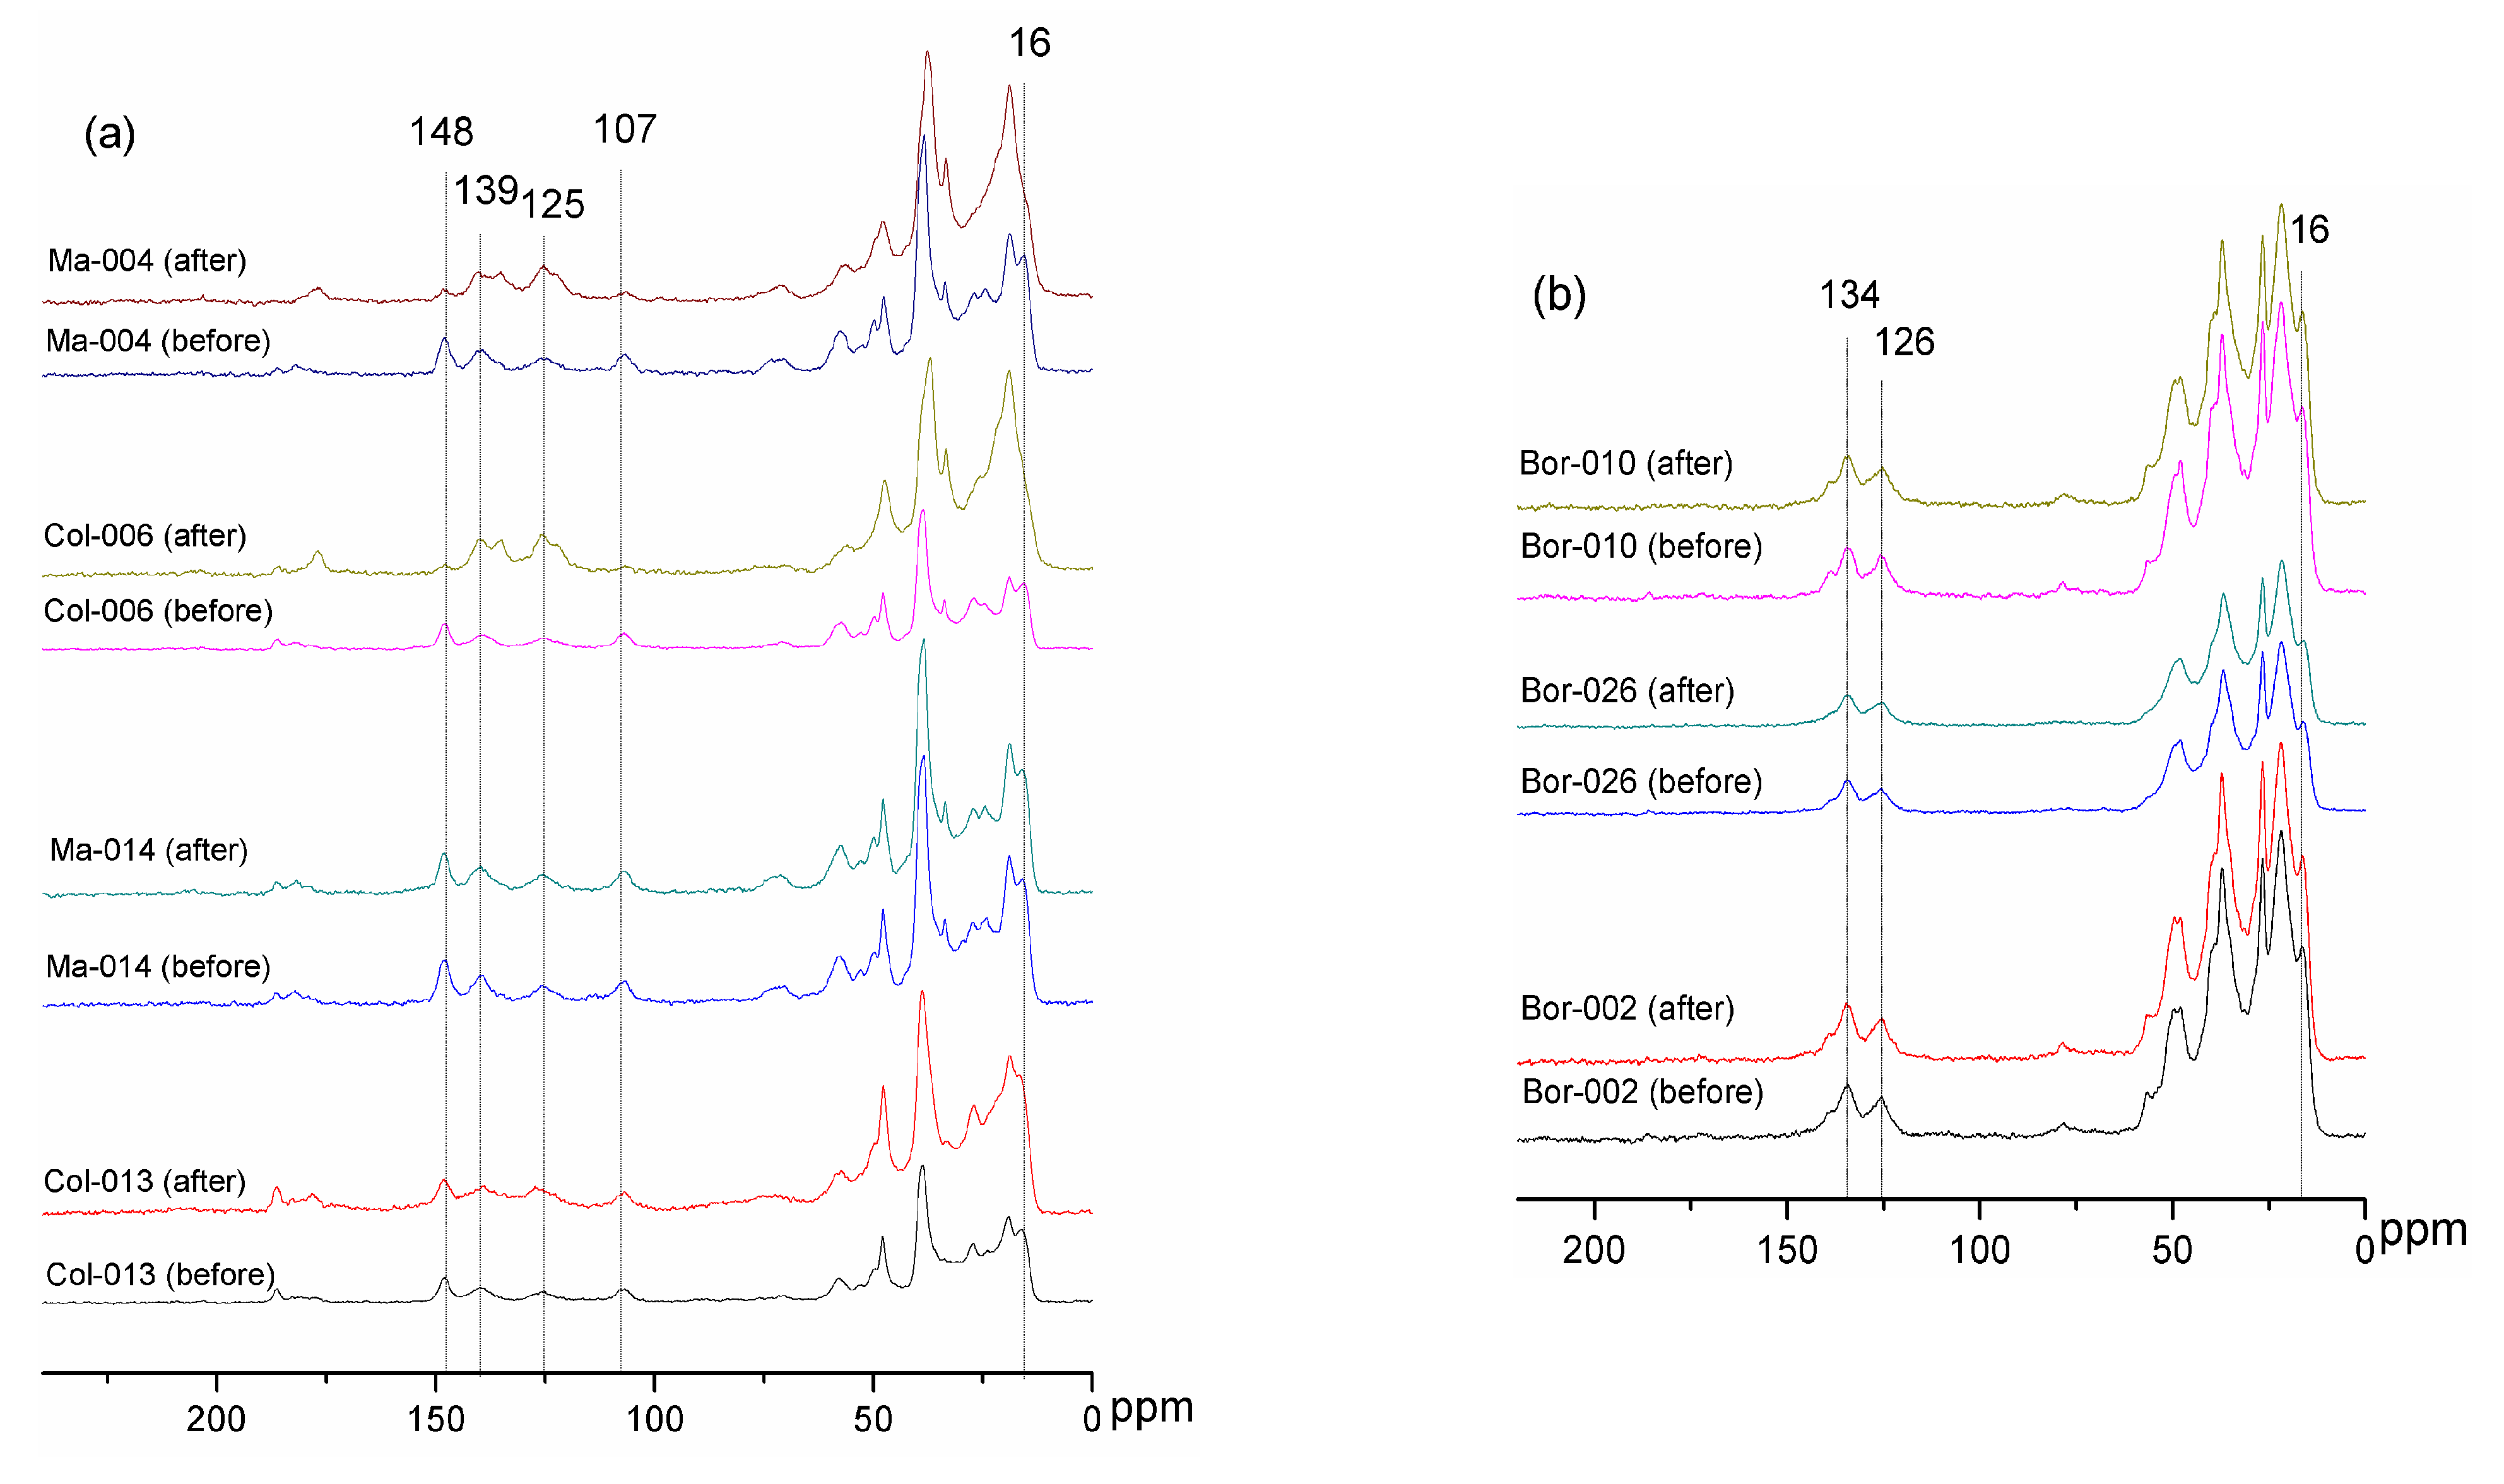
| 14–18 | C–C single bond (primary carbon) | 15.68 | 15.54 | 16.21 |
| 19–21 | C–C single bond (methyl in the ring) | 19.01 | 19.02 | 21.83 |
| 22–36 | C–C single bond (secondary carbon) | 24.64 27.10 33.84 | 24.62 26.92 33.68 | 26.71 — 36.87 |
| 37–50 | C–C single bond (quaternary carbon) | 38.77 47.86 49.82 | 38.42 47.71 49.86 | — 48.04 — |
| 51–60 | C–O single bond (tertiary carbon) | 52.87 57.32 | 52.43 57.46 | — |
| 61–75 | C–O single bond (quaternary and tertiary carbon) | 70.91 | 71.99 | — |
| 76–90 | C–O single bond (quaternary carbon) | — | — | — |
| 91–110 | C=C double bonds (alkene) | 107.07 | 106.71 | — |
| 111–130 | C=C double bonds (aromatic) | 125.56 | 124.65 | 125.60 |
| 131–139 | C=C double bonds (heterocyclic aromatic) | 138.92 | 139.41 | 134.46 |
| 140–150 | C=C double bonds (substituted aromatic carbon) | 147.90 | 147.97 | — |
| 165–178 | C=O double bond (carboxylic acids, esters) | — | — | — |
| 179–220 | C=O double bonds (Ketones, aldehydes) | 182.52 186.10 | 182.30 186.02 | — — |
| Sample | Modification Methods | Changes in Infrared Spectra | ||||
|---|---|---|---|---|---|---|
| Before Treatment | After Treatment | |||||
| H1710/H1464 | H1710/H2957 | H1710/H1464 | H1710/H2957 | |||
| Bor-002 | Slow low-temperature treatment | 0.28 | 0.08 | 0.61 | 0.21 | |
| Bor-026 | Rapid high-temperature treatment | 0.24 | 0.06 | 100 °C | 0.45 | 0.12 |
| 120 °C | 0.46 | 0.15 | ||||
| 140 °C | 0.70 | 0.20 | ||||
| 160 °C | 0.78 | 0.25 | ||||
| 180 °C | 1.29 | 0.47 | ||||
| Bor-004 | Single-stage heat–pressure treatment (140/25) | 0.41 | 0.11 | 0.50 | 0.17 | |
| Bor-011 | Single-stage heat–pressure treatment (180/35) | 0.40 | 0.10 | 0.73 | 0.20 | |
| Bor-010 | Multi-stage heat–pressure treatment | 0.37 | 0.09 | 0.51 | 0.14 | |
Publisher’s Note: MDPI stays neutral with regard to jurisdictional claims in published maps and institutional affiliations. |
© 2021 by the authors. Licensee MDPI, Basel, Switzerland. This article is an open access article distributed under the terms and conditions of the Creative Commons Attribution (CC BY) license (https://creativecommons.org/licenses/by/4.0/).
Share and Cite
Zheng, T.; Li, H.; Lu, T.; Chen, X.; Li, B.; Liu, Y. Spectroscopic Identification of Amber Imitations: Different Pressure and Temperature Treatments of Copal Resins. Crystals 2021, 11, 1223. https://doi.org/10.3390/cryst11101223
Zheng T, Li H, Lu T, Chen X, Li B, Liu Y. Spectroscopic Identification of Amber Imitations: Different Pressure and Temperature Treatments of Copal Resins. Crystals. 2021; 11(10):1223. https://doi.org/10.3390/cryst11101223
Chicago/Turabian StyleZheng, Ting, Haibo Li, Taijin Lu, Xiaoming Chen, Bowen Li, and Yingying Liu. 2021. "Spectroscopic Identification of Amber Imitations: Different Pressure and Temperature Treatments of Copal Resins" Crystals 11, no. 10: 1223. https://doi.org/10.3390/cryst11101223
APA StyleZheng, T., Li, H., Lu, T., Chen, X., Li, B., & Liu, Y. (2021). Spectroscopic Identification of Amber Imitations: Different Pressure and Temperature Treatments of Copal Resins. Crystals, 11(10), 1223. https://doi.org/10.3390/cryst11101223