Communication

Fixed-Target Serial Synchrotron Crystallography Using Nylon Mesh and Enclosed Film-Based Sample Holder

1
Pohang Accelerator Laboratory, Pohang, Gyeongbuk 37673, Korea
2
Department of Life Science, Pohang University of Science and Technology, Pohang, Gyeongbuk 37673, Korea
*
Author to whom correspondence should be addressed.
Crystals 2020, 10(9), 803; https://doi.org/10.3390/cryst10090803
Submission received: 28 August 2020 / Revised: 8 September 2020 / Accepted: 9 September 2020 / Published: 10 September 2020
(This article belongs to the Special Issue Approach of Serial Crystallography)

Abstract

:
Serial crystallography (SX) technique using synchrotron X-ray allows the visualization of room-temperature crystal structures with low-dose data collection as well as time-resolved molecular dynamics. In an SX experiment, delivery of numerous crystals for X-ray interaction, in a serial manner, is very important. Fixed-target scanning approach has the advantage of dramatically minimizing sample consumption as well as any physical damage to crystal sample, compared to other sample delivery methods. Here, we introduce the simple approach of fixed-target serial synchrotron crystallography (FT-SSX) using nylon mesh and enclosed film (NAM)-based sample holder. The NAM-based sample holder consisted of X-ray-transparent nylon-mesh and polyimide film, attached to a magnetic base. This sample holder was mounted to a goniometer head on macromolecular crystallography beamline, and translated along vertical and horizontal directions for raster scanning by the goniometer. Diffraction data were collected in two raster scanning approaches: (i) 100 ms X-ray exposure and 0.011° oscillation at each scan point and (ii) 500 ms X-ray exposure and 0.222° oscillation at each scan point. Using this approach, we determined the room-temperature crystal structures of lysozyme and glucose isomerase at 1.5–2.0 Å resolution. The sample holder produced negligible X-ray background scattering for data processing. Therefore, the new approach provided an opportunity to perform FT-SSX with high accessibility using macromolecular crystallography beamlines at synchrotron without any special equipment.

1. Introduction

Traditional X-ray crystallography is a powerful tool for understanding the biological functions of macromolecules at atomic resolution [1]. The structural information provides insights into new drug design and rational engineering of enzymes for industrial applications [2,3,4]. However, the general X-ray crystallography using a single crystal has experimental limitations in terms of radiation damage and cryogenic temperature during data collection [5,6]. Therefore, the structural information could often be biologically irrelevant [7,8]. Such experimental limitation can, however, be overcome by serial crystallography (SX) techniques, using X-ray free-electron laser (XFEL) or synchrotron X-ray, which allow the observation of crystal structure at room temperature, with minimal radiation damage [9,10]. Moreover, such techniques allow the visualization of time-resolved molecular dynamics through a pump-probe experiment using an optical laser or liquid application [10,11,12,13,14,15]. Therefore, the crystal structure obtained by SX technique could be biologically more reliable than that from traditional X-ray crystallography, performed at cryogenic temperatures, and provides a great advantage of visualizing protein flexibility in more detail [10,16].
Serial femtosecond crystallography (SFX), using XFEL, has a great advantage in terms of high peak-brilliance and ultrashort XFEL pulse width when compared with synchrotron X-ray [17,18]; however, the beam time is extremely insufficient to accommodate the interest of all researchers. As an alternative to this, serial millisecond crystallography (SMX) or serial synchrotron crystallography (SSX), using synchrotron X-rays, has drawn attention, and is increasingly being applied with the third-generation synchrotron that had been previously installed [9,19,20,21,22]. Using an optical device, X-rays can be focused to a size of several microns on a sample location, thereby providing a high photon density to the crystal sample in a short time, and advanced detectors can thereafter implement a high-speed readout function applicable to serial crystallography [9,10]. Synchrotron-based SX techniques allow us to visualize structures at room temperature, with low-dose data collection, besides enabling time-resolved studies ranging from milliseconds to several seconds [9,20,21,22].
In SX data collection, large number of crystal samples are continuously delivered to the X-ray interaction point, and each crystal sample is exposed only once to the X-rays; in case of large crystals, new volume is exposed to the X-rays each time, during data collection [23]. Various crystal delivery methods, such as using injector or syringe [24,25,26,27], injection with viscous medium [26,27,28,29,30,31,32,33], or using capillary [9,34], fixed target [35,36,37,38,39], microfluidics chip [40,41], and conveyor belt based approaches [42,43] have been applied to SX. Among them, the fixed-target sample delivery approach has an advantage of minimizing physical effects during data collection, and dramatically reducing sample consumption compared to other sample delivery methods [21,35,39].
In fixed-target scan method, a large number of crystal samples are spread and allowed to settle in the sample holder, and diffraction data are collected by moving the sample holder along horizontal and vertical directions with respect to the X-ray path, or with its oscillation [21,35,44]. To set the crystal sample stably on the sample holder, various types of fixed-target sample holders, such as silicon chips [21,45], silicon nitride membrane [35], and graphene-based microfluidic chips [46] have been developed, with holes of a certain size arranged in regular order. These sample holders are designed to minimize background scattering from sample holder, which can improve the signal-to-noise (SNR) ratio in data processing. Therefore, these can be very beneficial for the collection of crystal samples with low diffraction limits. However, these are requiring elaborate fabrication of sample holder and being time-consuming and expensive. Some sample holders require precise alignment between X-rays and the crystal-mounted hole in the sample holder [39], thus, requiring a lot of effort for general crystallographers to apply it in actual experiment at the synchrotron.
We had previously developed a nylon mesh-based sample holder, and successfully proved its application in fixed-target serial femtosecond crystallography (FT-SFX) [36]. This sample holder consisted of X-ray-transparent nylon and polyimide film. These materials were widely used for single crystal mounting in conventional X-ray crystallography [47,48], since the materials produced negligible X-ray background scattering. Moreover, this method had an advantage, since it reduced data collection effort and did not require precise alignment between the X-rays and sample holder [36]. Therefore, to the best of our knowledge, nylon-mesh and enclosed film (named as NAM; Nylon-mesh And enclosed filM)-based sample holder had been considered to be very attractive for application in FT-SMX or FT-SSX, although it had not been experimentally proven at synchrotron.
Here, we introduced a simple approach for FT-SSX data collection using NAM-based sample holder. Using this straightforward method, we collected X-ray diffraction data for lysozyme and glucose isomerase, at two different X-ray exposure times and oscillation, and successfully determined the room-temperature crystal structure of both lysozyme and glucose isomerase at 1.5–2.0 Å. Our approach could provide insights to allow more crystallographers to easily access FT-SX data collection.

2. Materials and Methods

2.1. Sample Preparation

Crystallization procedure for chicken egg lysozyme (L6876, Sigma-Aldrich, St. Louis, MO, USA) was identical with that in previous reports [36]. Briefly, lysozyme in 10 mM Tris-HCl, pH 8.0, and 200 mM NaCl was mixed with 0.2 M sodium acetate, pH 4.5, 5% (w/v) PEG 8000, and 2M NaCl in a microcentrifuge tube. The mixture was incubated overnight at 20 °C. Commercially purchased glucose isomerase from Streptomyces rubiginosus (HR7-098, Hampton Research, Aliso Viejo, CA, USA) was already present in the crystal suspension, which was directly used for data collection without further experiment, as in the previous report [36]. The crystal sizes of lysozyme and glucose isomerase used in this experiment were approximately 20–30 μm and <60 μm, respectively.
The overall concept of NAM-based sample holder fabrication is similar to that of nylon mesh-based sample holder, as reported previously [36]; however, there were modifications to the holder so that it could be mounted on the goniometer of the macromolecular crystallography beamline at synchrotron. Dimension of the NAM-based sample holder was 10 mm × 10 mm. To facilitate handling of the polyimide film, a 300 μm thick and 2-mm wide polyvinyl chloride (PVC) frame was attached to the film using double-sided adhesive polyimide tape. The nylon mesh (dimension: 6 mm × 6 mm, pore size of 60 μm) was placed inside the PVC frame of the first polyimide film (25 μm). Crystal suspension (20 μL) was loaded on the nylon mesh, and evenly spread with a pipette tip. After waiting for the crystals to settle on the nylon mesh for >10 s, 5 μl of the crystalline solution was removed from top to reduce background scattering from the solvent. Then, it was covered with a second polyimide film (25 μm) using a double side polyimide tape to prevent the dehydration of crystals. This sample holder, containing crystals, was attached to a magnetic base using polyimide tape.

2.2. FT-SSX Data Collection

Fixed-target serial synchrotron crystallography experiments were performed on a 11C beamline at Pohang Accelerator Laboratory (Pohang, Korea) [49]. The X-ray wavelength and photon flux were 0.9794 Å and 1.2 × 10¹²/second, respectively. The vertical and horizontal dimensions of the X-ray beam focused by Kirkpatrick-Baez mirror were 4.5 and 8.5 μm (FWHM), respectively. NAM-based sample holder containing the crystals with magnetic base was mounted on the MD2-S goniometer (Arinax, Moirans, France) in the experimental hutch. In all FT-SSX data collection, raster scanning was performed at 50-μm intervals in the horizontal direction from the upper left corner; upon reaching the bottom right corner, the sample holder was scanned vertically downwards to 50 μm, along with raster scanning horizontally in the opposite direction. The entire sample holder was scanned in the same way. The raster scan was applied with the following two experimental approaches: (i) the crystals were exposed to X-ray beam for 100 ms, with an oscillation of 0.011° (1°/90 scan points in horizontal direction) at each raster scan point, and (ii) the crystals were exposed to X-ray beam for 500 ms, with an oscillation of approximately 0.222° (20°/90 scan points in horizontal direction) at each raster scan point. Diffraction data were recorded on the Pilatus 6M detector; they were collected in air-environment at 25 °C. Images containing diffraction patterns were filtered using the Cheetah program [50]. Diffraction patterns were processed using CrystFEL program [51]. Data collection statistics are shown in Table 1.

2.3. Structure Determination

Phasing was obtained using the molecular replacement method with Phaser from Phenix [52]. Crystal structures of lysozyme (PDB code 6JXQ) [25] and glucose isomerase (PDB code 5Y4I) [53] were used as search models. Model building was performed using Coot program [54]. Structure refinement was performed using the phenix.refine [52]. Geometry of the final crystal structure was validated by MolProbity [55]. Structure refinement statistics is shown in Table 1. The figures were drawn using PyMOL [56].

2.4. Accession Code

The diffraction image was deposited in CXIDB under IDs: 157 (lysozyme, 100 ms X-ray exposure with 0.011° oscillation), 158 (glucose isomerase, 100 ms X-ray exposure with 0.011° oscillation), 159 (lysozyme, 500 ms X-ray exposure with 0.222° oscillation), and 160 (glucose isomerase, 500 ms X-ray exposure with 0.222° oscillation). The structure factors and coordinates were deposited in Protein Data Bank under 7CVJ (lysozyme, 100 ms X-ray exposure with 0.011° oscillation), 7CVK (glucose isomerase, 100 ms X-ray exposure with 0.011° oscillation), 7CVL (lysozyme, 500 ms X-ray exposure with 0.222° oscillation), and 7CVM (glucose isomerase, 500 ms X-ray exposure with 0.222° oscillation).

3. Results

3.1. FT-SSX Experiment

We had previously applied a NAM-based sample holder for FT-SFX data collection at Pohang Accelerator Laboratory X-ray Free Electron Laser (PAL-XFEL), and successfully determined the room-temperature structures of lysozyme and glucose isomerase [36]. In this study, crystal samples were allowed to settle on the pores of a nylon mesh, with an area of 20 mm × 20 mm, and then enclosed by polyimide films. This sample holder was mounted on a translation stage in the FT-SFX chamber to allow scanning of a fixed target and collect diffraction data [36]. This FT-SFX chamber consisted not only of a translation stage, but also a long-distance high-resolution microscope for real-time monitoring, illumination, pinholes, etc. [36]. Although the system was quite useful for collecting FT-SFX data, it was bulky, and could not be applied to an already established beamline at synchrotron due to device interference in the experimental hutch. While several device components may be taken out in pieces and re-constructed for synchrotron beamline, so that it does not interfere with the beamline equipment, it would not be feasible for general crystallographers to construct the system every time.
Therefore, in this study, the following research approach criteria were established so that general researchers can easily perform FT-SX at the synchrotron: (i) the data collection method should be known to the crystallographers, who had previously used macromolecular crystallography beamlines; (ii) users should control the entire sample delivery process; and (iii) users should not require the installation of additional equipment for FT-SSX.
In the typical macromolecular crystallography beamline at synchrotron, a single crystal is mounted on a goniometer head and oscillation is induced to collect complete three-dimensional diffraction data. We considered mounting a NAM-based sample holder with magnetic base on the goniometer of a beamline device that the crystallographer is familiar with. Therefore, for raster scanning, sample holder was translated in the vertical and horizontal directions using the goniometer. Since the position of NAM-based sample holder is the same as the sample position in experimental hutch, optimally focused X-rays can reach the crystals in the NAM-based sample holder. Moreover, along with other beamline devices, a camera may be used for observing the crystal samples already installed in the beamline. Therefore, in our approach, crystallographers only need to prepare a sample holder, without any additional experimental device, to perform FT-SMX data collection.

3.2. Preparation of NAM-Based Sample Holder

The sample holder for FT-SSX data collection was made on-site by hand, and the basic assembly was similar to that reported previously for NAM-based sample holder consisting of a nylon mesh, polyimide films, PVC frame, and double-side polyimide adhesive tape [36]. However, in this experiment, the size of sample holder was made as small as 10 mm × 10 mm, in accordance with the travel range of goniometer in both horizontal and vertical directions (Figure 1a). During FT-SSX data collection, the goniometer was able to translate 4.5 mm in both vertical and horizontal directions (currently, it can move 8 mm in both directions at 11C beamline in PLS-II). To set lysozyme or glucose isomerase crystals, nylon-mesh with a pore size of 60 μm was used in this experiment. In order to mount the NAM-based sample holder on the goniometer, it (with the crystals) was fixed to a magnetic base using polyimide tape (Figure 1b). Since raster scanning is performed in the direction perpendicular to the X-ray, it is important to fix the sample holder perpendicular to the magnetic base. Accordingly, the upper part of the pin coupled to the magnetic base was removed, and an NAM-based sample holder was horizontally placed on the lower end of the remaining pin and fixed with a polyimide film.

3.3. Data Collection by FT-SSX

For data collection by FT-SSX, the X-ray beam size at the sample location was 4.5 μm × 8.5 μm (FWHM). To avoid radiation damage, raster scans were performed at 50 μm intervals in both vertical and horizontal directions. Since travel range in vertical and horizontal directions was 4.5 mm at a time, 90 raster scanning points were provided in each direction, and as a result, a total of 8100 images were obtained per sample holder. We performed data collection using two different approaches, varying the X-ray exposure time and oscillation: (i) approach I, crystals were exposed to X-rays for 100 ms at the raster scan point, where the goniometer rotated by 0.011° (Figure 2a); (ii) approach II, crystals were exposed to X-rays for 500 ms at the raster scan point, where the goniometer rotated 0.222° (Figure 2b). In approach I, for complete diffraction data collection, when raster scan of the sample holder was completed, another sample holder was mounted to additionally collect diffraction data. Data for lysozyme and glucose isomerase were collected by mounting sample holders seven and six times, respectively. Meanwhile, if the researcher has secured a sufficient number of crystal samples, it is possible to collect data by applying approach I. However, when the amount of crystal samples is not large, approach I may not be applicable. In such a scenario, we expected that complete data could be obtained with only a few images by increasing the X-ray exposure time and oscillation angle of the crystal. To prove this, in approach II, X-ray exposure time and oscillation were increased by 5 and 20 times, respectively, compared to approach I. Data collection and structure determination were performed using only the image obtained from one chip. As a result, approach II has been designed for a small number of samples, with the assumption that data would be analyzed using images obtained from only one chip. All data collection was performed at room temperature and the X-ray path was exposed to air.

3.3.1. Data Collection from 100 ms X-ray Exposure with 0.01° Oscillation

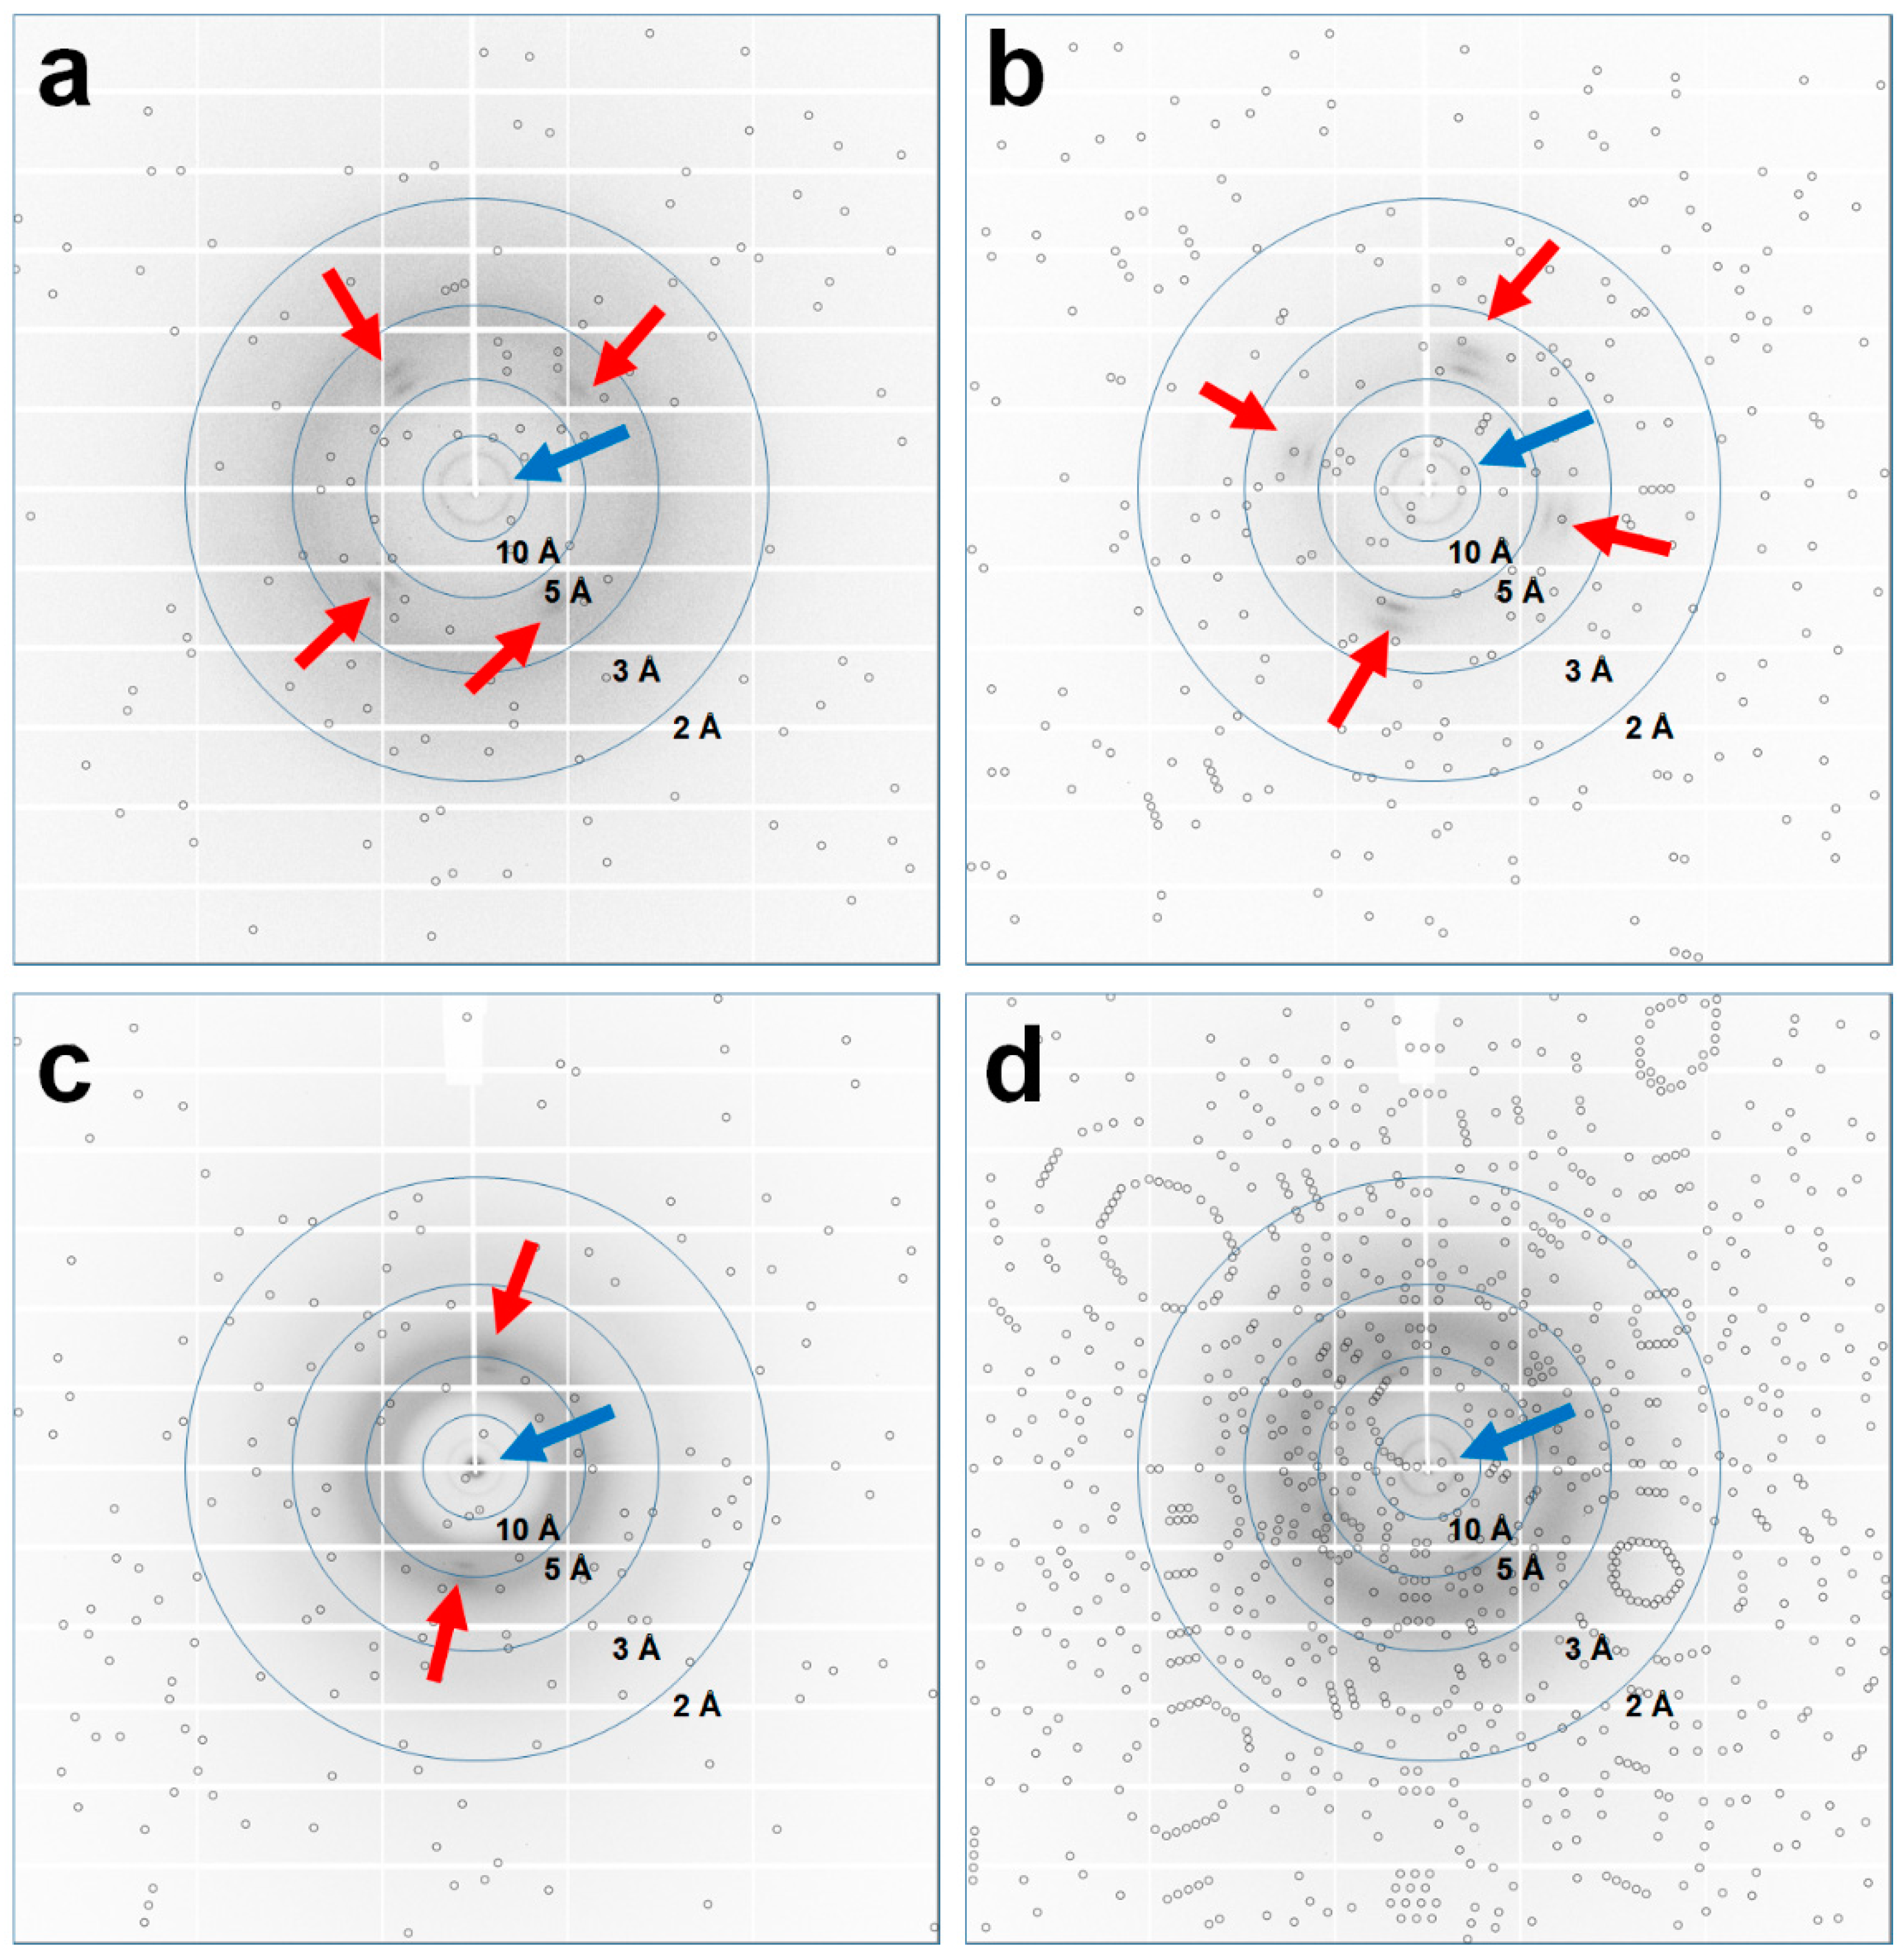
For lysozyme data, a total of 56,700 images were collected. Among them, the total number of images containing more than 20 diffraction peaks was 41,916, with a hit rate of 73.92%. As a result of indexing, 29,735 diffraction patterns were obtained from 21,670 images (Figure 3a). The total indexing rate and multi-crystal hit rate were 70.93% and 37.2%, respectively. Data were processed up to 1.5 Å, and a total of 20,320 unique reflections were obtained. Completeness, redundancy, SNR, CC, CC*, Rsplit, and Wilson B factor were 100, 427.0, 7.94, 0.9877, 0.9969, 8.97, and 22.52, respectively.
For glucose isomerase data collection, a total of 48,600 images were collected. Among them, the total number of images containing more than 20 diffraction peaks was 25,099, with a hit rate of 51.64%. As a result of indexing, 17,100 diffraction patterns were obtained from 13,727 images. The total indexing rate and multi-crystal hit rate were 68.13% and 24.57%, respectively (Figure 3b). The data were processed up to 1.7 Å, and a total of 54,250 unique reflections were obtained. Completeness, redundancy, SNR, CC, CC*, Rsplit, and Wilson B factor were 100, 241.2, 3.36, 0.9246, 0.9802, 24.09, and 19.27, respectively. Both lysozyme and glucose isomerase data showed high degree of completeness in overall values compared to that in general SX data statistics.

3.3.2. Data Collection from 500 ms X-ray Exposure with 0.22° Oscillation

For lysozyme data, 8100 images were collected. Among them, the total number of images containing more than 20 diffraction peaks was 7628, with a hit rate of 94.17%. As a result of indexing, 3476 lysozyme diffraction patterns were obtained from 2737 images (Figure 3c). The total indexing rate and multi-crystal hit rate were 45.56% and 27.00%, respectively. The data were processed up to 1.6 Å, and a total of 16,824 unique reflections were obtained. Completeness, redundancy, SNR, CC, CC*, Rsplit, and Wilson B factor were 100, 63.5, 4.31, 0.9515, 0.9875, 18.26, and 24.36, respectively.
For glucose isomerase data, a total of 8100 images were collected. Among them, the total number of images containing more than 20 diffraction peaks was 2576, with a hit rate of 31.80%. As a result of indexing, 1565 diffraction patterns were obtained from 1245 images (Figure 3d). The total indexing rate and multi-crystal hit rate were 60.75% and 25.70%, respectively. The data were processed up to 2.0 Å, and a total of 33,589 unique reflections were obtained. Completeness, redundancy, SNR, CC, CC*, Rsplit, and Wilson B factor were 100, 30.8, 2.05, 0.7069, 0.9101, 46.47, and 17.64, respectively.
The number of diffraction patterns collected from both data may be significantly lower than that in case of general SX data collection; however, we only analyzed the images collected from the sample holder, in order to determine how much of it was affected by the exposure time and oscillation at the raster scan point. In case of lysozyme data, despite the small number of images collected, data statistics that could be converged to the SX study are shown. In contrast, the glucose isomerase data showed low SNR and CC values, and high Rsplit values. We considered the poor data statistics to generally be a phenomenon that occurs when the number of diffraction data is small in SX. These data values may be sufficiently improved by increasing the number of diffraction images. On the other hand, in this study, analysis of not only good data but also poorly completed data was essential; therefore, we proceeded to the next process without collecting additional data.
In the raster scan process, X-rays penetrated the nylon mesh and polyimide film, as well as the crystals placed at random locations. The nylon mesh produced 2 (nylon) or 4 (nylon intersection) partial background scattering around 4.30 and 3.75 Å, depending on the fiber direction (Figure 3a–c), and the polyimide film generated a scattering ring at 15.30 Å position (Figure 3). Although the beam characteristics and intensities of XFEL and synchrotron X-rays were different, the pattern of X-ray background scattering from the NAM-based sample holders, generated by synchrotron X-rays, was the same as in the previous FT-SFX using XFEL [36]. On the other hand, there was no significant effect on SNR or CC around 3.75, 4.30, and 15.30 Å resolution, which were the background scattering regions generated from nylon mesh and polyimide film.

3.4. Structural Analysis of Lysozyme and Glucose Isomerase

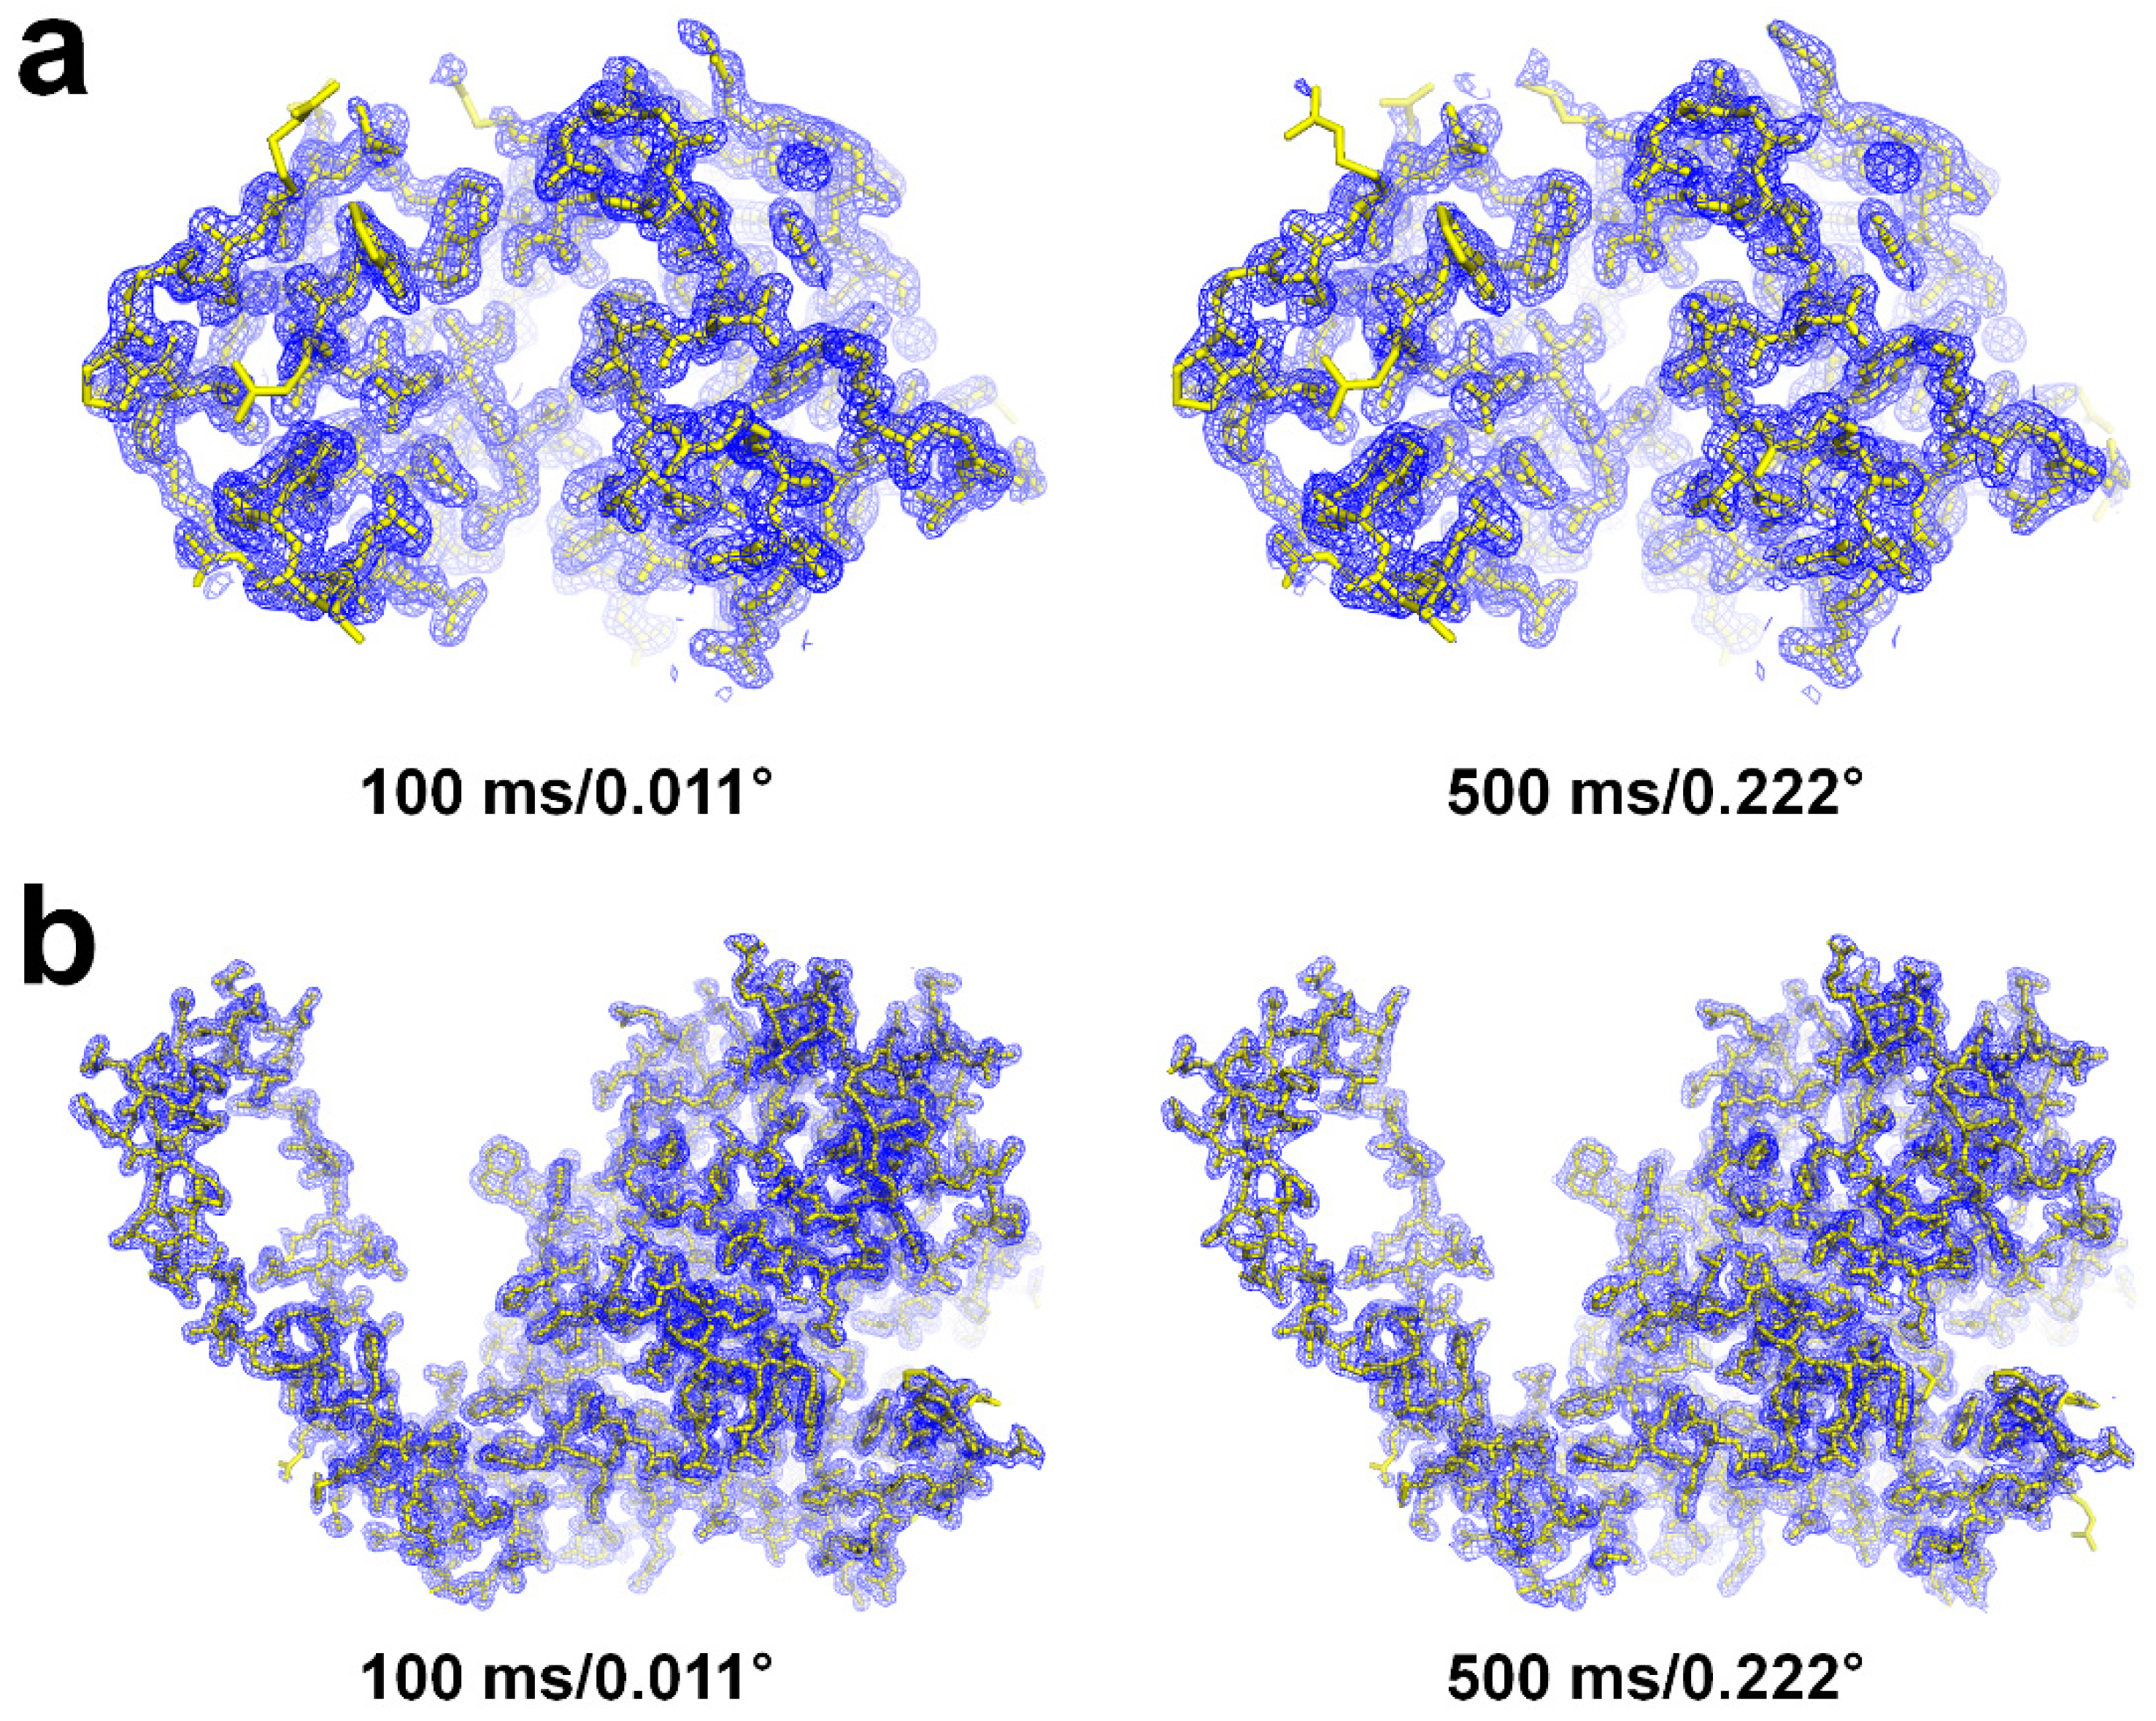
For approach I (100 ms X-ray exposure with 0.011° oscillation), lysozyme and glucose isomerase were processed up to 1.5 and 1.7 Å, respectively. The final models had Rwork/Rfree values of 16.66/18.53 and 18.15/19.94 for lysozyme and glucose isomerase, respectively. For approach II (500 ms X-ray exposure with 0.222° oscillation), lysozyme and glucose isomerase were processed up to 1.6 and 2.0 Å, respectively. The final models had Rwork/Rfree values of 18.87/21.54 and 21.36/24.81 for lysozyme and glucose isomerase, respectively. Although there was a large difference in the data collection strategy between approaches I and II, and the quality of each data, electron density map for amino acid chains was observed very clearly for all datasets (Figure 4). In particular, even in the case of glucose isomerase exposed to 500 ms X-ray, which had relatively poor data statistics and Rwork/Rfree values, the overall electron density was very clear (Figure 4). Thus, we could model the structure of lysozyme and glucose isomerase to Lys19-Leu147 and Tyr3-Arg387, respectively.
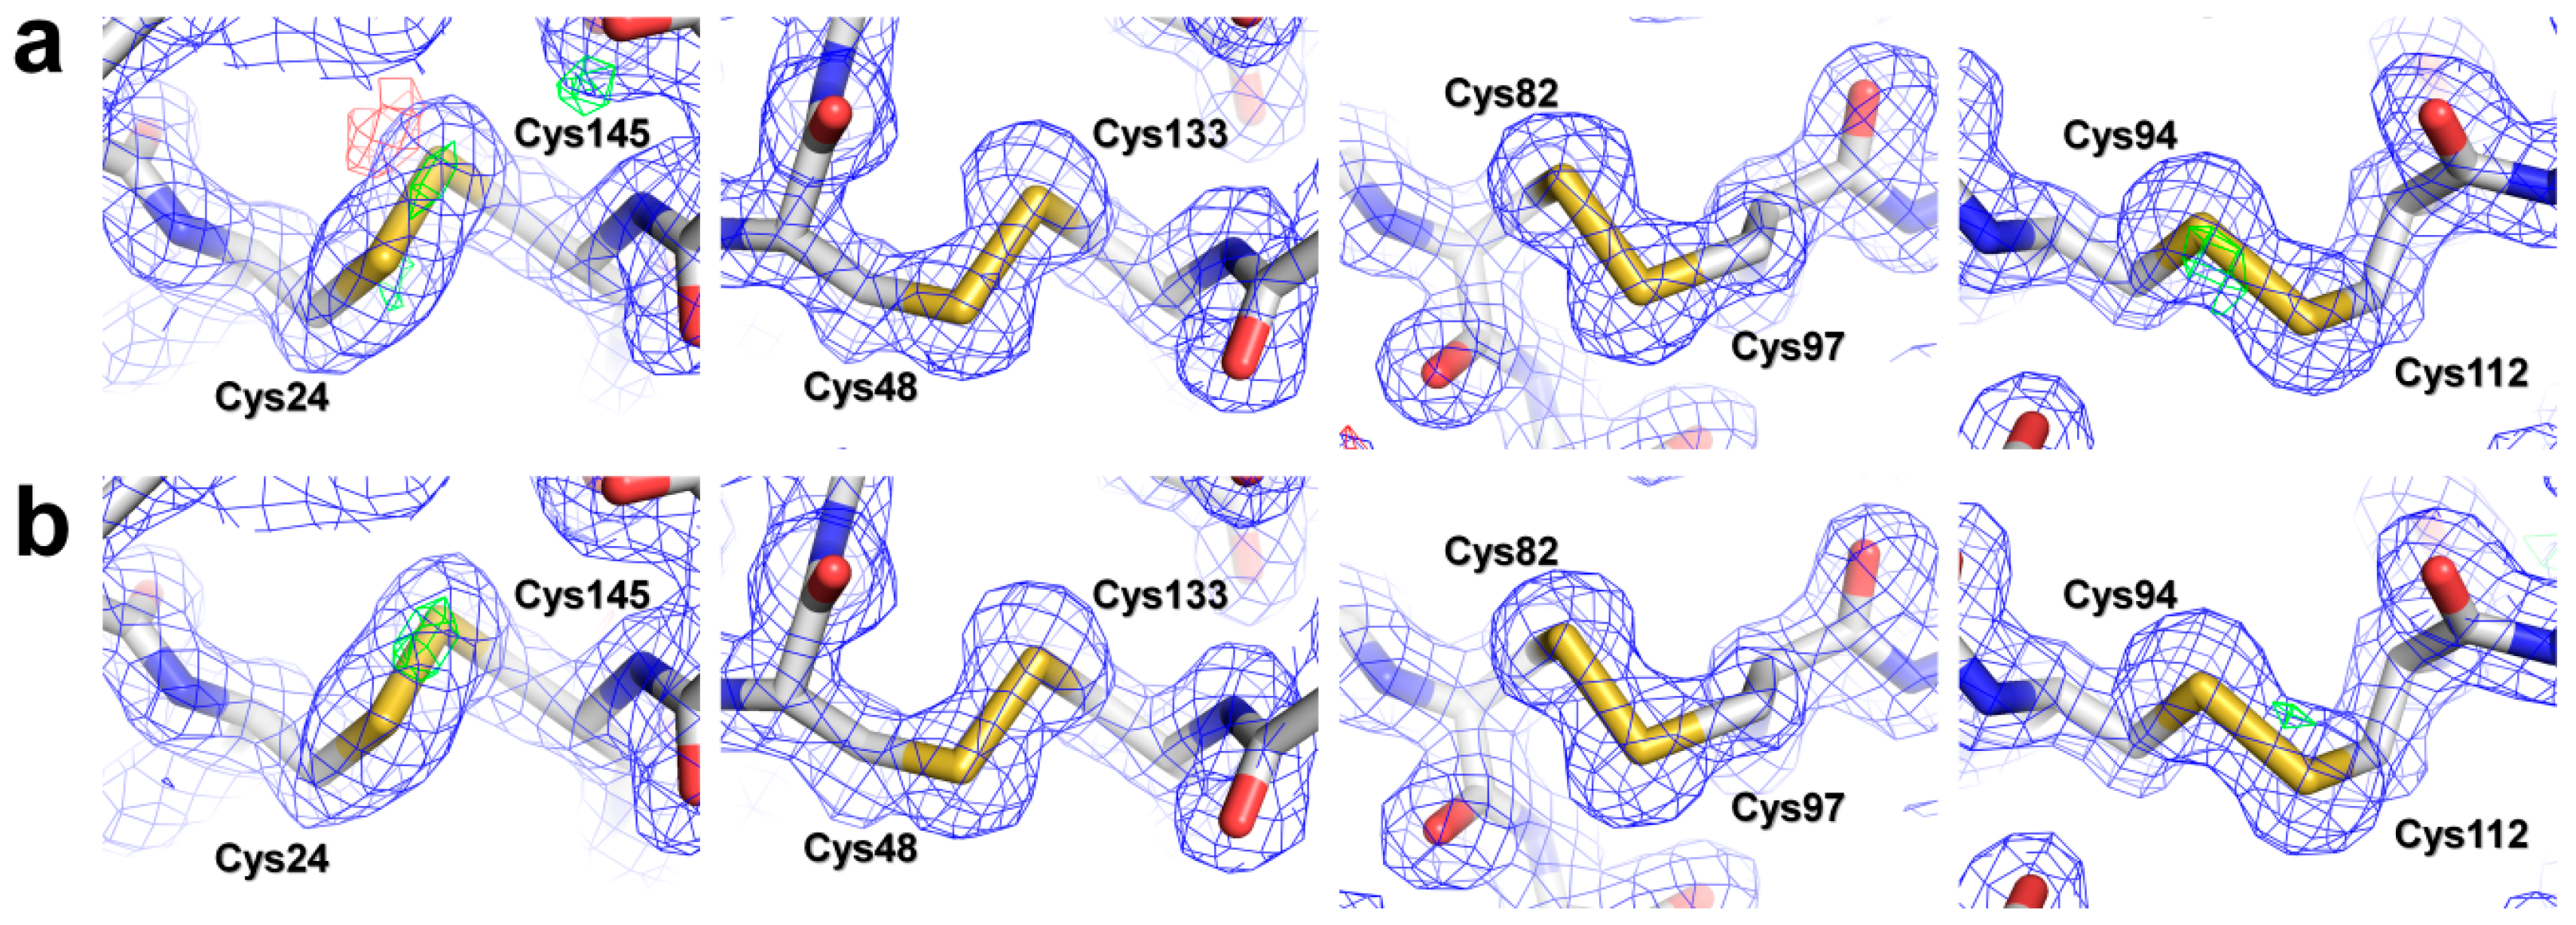
To determine the effect of radiation damage caused by synchrotron X-rays, electron density maps of disulfide bonds in lysozyme and metal-binding sites in glucose isomerase were analyzed. Among the four disulfide bonds in lysozyme, there was no significant negative mFo-DFc electron density map observed in either of approaches I and II (Figure 5). For lysozyme in approach I, the B-factor values of Cys24, Cys48, Cys82, Cys94, Cys98, Cys112, Cys133, and Cys145 were 23.0, 15.4, 17.7, 21.6, 16.3, 18.4, 16.3, and 27.7 Å2, respectively, and the average B-factor of the whole protein was 26.06 Å2. For lysozyme in approach II, the B-factor values of Cys24, Cys48, Cys82, Cys94, Cys98, Cys112, Cys133, and Cys145 were 24.4, 15.9, 18.5, 22.4, 18.1, 19.7, 17.9, and 29.2 Å2, respectively, the average B-factor of the whole protein being 26.70 Å2. As a result, there was no significant difference in the cysteine residues from disulfide bonds in terms of B-factor, when compared with whole protein.
Glucose isomerase contained two Mg2+ at the active site, which were known to be involved in substrate binding and isomerase activity [53,57]. No significant negative mFo-DFc electron density map was observed in either dataset from approaches I and II (Figure 6). In glucose isomerase, as per approach I, the B-factor values of Mg2+ at M1 and M2 sites were 11.3 and 20.1 Å2, respectively, with the average B-factor of the whole protein being 18.35 Å2. In glucose isomerase, as per approach II, the B-factor values of Mg2+ at M1 and M2 sites were 9.3 and 16.5 Å2, respectively, with the average B-factor of the whole protein being 18.32 Å2. Therefore, in terms of B-factor, there was no significant difference in metal binding at the active site, when compared with whole protein.

3.5. Observation of Sample Holder after FT-SSX

In the previous FT-SFX experiment, we had observed that a hole was formed in the sample holder at the point through which the XFEL had passed [36,37], whereas no damage was observed due to the penetration of synchrotron X-rays in either the polyimide film or the nylon mesh in NAM-based sample holder (Figure 7). Therefore, it is not surprising that nylon and polyimide have become popular materials for single-crystal mounting in macromolecular crystallography beamline at the synchrotron. Since they do not get damaged, the NAM-based sample holders used in synchrotron are also reusable. In the FT-SFX experiment, we had observed bubbles, possibly due to radiation damage, in the mesh pores of NAM-based sample holder, through which XFEL had passed [36]; no such significant phenomenon was observed in the current experiment.

4. Discussion

Here, we have introduced the FT-SSX approach using NAM-based sample holder and the existing beamline component at synchrotron. The NAM-based sample holder was combined with a magnetic base and mounted on a goniometer, which is equivalent to mounting a single crystal using a loop on a goniometer in conventional X-ray crystallography. Therefore, crystallographers would be quite familiar with our sample mounting method. In addition, since the position where the NAM-based holder is mounted is the same as the sample position in the existing beamline, it was possible to expose the crystal samples to high photon density (focused by the optics) without any additional manipulation, and directly use the existing sample observation camera. Consequently, our approach did not require any special device installation and dismantling work for FT-SSX.
Since the goniometers installed in each beamline may be of different types, and the specifications for travel range may be different accordingly, the size of NAM-based sample holder may not be the same. However, since the sample holder is quite simple to make by hand, it could be easily applied to any beamline, according to the travel range of goniometer. In this experiment, we introduced a method of simply fixing the sample holder to the magnetic base with polyimide tape, which can be applied without restrictions in various ways such as cray, clip, or three-dimensional (3D)-printed base. In addition, we introduced a method of simply enclosing the crystals on the nylon mesh with polyimide films, which can be applied without restrictions in various films such as Mylar, or polypropylene. In particular, selecting a film material with low background scattering would be advantageous for ensuring the quality of SNR on data. Since the NAM-based sample holder did not have significant radiation damage due to synchrotron X-ray, it had the advantage of being reused, unlike the nylon mesh-based sample holders used in FT-SFX.
On the other hand, in this experiment, we used a polyimide film with a thickness of 25 μm, which is readily available at a low cost. The X-ray background scattering generated by this film had a negligible effect on the data processing. Nevertheless, it is important to use as thin a polyimide film as possible in data collection experiments where the diffraction intensity is weak or SNR is important, since the SNR of the data can be increased if a thinner film is used.
At the time of our study, the goniometer was able to move 4.5 mm in both vertical and horizontal directions. Accordingly, 90 raster scan points were provided for each of the existing vertical and horizontal directions, and 8100 diffraction data were obtained from one chip. Currently, travel range of the goniometer has increased to 8 mm, and the latter can, therefore, provide 160 scan points in the vertical and horizontal directions, so that 25,600 X-ray images can be collected from one chip. Accordingly, the labor of having to change the sample holder several times for complete data collection could be reduced by more than three times. With high hit rate and indexing rate from diffraction data, it would be possible to collect complete diffraction dataset for structure determination using a single NAM-based sample holder.
In this experiment, we collected FT-SSX data using two different approaches: I and II. Electron density map analysis showed no significant radiation damage at the disulfide bonds of lysozyme and metal-binding sites of glucose isomerase, which are otherwise relatively sensitive to radiation damage. Moreover, we could not find any significant residual radiation damage in overall electron density map. Nevertheless, it is well known, both experimentally and theoretically, that radiation damage occurs in the region through which X-rays are transmitted, and the radicals generated at this time can affect the quality of surrounding molecules or crystal samples. Therefore, in case of proteins that may be sensitive to potential radicals, it would be important to minimize the exposure time of X-rays to reduce the dose, and carefully analyze the electron density map thereafter. Future studies on radiation damage that may occur while using NAM-based sample holders, with various crystal samples and data collection strategies, may be quite useful.

5. Conclusions

This study reported a very simple approach of collecting FT-SSX data using NAM-based sample holder. We believe that our approach and experimental results will be useful for more crystallographers aiming to determine biologically reliable room-temperature structures with low dose data collection.

Author Contributions

Conceptualization, Y.C. and K.H.N.; sample preparation, K.H.N.; data collection, S.-Y.P., H.C., C.E., Y.C., and K.H.N.; data analysis, K.H.N.; structure determination, K.H.N.; writing, K.H.N. All authors have read and agreed to the published version of the manuscript.

Funding

This work was funded by the National Research Foundation of Korea (NRF) grant funded by the Korea government (MOE) (NRF-2017M3A9F6029736).

Acknowledgments

We would like to thank the macromolecule beamline staff at 11C beamline at Pohang Accelerator Laboratory for their assistance with data collection, and Global Science experimental Data hub Center (GSDC) at the Korea Institute of Science and Technology Information (KISTI) for computational support.

Conflicts of Interest

The authors declare no conflict of interest. The funders had no role in the design of the study; in the collection, analyses, or interpretation of data; in the writing of the manuscript, or in the decision to publish the results.

References

  1. Smyth, M.S. x Ray crystallography. Mol. Pathol. 2000, 53, 8–14. [Google Scholar] [CrossRef]
  2. Maveyraud, L.; Mourey, L. Protein X-ray Crystallography and Drug Discovery. Molecules 2020, 25, 1030. [Google Scholar] [CrossRef] [Green Version]
  3. Müller, H.; Becker, A.K.; Palm, G.J.; Berndt, L.; Badenhorst, C.P.S.; Godehard, S.P.; Reisky, L.; Lammers, M.; Bornscheuer, U.T. Sequence-Based Prediction of Promiscuous Acyltransferase Activity in Hydrolases. Angew. Chem. Int. Ed. 2020, 59, 11607–11612. [Google Scholar] [CrossRef] [PubMed] [Green Version]
  4. Wu, S.; Snajdrova, R.; Moore, J.C.; Baldenius, K.; Bornscheuer, U. Biocatalysis: Enzymatic Synthesis for Industrial Applications. Angew. Chem. Int. Ed. 2020, 59, 2–34. [Google Scholar] [CrossRef] [PubMed]
  5. Meents, A.; Gutmann, S.; Wagner, A.; Schulze-Briese, C. Origin and temperature dependence of radiation damage in biological samples at cryogenic temperatures. Proc. Natl. Acad. Sci. USA 2010, 107, 1094–1099. [Google Scholar] [CrossRef] [PubMed] [Green Version]
  6. Owen, R.L.; Rudino-Pinera, E.; Garman, E.F. Experimental determination of the radiation dose limit for cryocooled protein crystals. Proc. Natl. Acad. Sci. USA 2006, 103, 4912–4917. [Google Scholar] [CrossRef] [PubMed] [Green Version]
  7. Weik, M.; Ravelli, R.B.G.; Kryger, G.; McSweeney, S.; Raves, M.L.; Harel, M.; Gros, P.; Silman, I.; Kroon, J.; Sussman, J.L. Specific chemical and structural damage to proteins produced by synchrotron radiation. Proc. Natl. Acad. Sci. USA 2000, 97, 623–628. [Google Scholar] [CrossRef] [Green Version]
  8. Meents, A.; Dittrich, B.; Gutmann, S. A new aspect of specific radiation damage: Hydrogen abstraction from organic molecules. J. Synchrotron Radiat. 2009, 16, 183–190. [Google Scholar] [CrossRef] [Green Version]
  9. Stellato, F.; Oberthur, D.; Liang, M.; Bean, R.; Gati, C.; Yefanov, O.; Barty, A.; Burkhardt, A.; Fischer, P.; Galli, L.; et al. Room-temperature macromolecular serial crystallography using synchrotron radiation. IUCrJ 2014, 1, 204–212. [Google Scholar] [CrossRef]
  10. Weinert, T.; Olieric, N.; Cheng, R.; Brunle, S.; James, D.; Ozerov, D.; Gashi, D.; Vera, L.; Marsh, M.; Jaeger, K.; et al. Serial millisecond crystallography for routine room-temperature structure determination at synchrotrons. Nat. Commun. 2017, 8, 542. [Google Scholar] [CrossRef]
  11. Schlichting, I. Serial femtosecond crystallography: The first five years. IUCrJ 2015, 2, 246–255. [Google Scholar] [CrossRef] [PubMed] [Green Version]
  12. Olmos, J.L.; Pandey, S.; Martin-Garcia, J.M.; Calvey, G.; Katz, A.; Knoska, J.; Kupitz, C.; Hunter, M.S.; Liang, M.; Oberthuer, D.; et al. Enzyme intermediates captured “on the fly” by mix-and-inject serial crystallography. BMC Biol. 2018, 16, 59. [Google Scholar] [CrossRef] [PubMed] [Green Version]
  13. Tenboer, J.; Basu, S.; Zatsepin, N.; Pande, K.; Milathianaki, D.; Frank, M.; Hunter, M.; Boutet, S.; Williams, G.J.; Koglin, J.E.; et al. Time-resolved serial crystallography captures high-resolution intermediates of photoactive yellow protein. Science 2014, 346, 1242–1246. [Google Scholar] [CrossRef] [PubMed] [Green Version]
  14. Mehrabi, P.; Schulz, E.C.; Agthe, M.; Horrell, S.; Bourenkov, G.; von Stetten, D.; Leimkohl, J.-P.; Schikora, H.; Schneider, T.R.; Pearson, A.R.; et al. Liquid application method for time-resolved analyses by serial synchrotron crystallography. Nat. Methods 2019, 16, 979–982. [Google Scholar] [CrossRef] [PubMed]
  15. Schmidt, M. Reaction Initiation in Enzyme Crystals by Diffusion of Substrate. Crystals 2020, 10, 116. [Google Scholar] [CrossRef] [Green Version]
  16. Fraser, J.S.; van den Bedem, H.; Samelson, A.J.; Lang, P.T.; Holton, J.M.; Echols, N.; Alber, T. Accessing protein conformational ensembles using room-temperature X-ray crystallography. Proc. Natl. Acad. Sci. USA 2011, 108, 16247–16252. [Google Scholar] [CrossRef] [Green Version]
  17. Kim, J.; Kim, H.Y.; Park, J.; Kim, S.; Kim, S.; Rah, S.; Lim, J.; Nam, K.H. Focusing X-ray free-electron laser pulses using Kirkpatrick-Baez mirrors at the NCI hutch of the PAL-XFEL. J. Synchrotron Radiat. 2018, 25, 289–292. [Google Scholar] [CrossRef] [Green Version]
  18. Kang, H.S.; Min, C.K.; Heo, H.; Kim, C.; Yang, H.; Kim, G.; Nam, I.; Baek, S.Y.; Choi, H.J.; Mun, G.; et al. Hard X-ray free-electron laser with femtosecond-scale timing jitter. Nat. Photonics 2017, 11, 708–713. [Google Scholar] [CrossRef]
  19. Gati, C.; Bourenkov, G.; Klinge, M.; Rehders, D.; Stellato, F.; Oberthur, D.; Yefanov, O.; Sommer, B.P.; Mogk, S.; Duszenko, M.; et al. Serial crystallography on in vivo grown microcrystals using synchrotron radiation. IUCrJ 2014, 1, 87–94. [Google Scholar] [CrossRef]
  20. Botha, S.; Nass, K.; Barends, T.R.; Kabsch, W.; Latz, B.; Dworkowski, F.; Foucar, L.; Panepucci, E.; Wang, M.; Shoeman, R.L.; et al. Room-temperature serial crystallography at synchrotron X-ray sources using slowly flowing free-standing high-viscosity microstreams. Acta Crystallogr. Sect. D Boil. Crystallogr. 2015, 71 Pt 2, 387–397. [Google Scholar] [CrossRef] [Green Version]
  21. Owen, R.L.; Axford, D.; Sherrell, D.A.; Kuo, A.; Ernst, O.P.; Schulz, E.C.; Miller, R.J.D.; Mueller-Werkmeister, H.M. Low-dose fixed-target serial synchrotron crystallography. Acta Crystallogr. Sect. D Struct. Biol. 2017, 73, 373–378. [Google Scholar] [CrossRef] [PubMed]
  22. Weinert, T.; Skopintsev, P.; James, D.; Dworkowski, F.; Panepucci, E.; Kekilli, D.; Furrer, A.; Brunle, S.; Mous, S.; Ozerov, D.; et al. Proton uptake mechanism in bacteriorhodopsin captured by serial synchrotron crystallography. Science 2019, 365, 61–65. [Google Scholar] [CrossRef] [PubMed]
  23. Martiel, I.; Muller-Werkmeister, H.M.; Cohen, A.E. Strategies for sample delivery for femtosecond crystallography. Acta Crystallogr. Sect. D Boil. Crystallogr. 2019, 75, 160–177. [Google Scholar] [CrossRef] [PubMed] [Green Version]
  24. DePonte, D.P.; Weierstall, U.; Schmidt, K.; Warner, J.; Starodub, D.; Spence, J.C.H.; Doak, R.B. Gas dynamic virtual nozzle for generation of microscopic droplet streams. J. Phys. D Appl. Phys. 2008, 41, 195505. [Google Scholar] [CrossRef] [Green Version]
  25. Park, S.Y.; Nam, K.H. Sample delivery using viscous media, a syringe and a syringe pump for serial crystallography. J. Synchrotron Radiat. 2019, 26, 1815–1819. [Google Scholar] [CrossRef] [PubMed] [Green Version]
  26. Sugahara, M.; Mizohata, E.; Nango, E.; Suzuki, M.; Tanaka, T.; Masudala, T.; Tanaka, R.; Shimamura, T.; Tanaka, Y.; Suno, C.; et al. Grease matrix as a versatile carrier of proteins for serial crystallography. Nat. Methods 2015, 12, 61–63. [Google Scholar] [CrossRef] [Green Version]
  27. Weierstall, U.; James, D.; Wang, C.; White, T.A.; Wang, D.J.; Liu, W.; Spence, J.C.H.; Doak, R.B.; Nelson, G.; Fromme, P.; et al. Lipidic cubic phase injector facilitates membrane protein serial femtosecond crystallography. Nat. Commun. 2014, 5, 3309. [Google Scholar] [CrossRef]
  28. Conrad, C.E.; Basu, S.; James, D.; Wang, D.; Schaffer, A.; Roy-Chowdhury, S.; Zatsepin, N.A.; Aquila, A.; Coe, J.; Gati, C.; et al. A novel inert crystal delivery medium for serial femtosecond crystallography. IUCrJ 2015, 2, 421–430. [Google Scholar] [CrossRef]
  29. Park, J.; Park, S.; Kim, J.; Park, G.; Cho, Y.; Nam, K.H. Polyacrylamide injection matrix for serial femtosecond crystallography. Sci. Rep. 2019, 9, 2525. [Google Scholar] [CrossRef] [Green Version]
  30. Nam, K.H. Sample Delivery Media for Serial Crystallography. Int. J. Mol. Sci. 2019, 20, 1094. [Google Scholar] [CrossRef] [Green Version]
  31. Nam, K.H. Shortening injection matrix for serial crystallography. Sci. Rep. 2020, 10, 107. [Google Scholar] [CrossRef] [PubMed] [Green Version]
  32. Nam, K.H. Polysaccharide-Based Injection Matrix for Serial Crystallography. Int. J. Mol. Sci. 2020, 21, 3332. [Google Scholar] [CrossRef] [PubMed]
  33. Nam, K.H. Lard Injection Matrix for Serial Crystallography. Int. J. Mol. Sci. 2020, 21, 5977. [Google Scholar] [CrossRef] [PubMed]
  34. Nam, K.H. Stable sample delivery in viscous media via a capillary for serial crystallography. J. Appl. Crystallogr. 2020, 53, 45–50. [Google Scholar] [CrossRef]
  35. Hunter, M.S.; Segelke, B.; Messerschmidt, M.; Williams, G.J.; Zatsepin, N.A.; Barty, A.; Benner, W.H.; Carlson, D.B.; Coleman, M.; Graf, A.; et al. Fixed-target protein serial microcrystallography with an x-ray free electron laser. Sci. Rep. 2014, 4, 6026. [Google Scholar] [CrossRef] [PubMed] [Green Version]
  36. Lee, D.; Baek, S.; Park, J.; Lee, K.; Kim, J.; Lee, S.J.; Chung, W.K.; Lee, J.L.; Cho, Y.; Nam, K.H. Nylon mesh-based sample holder for fixed-target serial femtosecond crystallography. Sci. Rep. 2019, 9, 6971. [Google Scholar] [CrossRef] [Green Version]
  37. Lee, K.; Lee, D.; Baek, S.; Park, J.; Lee, S.J.; Park, S.; Chung, W.K.; Lee, J.-L.; Cho, H.-S.; Cho, Y.; et al. Viscous-medium-based crystal support in a sample holder for fixed-target serial femtosecond crystallography. J. Appl. Crystallogr. 2020, 53, 1051–1059. [Google Scholar] [CrossRef]
  38. Lee, D.; Park, S.; Lee, K.; Kim, J.; Park, G.; Nam, K.H.; Baek, S.; Chung, W.K.; Lee, J.-L.; Cho, Y.; et al. Application of a high-throughput microcrystal delivery system to serial femtosecond crystallography. J. Appl. Crystallogr. 2020, 53, 477–485. [Google Scholar] [CrossRef] [Green Version]
  39. Roedig, P.; Ginn, H.M.; Pakendorf, T.; Sutton, G.; Harlos, K.; Walter, T.S.; Meyer, J.; Fischer, P.; Duman, R.; Vartiainen, I.; et al. High-speed fixed-target serial virus crystallography. Nat. Methods 2017, 14, 805–810. [Google Scholar] [CrossRef]
  40. Monteiro, D.C.F.; Vakili, M.; Harich, J.; Sztucki, M.; Meier, S.M.; Horrell, S.; Josts, I.; Trebbin, M. A microfluidic flow-focusing device for low sample consumption serial synchrotron crystallography experiments in liquid flow. J. Synchrotron Radiat. 2019, 26, 406–412. [Google Scholar] [CrossRef]
  41. Calvey, G.D.; Katz, A.M.; Pollack, L. Microfluidic Mixing Injector Holder Enables Routine Structural Enzymology Measurements with Mix-and-Inject Serial Crystallography Using X-ray Free Electron Lasers. Anal. Chem. 2019, 91, 7139–7144. [Google Scholar] [CrossRef] [PubMed]
  42. Beyerlein, K.R.; Dierksmeyer, D.; Mariani, V.; Kuhn, M.; Sarrou, I.; Ottaviano, A.; Awel, S.; Knoska, J.; Fuglerud, S.; Jönsson, O.; et al. Mix-and-diffuse serial synchrotron crystallography. IUCrJ 2017, 4, 769–777. [Google Scholar] [CrossRef] [PubMed]
  43. Fuller, F.D.; Gul, S.; Chatterjee, R.; Burgie, E.S.; Young, I.D.; Lebrette, H.; Srinivas, V.; Brewster, A.S.; Michels-Clark, T.; Clinger, J.A.; et al. Drop-on-demand sample delivery for studying biocatalysts in action at X-ray free-electron lasers. Nat. Methods 2017, 14, 443–449. [Google Scholar] [CrossRef] [PubMed] [Green Version]
  44. Wierman, J.L.; Paré-Labrosse, O.; Sarracini, A.; Besaw, J.E.; Cook, M.J.; Oghbaey, S.; Daoud, H.; Mehrabi, P.; Kriksunov, I.; Kuo, A.; et al. Fixed-target serial oscillation crystallography at room temperature. IUCrJ 2019, 6, 305–316. [Google Scholar] [CrossRef] [PubMed] [Green Version]
  45. Murray, T.D.; Lyubimov, A.Y.; Ogata, C.M.; Vo, H.; Uervirojnangkoorn, M.; Brunger, A.T.; Berger, J.M. A high-transparency, micro-patternable chip for X-ray diffraction analysis of microcrystals under native growth conditions. Acta Crystallogr. Sect. D Boil. Crystallogr. 2015, 71, 1987–1997. [Google Scholar] [CrossRef] [PubMed] [Green Version]
  46. Sui, S.; Wang, Y.; Kolewe, K.W.; Srajer, V.; Henning, R.; Schiffman, J.D.; Dimitrakopoulos, C.; Perry, S.L. Graphene-based microfluidics for serial crystallography. Lab Chip 2016, 16, 3082–3096. [Google Scholar] [CrossRef] [PubMed]
  47. Bhuvanesh, N.S.P.; Reibenspies, J.H. A novel approach to micro-sample X-ray powder diffraction using nylon loops. J. Appl. Crystallogr. 2003, 36, 1480–1481. [Google Scholar] [CrossRef]
  48. Thorne, R.E.; Stum, Z.; Kmetko, J.; O‘Neill, K.; Gillilan, R. Microfabricated mounts for high-throughput macromolecular cryocrystallography. J. Appl. Crystallogr. 2003, 36, 1455–1460. [Google Scholar] [CrossRef]
  49. Park, S.Y.; Ha, S.C.; Kim, Y.G. The Protein Crystallography Beamlines at the Pohang Light Source II. Biodesign 2017, 5, 30–34. [Google Scholar]
  50. Barty, A.; Kirian, R.A.; Maia, F.R.; Hantke, M.; Yoon, C.H.; White, T.A.; Chapman, H. Cheetah: Software for high-throughput reduction and analysis of serial femtosecond X-ray diffraction data. J. Appl. Crystallogr. 2014, 47, 1118–1131. [Google Scholar] [CrossRef] [PubMed] [Green Version]
  51. White, T.A.; Mariani, V.; Brehm, W.; Yefanov, O.; Barty, A.; Beyerlein, K.R.; Chervinskii, F.; Galli, L.; Gati, C.; Nakane, T.; et al. Recent developments in CrystFEL. J. Appl. Crystallogr. 2016, 49, 680–689. [Google Scholar] [CrossRef] [PubMed] [Green Version]
  52. Adams, P.D.; Afonine, P.V.; Bunkoczi, G.; Chen, V.B.; Davis, I.W.; Echols, N.; Headd, J.J.; Hung, L.W.; Kapral, G.J.; Grosse-Kunstleve, R.W.; et al. PHENIX: A comprehensive Python-based system for macromolecular structure solution. Acta Crystallogr. Sect. D Boil. Crystallogr. 2010, 66, 213–221. [Google Scholar] [CrossRef] [PubMed] [Green Version]
  53. Bae, J.E.; Kim, I.J.; Nam, K.H. Crystal structure of glucose isomerase in complex with xylitol inhibitor in one metal binding mode. Biochem. Biophys. Res. Commun. 2017, 493, 666–670. [Google Scholar] [CrossRef] [PubMed]
  54. Emsley, P.; Cowtan, K. Coot: Model-building tools for molecular graphics. Acta Crystallogr. D Biol. Crystallogr. 2004, 60, 2126–2132. [Google Scholar] [CrossRef] [Green Version]
  55. Williams, C.J.; Headd, J.J.; Moriarty, N.W.; Prisant, M.G.; Videau, L.L.; Deis, L.N.; Verma, V.; Keedy, D.A.; Hintze, B.J.; Chen, V.B.; et al. MolProbity: More and better reference data for improved all-atom structure validation. Protein Sci. 2018, 27, 293–315. [Google Scholar] [CrossRef]
  56. The PyMOL Molecular Graphics System, Version 1.8; Schrödinger, LLC. Available online: https://pymol.org/2/ (accessed on 9 September 2020).
  57. Bae, J.E.; Hwang, K.Y.; Nam, K.H. Structural analysis of substrate recognition by glucose isomerase in Mn2+ binding mode at M2 site in S. rubiginosus. Biochem. Biophys. Res. Commun. 2018, 503, 770–775. [Google Scholar] [CrossRef]
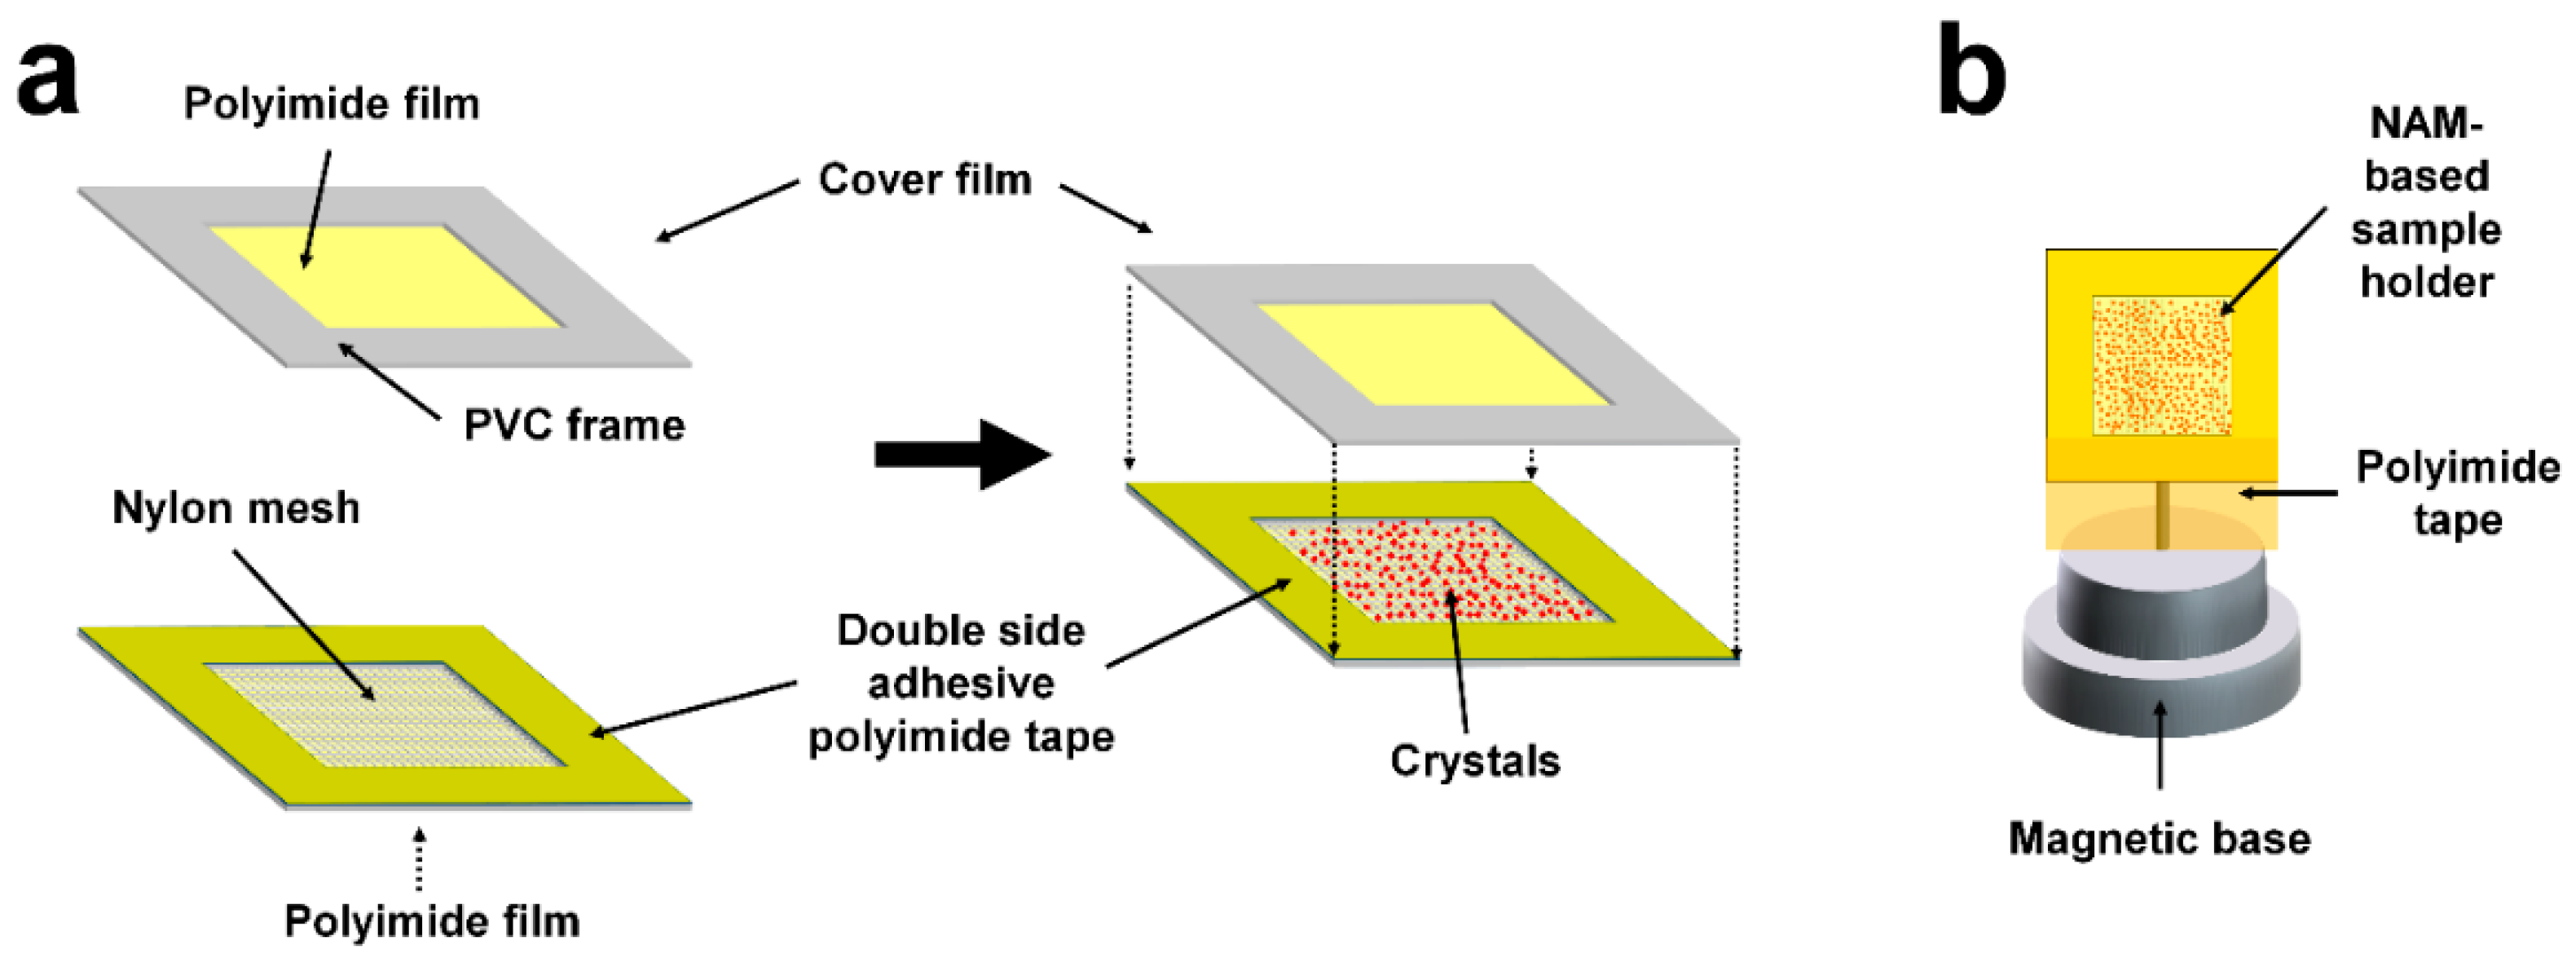
Figure 1. Preparation of the nylon mesh and enclosed film (NAM)-based sample holder for fixed-target serial synchrotron crystallography (FT-SSX). (a) Assembly of the sample holder; (b) the sample holder with magnetic base.
Crystals 10 00803 g001
Figure 2. Data collection from FT-SSX using two different approaches. (a) Raster-scanning data collection for 100 ms X-ray exposure with 0.011° oscillation. The total oscillation angle in the horizontal direction was 1°. (b) Raster-scanning data collection for 500 ms X-ray exposure with 0.222° oscillation. The total oscillation angle in the horizontal direction was 20°.The rotation direction of goniometer is indicated by red arrows. The raster scanning direction is shown in the right panel. The asterisk indicates the starting point of the raster scan.
Crystals 10 00803 g002
Figure 3. Typical diffraction patterns of (a) lysozyme (X-ray exposure time: 100 ms/oscillation: 0.011°, (b) glucose isomerase (100 ms/0.011°), (c) lysozyme (500 ms/0.222°), and (d) glucose isomerase (500 ms/0.222°) delivered to NAM-based sample holder. The circles indicate the predicted locations of Bragg peaks by CrystFEL. X-ray scattering from nylon-mesh and polyimide film is indicated by red and blue arrows, respectively. Image of nylon X-ray scattering when synchrotron X-ray penetrates (a,b) nylon intersection, (c) nylon, and (d) mesh pore.
Crystals 10 00803 g003
Figure 4. The 2mFo-DFc electron density maps (blue mesh, 1.2 σ) for whole structure of (a) lysozyme, and (b) glucose isomerase. Amino acids are shown as yellow sticks.
Crystals 10 00803 g004
Figure 5. Both 2mFo-DFc (blue, 1.2 σ) and mFo-DFc (green, 3.0 σ and red, −3.0 σ) electron density maps of disulfide bonds of lysozyme by (a) 100 ms X-ray exposure with 0.011° oscillation, and (b) 500 ms X-ray exposure with 0.222° oscillation.
Crystals 10 00803 g005
Figure 6. Both 2mFo-DFc (blue, 1.2 σ) and mFo-DFc (green, 3.0 σ and red, −3.0 σ) electron density maps of metal binding sites in glucose isomerase by (a) 100 ms X-ray exposure with 0.011° oscillation, and (b) 500 ms X-ray exposure with 0.222° oscillation.
Crystals 10 00803 g006
Figure 7. Photograph of NAM-based sample holder after FT-SSX data collection. No physical damage to nylon-mesh or polyimide film was seen due to synchrotron X-ray.
Crystals 10 00803 g007
Table 1. Data collection and refinement statistics.
Approach IApproach II
Data collectionLysozymeGILysozymeGI
Energy (ev)12,65912,65912,65912,659
Exposure time (ms)100100500500
Oscillation (°)0.010.010.220.22
Space groupP43212I222P43212I222
Cell dimension (Å)
a79.4594.4479.4594.55
b79.45100.2479.45100.26
c38.45130.5238.47103.61
Collected images56,70048,60081008100
Hits images41,91625,09976282576
Indexed images21,67013,72727371245
Indexed pattern29,73517,10034761565
Resolution (Å)80.0–1.50
(1.55–1.50)
72.46–1.70
(1.76–1.70)
80.0–1.60
(1.66–1.60)
72.46–2.00
(2.07–2.00)
Unique reflections20,320 (1969)54,250 (5361)16,824 (1627)33,589 (3282)
Completeness (%)100.00 (100.00)100.00 (100.00)100.00 (100.00)100.00 (100.00)
Redundancy427.0 (296.0)241.2 (167.2)63.5 (43.9)30.8 (21.5)
SNR7.94 (2.24)3.36 (1.66)4.31 (1.72)2.05 (1.52)
CC0.9877 (0.5840)0.9246 (0.6616)0.9515 (0.5680)0.7069 (0.5605)
CC*0.9969 (0.8587)0.9802 (0.8924)0.9875 (0.8512)0.9101 (0.8475)
Rsplit (%) a8.97 (50.97)24.09 (57.80)18.26 (66.37)46.47 (66.92)
Wilson B factor (Å2)17.713.718.715.9
Refinement
Resolution (Å)56.18–1.5072.01–1.7056.18–1.6072.05–2.00
Rwork/Rwork b16.66/18.5318.15/19.9418.87/21.5421.36/24.81
R.m.s. deviations
Bond length (Å)0.0140.0080.0140.07
Bond angle (°)1.7030.9592.3860.993
B factors (Å2)
Protein25.9518.3527.8718.32
Metals25.7815.6927.9212.89
Water34.3331.9235.3728.27
Ramachandran (%)
Favored99.2196.6199.2196.61
Allowed0.793.130.793.13
Outliers0.000.260.000.26
Values for the outer shell are given in parentheses. a Rsplit = ( 1 2 ) · h k l | I h k l e v e n I h k l o d d | 1 2 | I h k l e v e n I h k l o d d | , b Rwork = Σ||Fobs| − |Fcalc||/Σ|Fobs|, where Fobs and Fcalc are the observed and calculated structure-factor amplitudes respectively. Rfree was calculated as Rwork using a randomly selected subset (10%) of unique reflections not used for structure refinement.