Article

GDC Buffer Layer Synthesized by Reactive Magnetron Sputtering: Effect of Total Pressure and Thickness on SOFC Performances

1
FEMTO-ST, UMR 6174, CNRS, Université Bourgogne Franche-Comté, UTBM, Site de Montbéliard, 90010 Belfort, France
2
Fiaxell Sàrl, PSE A, Science Park, 1015 Lausanne, Switzerland
3
FC Lab Research (FR CNRS 3539), Rue Thierry Mieg, F-90010 Belfort, France
*
Author to whom correspondence should be addressed.
Crystals 2020, 10(9), 759; https://doi.org/10.3390/cryst10090759
Submission received: 31 July 2020 / Revised: 19 August 2020 / Accepted: 27 August 2020 / Published: 28 August 2020
(This article belongs to the Special Issue Solid Oxide Fuel Cells and Electrolyzers)

Abstract

:
Gadolinia-doped ceria (GDC) buffer layers were synthesized by reactive magnetron sputtering under different total pressures and different thickness. All as-deposited and after an annealing treatment during two hours under air at 1000 °C coating presents a face centered cubic (f.c.c) structure of ceria with dense and adhesive morphology. The cell synthesized under 0.1 Pa and 0.57 µm present the best performances. (open-circuit voltage (OCV): 1.133 eV and power density: 1650 mW·cm−2 @ 800 mA·cm−2 at 790 °C).

1. Introduction

Nowadays, researchers working on the SOFC technology agree that it is necessary to decrease the operating temperature in the range 650–750 °C of IT–SOFC technology [1,2,3], which currently is around 850–900 °C for electrolyte-supported cells used by the three main operators—Bloomenergy, Hexis and Sunfire. At this intermediate temperature (around 700 °C), the reactivity—and the cost of the cell components—decreases. Nevertheless, some interactions between the conventional electrolyte material (YSZ) and the cathode material (lanthanum-based) still exist. It is necessary to add a ceria buffer layer to avoid the possible formation of an insulating pyrochlore structure La2Zr2O7 layer at the electrolyte–cathode interface [4,5]. In the ceria family, the best material for ionic conductivity is samaria-doped ceria [6]. However, gadolinia-doped ceria is the most employed from the point of view of costs and availability of gadolinium compared to samarium [7]. This buffer layer avoids the reactivity between electrolyte and cathode and presents good anionic conductivity. Therefore, in order to be suitable for the surface treatment process, it must be dense, thin and adherent on electrolyte [8,9,10]. As the sintering of GDC requires disadvantageously high temperatures [11,12,13,14] or the addition of sintering aids, magnetron sputtering allows working at lower temperatures and to have a precise control of the layer thickness. This avoids the formation of a solid solution of YSZ and GDC that occurs above 1300 °C, which is less conductive than YSZ and [15,16,17]. This technique has been demonstrated successful in hindering strontium diffusion during cell testing, with cathode-deposited-by-electrostatic-spray deposition [8].
In this study, we present some recent results obtained on GDC coatings deposited by magnetron sputtering from metallic targets in argon–oxygen reactive gas mixtures with different total pressures and different thicknesses. First, the experimental device is depicted, then the coatings chemical, microstructural and structural characterization (scanning electron microscopy (SEM), X-ray diffraction (XRD) in relation to magnetron sputtering deposition parameters are explained. Second, a complete cell test with a diameter of 25 mm: Ni–YSZ/YSZ/GDC/LSCF (Yttria stabilized zirconia (YSZ), lanthanum strontium cobalt ferrite (LSCF)) is performed using the Fiaxell open flanges test bench.

2. Experimental Details

2.1. Elaboration of GDC Buffer Layer

The experimental device was a 100-L Alcatel SCM 650 sputtering chamber pumped down via a system combining XDS35i dry pump and a 5401CP turbo-molecular pump. The sputtering chamber was equipped with three 200-mm-diameter magnetron targets and with a 620-mm-diameter rotating substrate holder parallel to the targets at a distance of about 110 mm. The distance between the target axis and that of the substrate holder was 170 mm. The Ce-10 at% Gd target was supplied via a pulsed-DC advanced-energy dual generator allowing the control of the discharge current, power or voltage. The deposition stage was monitored using a closed loop control plasma emission monitoring system using optical emission spectroscopy. In the present study, the discharge current was fixed at 2.5 A; the bias power applied on the porte substrate holder was 80 W and the total pressure was around 0.1 or 0.5 Pa for 10 or 50 sccm argon flow rate. For more details concerning the GDC buffer layer see our previous work focus on the effect of bias power [18].

2.2. Structural and Morphologic Characterization

Analysis of the structural features of the coatings were performed in Bragg–Brentano configuration X-ray diffraction using a Bruker D8 focus diffractometer (Co Kα1+α2 radiations) equipped with the LynxEye linear detector. Diffractograms were collected under air flow during 10 min in the [20°–80°] scattering angle range by steps of 0.019°. Coating thickness was also determined ex situ by using the step method with an Altysurf profilometer produced by Altimet, which allows an accuracy of around 20 nm. Before each measurement, the calibration of the experimental device was realized with a reference sample number 787,569 accredited by CETIM organization. These measurements were systematically confirmed by using SEM observation on the cross section. The coatings morphology was characterized SEM using a JEOL JSM 7800 F, equipped with energy dispersive spectroscopy (EDS) for chemical measurements.

2.3. Fuel Cell Performances

Before the cell introduction into the open flange setup, a cathode was deposited on the GDC buffer layer using the screen-printing method. It was composed of 2 layers: the first one—the so-called composite layer—was made by 60% of LSCF and 40% of 20GDC. The second layer—the so-called current collection layer (CCL)—was composed only by LSCF. Before printing the CCL, the composite layer was dried at 60 °C for 20 min (the same procedure was repeated after the deposition of the CCL). Finally, the cell was sintered in air at 1000 °C for 2 h. The geometric characteristics of the cathode was a thickness of 18 µm, a diameter of 14 mm which gives an active surface of 1.54 cm2. A complete current–voltage (I–V) curve was carried out in the Open Flanges Set-Up developed and commercialized by Fiaxell Sàrl. This test rig allows a simple and rapid mounting of different size cells, ranging from 20 to 80 mm in diameter and gives highly reproducible results. The distinctiveness of the Open Flanges Set-Up was that no sealing was required: the SOFC cell was simply squeezed between two alumina felts; a nickel foam on the anode side and a grid on the cathode side provided current collection. A scheme of the experimental setup is given in a previous study [18], one can also consult the Fiaxell website (https://fiaxell.com). A fuel flow rate between 100 to 200 (mL.min−1), depending on the cell size, was enough to ensure an OCV close to the theoretical value as shown for two different cells. Normal operating conditions were cell temperature = 790 °C, hydrogen flow rate = 105 mL·min−1 (purity ≥ 99.5%), air flow rate= 400 mL·min−1.

3. Results and Discussion

In a previous study [18], we highlighted that the synthesis of the buffer layer of GDC of 1-µm thickness, under a total pressure of 0.5 Pa and the application of a polarization of the sample holder allows to improve the OCV of the fuel cell. As shown in Table 1, a polarization voltage of 80 W provided the best OCV. This evolution shows that the film grew increasingly dense, which was in agreement with the work of Thornthon and Hoffman [19] and A. Anders [20] who showed that the increase in the energy of the incident species allows a densification of the films. It was possible to increase the energy of the incident species by reducing the working pressure in the enclosure. Indeed, for a lower working pressure the collisions between species present in the plasma were less important, and therefore the energy was more important.

3.1. Influence of the Total Pressure

In this part, the flow of argon was modified from 50 sccm to 10 sccm which made it possible to reduce the working pressure from 0.5 Pa to 0.1 Pa. Below 0.1 Pa, the plasma discharge was not stable and it was not possible to realize a 1-μm-thick film. As shown in Figure 1a, the two as-deposited films crystallized under face-centered cubic ceria structure, but the film produced under 0.1 Pa had a preferential orientation according to the diffraction plane (111) and the plane (220) did not diffract. Annealing treatment at 1000 °C under static air for two hours was carried out, such a treatment was carried out because it was the temperature imposed for obtaining the cathode to made our complete cell and this made it possible to stabilize the GDC layer. Figure 1b reveals that the crystallization of the films increased with annealing treatment with the increase in the intensity of the diffraction peaks and the refinement of the peaks, and the diffraction peak (220) appeared on the film produced under the lowest pressure.
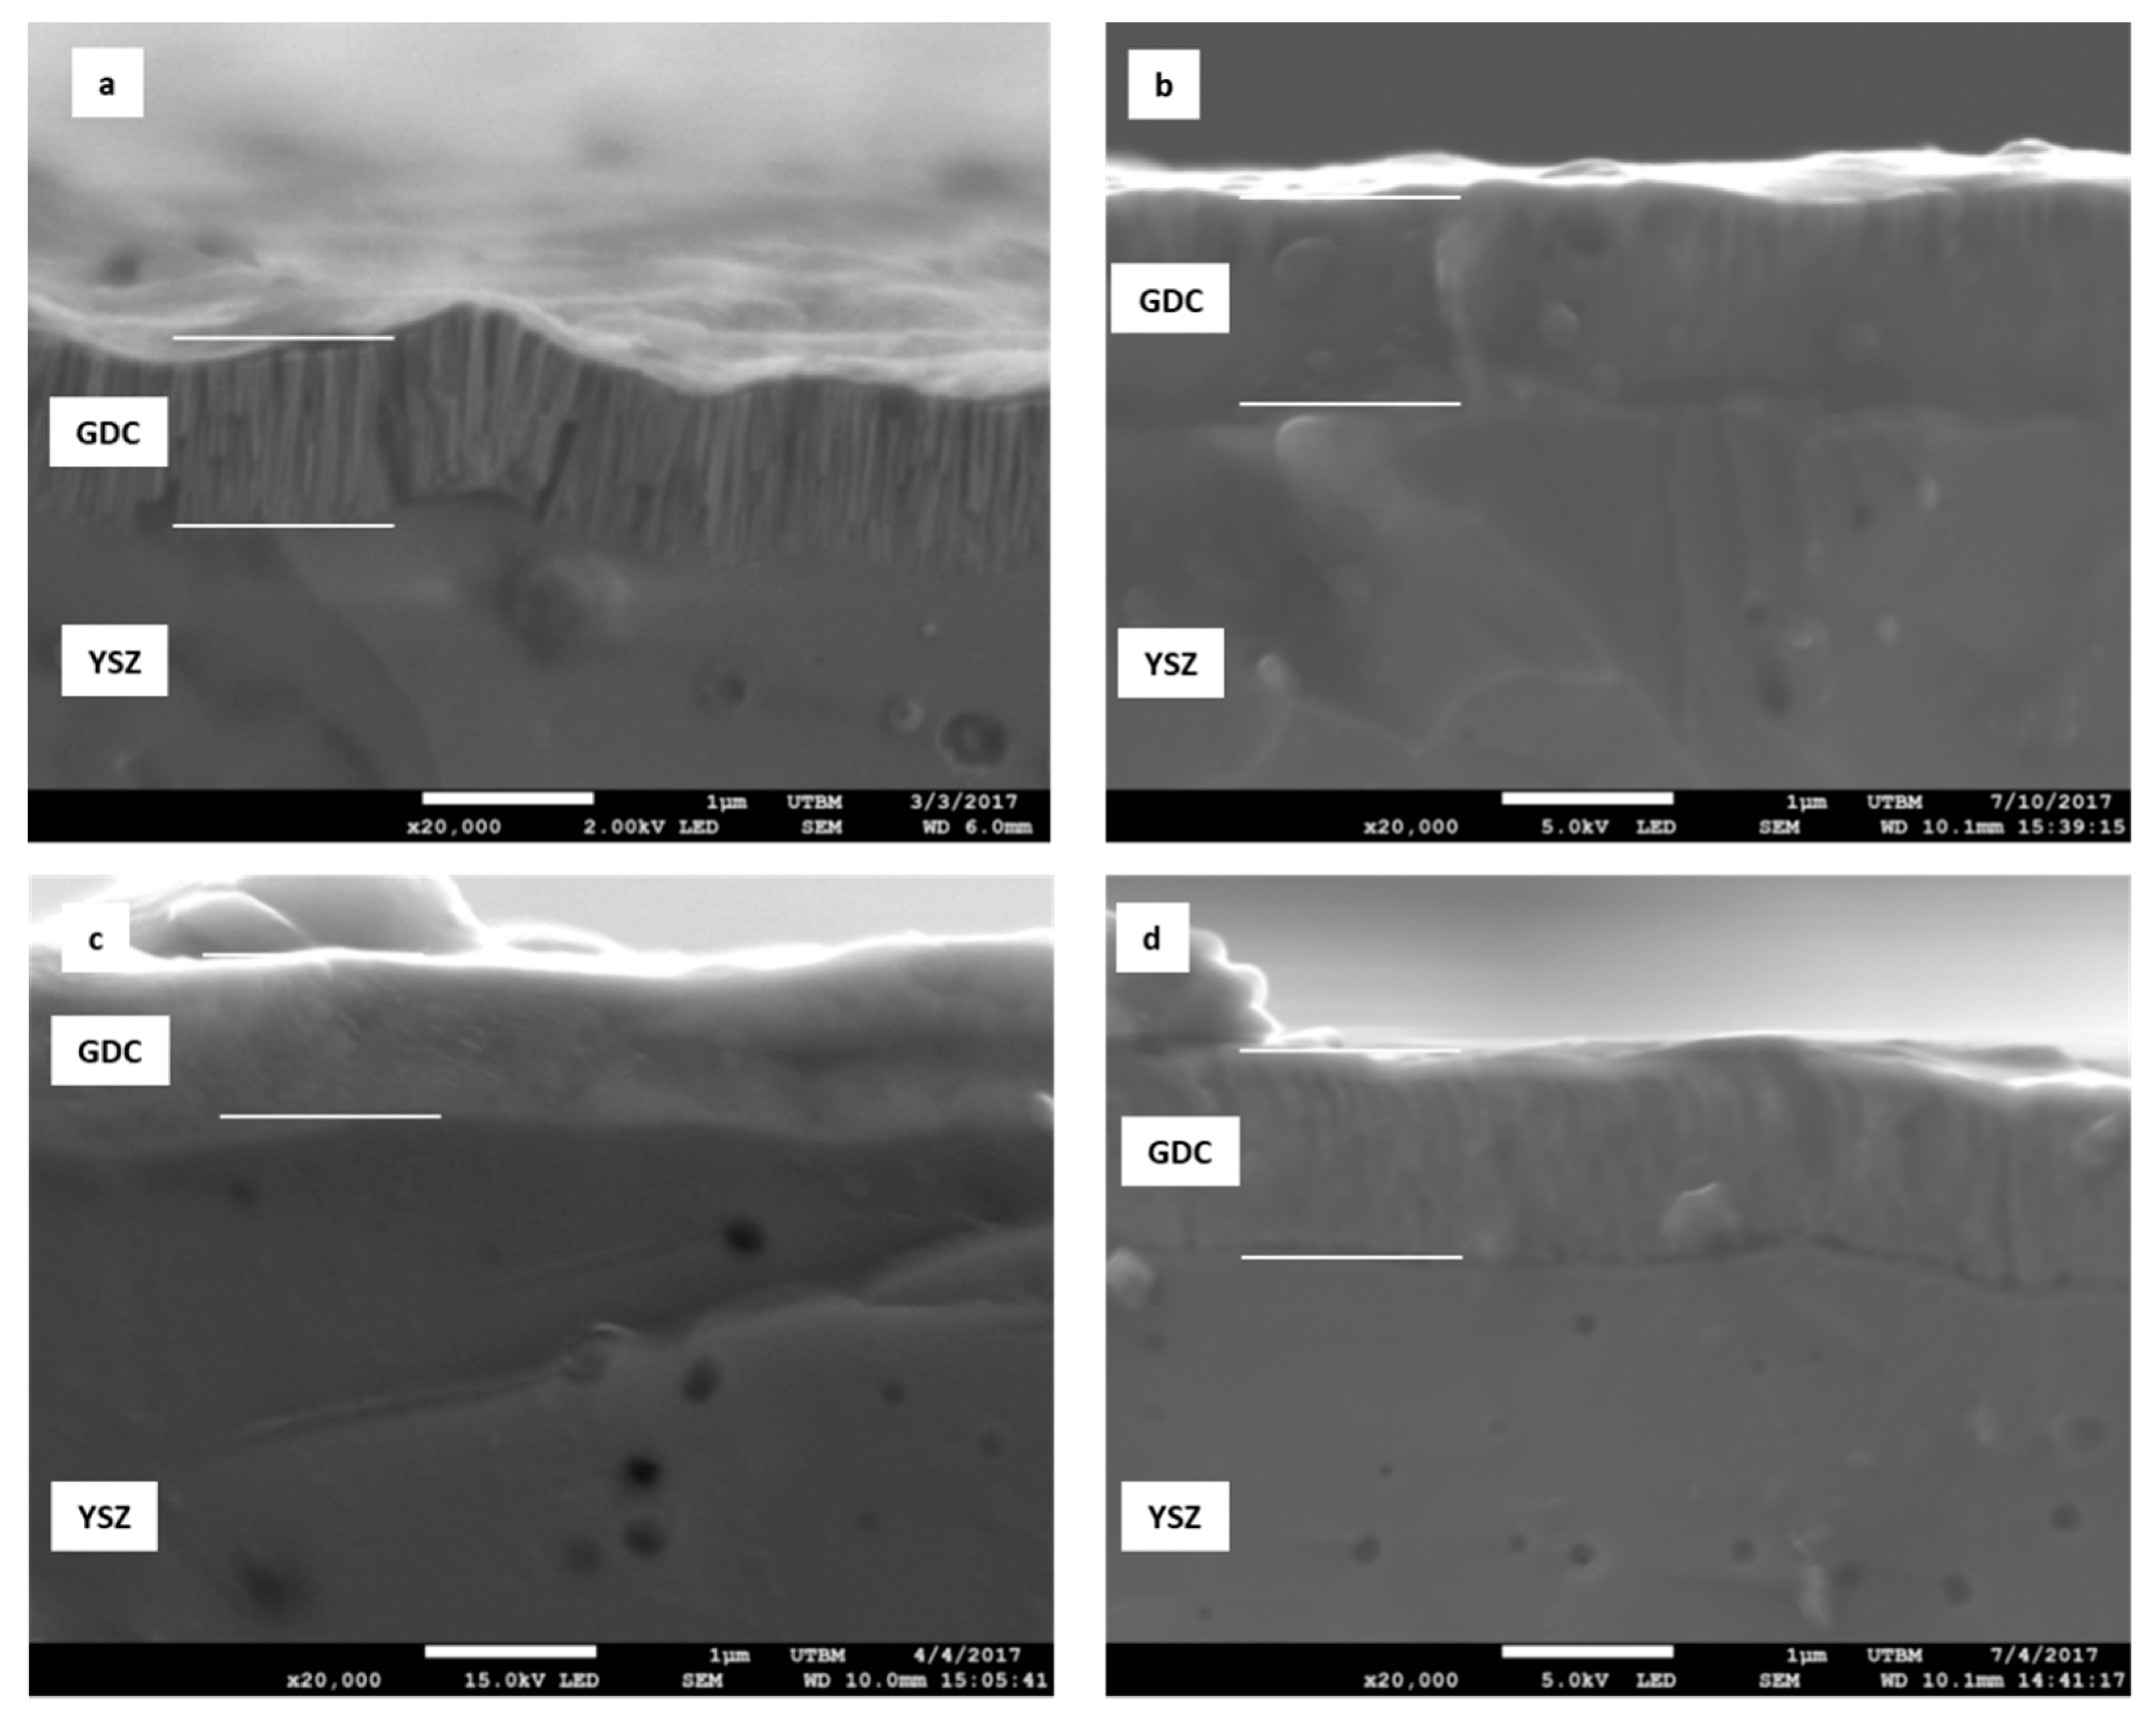
SEM observation of the brittle cross section reveals that the films were adherent to the YSZ electrolyte (Figure 2). Figure 2a shows that the as-deposited film processed at 0.5 Pa had a columnar structure typical of a PVD film in contrast to the film processed at 0.1 Pa which had a dense structure (Figure 2b). This evolution of morphology as a function of the working pressure in the chamber was in agreement with the work of Thornthon and Hoffman [19] and A. Anders [20] on the densification of coatings with the increase in the energy of the species in the plasma. The annealing heat treatment of the films (Figure 2c,d) increased the densification of the coatings without altering their adhesion. The films were made under reactive conditions and with the closed-loop control system; therefore, the raw films had an oxygen deficit which was made up during the heat treatment.
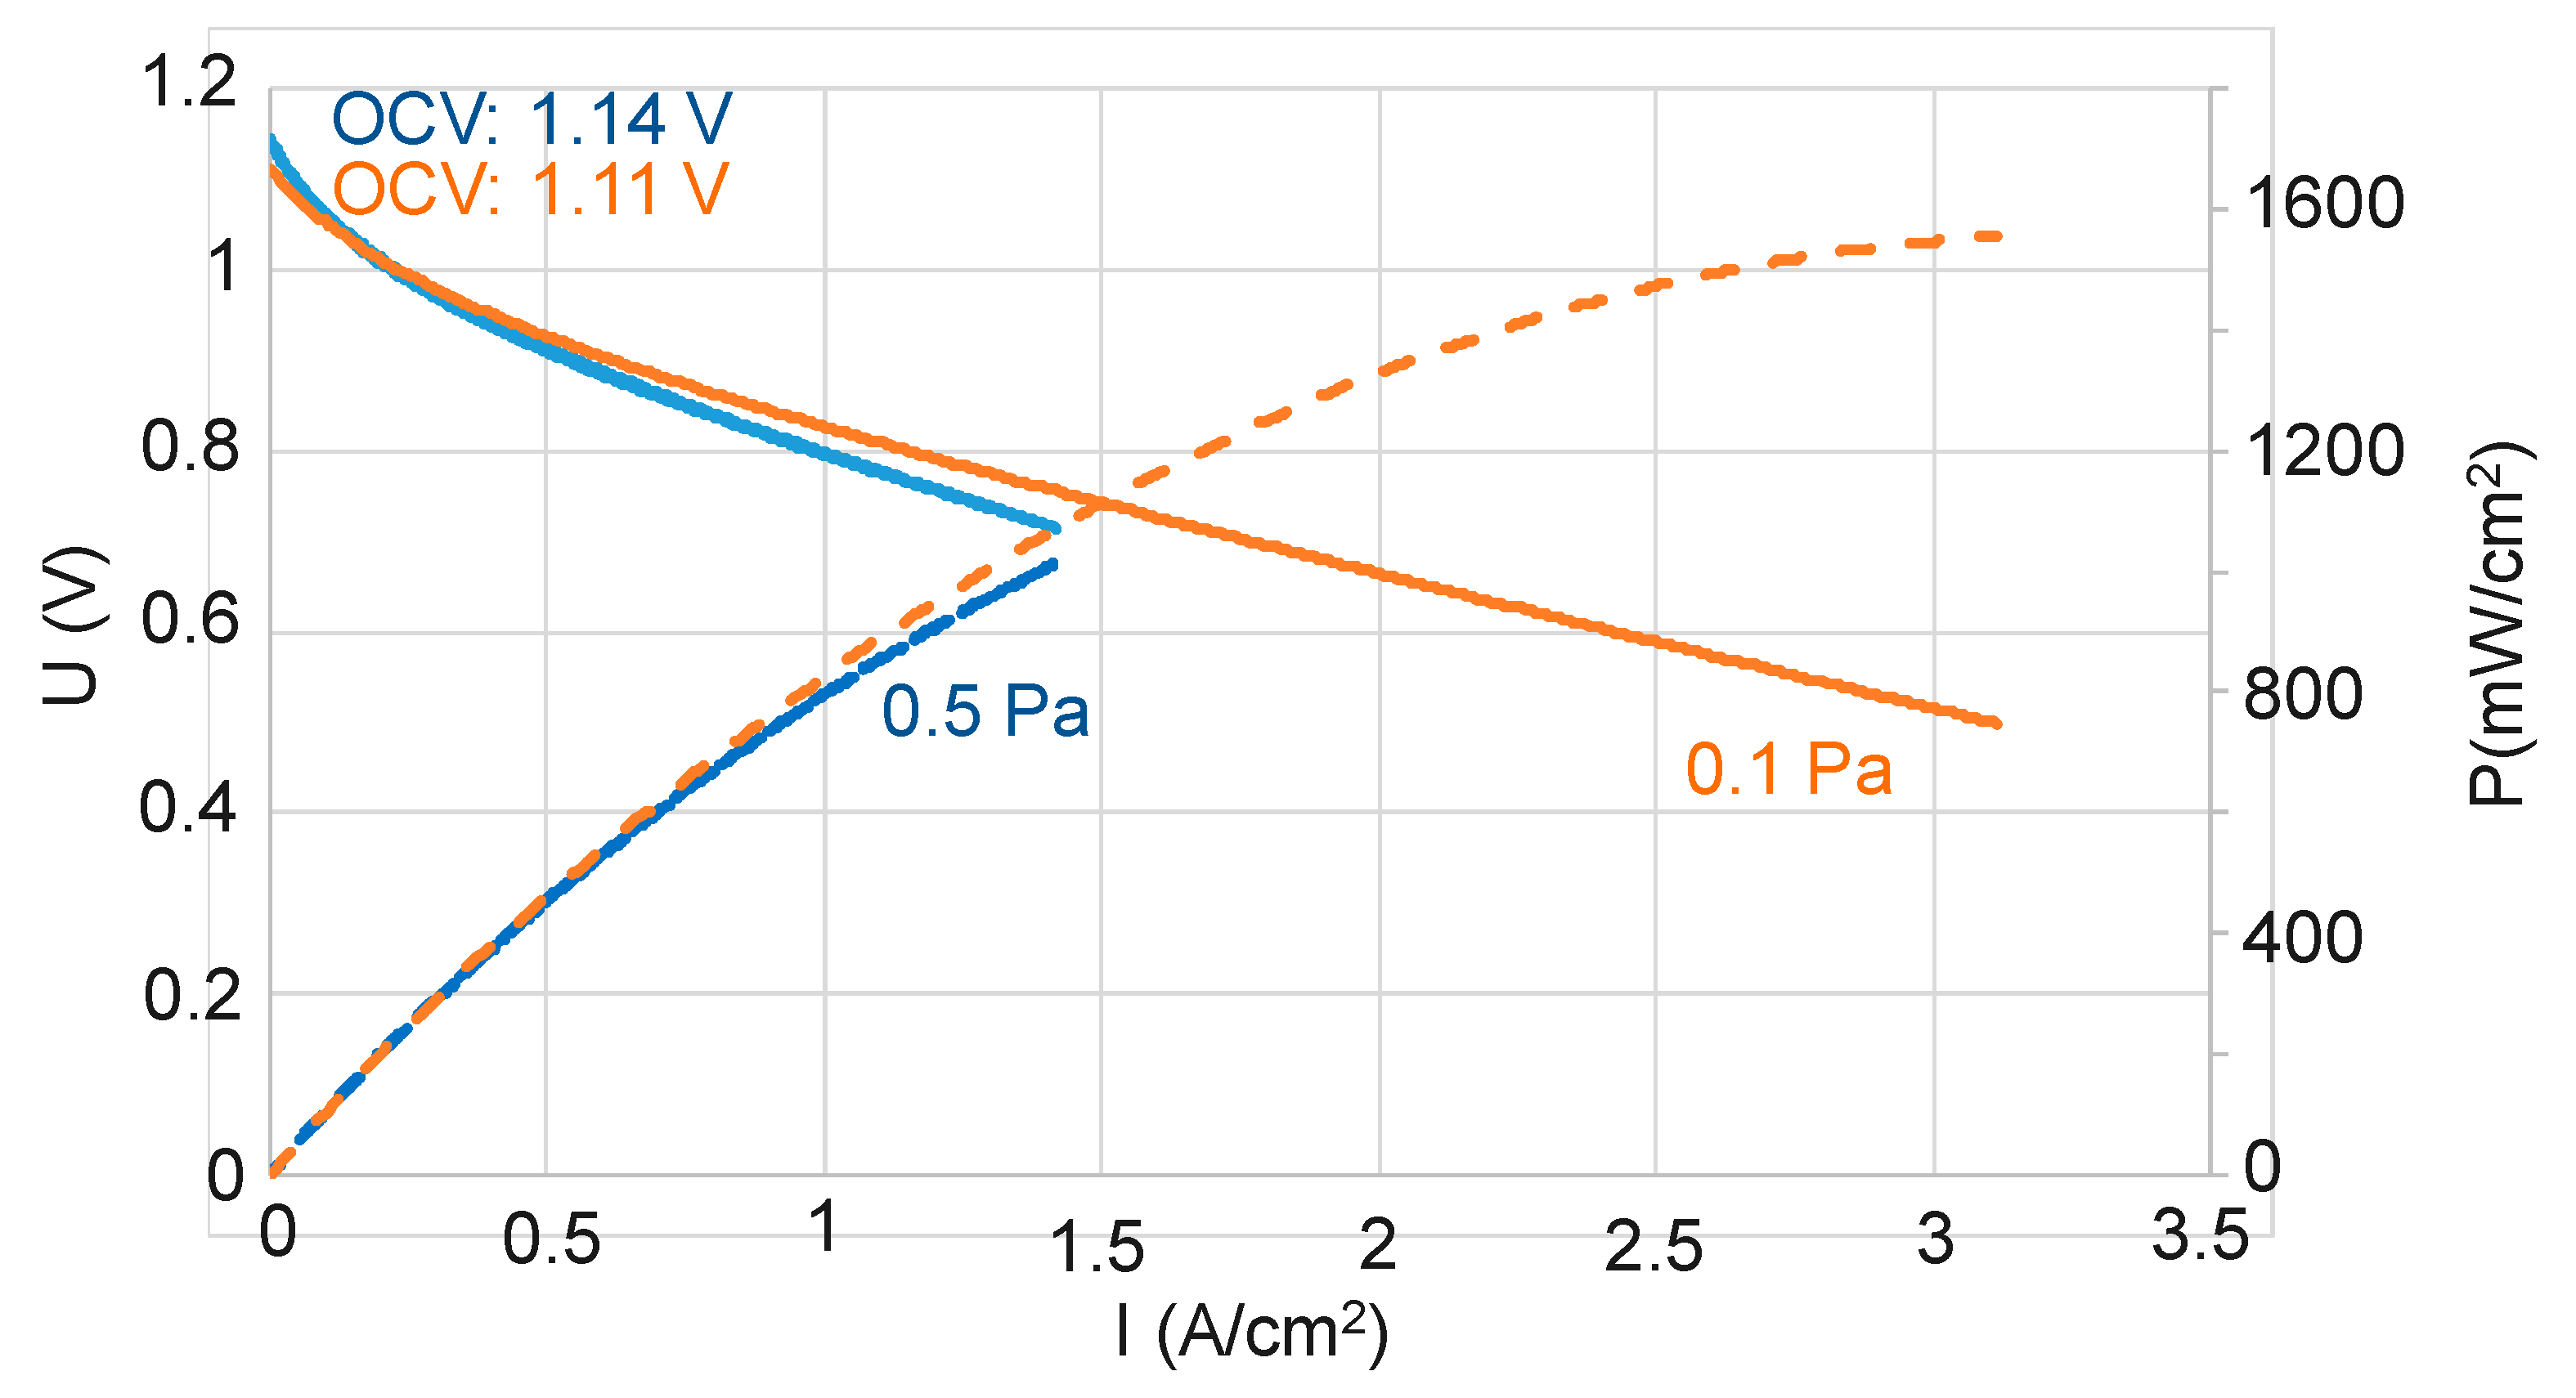
Figure 3 shows the electrical measurements carried out in a complete cell. The OCV for the two configurations is relatively close, 1.14 and 1.11 V, respectively for GDC buffer layer synthesized under total pressure 0.5 and 0.1 Pa. However, it appears that the power density is 1000 and 1180 mW·cm−2 for 0.5 and 0.1 Pa at a voltage of 0.72 V, which corresponds to an increase of 18%.
To conclude this part, under the operating conditions used, it was more favorable to develop the GDC barrier layer under a pressure of 0.1 Pa to obtain the most interesting fuel cell performance. One of the parameters that influence the performance of a cell was the resistance of the electrolyte. This depends on the nature of the materials, but also on its thickness [8], therefore the next point of this study were to reduce the thickness of the GDC layer in order to observe its effect on the performance of the cell.

3.2. Effect of GDC Layer Thickness

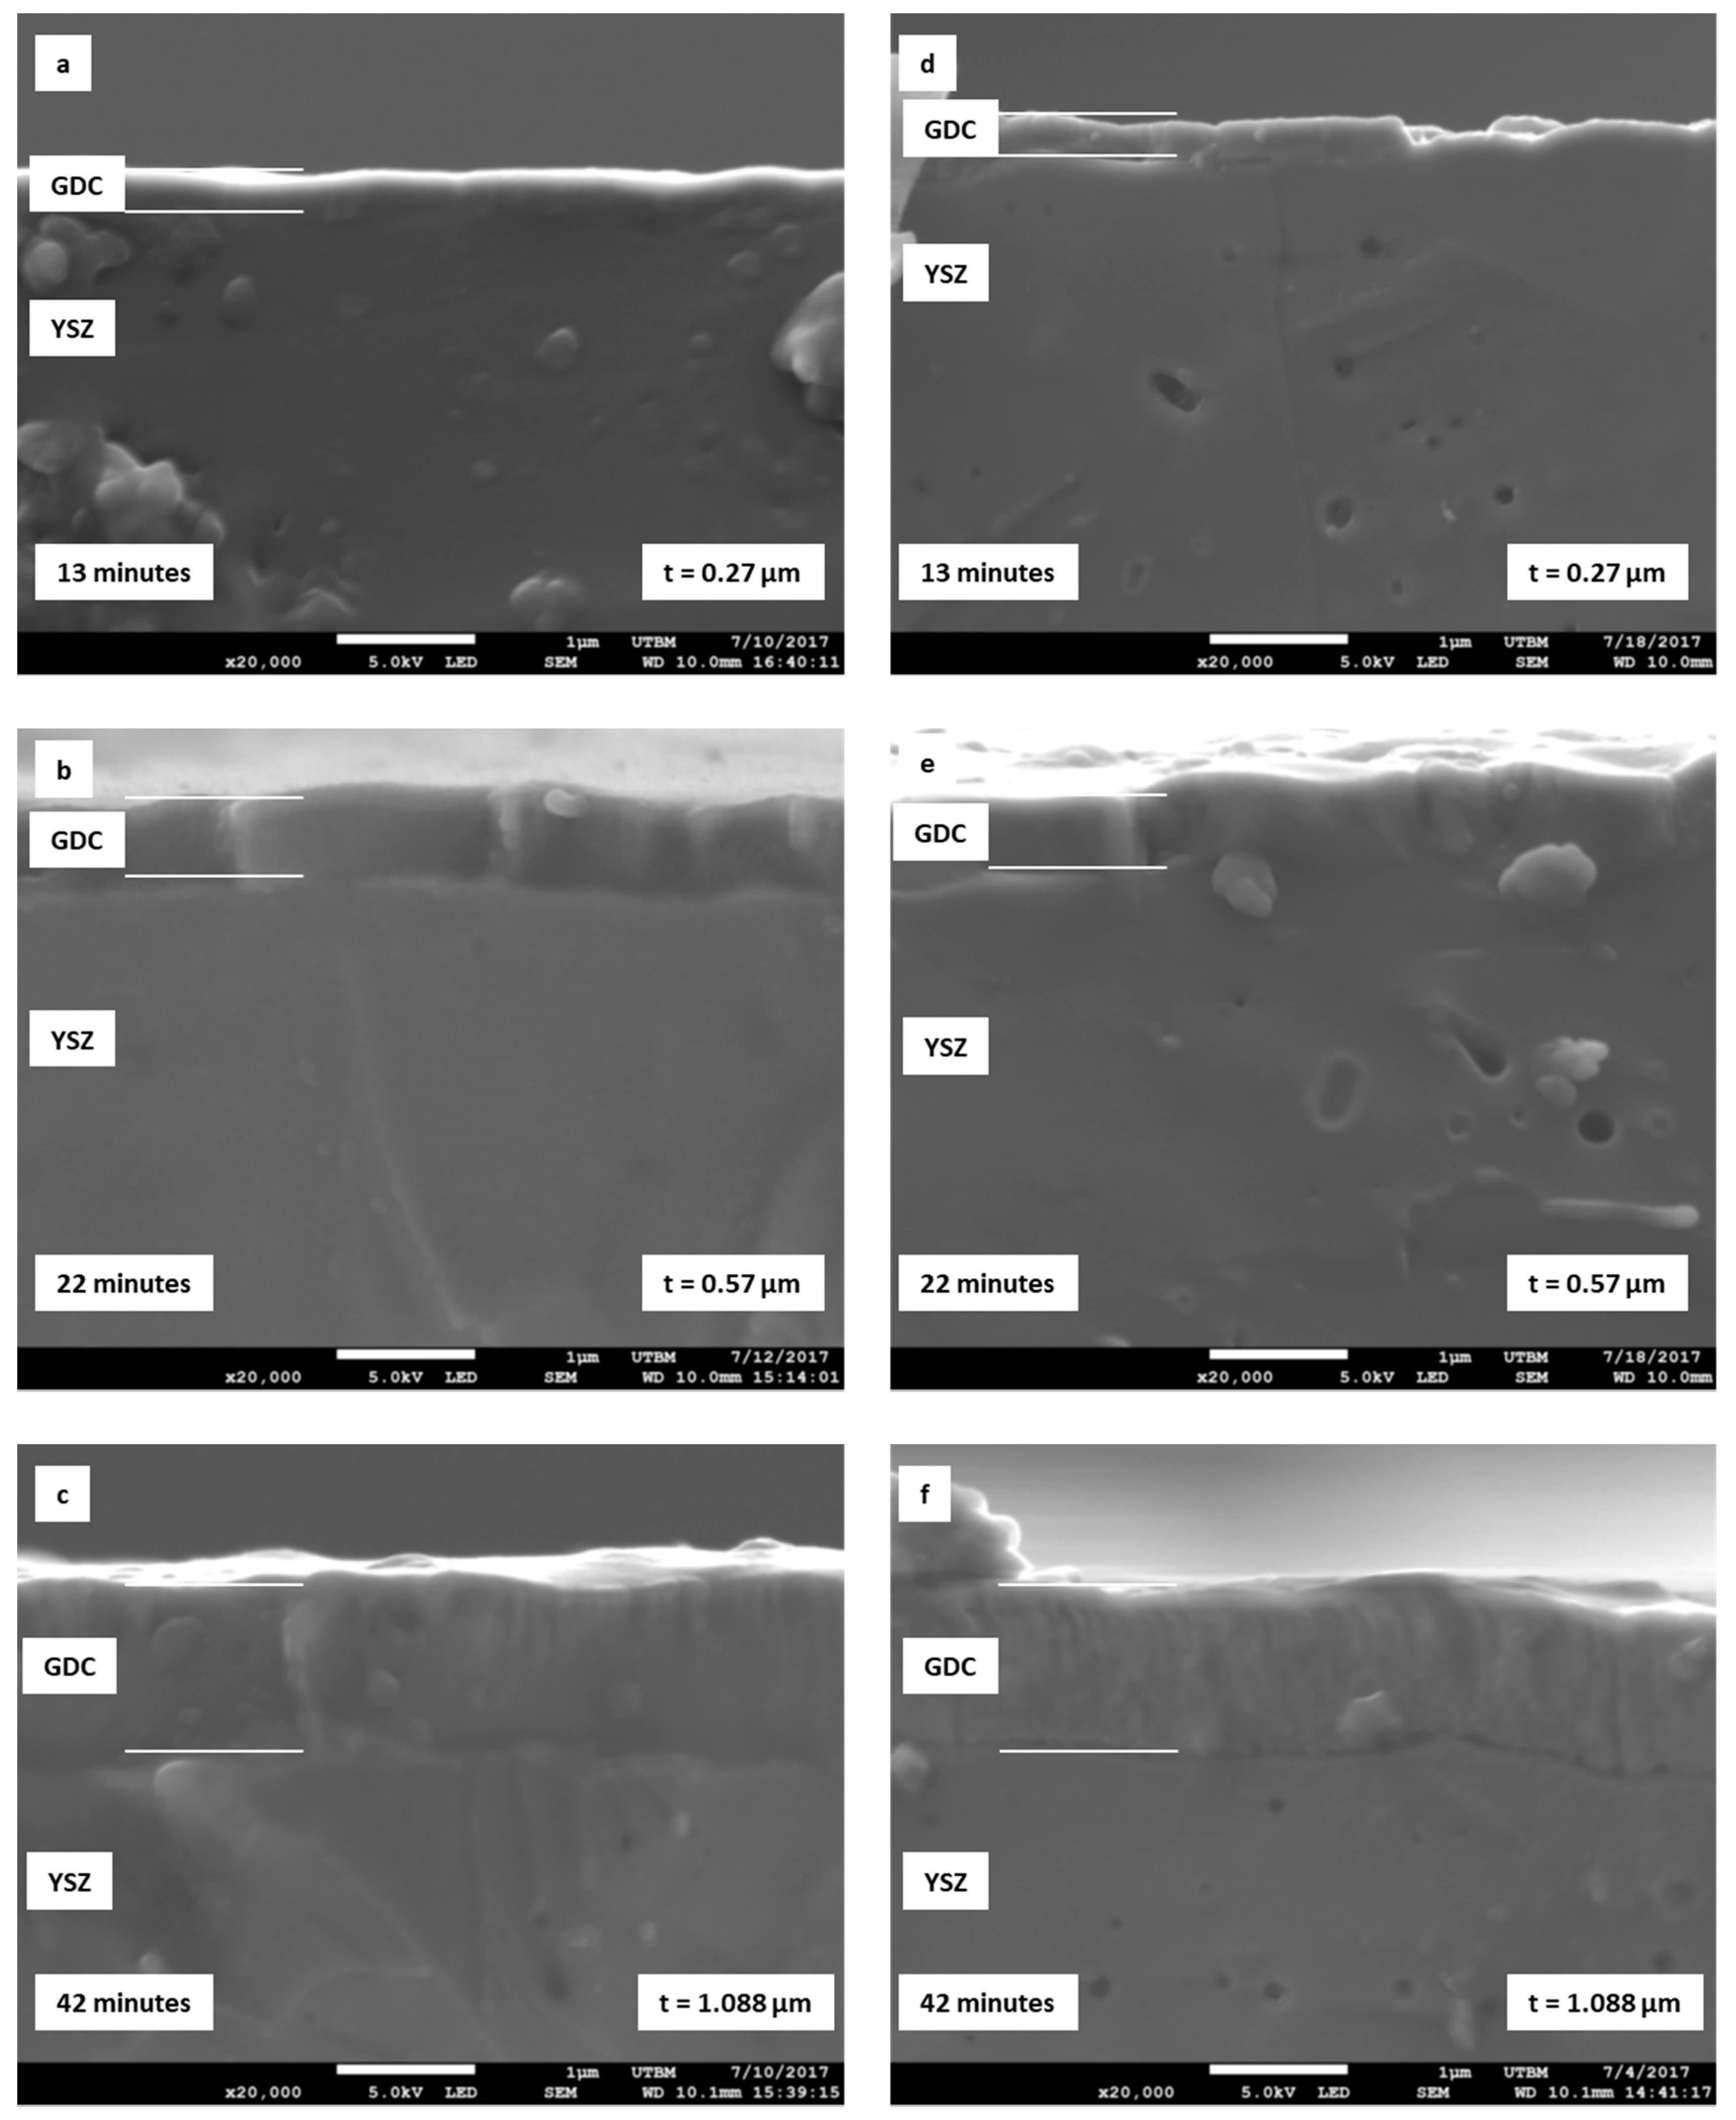
The elaboration conditions were those defined above, the deposition time was adjusted to obtain a thickness of about 0.2, 0.5 and 1 µm. The crystalline structure of the films was the face-centered cubic structure of ceria which was identical to part 3.1. SEM observation of the brittle-fracture cross section (Figure 4) showed that all films were adherent, dense as deposited (Figure 4a–c), and after the annealing heat treatment (Figure 4d–f) stabilized the GDC layer. The thicknesses were 0.27, 0.57 and 1.088 µm for deposition times of 13, 22 and 42 min, respectively
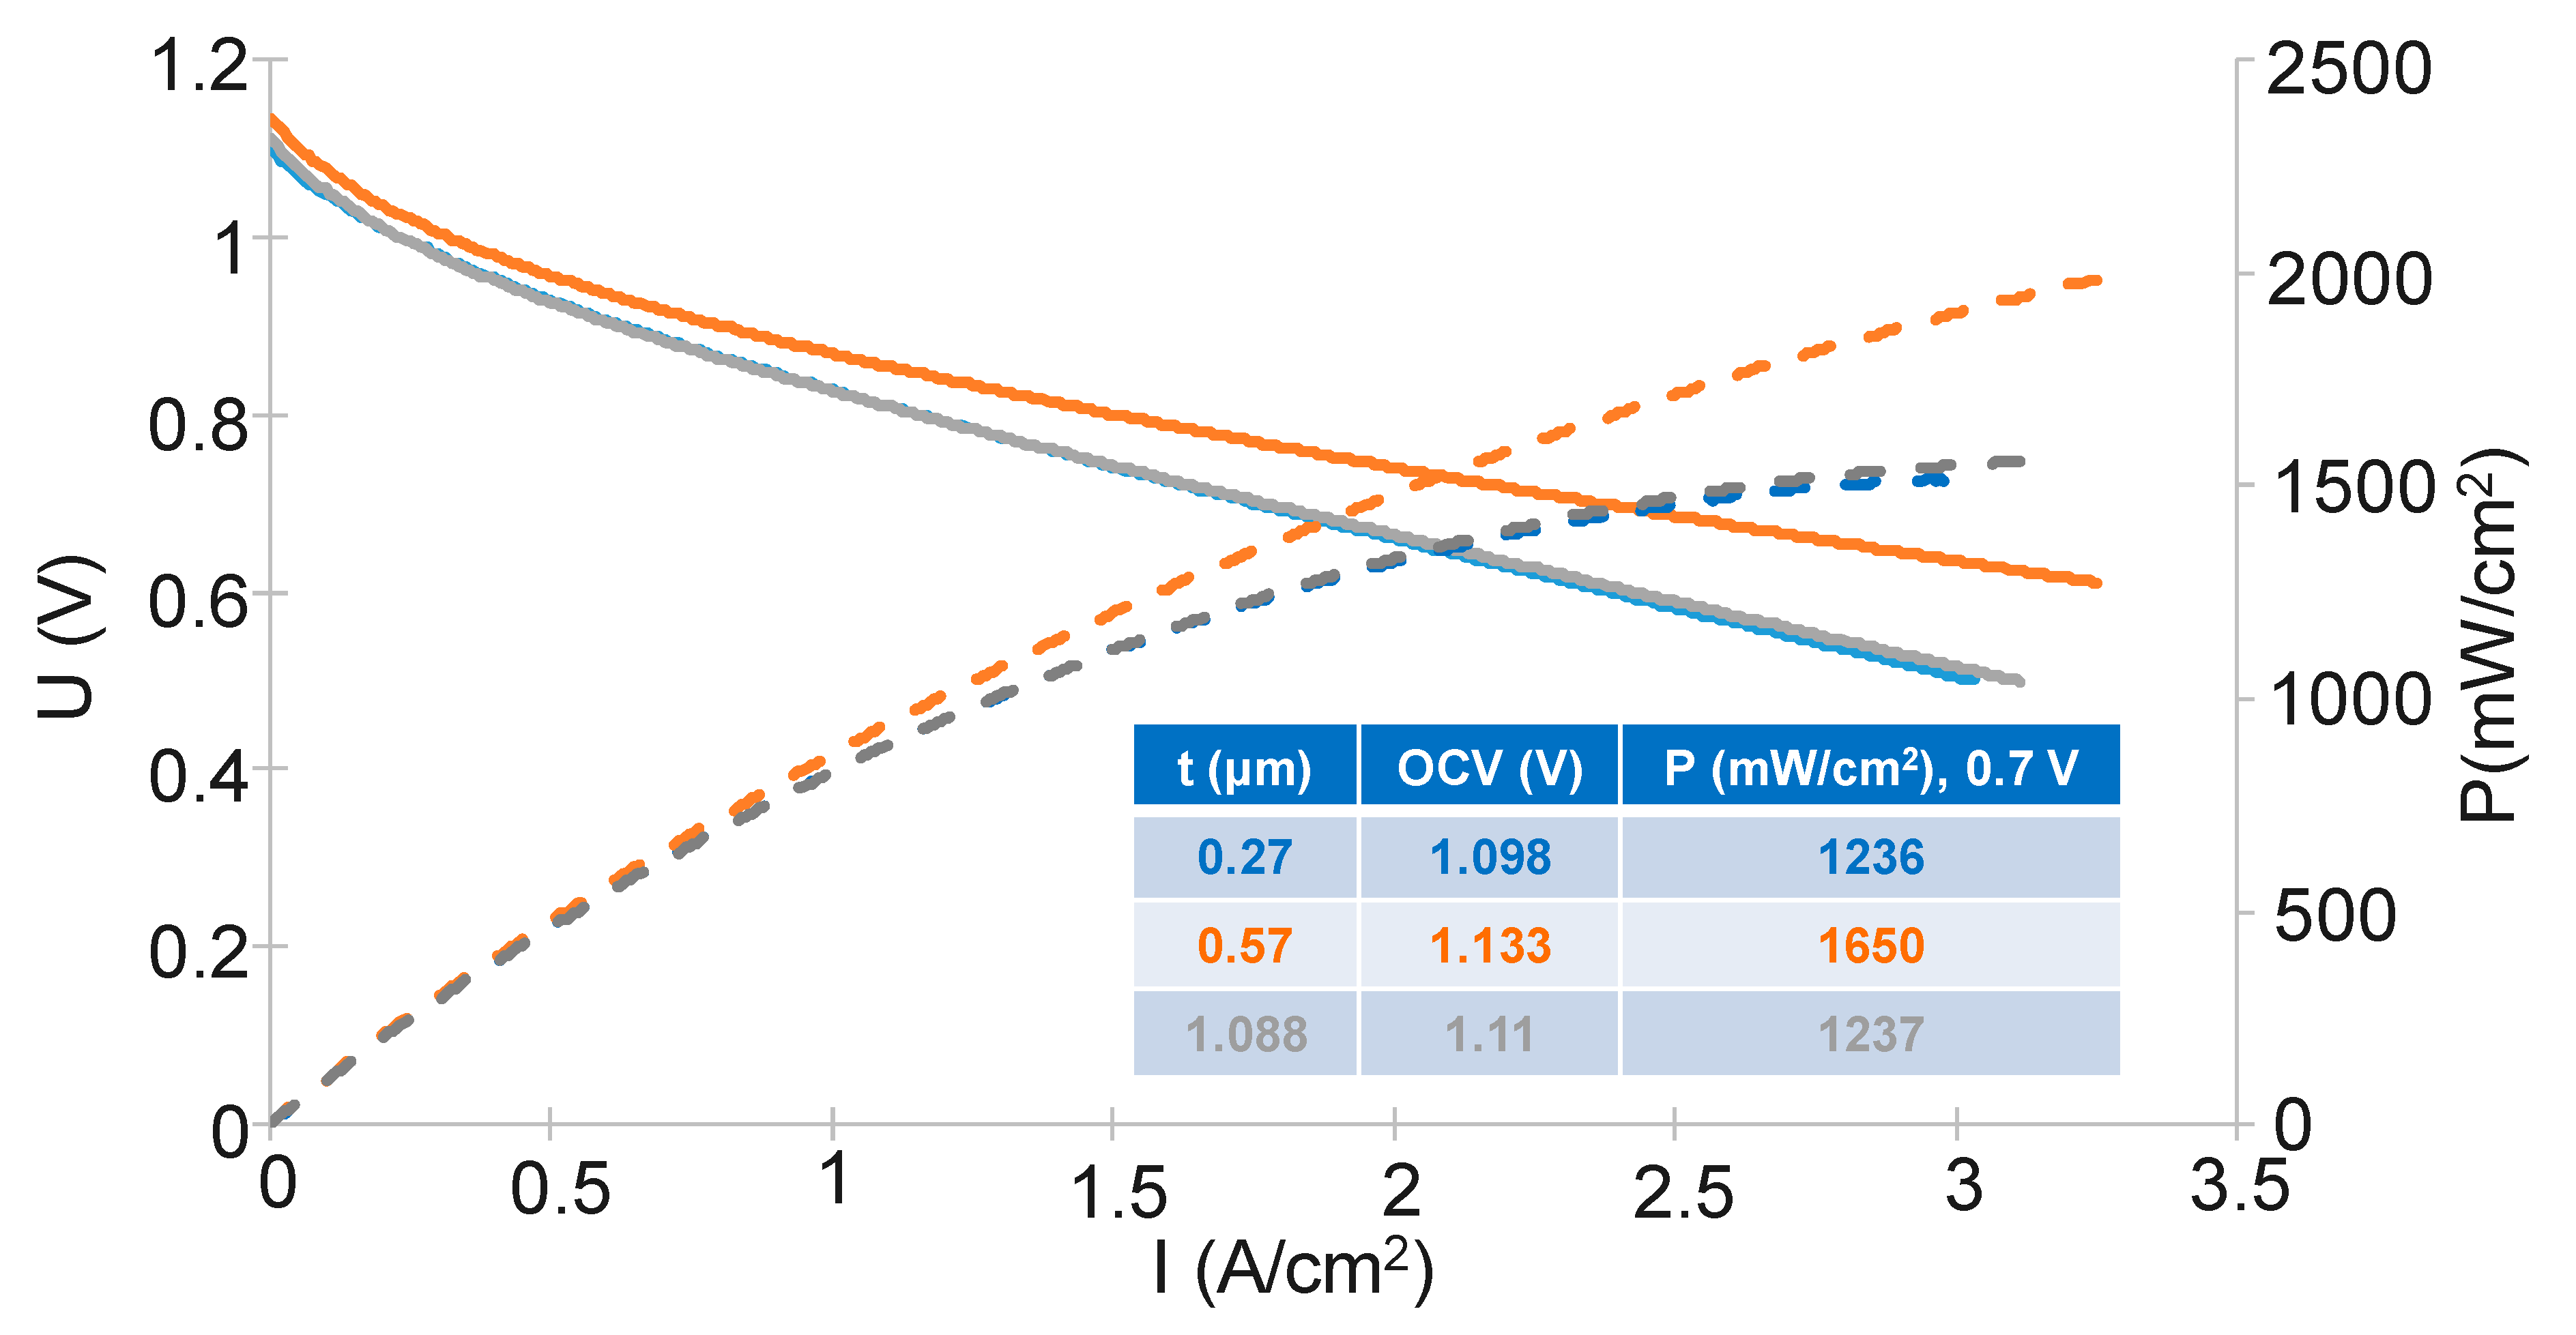
The OCV obtained from the electrical measurements (Figure 5) on the complete cells were 1.098 to 1.13 V, which means that the YSZ electrolyte and the GDC buffer layer were dense, gas tight. Density and tightness were two characteristics necessary for their used as an ionic conductor in a fuel cell [8]. The cell with the 0.57-µm-thick GDC film reveals the maximum power density of 1650 mW·cm−2. According to our measurements, the best results were obtained for GDC thickness of 0.57 µm and the thicker and thinner layer reveals performance decreased by 30%. When thicknesses were too thin, electric field constriction lines appeared, and the first PVD film growth gauges were often micro-stressed [19], which made it difficult for the species to move in the coating, resulting in a drop in performance. Moreover, in a previous study [9] conducted over longer holding times, we showed that a barrier-layer thickness of 0.5 µm was necessary to overcome the reactivity between the electrolyte and the cathode.

4. Conclusions

This study completes a previous work [18] on the realization of GDC barrier layers by reactive magnetron sputtering using closed-loop control in order to obtain an acceptable synthesis rate for the transition to SOFC production. In this study, two parameters were studied, namely, the working pressure within the enclosure and the thickness of the GDC layer in order to increase the performance of the complete cell. In all cases, the coatings showed a cubic structure with a centered face of the raw ceramics or after an annealing treatment under static air for 2 h at 1000 °C to stabilize the layer. Films which were processed under a pressure of 0.1 Pa reveal a preferential orientation. The SEM observation of the layers showed the quality of the interface and a good compactness after the heat treatment. The electrical measurements showed that the film processed under 0.1 Pa, 80 W polarization on the substrate holder and a thickness of 0.57 µm gives the best performance with an OCV and a power density of 1.133 V and 1650 mW·cm−2, respectively. It would be good to continue this study in order to define optimal thickness under synthesis conditions, and to carry out long term tests with the best cell of this study in order to study its behavior in time under real conditions of high temperature.

Author Contributions

Conceptualization, P.C., R.I. and P.B.; methodology, P.C. and A.B.; validation, R.I. and P.B.; formal analysis, L.B. and N.C.; investigation, L.B., N.C. and A.B.; resources, L.B., N.C. and A.B.; data curation, L.B. and N.C.; writing—original draft preparation, L.B. and P.B.; writing—review and editing, P.C. and P.B.; visualization, R.I. and P.B.; supervision, R.I. and P.B.; project administration, P.C., R.I. and P.B.; funding acquisition, R.I. and P.B. All authors have read and agreed to the published version of the manuscript.

Funding

This study was carried out within the framework of the European territorial cooperation program INTERREG V A France–Switzerland. The ORCEPAC project has benefitted from financial support from the EU through the European Regional Development Fund (ERDF—€139,176) and the Swiss Confederation’s contribution of CHF 134,173. The authors are indebted to the Pays de Montbéliard Agglomération (PMA) for its financial support.

Acknowledgments

This work was done within the FEMTO-ST SURFACE platform.

Conflicts of Interest

The authors declare no conflict of interest.

References

  1. Huijsmans, J.P.P.; Van Berkel, F.P.F.; Christie, G.M. Intermediate temperature SOFC—A promise for the 21st century. J. Power Sources 1998, 71, 107–110. [Google Scholar] [CrossRef]
  2. Mc Evoy, A.J. Thin SOFC electrolytes and their interfaces—A near-term research strategy. Solid State Ion. 2000, 132, 159–165. [Google Scholar] [CrossRef]
  3. Boudghene Stambouli, A.; Traversa, E. Solid oxide fuel cells (SOFCs): A review of an environmentally clean and efficient source of energy. Renew. Sustain. Energy Rev. 2002, 6, 433–455. [Google Scholar] [CrossRef]
  4. Harboe, S.; Sohn, Y.J.; Guillon, O.; Menzler, N.H. Investigation of LSM-8YSZ cathode within an all ceramic SOFC. Part I: Chemical interactions. J. Eur. Ceram. Soc. 2020, 40, 3608–3617. [Google Scholar] [CrossRef]
  5. Wang, W.; Hu, S.; Han, Y.; Pan, X.; Xu, Q.; Zhu, J. Interaction of Zr with oxidized and partially reduced ceria thin films. Surf. Sci. 2016, 653, 205–210. [Google Scholar] [CrossRef]
  6. Eguchi, K.; Setoguchi, T.; Inoue, T.; Arai, H. Electrical properties of ceria-based oxides and their application to solid oxide fuel cells. Solid State Ion. 1992, 52, 165–172. [Google Scholar] [CrossRef]
  7. Choi, J.; Park, D.; Seon, B.; Bae, H. Low-temperature preparation of dense (Gd,Ce)O2−δ–Gd2O3 composite buffer layer by aerosol deposition for YSZ electrolyte-based SOFC. Int. J. Hydrog. Energy 2012, 37, 9809–9815. [Google Scholar] [CrossRef]
  8. Ivers-Tiffée, E.; Weber, A.; Herbstritt, D. Materials and technologies for SOFC-components. J. Eur. Ceram. Soc. 2001, 21, 1805–1811. [Google Scholar] [CrossRef]
  9. Constantin, G.; Rossignol, C.; Briois, P.; Billard, A.; Dessemond, L.; Djurado, E. Efficiency of a dense thin CGO buffer layer for solid oxide fuel cell operating at intermediate temperature. Solid State Ion. 2013, 249–250, 98–104. [Google Scholar] [CrossRef]
  10. Choi, H.; Na, Y.; Kwak, M.; Kim, T.W.; Seo, D.; Woo, S.; Kim, S. Development of solid oxide cells by co-sintering of GDC diffusion barriers with LSCF air electrode. Ceram. Int. 2017, 43, 13653–13660. [Google Scholar] [CrossRef]
  11. Fu, Y.-P.; Chen, S.-H. Preparation and characterization of neodymium-doped ceria electrolyte materials for solid oxide fuel cells. Ceram. Int. 2010, 36, 483–490. [Google Scholar] [CrossRef]
  12. Kang, Y.J.; Choi, G.M. The effect of alumina and Cu addition on the electrical properties and the SOFC performance of Gd-doped CeO2 electrolyte. Solid State Ion. 2009, 180, 886–890. [Google Scholar] [CrossRef]
  13. Zha, S. Ni-Ce0.9Gd0.1O1.95 anode for GDC electrolyte-based low-temperature SOFCs. Solid State Ion. 2004, 166, 241–250. [Google Scholar] [CrossRef]
  14. Nagamori, M.; Shimonosono, T.; Sameshima, S.; Hirata, Y.; Matsunaga, N.; Sakka, Y. Densification and Cell Performance of Gadolinium-Doped Ceria (GDC) Electrolyte/NiO-GDC Anode Laminates. J. Am. Ceram. Soc. 2009, 92, S117–S121. [Google Scholar] [CrossRef]
  15. Sammes, N.M.; Tompsett, G.A.; Cai, Z. The chemical reaction between ceria and fully stabilised zirconia. Solid State Ion. 1999, 121, 121–125. [Google Scholar] [CrossRef]
  16. Tsoga, A.; Gupta, A.; Nikolopoulos, P. Gadolinia-doped ceria and yttria stabilized zirconia interfaces: Regarding their application for SOFC technology. Acta Mater. 2000, 48, 4709–4714. [Google Scholar] [CrossRef]
  17. Constantin, G.; Rossignol, C.; Barnes, J.-P.; Djurado, E. Interface stability of thin, dense CGO film coating on YSZ for solid oxide fuel cells. Solid State Ion. 2013, 235, 36–41. [Google Scholar] [CrossRef]
  18. Breaz, E.; Aubry, E.; Billard, A.; Coton, N.; Coquoz, P.; Pappas, A.; Diethelm, S.; Ihringer, R.; Briois, P. Influence of the Bias Substrate Power on the GDC Buffer Layer. ECS Trans. 2017, 78, 807–816. [Google Scholar] [CrossRef]
  19. Thornton, J.A.; Hoffman, D.W. Stress related effect in thin films. Thin Solid Film 1989, 171, 5–31. [Google Scholar] [CrossRef]
  20. Anders, A. A structure zone diagram including plasma-based deposition and ion etching. Thin Solid Film 2010, 518, 4087–4090. [Google Scholar] [CrossRef] [Green Version]
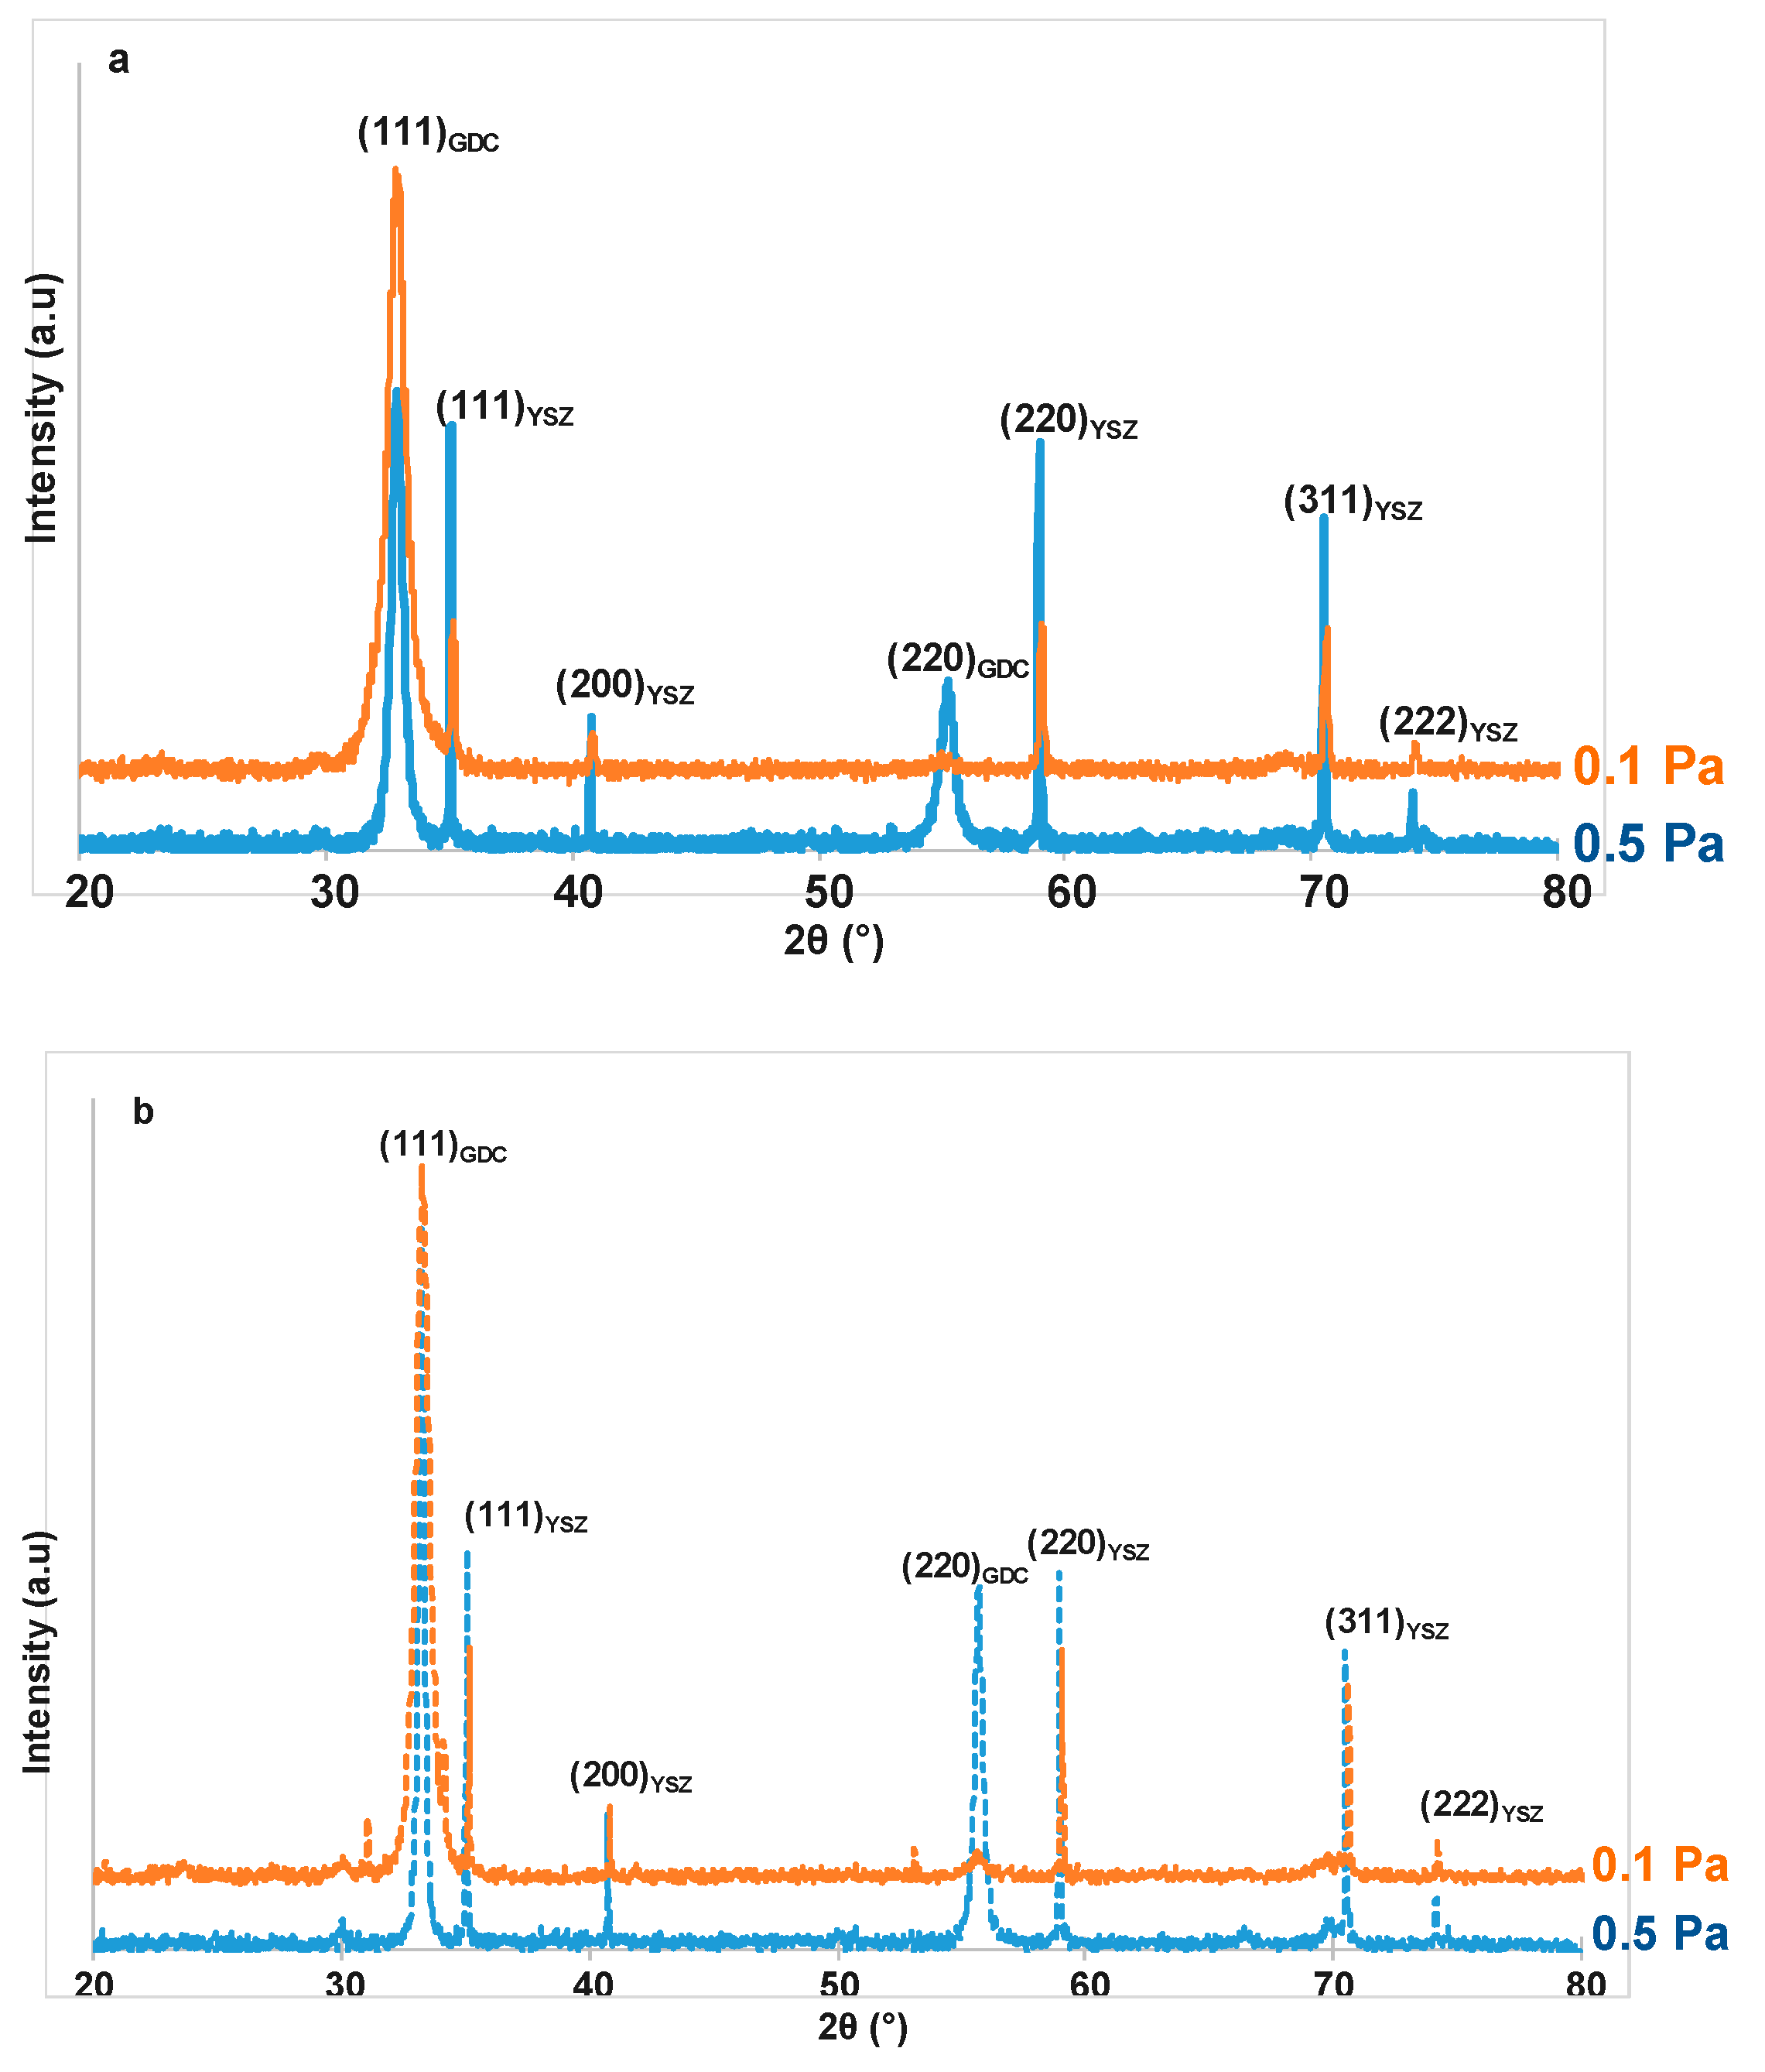
Figure 1. XRD patterns of gadolinia-doped ceria (GDC) coating as function of the total pressure (a: as deposited, b: after annealing treatment under static air for two hours at 1000 °C).
Crystals 10 00759 g001
Figure 2. SEM micrographs of GDC coating as function of the total pressure (a,c) 0.5 Pa and (b,d) 0.1 Pa. (a,b—as deposited; c,d—after annealing treatment under static air for two hours at 1000 °C).
Crystals 10 00759 g002
Figure 3. Potential and power versus current of a 2R-Cell™ equipped with a GDC buffer layer deposited via reactive magnetron sputtering under 0.1 and 0.5 Pa.
Crystals 10 00759 g003
Figure 4. SEM micrographs of GDC coating synthesized under 0.1 Pa as a function of different thickness. (a–c) As deposited; (d–f) after annealing treatment under static air for two hours at 1000 °C).
Crystals 10 00759 g004
Figure 5. Potential and power versus current of a 2R-Cell™ equipped with a GDC buffer layer deposited via reactive magnetron sputtering under 0.1 Pa and different thickness.
Crystals 10 00759 g005
Table 1. Open-circuit voltage (OCV) as a function of the bias power applied on the porte substrate holder.
Bias Power (W)OCV (V)
201.139
401.135
601.07
801.143