1. Introduction
The positive biaxial crystal potassium titanyl arsenate KTiOAsO
4 or KTA belongs to the
mm2 point group symmetry. The assignment between the dielectric and crystallographic axes is
X,
Y,
Z →
a,
b,
c. KTA is a popular nonlinear optical crystal for laser frequency conversion at room temperature. The optical parametric oscillator (OPO) [
1,
2], second harmonic [
3,
4], sum [
5], and difference [
6] frequency generator (DFG) based on KTA crystals were successfully demonstrated. This is due to the exceptional optical properties [
7], including a wide transparency window in 0.35–5.25 μm at “0” transmittance level corresponding to the small absorption coefficient down to 0.05 cm
−1, large birefringence up to ~0.1 at 0.638 μm, the moderate value of the nonlinear coefficients
d24 = 4.4 pm/V,
d31 = 2.8 pm/V,
d32 = 5.1 pm/V,
d33 = 16.2 pm/V, and a high damage threshold of over 1.2 GW/cm
2 under exposure to 8 ns pulse at 1.064 μm. In a first approximation, if we consider the maximum value among the nonlinear coefficients of other basic (by classification presented in [
7]) oxygen-containing nonlinear crystals it turns out that KTA has a maximum value:
d33 = 16.6 pm/V, while KTP has
d33 = 14.6 pm/V, LBO
d32 = 0.85 pm/V, BBO
d22 = 2.2 pm/V. Thus, in comparison to with LBO, BBO, and KTP, the main advantage of KTA seems to be higher nonlinearity and lower longer infrared (IR) cutoff wavelength absorption coefficient [
7].
To expand the potential of the KTA crystal for the terahertz (THz) wave application it is necessary to understand its optical properties clearly in this range. To the best of our knowledge, there is only one report on this topic [
8]. However, these data were present only for two optical axes in the range below 1 THz. Moreover, as will be shown later, the result carried out in [
8] was not accurate. In this work, we present a detailed study of the refractive index and absorption coefficient of KTA crystals in the range of 0.3–2.1 THz. The dispersion of the refractive index is approximated and introduced in the form of the Sellmeier equation.
2. Methods and Samples
The KTA crystals were grown by the Czochralski method supplied by Crystrong Photoelectric Technology Co., Ltd. (Jinan, China). The value of direct current conductivity along the Z-axis is in the range 10−8–10−9 S. Two optically polished wafers (KTA-1 and KTA-2) were cut from an ingot orthogonal to Y and Z axes with the size of 10 × 10 × 0.627 mm3, respectively. Thus, it allows us for the first time to measure all three components of the refractive index and absorption coefficient.
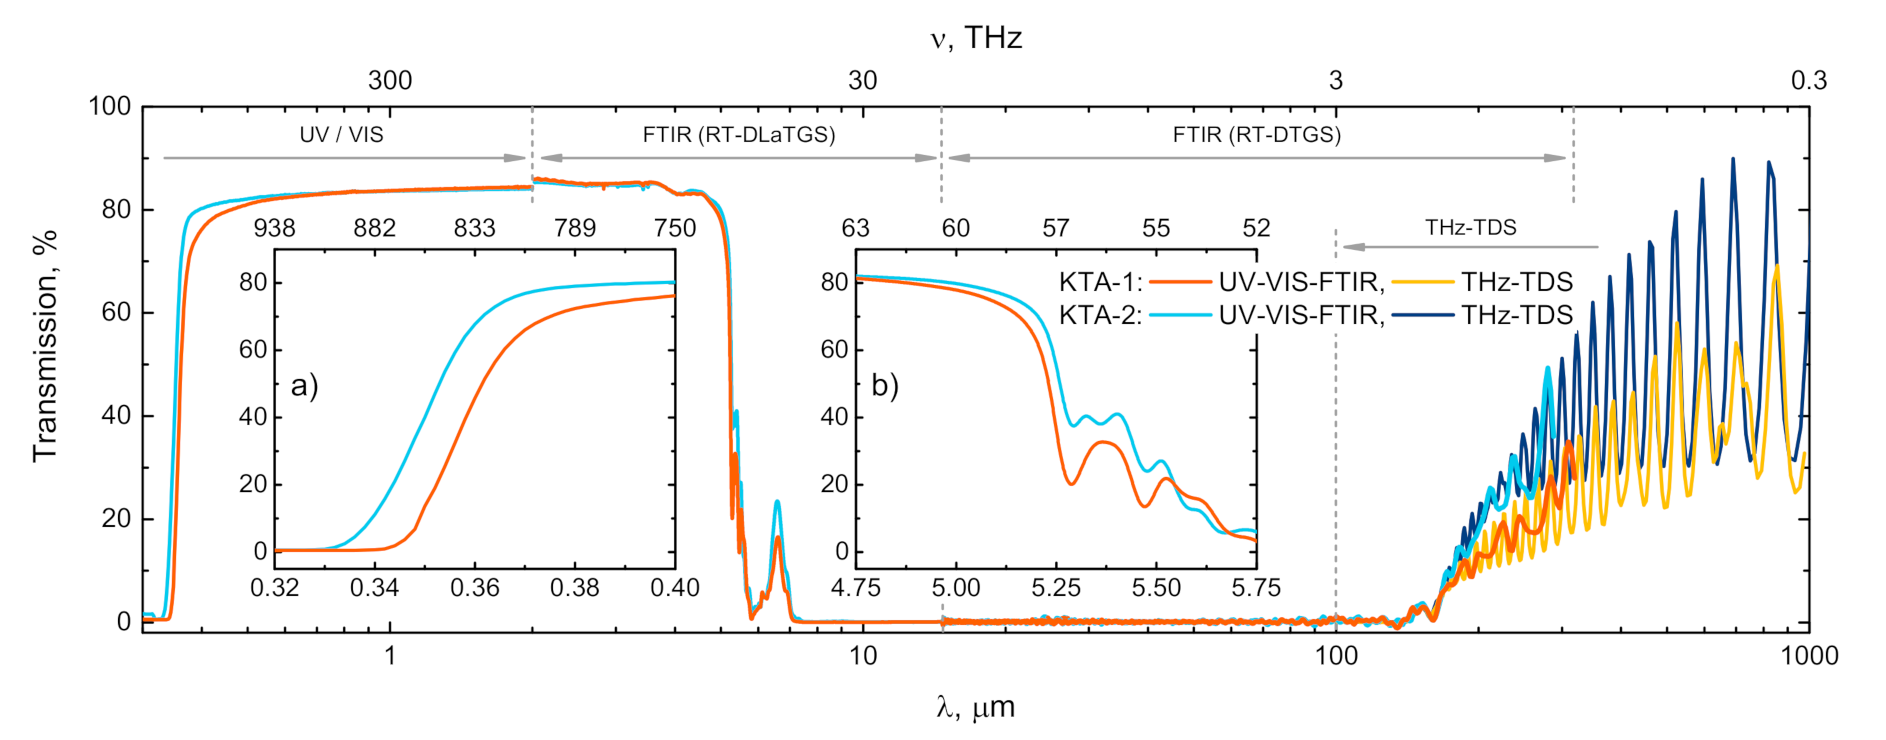
The quality of samples was investigated by the Lambda™ 750 UV/Vis/NIR spectrometer (PerkinElmer, Fremont, CA, USA) and FTIR spectrometer Vertex 80v (Bruker, Karlsruhe, Germany), as shown in
Figure 1. The polarized transmission spectra in the terahertz range were carried out via terahertz time-domain spectrometer (THz-TDS) TeraPulse 4000 (TeraView, Cambridge, UK) at the temperature of 17 °C. The samples were stuck to a 9 mm diaphragm placed in the focus of the THz beam. Since the KTA crystal has large birefringence, two wire-grid polarizers were additionally installed in the THz path before and after the sample. An aligning of the corresponding optical axis of the crystal in parallel to the THz polarization was performed for each sample before measuring. The THz-TDS signal was acquired with a time resolution of 20 fs in the range of 110 ps and averaged over 36 measurements. According to the thickness of the samples measured by a micrometer, the optical properties of KTA were further calculated from the THz time-domain spectra by using in-house processing software that utilizes an algorithm described elsewhere [
9]. It considers the signal echoes in the time domain that are associated with terahertz wave reflection from sample faces. Thus, the spectra of the refractive index and absorption coefficient are presented without the Fabry–Perot pattern. Its spectral resolution of the presented data is about 10 GHz (0.33 cm
−1). The standard deviation of the resulting data does not exceed the boundaries of rectangular symbols and is not represented in
Figure 2 and
Figure 3. We estimate the accuracy of our measurements in the THz range is to be ±0.015 for the refractive index and ±1 cm
−1 for the absorption coefficient.
3. Results and Discussion
Figure 1 plots the combined transmission spectra of the samples in the range of 0.3—1000 μm for non-polarized light. Since THz-TDS is a polarization-sensitive method, and its data were adapted in the following way. The transmittance (
Figure 1 yellow and navy-blue lines) for each sample is the average of the two data sets corresponding to the transmission spectra of terahertz waves polarized along two orthogonal optical axes. Thus, the median of
Z and
X axes (
Figure 1 yellow line) for KTA-1 and the median of
Y and
X axes (
Figure 1 navy blue line) for KTA-2 are presented. Adopted THz-TDS data show good agreement with FTIR spectroscopy data in the overlay area (100–300 μm). The insets in
Figure 1 show the UV (a) and IR (b) cutoff edges, thus 50% transparency range of the samples is about 0.35–5.25 μm. We assume that the absorption coefficient of the samples is below 0.1 cm
−1 at the wavelength of about 3 μm that further confirms the high optical quality of the wafers. Considering frequency conversion into the THz range, even chemical and CO lasers can be used as the pump source.
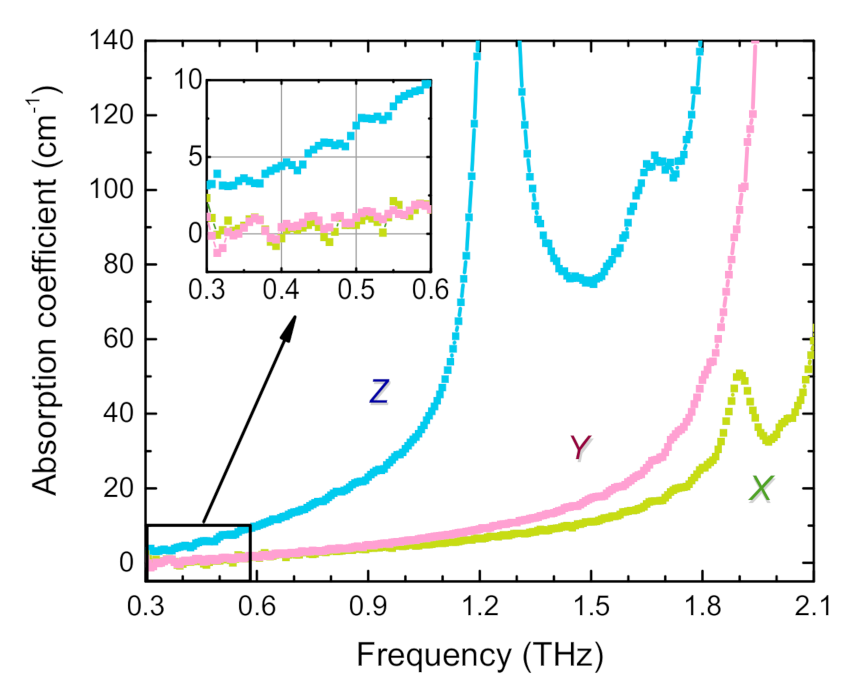
The samples introduce weak biaxiality of their optical properties below 0.7 THz (
Figure 2 and
Figure 3). The thickness of the wafer under study does not allow us to recognize the difference in the absorption coefficient for the
X and
Y axes in the spectral range below 0.9 THz. Both curves fall to the immeasurably low level below 0.5 THz. The terahertz dichroism of KTA is primarily due to the presence of the absorption peak located in the vicinity of ~1.25 THz for the
Z-axis. The peak apex is cut due to the limited dynamic range of the THz-TDS. However, these data are consistent with the results presented in [
10] where the frequency of this mode is determined in the vicinity of 41 cm
−1, which corresponds to 1.23 THz.
It is interesting to compare these data with the KTP crystal, which has the same structure representing similar behavior of the optical properties in the THz range. The frequency of a similar peak lies in the vicinity of 1.7 THz (56.7 cm
−1) according to the [
10] or 1.73 THz for a highly resistive KTP crystal [
11]. Commonly, frequencies below 6 THz (200 cm
−1) for crystals of this structure are attributed to the oscillations of the
K+ ions with respect to TiO
6 and PO
4 atomic groups [
12]. A rough estimation can be made using a model of the quantum harmonic oscillator with the frequency
. Here, m
r is the reduced mass, and
k is the bond force constant. Assuming that the reduced mass practically does not change, since we are dealing with
K+ ions in both cases, we can estimate the changes of the parameter
k. Since,
then,
and
Thus, the bond force constant of the
K+ ions in the KTA crystal is approximately two times less than in KTP. This can be explained by the fact that the substitution of the P with the As atom leads to an increase in the interatomic distance in the chain of Ti-O bonds along with the crystallographic axis c (dielectric axis
Z) [
13]. As a result, the bond of potassium ion with their nearest neighbors is weakened. Of course, the other strong absorption lines in the THz range should be considered, which are located beyond the dynamic range and spectral window of the terahertz spectrometer (>2.5 THz). They will also affect the optical properties in the sub-terahertz region and determine the sharp growth of absorption curves at a higher frequency range.
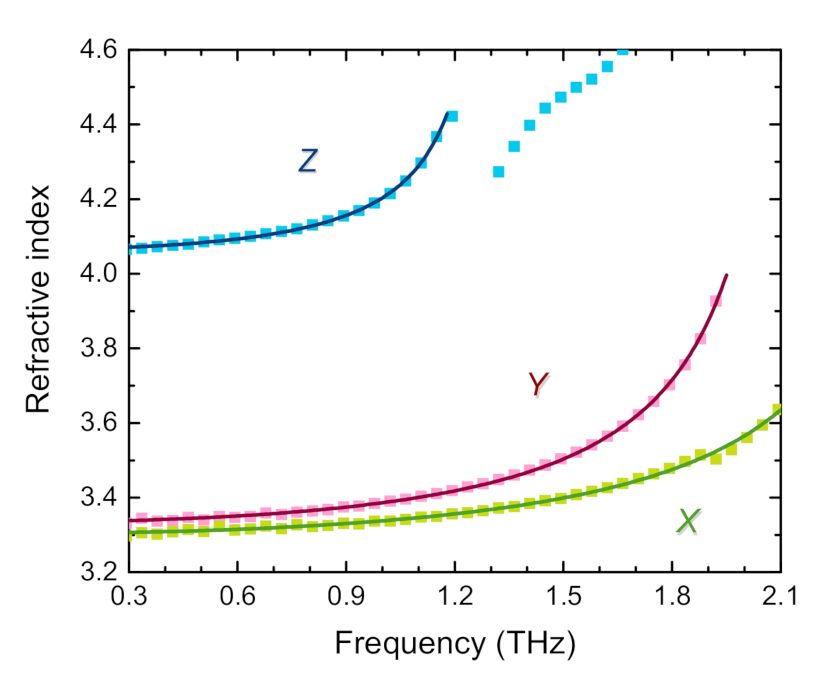
The measured value of the refractive index of KTA crystals (
Figure 3, square symbols) was approximated in the form of the Sellmeier equation (
Figure 3, solid lines). Due to the discontinuity caused by the clipping of the absorption peak in the vicinity of ~1.25 THz, the refractive index of the
Z-axis is approximated only in the region of 0.3–1.25 THz. This is also done for a practical reason. Being more transparent, the low-frequency range is more attractive for the IR laser nonlinear frequency conversion into the THz region. The resulting dispersion equations take the following form:
The behavior of the refractive index of KTA crystal also demonstrates a decrease in biaxiality at low frequency. Birefringence almost does not change in the range up to 0.5 THz, which has a noticeable value of ΔnZ-X ≈ 0.76, while it presents a small value of ΔnY-X ≈ 0.03. The refractive indices of the X and Y axes become more distinct above 1 THz as well as the case in the absorption coefficients of these axes.
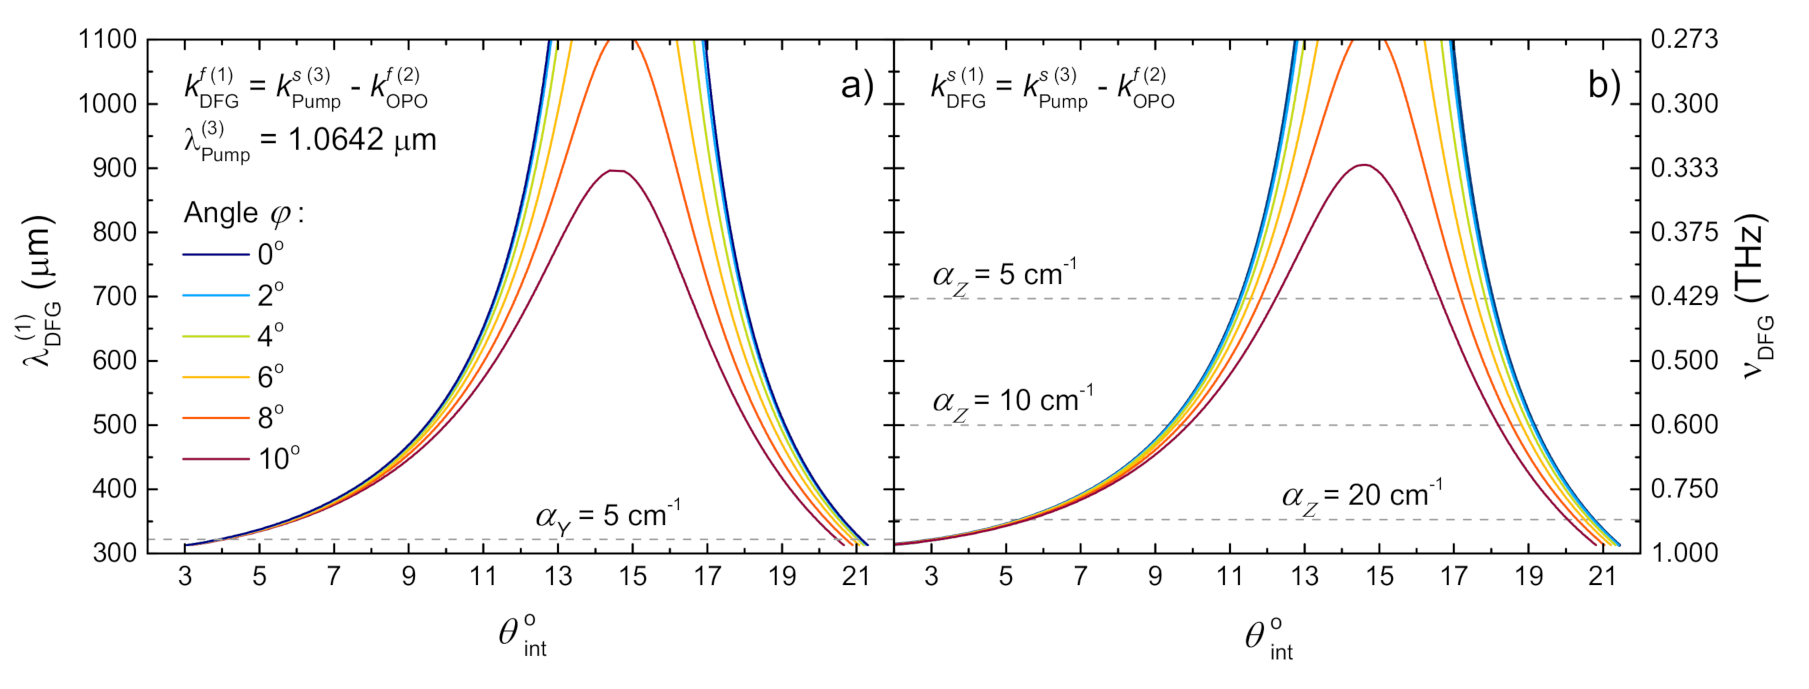
Numerical simulation of collinear phase-matching (PM) conditions for the THz DFG process was performed with the pump wavelengths
λ ~ lying in the vicinity of 1.0642 μm. The simulation is based on the dispersion equations for the main transparency window published in [
14] and for the THz range presented in Equation (1).
Figure 4 shows the DFG PM curves of the THz wavelength λ
(1) for the valid value with types of
s–f → f and
s–f → s, where
s and
f are the slow and fast wave.
KTA PM curves demonstrate analogous behavior to those of KTP crystal since both crystals show similar optical properties at THz range [
15,
16]. Especially, an asymptotic approximation to the
VZ angle (an angle between the optic axis of the crystal and
z-axis) is observed for longer wave generation. Here, we should note that according to the handbook of “Nonlinear Optical Crystals: A Complete Survey” written by Nikogosyan (p. 168) [
7], KTA has 2
VZ = 40.4° for
λ = 0.5321 μm. It is probably a typo since none of the dispersion equations set shown in the handbook could give this value. The dispersion equations from [
14] used in present work only gives
VZ = 16.7 for
λ = 0.5321 μm and
VZ = 15.0 for
λ = 1.0642 µm.
So then, according to numerical simulations, the generation of THz waves is possible in the principal
XZ-plane for both types of three-wave interactions
s–f → f (FFS) and
s–f → s (SFS) for the angle
θ > V
Z and
θ <
VZ. The difference between FFS and SFS phase-matching curves is almost imperceptible to the eye. For reference, the absorption coefficients for
αY and
αZ in the case of FFS and SFS respectively are presented since they mainly determine the attenuation of generated THz waves. The absorption coefficient decreases with longer wavelength (in up direction on the
Figure 4). Hence, the FFS type of frequency conversion is much more efficient since the absorption coefficient of the THz wave is at least four times lower than that of SFS type. The tuning range at
θ <
VZ is less than that value at
θ >
VZ since for
θ → 0 the curves asymptotically approach to the wavelength
λ ~ 300 μm, while for
θ → 90° the curves go slightly below this value. However, the crystal thickness should also be taken into consideration for the exact tunable wavelength range in the experiment.
4. Conclusions
Optical properties of the KTA crystal grown by the Czochralski method have been studied by the means of terahertz time-domain spectroscopy. The dispersion of the refractive index is approximated in the form of the Sellmeier equation. The crystal has large birefringence ΔnZ-X ≈ 0.76. The dichroism is defined by strong absorption in the direction of the Z-axis and due to the presence of a peak in the vicinity of ~1.23–1.25 THz. However, in the region below 0.5 THz, the crystal can be considered as almost uniaxial due to the low birefringence ΔnY-X ≈ 0.03 and approximate equality property of the absorption coefficient αX ≈ αY. It is found that the KTA crystal could satisfy the phase-matching conditions in principal XZ-plane for THz difference frequency generation. We estimate that s−f→f type of three-wave interaction is more efficient than that of s–f → s type due to the notable lower THz-wave absorption.
In comparison with the so-called “basic nonlinear crystals” (according to the classification [
7]) in which the existence of collinear phase matching is known for the generation of a difference terahertz frequency when pumped by IR lasers (KTP, LBO, and β-BBO), KTA has several advantages. In a first approximation, if we consider the maximum value among the nonlinear coefficients of other basic nonlinear crystals it turns out that KTA has a maximum value:
d33 = 16.6 pm/V, while KTP has
d33 = 14.6 pm/V, LBO
d32 = 0.85 pm/V, BBO
d22 = 2.2 pm/V. KTA also has a lower longer IR absorption coefficient [
7]. Thus, according to our results, KTA is seen as a promising generator of intense tunable narrowband THz radiation under a high-power IR laser pump. Lithium niobite being also a “basic nonlinear crystal” is out of consideration in this case since it has no collinear phase matching [
17] for DFG into the THz range.


 ,
, 