Article

Partial and Total Substitution of Zn by Mg in the Cu2ZnSnS4 Structure

by
Diana M. Mena Romero
1,
David Victoria Valenzuela
2 and
Cristy L. Azanza Ricardo
2,*
1
Posgrado en Ciencia e Ingeniería de Materiales, Centro de Física Aplicada y Tecnología Avanzada, Universidad Nacional Autónoma de México, Campus Juriquilla, Santiago de Querétaro 76230, Qro., Mexico
2
Centro de Física Aplicada y Tecnología Avanzada, Universidad Nacional Autónoma de México, Boulevard 14, Juriquilla 3001, Santiago de Querétaro 76230, Qro., Mexico
*
Author to whom correspondence should be addressed.
Crystals 2020, 10(7), 578; https://doi.org/10.3390/cryst10070578
Submission received: 4 June 2020 / Revised: 28 June 2020 / Accepted: 1 July 2020 / Published: 4 July 2020

Abstract

:
Cu 2 ZnSnS 4 (CZTS) is a quaternary semiconductor that has emerged as a promising component in solar absorber materials due to its excellent optical properties such as band-gap energy of ca. 1.5 eV and significant absorption coefficient in the order of 10 4 cm 1 . Nevertheless, the energy conversion efficiency of CZTS-based devices has not reached the theoretical limits yet, possibly due to the existence of antisite defects (such as Cu Zn or Zn Cu ) and secondary phases. Based on electronic similarities with Zn, Mg has been proposed for Zn substitution in the CZTS structure in the design of alternative semiconductors for thin-film solar cell applications. This work aims to study the properties of the CZTS having Mg incorporated in the structure replacing Zn, with the following stoichiometry: x = 0, 0.25, 0.5, 0.75, and 1 in the formula Cu 2 Zn 1 x Mg x SnS 4 (CZ-MTS). The semiconductor was prepared by the hot injection method, using oleylamine (OLA) as both surfactant and solvent. The presence and concentration of incorporated Mg allowed the fine-tuning of the CZ-MTS semiconductor’s structural and optical properties. Furthermore, it was observed that the inclusion of Mg in the CZTS structure leads to a better embodiment ratio of the Zn during the synthesis, thus reducing the excess of starting precursors. In summary, CZ-MTS is a promising candidate to fabricate high efficient and cost-effective thin-film solar cells made of earth-abundant elements.

1. Introduction

The development of sustainable resources to obtain clean energy as an alternative to fossil fuel has become a fundamental challenge of the 21st century, for both industry and academia. Solar energy is one of the best options among all renewable energies able to cover current energy demand. Significant efforts have been made searching for a cheaper and non-toxic photovoltaic material in order to improve the record efficiency (above 20%) [1,2] of chalcopyrites Cu(In,Ga)Se 2 or CIGS [3,4,5]. In this context, kesterites as Cu 2 ZnSn(S,Se) 4 (CZTSSe) are attractive and promising materials for absorber layers in thin-film solar cells because all its components are earth-abundant and environment-friendly [6]. CZTSSe is isoelectronic to CIGS [2], so they share their material properties while all the know-how related to preparation (like colloidal [1], spray pyrolysis [7,8] and sol-gel [9,10] techniques) and characterization methods used in chalcopyrites may be transferred and applied to kesterites.
The current record efficiency is 12.6% for CZTSSe [3,4,11,12,13] with band gaps between 1.0 and 1.5 eV [11,12], which is still lower than the requirement for commercial solar cell devices. Possible reasons for low device performance could be the existence of antisite defects (Cu Zn or Zn Cu ) in the CZTS(Se) absorber layer [11,13,14,15] that acts as recombination centers. Also, the presence of secondary phases like Cu 2 SnS 3 , Cu 2 S, SnS 2 and ZnS [16,17] are responsible for the low open circuit voltage and high series resistance [2,3]. Furthermore, some secondary phases are difficult to detect [16,18], and they appear even in successfully grown CZTSSe, because of the large number of components and the small region of single phase CZTSSe.
The intrinsic difficulty of increasing CZTS absorber layer performances in thin-film solar cells has been addressed faced by taking different paths. Some researchers have developed and studied the possibility to override or drastically decrease the amount of defect and spurious phases. For example, Rudisch et al. [19] proposed to design a synthesis that takes into account a critical temperature (T c ) where the order/disorder of the kesterite CZTS begins, and Kumar et al. [2] listed different ways to passivate defects and avoid secondary phases. Also, many authors report the complete and/or partial substitution of Zn by another elements like Cu, Fe, Mn, Cd, Ca or Mg [3,11,13,14,17,20,21] to study their influence on the properties in the CZTSSe absorber layer [11,22]. Whithin this context, there are only a few reports of the substitution of Zn by Mg, and half are purely experimental [11,13,21]. In contrast, others studied the viability of Cu 2 MgSnS 4 (CMTS) by theoretical calculations [12,14,20]. Nevertheless, all of them concluded that CMTS is a promising absorber layer in solar cells being thermodynamically stable and having a bandgap between 1.63 and 1.80 eV.
Taking into account that Mg is more available than Zn in the Earth’s crust, that Mg 2 + and Zn 2 + have similar radii [21], and that, according to Wei et al., MgS is not stable in solution conditions, Mg has become a good candidate for Zn substitution in the CZTS structure [21]. Recently, CMTS has been synthesized using the solution approach with dimethyl sulfoxide (DMSO) [11,23], co-spray pyrolysis [13], pulsed laser deposition [24], and hot-injection methods [21]. With the hot-injection method, it is possible to minimize the number of organic solvents involved during the synthesis, e.g., by using oleylamine (OLA) as surfactant and solvent. The procedure consists of injecting a cold solution of precursors into a hot surfactant solution, leading to the fast nucleation and growth of nanocrystals [21,25]. It has been a successful method to synthesize a variety of semiconducting nanocrystals, such as CdX (X = S, Se, and Te), CIGS, and Cu 2 XSn(S,Se) 4 (X = Cd, Zn, and Co), providing good control over the composition and morphology with a low-cost fabrication of solar cells through drop-casting, dip coating, spin coating, or screen printing [21,22,25].
The incorporation of Mg in the synthesis of kesterite draws the attention not only for the promising theoretical works that have been publishing, but also for the encouraging experimental results that can be consulted in literature. For example, Caballero et al. reported that a low concentration of Mg in Cu 2 Zn 1 x Mg x Sn(S,Se) 4 results in the kesterite structure, but if the Mg content exceeds 0.55 there is a phase separation [11]. Nevertheless, Wei et al., 2014 successfully produced Cu 2 MgSnS 4 without any secondary phase and with a suitable bandgap for the fabrication of solar cells [21]. Therefore, the incorporation of Mg in the CZTS kesterite structure is a relatively recent topic, which demands further theoretical and experimental research in order to get a better understanding of the system and to take advantage of its benefits. The purpose of this work is to contribute to the study of Magnesium incorporation in the CZTS, exploring the effects of the partial and complete of substitution Zn by Mg on the CZ-MTS optical and structural properties.

2. Materials and Methods

Nanoparticles of Cu 2 Zn 1 x Mg x SnS 4 (CZ-MTS) were prepared using the hot-injection method, starting from metal chlorides, pure sulfur powder, and oleylamine (OLA), avoiding the excess of organic content and expensive reagents.The following reagents were used without further purification: Copper(II) chloride dihydrate (CuCl 2 -2H 2 O, Aldrich, >99.0%), zinc chloride (ZnCl 2 , Aldrich, >98%), magnesium chloride hexahydrate (MgCl 2 -6H 2 O, Aldrich >99%), tin(II) chloride dihydrate (SnCl 2 -2H 2 O, Aldrich, >98%), sulphur powder (Meyer, >99.5%), oleylamine (OLA, Aldrich, 70%), ethanol (Meyer, >99.5%), and toluene (Meyer, >99.5%).
In a typical synthesis, the metal precursor solution was prepared with 20 mL of OLA in a three-neck flask connected to a Schlenk line. Samples were divided into two groups: The KA series was prepared with Mg excess, directly doubling the amount of Mg with respect to the KB series of samples. Metal precursors were mixed with the following criteria: 2 mM of CuCl 2 , (1 x )mM of ZnCl 2 , x y mM of MgCl 2 , and 1 mM of SnCl 2 , where x = 0 , 0.25 , 0.5 , 0.75 , 1 is the amount of Mg that substitutes the Zn in the CZTS structure (Cu 2 Zn 1 x Mg x SnS 4 ), and y corresponds to the Mg excess factor. Therefore, y = 2 for the KA series, while y = 1 for the KB series.
The syntheses were performed under oxygen-free conditions through the use of the Schlenk line. At room temperature, the precursor solution was degassed and refilled with nitrogen three times and then heated to 180 ° C under vacuum for 1 h. At this temperature, the flask was degassed and refilled again with nitrogen six times; then, the temperature was raised to 270 ° C under nitrogen for 1 h. At this point, 10 mL of a solution of Sulphur powder/OLA 1M was rapidly injected and kept at 270 ° C under a nitrogen atmosphere for an hour, and then cooled to room temperature naturally.
The final product was purified by mixing a solution of ethanol:toluene = 5:1 by volume inside the flask with the precipitated nanoparticles. The mixture was centrifuged for 10 min at 3000 RPM to separate the OLA from the CZ-MTS nanoparticles, and was then dispersed in toluene for further characterization. Thin films were deposited on a silicon wafer by spin coating with nanoparticles dispersed in 2 mL of toluene for X-ray diffraction (XRD) and energy dispersive X-ray spectroscopy (EDX) characterizations, and in soda lime glass for subsequent Ultraviolet/Visible/Near Infrared Spectroscopy (UV–Vis-NIR) measurements. Spin coating deposition was performed by a two-step procedure: for the first step, speed of 500 rpm for 10 s is used in order to assure a good film homogeneity, while in the second one, spining at 900 rpm for 15 s permitted the drying purposes. DLS measurements were performed in a solution of 4mL of toluene with a concentration of ca. 1 mg/mL of nanoparticles diluted.
The size of the CZ-MTS nanoparticles was characterized using a Malvern Panalytical Zetasizer Nano S, model ZEN1600 for dynamic light scattering (DLS). All data were collected at 25 ° C, controlled by the instrument. The optical properties were investigated by UV-Vis-NIR measurements with a wavelength between 200 and 2500 nm with the spectrophotometer VWR, model 1600 PC. The powder diffraction pattern (XRD) was collected on a Rigaku, model Ultima UIV with Cu K α ( λ = 0.15406 nm), in parallel beam configuration in a 2 θ range between 5 ° to 80 ° . Morphology was determined with a scanning electron microscope (SEM/STEM) model HITACHI SU8230 with cold cathode field emission, operated at 25 kV with a magnification of 250 k, and a working distance of 5 mm, while energy dispersive X-ray spectroscopy (EDX) was carried out on a Bruker xflash-6/60 detector, coupled to the same microscope.

3. Results and Discussion

3.1. Compositional Analysis

The composition of the Cu 2 Zn 1 x Mg x SnS 4 nanocrystals was determined by EDX and listed in Table 1. As for the KA series, the double of Mg content was used (imitating the Zn-rich composition), and in the KB series, stoichiometric Mg was used; the resulting Zn content was close to the expected stoichiometry in the KA series, but Mg was in excess in the samples KA2 to KA5, while in sample KA1 (without Mg), the Zn composition was low. On the other hand, in the KB series, the contents of Zn and Mg were below the expected.
It can be noticed in Figure 1 that Sn content was stable for all samples. Taking into account that in the referenced article [25], it was necessary to start with more than three times the stoichiometric Zn content; in this work, with the presence of Mg, it was no longer required to use the excess of starting Zn. The strong influence of Mg in the Zn content is reflected in both series, showing a better Zn incorporation efficiency in the KA series with the double of Mg content, but also in the KB series, leading to a satisfactory compositional stabilization. Figure 1 shows an asymptotic trend for the Zn and Mg content in both series when moving towards the maximum and minimum Zn content, except for the KA5 sample, where Mg excess results in a large amount of Mg atomic percentage in the sample. Nevertheless, it is still necessary to further optimize the amount of starting Zn and Mg in the synthesis.

3.2. Size and Structure

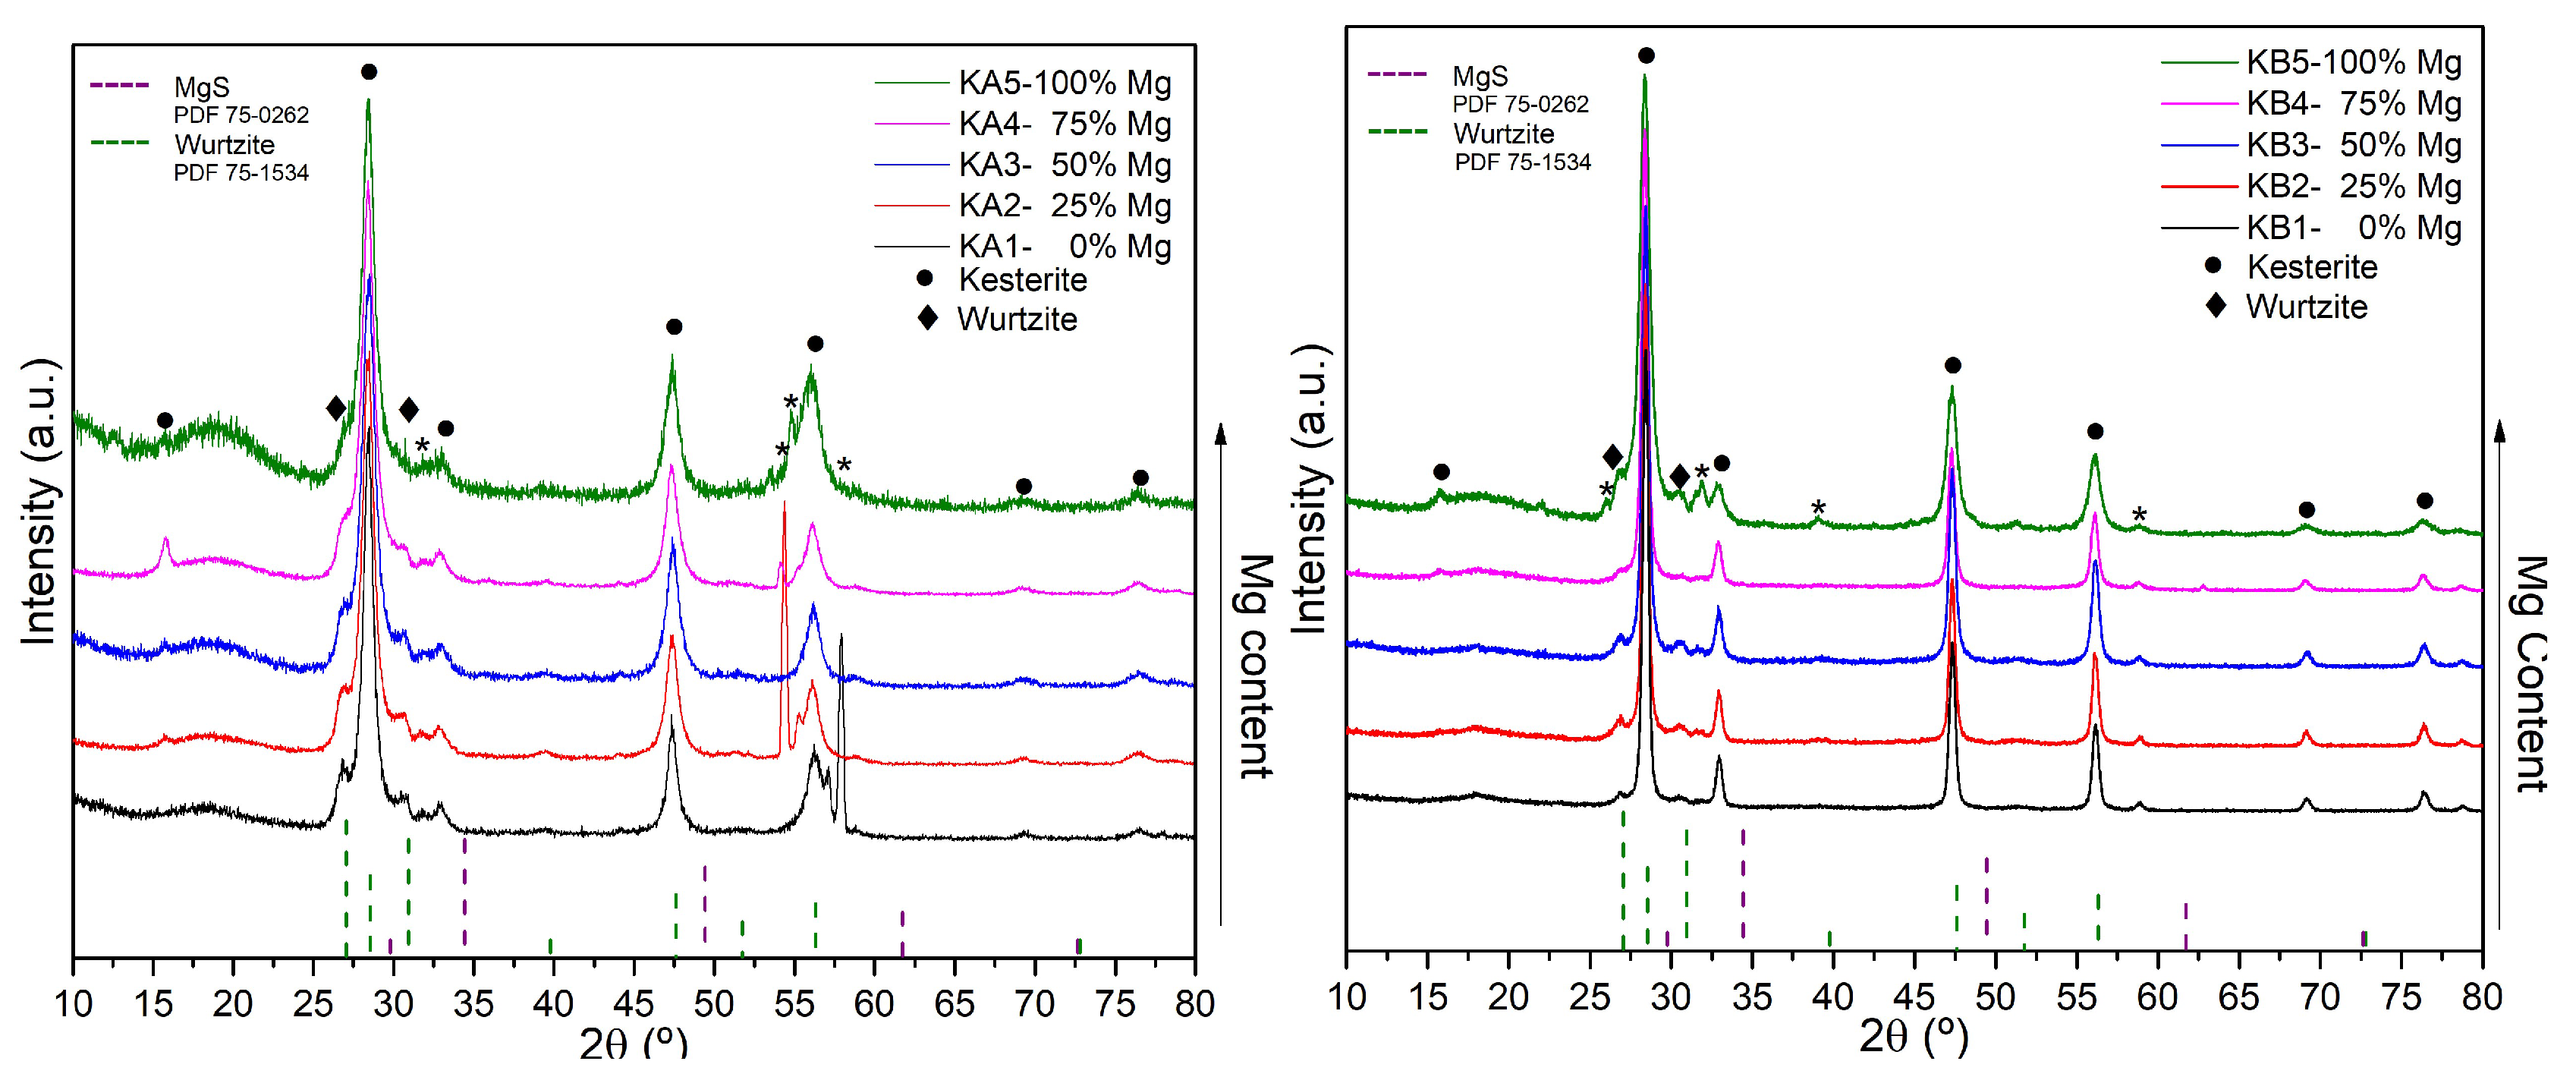
Figure 2 shows the XRD profiles for all samples deposited on silicon wafers. Measurements show a more evident presence of the hexagonal wurtzite CZ-MTS phase in the shoulders of the main kesterite CZ-MTS peaks for the KA series (about 5% for KA and 2% for KB), which is compatible with the nucleation mechanism proposed by Azanza et al. [25]. It is also possible to notice the presence of secondary phases, mostly for the samples with a larger amount of Mg, but it was not possible to identify them due to the lack of reflections. Nevertheless, the sharp peaks representing these secondary phases (identified with asterisks in the figure) suggest large and oriented crystalline domains. It is important to note that even if some spurious phases were observed, there is not evidence of a strong phase separation for high-Mg-content samples, as reported by Cablallero et al. [11]. The kesterite CZ-MTS structure showed a slight (112) preferred orientation for all samples.
In order to evaluate the possible modification of the unit cell volume due to the incorporation of Mg into the CZTS structure, the deviations of the interplanar distances of selected crystallographic planes are plotted in Figure 3 in terms of the Mg content. Some authors have already reported peak shifts with the substitution of Zn by Fe [28] and Sn by Ge [29] in the kesterite CZTS structure, attributed to the difference in cation sizes. Nevertheless, our results show no significant modification of the interplanar distances with the variation of the Mg content. The low expansion values obtained are in agreement with results reported by Agawane et al. [24], and are coherent with the very similar ionic radii of both species.
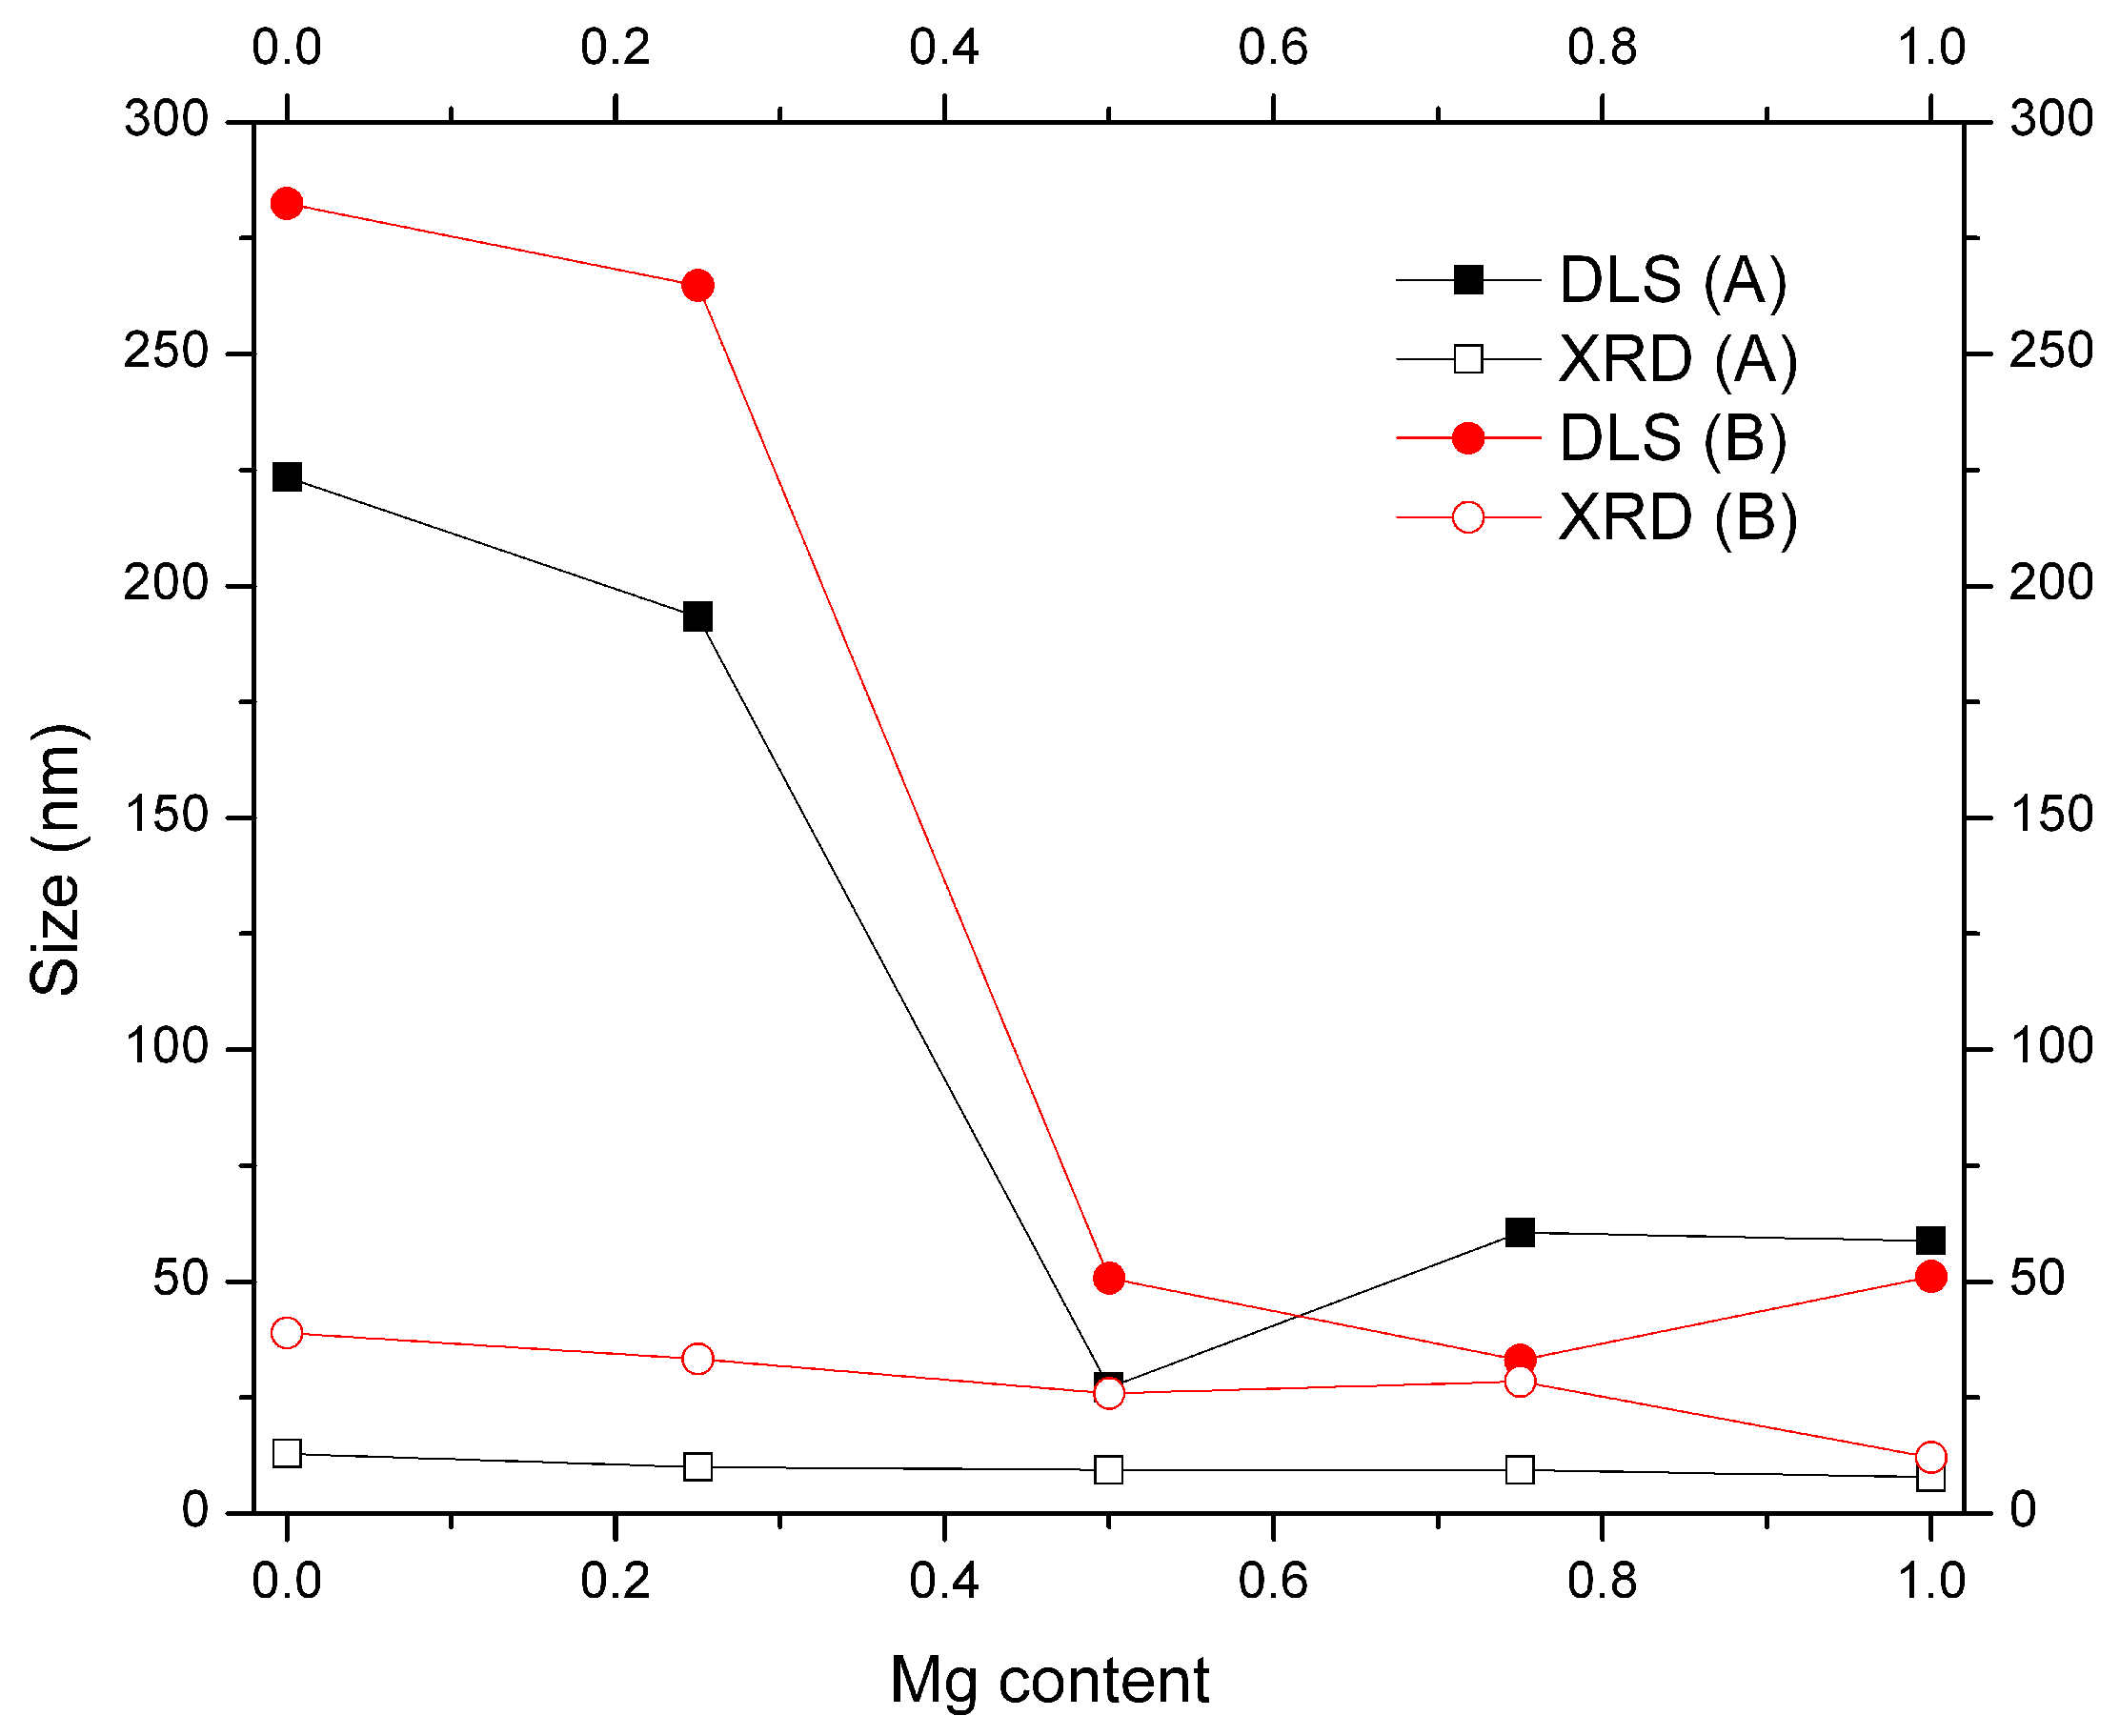
The results from average crystalline domain size computed from XRD profiles and hydrodynamic size obtained from DLS measurements are shown in Table 2 and plotted in Figure 4. As DLS measurements are intended to give information about the nanoparticle dispersion, the obtained results show a higher tendency for agglomeration for samples with a lower amount of Mg, resulting in bimodal distributions of nanoparticles over 50% of Mg content. In Table 2, the average radius is reported for the main distribution (DLS p 1 ) and for the secondary one (DLS p 2 ) when present.
Figure 4 shows the average radius of the main DLS size distribution together with the XRD results. Even if the information derived from these techniques is different, the tendency to obtain smaller nanoparticles with larger Mg content is clear. Average crystalline domain size increases when exceeding the half of nominal Mg in the synthesis (from KA to KB series), and also decreases within a given series.
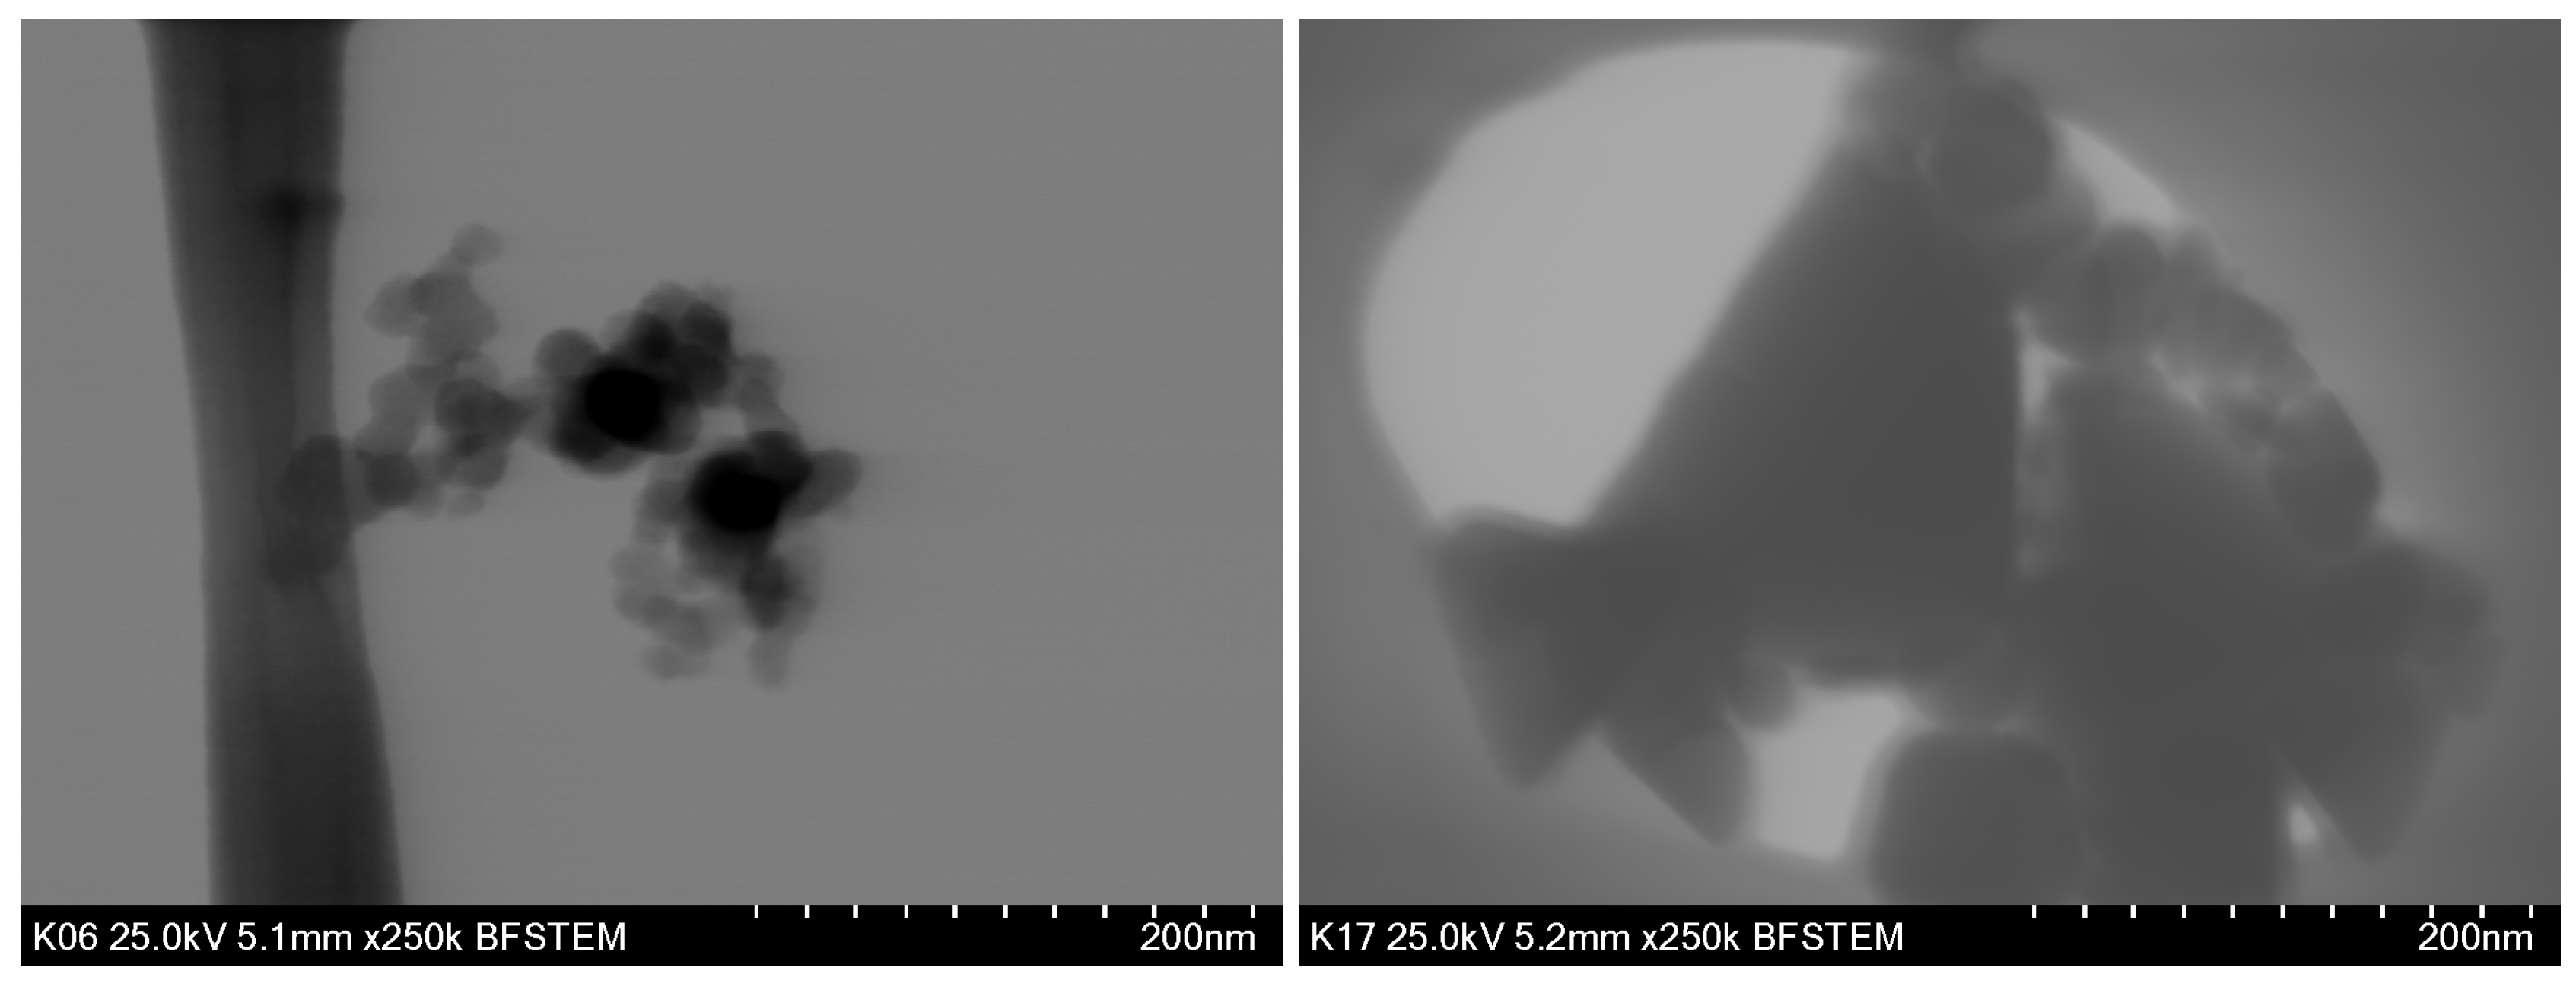
The morphology of the samples with 25% of Mg content is shown in Figure 5. Small sphere-like nanoparticles can be observed in both micrographs; the larger the ones correspond to the KB series. This result is in agreement with the average crystalline domain size reported before. On the other hand, large particles (∼20 nm) are visible in the KB2 sample, which is in accordance with the large hydrodynamic particle size obtained from the DLS measurements. Nevertheless, no sharp peaks are observed in the corresponding XRD pattern (Figure 2), as for the low-Mg-content sample in the A-series. Even if it is not possible to exclude that these large particles are positioned in the powder sample in such a way that diffraction condition is not achieved for any reflection, it is also possible to assume that smaller crystalline domains likely conform them with the same size of the surrounding sphere-line nanoparticles.

3.3. Optical Properties

Optical properties were investigated using UV-vis-NIR measurements in the 200–2500 nm wavelength range, obtaining a transmittance and reflectance spectrum of the CZ-MTS nanoparticles deposited as thin films. The absorption coefficient was computed from raw data using the following equation:
α = 1 d ln T ( 1 R ) 2 ,
where d corresponds to the thickness of the film, and T and R are the transmittance and reflectance, respectively. The common practice is to construct the Tauc plot ( ( α E ) 2 vs. E) for the determination of the band-gap of the direct band-gap semiconductor through the extrapolation of a linear fit. Nevertheless, the selection of the linear region of the plot has always been controversial. In this work, we will use the so-called E 04 value, which corresponds to the energy for an absorption coefficient of 10 4 cm 1 [30].
E 04 values are reported in Table 3 and plotted in Figure 6 (left). As stated before, this parameter is convinient for comparative purposes, but it can be an excellent estimation for the band-gap of the material, as can be seen from the Tauc plots in Figure 6 (right). It can be noticed that the material band-gap increases with the increase of the incorporated Mg, which is in agreement with Agawane et al. [24]. In fact, larger band-gap values are obtained for the KA series, because it was produced with the twice the Mg content. Band-gap enlargement has been previously reported due to cation substitution in CZTS [23,28] as well as for other materials, such as CIGS [31]. The main explanations of this phenomenon are related to structural modifications, such as crystal lattices and anion–cation bond lengths and angle variations, which are not applicable for Mg substitution, as shown in Figure 3. Actually, there is no significant change in cell volume, as the interplanar distances remain almost the same with Mg variation. Furthermore, Oueslati et al. [23] and Khadka et al. [28] reported a band-gap increase with decreasing Fe content in CZTS, and they explain this behavior with the possible electron exchange and redistribution due to the difference in electronegativities of Zn (1.65) and Fe (1.83). Taking into account the lower electronegativity value for the Mg (1.31), an opposite trend is expected, i.e., a band-gap increase with the increase of the incorporated Mg.
The obtained results indicate a systematic control of the optical properties within the substitution region, leading to possible engineering of thin films with band-gap gradients. Furthermore, the stabilization effect that arises from the presence of Mg in the nanoparticle synthesis is evident, avoiding the use of a larger amount of precursors in order to obtain the desired stoichiometry.

4. Conclusions

The synthesis of CZ-MTS (Cu 2 Zn 1 x Mg x SnS 4 ) nanoparticles was carried out through the hot-injection method using OLA and metal chlorides, which is a cost-effective method. The presence of Mg permitted to decrease the nominal precursor’s amount in order to get the desired stoichiometry, leading to an adequate control of the optical properties of the obtained materials (i.e., bandgap modulation [28]). The final product has CZ-MTS hexagonal (wurtzite) and CZ-MTS tetragonal (kesterite) structures, as proposed by Azanza et al. [25], with no structural decomposition for high Mg substitution values. Larger average crystalline domain size and higher agglomeration tendency were found for samples with smaller nominal Mg content, while larger band-gap values were obtained for high Mg incorporation ratios. The obtained results show that CZ-MTS is a promising candidate to fabricate high-efficiency, cost-effective, and Earth-abundant thin-film solar cells.

Author Contributions

Conceptualization, C.L.A.R.; Data curation, D.M.M.R., D.V.V., and C.L.A.R.; Formal analysis, D.M.M.R. and C.L.A.R.; Funding acquisition, C.L.A.R.; Investigation, D.M.M.R., D.V.V., and C.L.A.R.; Methodology, D.M.M.R. and C.L.A.R.; Project administration, C.L.A.R.; Resources, C.L.A.R.; Supervision, C.L.A.R.; Validation, C.L.A.R.; Visualization, D.M.M.R. and C.L.A.R.; Writing—original draft, D.M.M.R. and C.L.A.R.; Writing—review and editing, D.M.M.R., D.V.V., and C.L.A.R. All authors have read and agreed to the published version of the manuscript.

Funding

This research was funded by UNAM PAPIIT-IA104417 and CONACyT APN-3051.

Acknowledgments

The authors would like to acknowledge Beatriz Millán Malo, Alicia del Real López, and Carmen L. Peza Ledesma for their technical support. The authors would also like to acknowledge the Center for Research and Advanced Studies of the National Polytechnic Institute (CINVESTAV), Querétaro Unit, and especially to M.S. Cyntia Zúñiga Romero for her support in the UV-vis-NIR measurements. D. Mena would also like to acknowledge CONACyT for her Ph.D. grant number 621036.

Conflicts of Interest

The authors declare no conflict of interest.

References

  1. Akhavan, V.A.; Goodfellow, B.W.; Panthani, M.G.; Steinhagen, C.; Harvey, T.B.; Stolle, C.J.; Korgel, B.A. Colloidal CIGS and CZTS nanocrystals: A precursor route to printed photovoltaics. J. Solid State Chem. 2012, 189, 2–12. [Google Scholar] [CrossRef]
  2. Kumar, M.; Dubey, A.; Adhikari, N.; Venkatesan, S.; Qiao, Q. Strategic review of secondary phases, defects and defect-complexes in kesterite CZTS–Se solar cells. Energy Environ. Sci. 2015, 8, 3134–3159. [Google Scholar] [CrossRef]
  3. Kuo, D.H.; Wubet, W. Mg dopant in Cu2ZnSnSe4: An n-type former and a promoter of electrical mobility up to 120 cm2V−1s−1. J. Solid State Chem. 2014, 215, 122–127. [Google Scholar] [CrossRef]
  4. Green, M.A.; Emery, K.; Hishikawa, Y.; Warta, W.; Dunlop, E.D. Solar cell efficiency tables (version 47). Prog. Photovolt. Res. Appl. 2016, 24, 3–11. [Google Scholar] [CrossRef]
  5. Monsefi, M.; Kuo, D.H. Influence of Mg doping on electrical properties of Cu(In,Ga)Se2 bulk materials. J. Alloy. Compd. 2014, 582, 547–551. [Google Scholar] [CrossRef]
  6. Katagiri, H.; Jimbo, K.; Maw, W.S.; Oishi, K.; Yamazaki, M.; Araki, H.; Takeuchi, A. Development of CZTS-based thin film solar cells. Thin Solid Film. 2009, 517, 2455–2460. [Google Scholar] [CrossRef]
  7. Kim, S.Y.; Kim, J. Fabrication of CIGS thin films by using spray pyrolysis and post-selenization. J. Korean Phys. Soc. 2012, 60, 2018–2024. [Google Scholar] [CrossRef]
  8. Kamoun, N.; Bouzouita, H.; Rezig, B. Fabrication and characterization of Cu2ZnSnS4 thin films deposited by spray pyrolysis technique. Thin Solid Film. 2007, 515, 5949–5952. [Google Scholar] [CrossRef]
  9. Matur, U.C.; Akyol, S.; Baydoğan, N.; Cimenoglu, H. The Optical Properties of CIGS Thin Films Derived by Sol-gel Dip Coating Process at Different Withdrawal Speed. Procedia Soc. Behav. Sci. 2015, 195, 1762–1767. [Google Scholar] [CrossRef] [Green Version]
  10. Yeh, M.Y.; Lee, C.C.; Wuu, D.S. Influences of synthesizing temperatures on the properties of Cu2ZnSnS4 prepared by sol–gel spin-coated deposition. J. Sol-Gel Sci. Technol. 2009, 52, 65–68. [Google Scholar] [CrossRef] [Green Version]
  11. Caballero, R.; Haass, S.G.; Andres, C.; Arques, L.; Oliva, F.; Izquierdo-Roca, V.; Romanyuk, Y.E. Effect of Magnesium Incorporation on Solution-Processed Kesterite Solar Cells. Front. Chem. 2018, 6, 5. [Google Scholar] [CrossRef] [PubMed] [Green Version]
  12. Wang, C.; Chen, S.; Yang, J.H.; Lang, L.; Xiang, H.J.; Gong, X.G.; Walsh, A.; Wei, S.H. Design of I2-II-IV-VI4 Semiconductors through Element Substitution: The Thermodynamic Stability Limit and Chemical Trend. Chem. Mater. 2014, 26, 3411–3417. [Google Scholar] [CrossRef] [Green Version]
  13. Guo, Y.; Cheng, W.; Jiang, J.; Zuo, S.; Shi, F.; Chu, J. The structural, morphological and optical–electrical characteristic of Cu2XSnS4 (X:Cu,Mg) thin films fabricated by novel ultrasonic co-spray pyrolysis. Mater. Lett. 2016, 172, 68–71. [Google Scholar] [CrossRef]
  14. Zhong, G.; Tse, K.; Zhang, Y.; Li, X.; Huang, L.; Yang, C.; Zhu, J.; Zeng, Z.; Zhang, Z.; Xiao, X. Induced effects by the substitution of Zn in Cu2ZnSnX4 (X = S and Se). Thin Solid Film. 2016, 603, 224–229. [Google Scholar] [CrossRef] [Green Version]
  15. Chen, S.; Yang, J.H.; Gong, X.G.; Walsh, A.; Wei, S.H. Intrinsic point defects and complexes in the quaternary kesterite semiconductor Cu2ZnSnS4. Phys. Rev. B 2010, 81, 245204. [Google Scholar] [CrossRef] [Green Version]
  16. Siebentritt, S.; Schorr, S. Kesterites-a challenging material for solar cells. Prog. Photovolt. Res. Appl. 2012, 20, 512–519. [Google Scholar] [CrossRef]
  17. Ananthoju, B.; Mohapatra, J.; Jangid, M.K.; Bahadur, D.; Medhekar, N.V.; Aslam, M. Cation/Anion Substitution in Cu2ZnSnS4 for Improved Photovoltaic Performance. Sci. Rep. 2016, 6, 35369. [Google Scholar] [CrossRef]
  18. Fontané, X.; Calvo-Barrio, L.; Izquierdo-Roca, V.; Saucedo, E.; Pérez-Rodríguez, A.; Morante, J.R.; Berg, D.M.; Dale, P.J.; Siebentritt, S. In-depth resolved Raman scattering analysis for the identification of secondary phases: Characterization of Cu2ZnSnS4 layers for solar cell applications. Appl. Phys. Lett. 2011, 98, 181905. [Google Scholar] [CrossRef]
  19. Rudisch, K.; Davydova, A.; Platzer-Björkman, C.; Scragg, J. The effect of stoichiometry on Cu-Zn ordering kinetics in Cu2ZnSnS4 thin films. J. Appl. Phys. 2018, 123, 161558. [Google Scholar] [CrossRef]
  20. Bekki, B.; Amara, K.; Keurti, M.E. First-principles study of the new potential photovoltaic absorber: Cu2MgSnS4 compound. Chin. Phys. B 2017, 26, 076201. [Google Scholar] [CrossRef]
  21. Wei, M.; Du, Q.; Wang, R.; Jiang, G.; Liu, W.; Zhu, C. Synthesis of New Earth-abundant Kesterite Cu2MgSnS4 Nanoparticles by Hot-injection Method. Chem. Lett. 2014, 43, 1149–1151. [Google Scholar] [CrossRef]
  22. Huang, C.; Chan, Y.; Liu, F.; Tang, D.; Yang, J.; Lai, Y.; Li, J.; Liu, Y. Synthesis and characterization of multicomponent Cu2(FexZn1−x)SnS4 nanocrystals with tunable band gap and structure. J. Mater. Chem. A 2013, 1, 5402–5407. [Google Scholar] [CrossRef]
  23. Oueslati, H.; Rabeh, M.B.; Martin, J.; Kanzari, M. Structural, morphological and optical properties of Cu2ZnxFe1−xSnS4 thin films grown by thermal evaporation. Thin Solid Film. 2019, 669, 633–640. [Google Scholar] [CrossRef]
  24. Agawane, G.; Vanalakar, S.; Kamble, A.; Moholkar, A.; Kim, J. Fabrication of Cu2(ZnxMg1−x)SnS4 thin films by pulsed laser deposition technique for solar cell applications. Mater. Sci. Semicond. Process. 2018, 76, 50–54. [Google Scholar] [CrossRef]
  25. Azanza Ricardo, C.L.; Girardi, F.; Cappelletto, E.; D’Angelo, R.; Ciancio, R.; Carlino, E.; Ricci, P.C.; Malerba, C.; Mittiga, A.; Di Maggio, R.; et al. Chloride-based route for monodisperse Cu2ZnSnS4 nanoparticles preparation. J. Renew. Sustain. Energy 2015, 7, 043150. [Google Scholar] [CrossRef]
  26. Xu, Y.; Xiao, X. Accelerated microwave synthesis of magnesium sulfide with the pro-heating medium of graphite. J. Mater. Res. 1995, 10, 334–338. [Google Scholar] [CrossRef]
  27. Li, M.; Zhou, W.H.; Guo, J.; Zhou, Y.L.; Hou, Z.L.; Jiao, J.; Zhou, Z.J.; Du, Z.L.; Wu, S.X. Synthesis of Pure Metastable Wurtzite CZTS Nanocrystals by Facile One-Pot Method. J. Phys. Chem. C 2012, 116, 26507–26516. [Google Scholar] [CrossRef]
  28. Khadka, D.B.; Kim, J. Structural Transition and Band Gap Tuning of Cu2(Zn,Fe)SnS4 Chalcogenide for Photovoltaic Application. J. Phys. Chem. C 2014, 118, 14227–14237. [Google Scholar] [CrossRef]
  29. Khadka, D.B.; Kim, J. Band Gap Engineering of Alloyed Cu2ZnGexSn1−xQ4 (Q = S,Se) Films for Solar Cell. J. Phys. Chem. C 2015, 119, 1706–1713. [Google Scholar] [CrossRef]
  30. Malerba, C.; Biccari, F.; Azanza Ricardo, C.; Valentini, M.; Chierchia, R.; Müller, M.; Santoni, A.; Esposito, E.; Mangiapane, P.; Scardi, P.; et al. CZTS stoichiometry effects on the band gap energy. J. Alloy. Compd. 2014, 582, 528–534. [Google Scholar] [CrossRef]
  31. Singh, O.P.; Vijayan, N.; Sood, K.; Singh, B.; Singh, V. Controlled substitution of S by Se in reactively sputtered CZTSSe thin films for solar cells. J. Alloy. Compd. 2015, 648, 595–600. [Google Scholar] [CrossRef]
Figure 1. EDX atomic percentage trend for each nominal Zn content. Continuous lines correspond to KA series and dashed lines to KB series.
Crystals 10 00578 g001
Figure 2. X-ray diffraction (XRD) patterns of the KA series (left) and KB series (right) samples. MgS and wurtzite reference data were obtained from [26,27], respectively. Secondary phases’ peaks are identified with asterisks.
Crystals 10 00578 g002
Figure 3. Normalized deviation from the corresponding peak position of the Cu 2 ZnSnS 4 (CZTS) structure for selected reflections in terms of the samples’ Mg content. KA series (left) and KB series (right).
Crystals 10 00578 g003
Figure 4. Hydrodynamic size (DLS) and average crystalline domain size (XRD) for all samples’ trends with nominal Mg content variation.
Crystals 10 00578 g004
Figure 5. STEM images of the 25% Mg content samples: KA2 (left) and KB2 (right).
Crystals 10 00578 g005
Figure 6. E 04 plot in terms of the EDX Mg measured atomic ratio (left) and Tauc plot for the partially substituted samples of the KB series (right).
Crystals 10 00578 g006
Table 1. Samples’ IDs for each series. Energy dispersive X-ray spectroscopy (EDX) atomic percentage (fist block), atomic ratio results normalized to copper as 2 with their corresponding errors (second block), and cation ratios (third block). Expected ratios for Sn and S are 1 and 4, respectively.
EDX (At%)Expected RatiosEDX/Cu = 2Cation Ratios
IDCuZnMgSnSTotalZnMgZn Δ ZnMg Δ MgSn Δ SnS Δ S Cu Zn + Mg + Sn Zn + Mg Sn
KA125.149.22015.2450.40100100.730.16001.210.204.010.741.030.61
KA220.959.037.6712.1450.201000.750.50.860.100.730.181.160.144.790.680.731.38
KA318.626.0311.0912.2052.061000.5010.650.081.190.271.310.165.590.440.641.40
KA425.773.7410.2313.9246.351000.251.50.290.040.790.181.080.133.600.500.921.00
KA520.82028.6211.6138.9510002002.750.581.120.143.740.550.522.47
EDX (At%)Expected RatiosEDX/Cu = 2Cation Ratios
IDCuZnMgSnSTotalZnMgZn Δ ZnMg Δ MgSn Δ SnS Δ S Cu Zn + Mg + Sn Zn + Mg Sn
KB129.476.76014.8148.96100100.460.02001.000.043.320.161.370.46
KB225.915.593.2413.9551.301000.750.250.430.020.250.031.080.053.960.191.140.63
KB326.865.975.9114.2747.001000.500.50.440.020.440.041.060.053.500.171.030.83
KB425.981.507.2615.0450.211000.250.750.120.010.560.051.160.053.870.191.090.58
KB528.9407.8015.2248.0410001000.540.041.050.053.320.161.260.51
Table 2. Hydrodynamic size obtained from dynamic light scattering (DLS) measurements and average crystalline domain size calculated from XRD profiles.
KA Series Size (nm)KB Series Size (nm)
ID DLS p 1 DLS p 2 XRD XRD e r r ID DLS p 1 DLS p 2 XRD XRD e r r
KA1223.4-12.90.2KB1272.5-38.90.4
KA2193.3-10.00.1KB2264.8-33.20.3
KA327.1208.69.40.1KB350.7198.225.90.2
KA460.5161.29.40.1KB433.0334.928.40.2
KA558.7187.65.60.1KB551.0123.912.10.1
Table 3. E 04 values for all samples.
Sample E 04 (eV)Sample E 04 (eV)
KA11.24KB11.42
KA21.88KB21.07
KA31.96KB31.50
KA42.49KB41.60
KA52.56KB51.96