Review

Nuclear Quadrupole Resonance (NQR)—A Useful Spectroscopic Tool in Pharmacy for the Study of Polymorphism

1
Institute of Mathematics, Physics and Mechanics, 1000 Ljubljana, Slovenia
2
Faculty of Pharmacy, University of Ljubljana, 1000 Ljubljana, Slovenia
3
Faculty of Electrical Engineering, University of Ljubljana, 1000 Ljubljana, Slovenia
4
Jožef Stefan Institute, 1000 Ljubljana, Slovenia
*
Author to whom correspondence should be addressed.
Deceased.
Crystals 2020, 10(6), 450; https://doi.org/10.3390/cryst10060450
Submission received: 30 January 2020 / Revised: 1 April 2020 / Accepted: 22 May 2020 / Published: 31 May 2020
(This article belongs to the Special Issue NQR of Polymorphic Crystals)

Abstract

:
Nuclear Quadrupole Resonance (NQR) spectroscopy has been known for 70 years. It is suitable for the study of measured (poly)crystalline chemical compounds containing quadrupole nuclei (nuclei with spin I ≥ 1) where the characteristic NQR frequencies represent the fingerprints of these compounds. In several cases, 14N NQR can distinguish between the polymorphic crystalline phases of active pharmaceutical ingredients (APIs). In order to further stimulate 14N NQR studies, we review here several results of API polymorphism studies obtained in Ljubljana laboratories: (a) In sulfanilamide, a clear distinction between three known polymorphs (α, β, γ) was demonstrated. (b) In famotidine, the full spectra of all seven different nitrogen positions were measured; two polymorphs were distinguished. (c) In piroxicam, the 14N NQR data helped in confirming the new polymorphic form V. (d) The compaction pressure in the tablet production of paracetamol, which is connected with linewidth change, can be used to distinguish between producers of paracetamol. We established that paracetamol in the tablets of six different manufacturers can be identified by 14N NQR linewidth. (e) Finally, in order to get an extremely sensitive 14N NQR spectrometer, the optical detection of the 14N NQR signal is mentioned.

1. Introduction

Active pharmaceutical ingredients (API), which most often occur in solid form, are in some cases prone to crystallization in different crystalline forms—they form polymorphs [1,2,3]. The formation of polymorphs profoundly affects relevant pharmaceutical properties such as stability, solubility and bioactivity. To distinguish between possible polymorphs, solid state analytical techniques such as powder XRD, IR and Raman spectroscopy or solid-state NMR spectroscopy are needed instead of the more usual solution-based analytical methods. In this work, we demonstrate the potential of another radiofrequency (RF) spectroscopy—Nuclear Quadrupole Resonance (NQR) [4,5,6,7]—for the contactless, nondestructive quantitative determination of polymorphic phases in several APIs.
NQR is most similar to NMR and is sometimes described as NMR without a magnetic field. While the resonance line frequency in NMR is determined primarily by the interaction of non-zero nuclear spin I ≥ ½ with an external magnetic field B0, NQR is based on the interaction between the tensor of the non-symmetric charge distribution eQ of the nucleus with the nuclear spin I ≥ 1 and the tensor of internal electric field gradient (EFG) V, leading to the quadrupole energy term in the Hamiltonian H   = eQV. The EFG is determined by the surrounding electric charge distribution at the site of a nucleus in the crystal lattice.
For the (poly)crystalline sample with the same local coordinate axes as the principal axes (X,Y,Z) of the EFG tensor V, we have VXZ = VYZ = VXY = 0 for these EFG tensor components. If we choose |VZZ| ≥ |VXX| ≥ |VYY|, define the asymmetry parameter η = (VXX − VYY)/ VZZ and write for the maximal component of the EFG tensor VZZ = ∂2V/∂z2 = eq, we obtain for the quadrupole Hamiltonian [4,5,6]
H   =   e 2 q Q 4 I ( 2 I 1 ) { 3 I z 2 I ( I + 1 ) + 1 / 2 η ( I + 2 I 2 ) }
Here, e2qQ/h = QCC is the quadrupole coupling constant, where eQ is the nuclear electric quadrupole moment, eq = Vzz is the maximal component of the electric field gradient tensor, e is the elementary charge and h is Planck’s constant. The asymmetry parameter η is a measure of the deviation of the EFG tensor from axial symmetry; it takes values between 0 and 1.
Nitrogen (14N) with spin I = 1 is the most common quadrupole nucleus in organic chemical compounds and in APIs. Therefore, it is convenient to use the 14N and its nuclear quadrupole interaction to obtain quadrupole energy levels and the allowed transitions between them. Figure 1 shows, schematically, the 14N NQR energy levels with transitions between them. The corresponding quadrupole frequency set (QFS) is then written as [4,5,6]:
ν + = e 2 q Q 4 h ( 3 + η ) ,     ν = e 2 q Q 4 h ( 3 η ) ,     and   ν 0 = e 2 q Q 2 h η
Equation (2) shows that for each nonequivalent nitrogen nucleus (Figure 1b) in the crystal unit cell, there is a triplet of resonance lines ( ν + , ν , ν 0 ) in the 14N NQR spectrum. The frequencies ( ν + , ν , ν 0 ) are determined by eQ, which is a property of the nitrogen nucleus, and by the EFG magnitude eq and asymmetry parameter η, which depend on the electric charge distribution in the chemical bond as well as on the arrangement of crystal forming entities (atoms, ions, molecules) in the vicinity of the nucleus. This gives rise to the unique connection between the 14N NQR frequencies (Equation (2)) and the crystalline structure. Therefore, the quadrupole resonance spectrum is a fingerprint of a particular chemical compound and its crystalline structure. The relationship between NQR frequency and crystalline structure is often used in solid state physics. For example, almost every quadrupole nucleus can be and has been used in phase transitions research [8]. On the other hand, there are two applications where the quadrupole nucleus is most often nitrogen: the contactless (nondestructive) detecting of illicit materials (explosives, narcotics and counterfeit medicines) [9] and pharmaceutical applications [10].
Although NMR and NQR are somewhat related RF spectroscopies, both in underlying principles as well as in instrumentation, there are also fundamental differences. Unlike in NMR, there is no external magnetic field in NQR. Consequently, resonance frequencies do not depend on the orientation of grains in powder samples. Polycrystalline powder and mono-crystals thus produce the same sharp NQR lines. For new samples, finding the resonance frequency may be a challenge, requiring the help of the NQR data library [11] or theoretical calculations [12].
Like NMR, NQR is a quantitative method, meaning that the given signal intensity is proportional to the number of nuclei with the corresponding resonance frequency. Since, for example, the hydration of a substance significantly shifts the resonance, it is possible to monitor the hydration process, as recently demonstrated both by 35Cl NQR [13] and 14N NQR [14].
The NQR frequencies are typically very strongly dependent on temperature and pressure changes. Pharmaceutical companies typically compact the tablets using different pressures. It is thus possible to discriminate between drugs produced by different producers [15] and even between different batches by the same producer [16]. The same principle was used to successfully detect counterfeit medicines.
The normally measured 14N NQR lines are found at very low frequencies (0.5–4 MHz). Hence, the signal-to-noise (S/N) ratio is in some cases very low and measurements may require the excessive averaging of the signal scans. In such cases, the indirect detection of 14N NQR resonances is possible by measuring the proton NMR signal in various Nuclear Quadrupole Double Resonance experiments (NQDR). Although NQDR requires smaller samples, and spectra with good S/N can be acquired quickly, a significant line broadening is observed because an external magnetic field is required [17,18,19,20].
Instead of measuring quadrupole frequencies by NQR, equivalent information can sometimes be obtained from the determination of quadrupole coupling by ultra-wide-line static powder 14N NMR at high magnetic fields [21]. However, this method is limited to samples with a very small number of nonequivalent nitrogen atoms in the unit cell.
Several studies of 35Cl NQR [22,23] and 14N NQR [10,24] have shown that it is possible to distinguish between different polymorphic forms of APIs. Although nitrogen is the most prevalent quadrupole nucleus in solid APIs, the application of 14N NQR is still scarce. Several comprehensive 14N pure NQR studies of polymorphism in APIs conducted in recent years by research labs located in Ljubljana have shown that it is a viable complementary method to other spectroscopic methods.
To get more researchers acquainted with this application, we present here a survey of some of these detailed studies: 14N NQR research on polymorphism in sulfanilamide [25], famotidine [26], piroxicam [27,28] and paracetamol [15]. In all cases, polymorphism was confirmed by the X-ray diffraction (XRD) first.
Finally, some improvements in the low frequency (below 1 MHz) 14N NQR instrumentation [29,30,31,32,33] are described in this review article.

2. Examples of 14N NQR Studies of Polymorphism

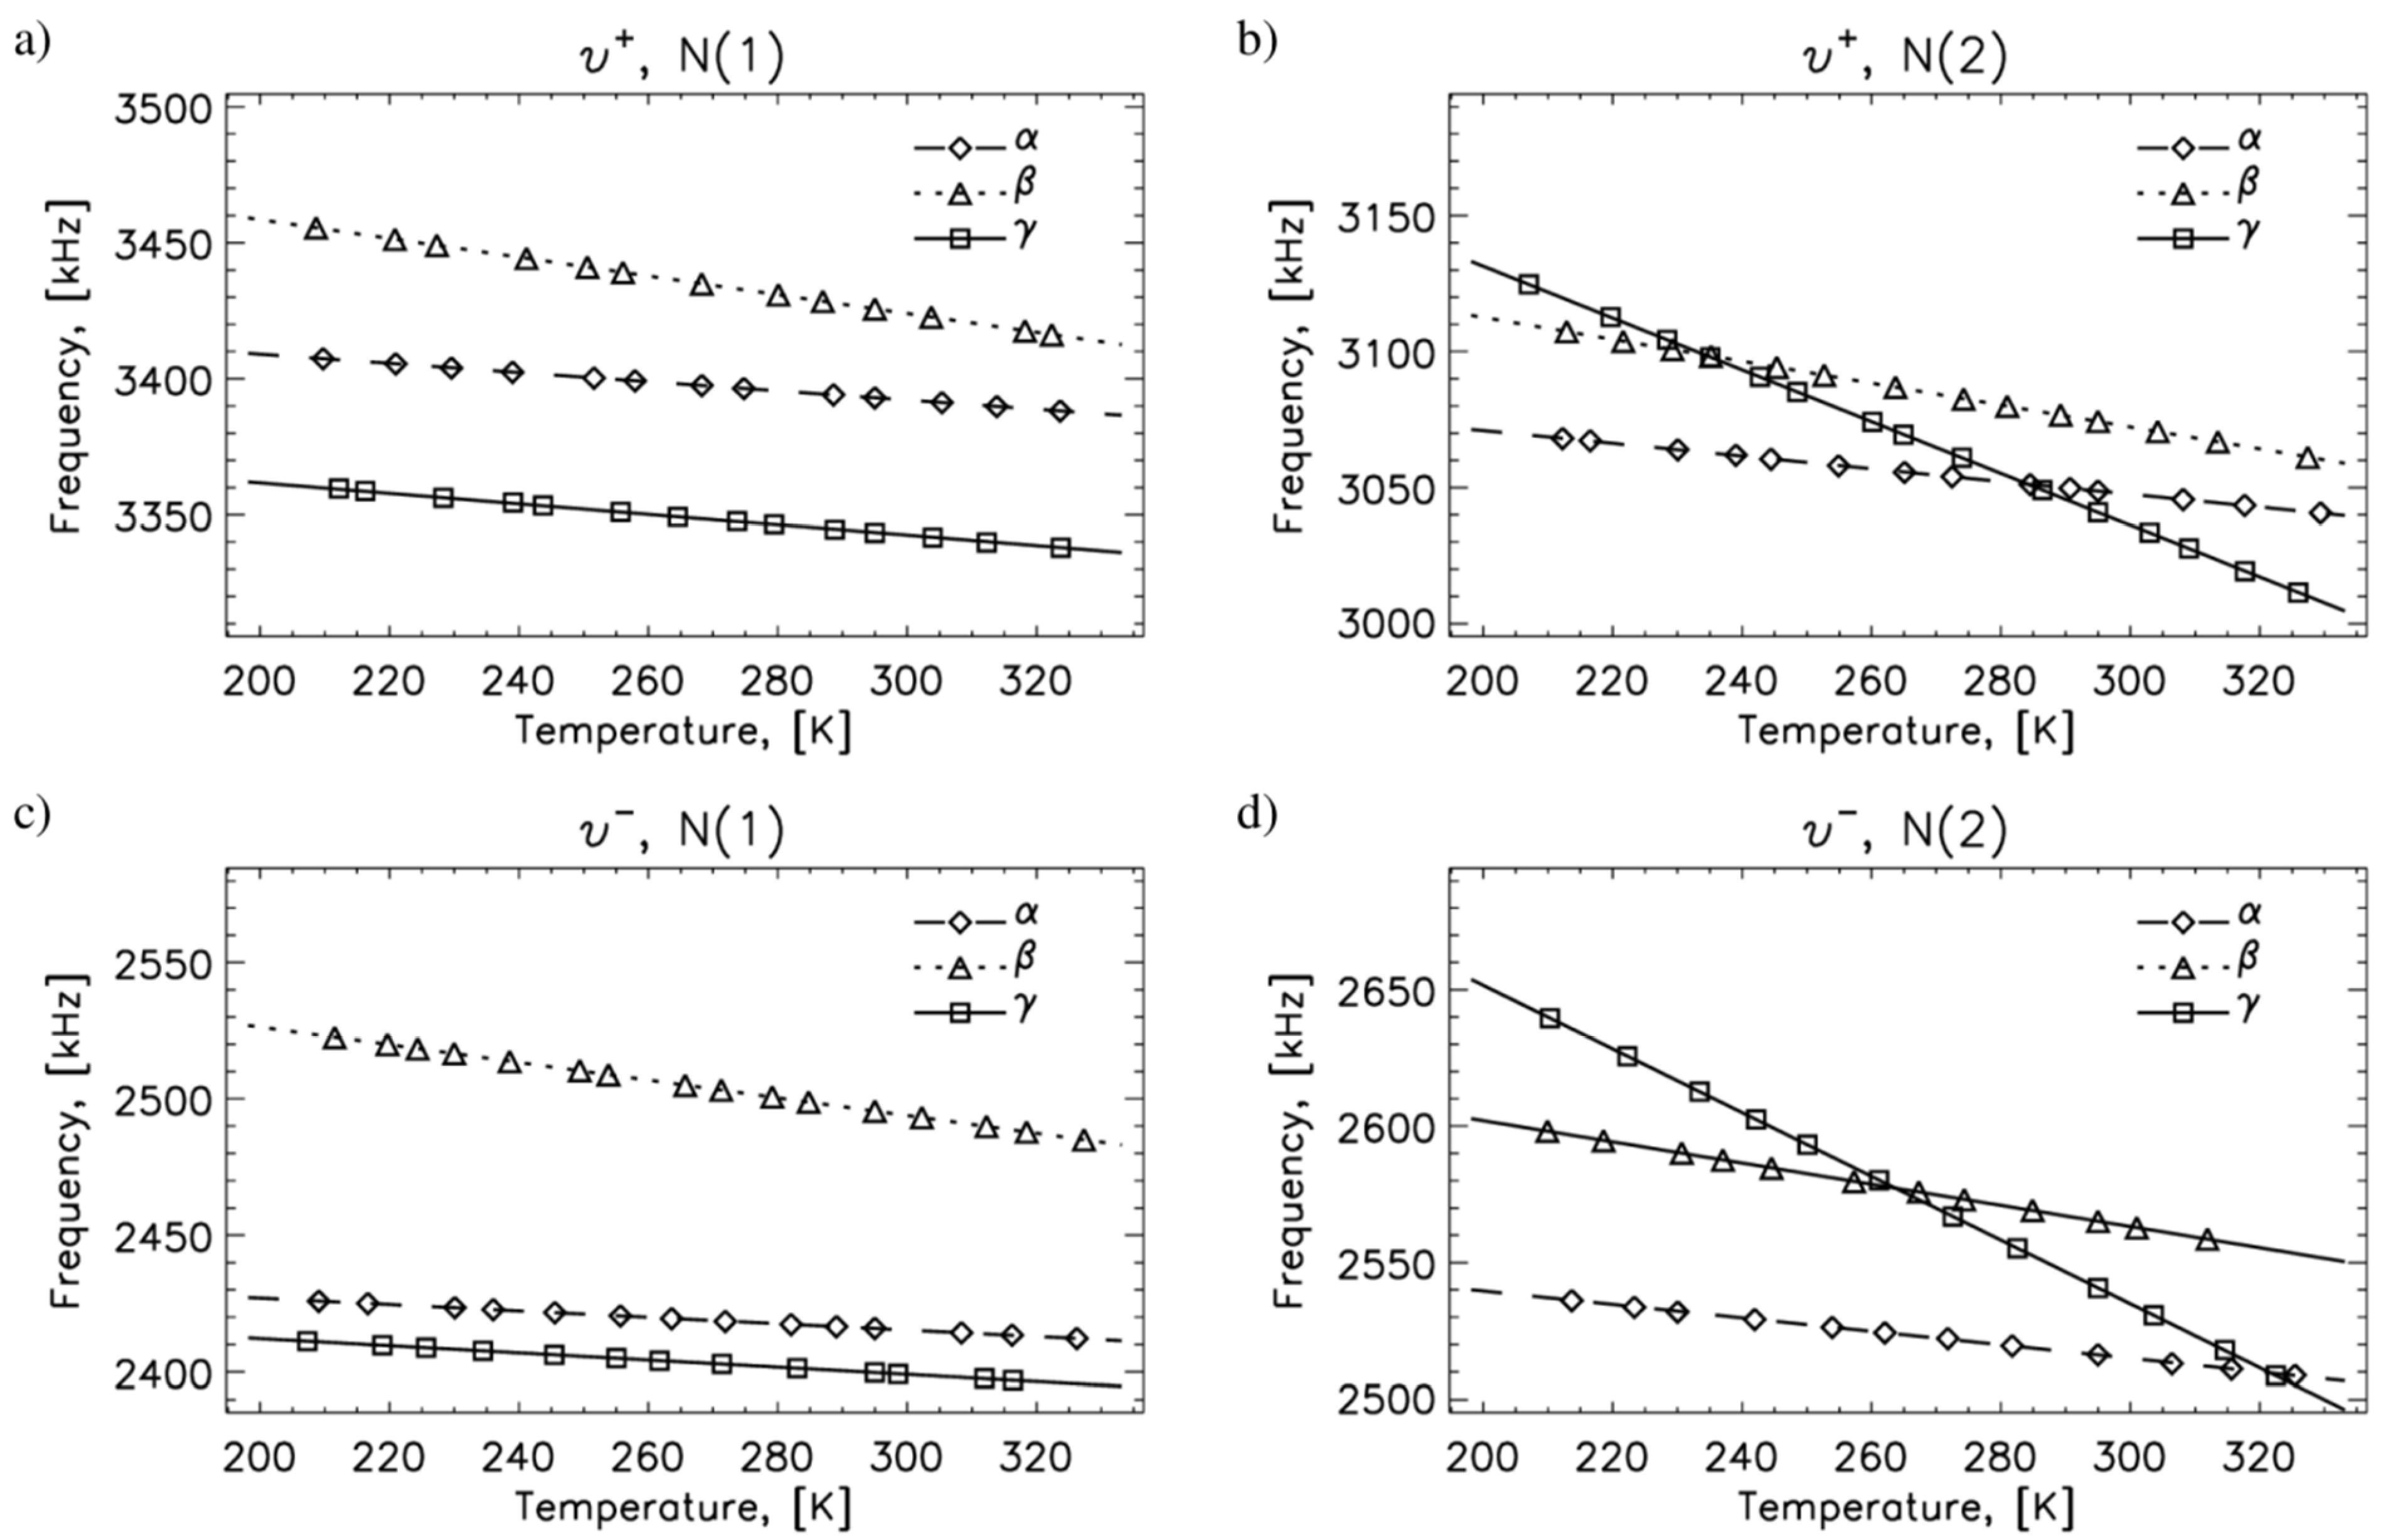
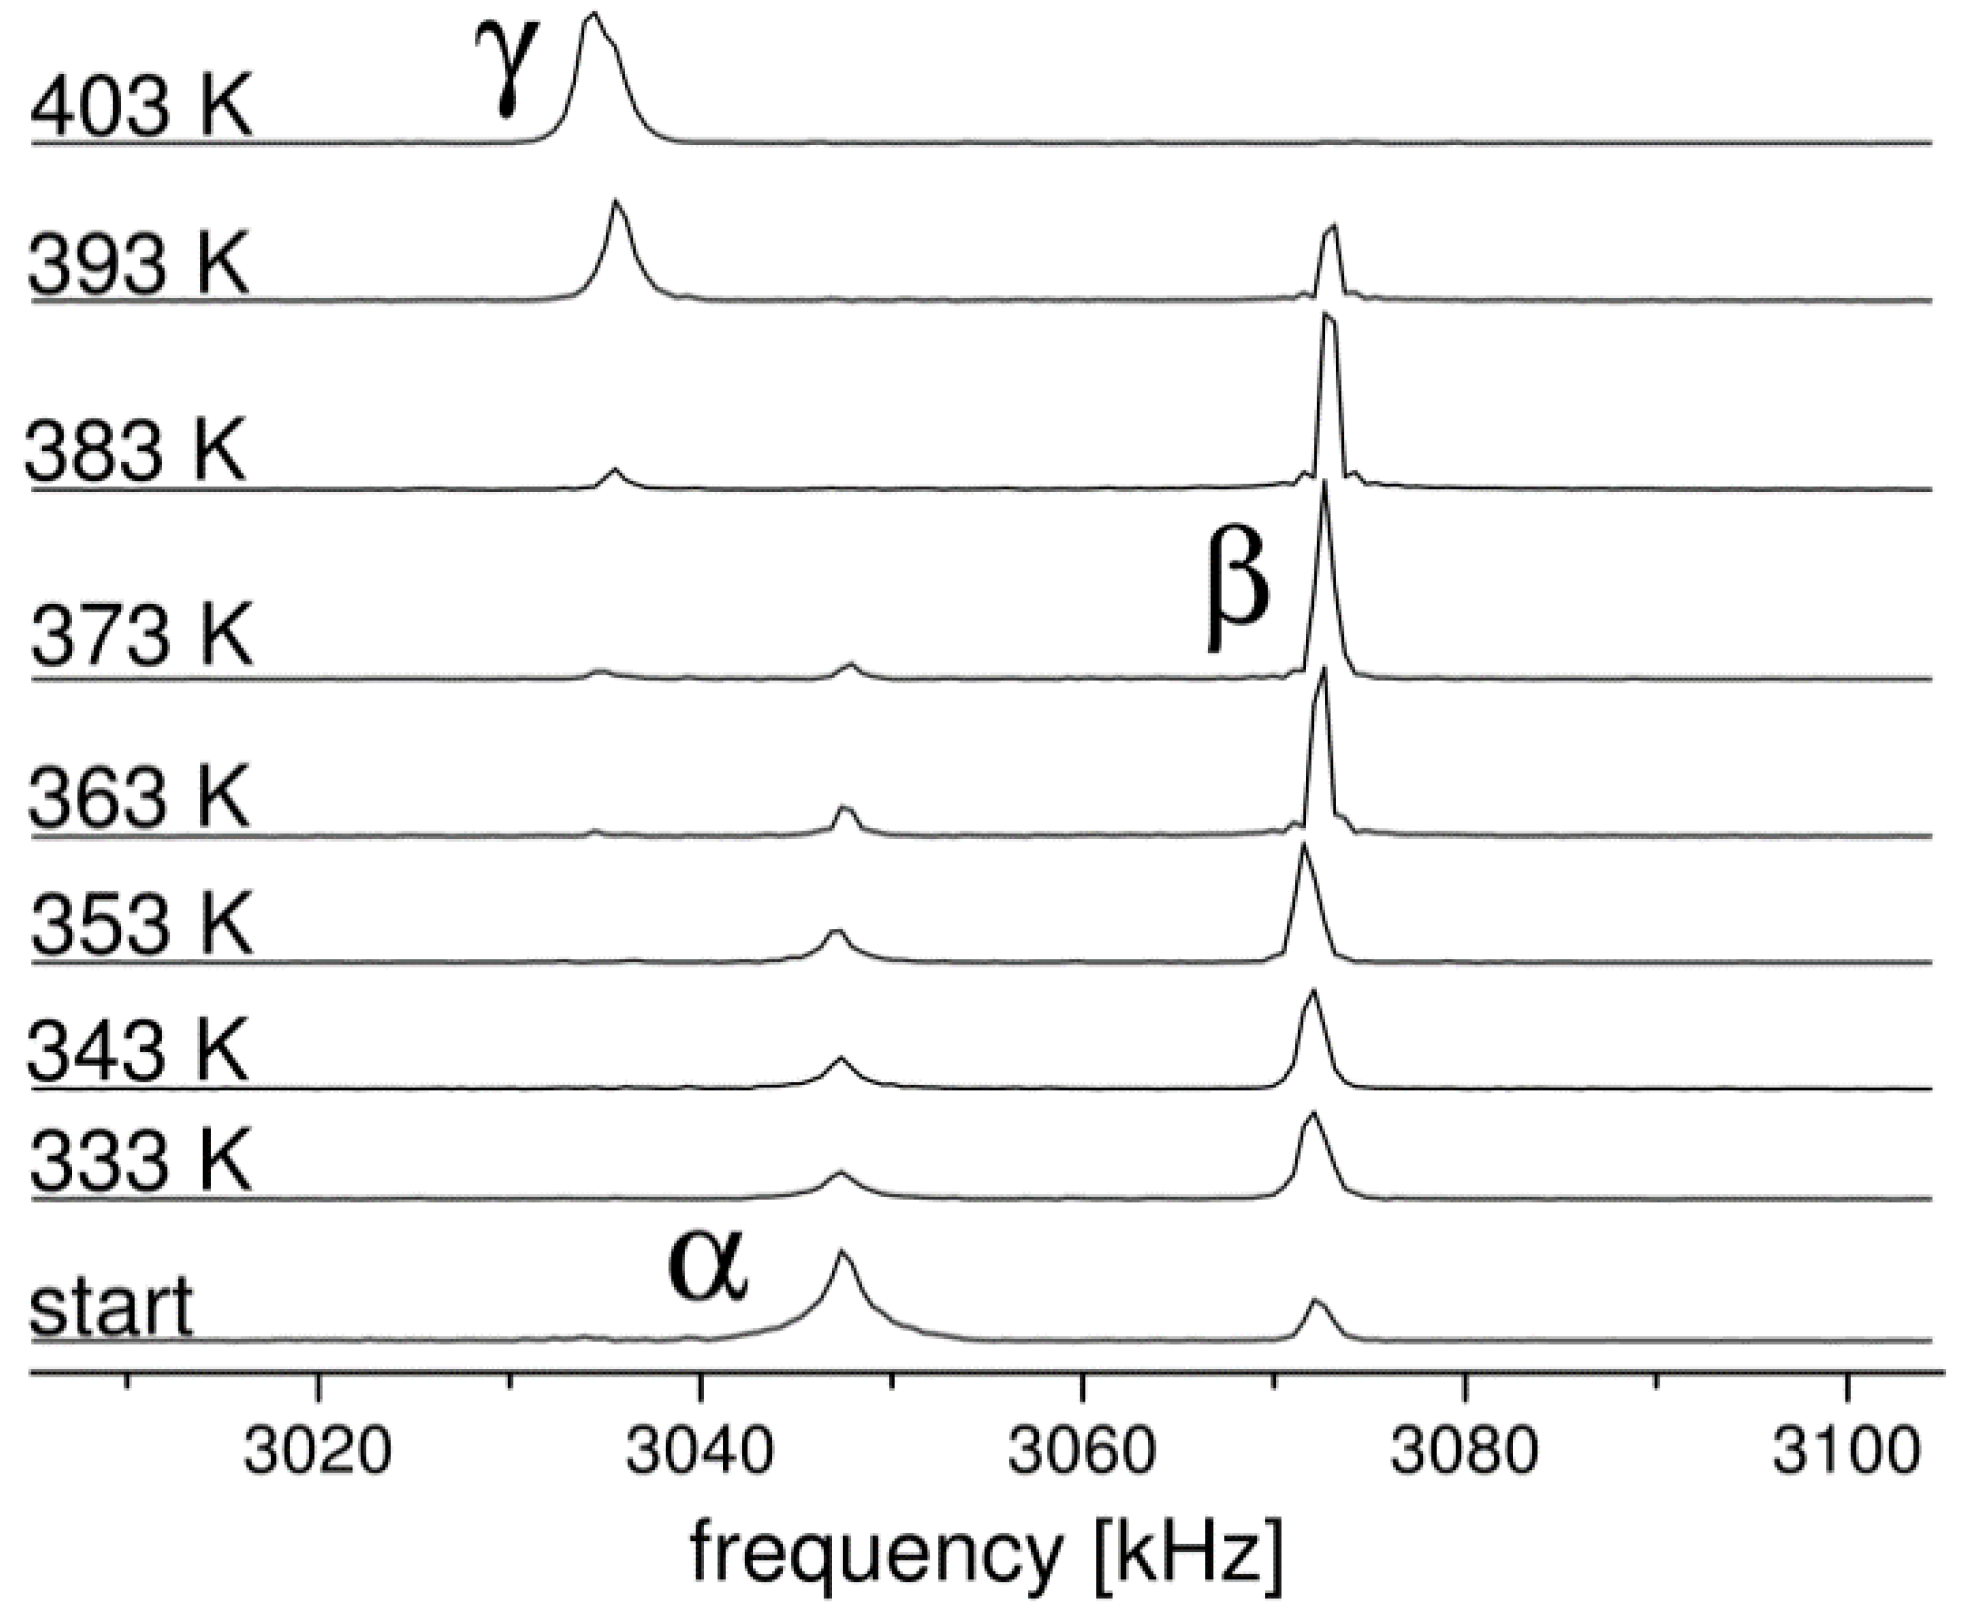
2.1. 14N NQR in Sulfanilamide

Sulfanilamide is a well-known anti-inflammatory medicament with a confirmed appearance of polymorphism: α-, β- and γ-polymorphs of sulfanilamide were confirmed with different experimental techniques [34,35,36]. The first indication of possible polymorphism in sulfanilamide, based on an observation with an optical microscope, was published in 1938 [37].
Toscani et al. obtained, in 1996 [38], the relation E α E γ E β   by the lattice energy determination using the atom–atom potential (AAP) method and thermodynamic data for all three polymorphs. Hence, the β -polymorph is the most stable polymorph. Several spectroscopic methods like IR [39], NMR (1H, 13C 15N) [40] and DTA [41,42] were used to further elucidate polymorphism in sulfanilamide.
The first NQR studies on the sulfanilamide β-polymorph were done in 1978 by S.N. Subbarao and P.J. Bray [43], and these measurements belong to the early application of 14N NQR. R. Blinc et al. [44] studied a group of sulfa drugs by 14N NQR. The sulfanilamide β-polymorph and one other non-specified sulfanilamide polymorph were included, demonstrating the power of 14N NQR in pharmaceutical research.
To proceed a step further, we extended these 14N NQR applications in pharmacy, and we systematically studied the 14N NQR of α-, β- and γ-sulfanilamide polymorphs. The molecule of sulfanilamide (Figure 1b) has two chemically nonequivalent nitrogen atoms: the para amino nitrogen N(1) and the sulfonamide nitrogen N(2). Therefore, we expect two sets of three transition frequencies ( ν + ,   ν ,   ν 0 ) for each polymorph. The α- and β-polymorphs were prepared from different solvents and subsequent evaporation/crystallization [25,34,35,40,44]. Using different solvents can lead to the occurrence of different polymorphs, as was observed by several researchers [40,44,45]. The three polymorphs of sulfanilamide (α, β and γ) [35] were prepared by the recrystallization of commercially available sulfanilamide (Sigma-Aldrich): (i) in 3-methyl−1-butanol or n-butanol for the α-polymorph and (ii) in ethanol for the β-polymorph. At temperatures above approximately 400 K, these two polymorphs exist no more; only the γ-polymorph is left. The monotropic transition temperature from the α to γ form (at about 380 K) is slightly lower than from the β to γ form (at about 385 K) [34,35]. The third polymorph, γ, was prepared simply by the controlled heating of the β-polymorph at 403 K for approximately 30 min. All three polymorphs are stable at room temperature.
The measured 14N NQR frequencies are clearly different for each polymorph and for each non-equivalent nitrogen molecule, as expected (Figure 2). For each polymorph, two sets of three lines (one for N(1) and one for N(2)) were obtained. In the lowest track of Figure 3, it can be seen that the sample prepared as the α -polymorph contained a small admixture of the β-polymorph. These measurements were taken with a standard pulse NQR spectrometer, operated from a PC. Technical details are published in [25] and [46]. All the results were obtained at room temperature and are presented in Table 1.
The temperature dependence of the ν + and ν 14N NQR transition frequencies for the nitrogen atoms N(1) and N(2) for all three sulfanilamide polymorphs were measured in the temperature interval 210–330 K and are shown in Figure 4.
Differential scanning calorimetry (DSC) measurements [42] have determined α to γ transition at 380 K and β to γ transition at 385 K. The transition frequencies of 14N NQR with their temperature dependences have been used to obtain, non-destructively, the following information [25]:
“Sulfanilamide α- and β- samples were heated under controlled conditions in 10 K steps up to 400 K prior to NQR measurements. The elevated temperature was maintained for approx. 60 min. After each step the sample was spontaneously cooled to room temperature where the elevated-temperature polymorphic forms freeze in. Then 14N NQR spectra were recorded. For easy quantitative interpretation, all the NQR spectra were measured at the room temperature. The measurements started with nominally pure sulfanilamide α-polymorph. The evolution of 14N NQR spectra of the nitrogen N(2) and transitions between different polymorphic forms are shown in Figure 5. This Figure shows that the starting sample was a mixture of α- and a small amount of β-polymorph. Stepwise increase in the temperature of thermal treatment before each measurement triggers a gradual transition of α- polymorph to β-polymorph. The 14N NQR line height for the α- polymorph is decreasing and the 14N NQR line height for the β -polymorph is simultaneously increasing. At about 380 K the α- polymorph disappears completely. The areas under the 14N NQR lines (line-shape integrals) of a studied sample were determined after a chosen temperature treatment. Assuming the validity of the expression (3), fractions all three polymorphs were obtained (Figure 6), where a, b, c are the coefficients, pα , pβ, pγ are the line-shape integrals of the relevant lines, and the products apα , bpβ, cpγ are the fractions of different polymorphs
a p α + b p β + c p γ = 1
At temperature about 400 K, β-polymorph is transformed to γ-polymorph. While the α−to γ- transition temperature obtained from 14N NQR, is the same as the one obtained by the DSC measurement [38,42], the β- to γ- transition temperature obtained from 14N NQR measurements is about 10 K higher. From Figure 3 and Figure 6 it is additionally evident that α-polymorph is not abundantly directly transformed to γ-polymorph, but preferably via the formation of intermediate β-polymorph that then transforms into γ-polymorph. We can notice that the scan at 363 K showed already the appearance of γ-polymorph, i.e., before all α-polymorph was transformed to β-polymorph”.
Table 1 demonstrates that all the measured 14N NQR data convincingly differ for all three polymorphs. The view into the lattice dynamics of the N(1) and N(2) nitrogen atoms and their surroundings for the α- and β-polymorphs via the spin-lattice relaxation time, T 1 , measurements is additional information. It is a valuable supplement to the 13C and 15N NMR magic angle spinning data (chemical shifts) as well as the corresponding T 1   data for all three polymorphs [40].
Article [25] concludes with “14N NQR studies demonstrate that we were dealing with the room temperature stable forms of all three polymorphs. We could repeat 14N NQR measurements on all polymorphs during our several years lasting studies of sulfanilamide, provided the polymorph samples were thoroughly protected from the influence of laboratory environment. Prior to applying our experimental protocol, a mixture of α-and β-polymorphs was observed in our starting materials (Figure 3 and Figure 5). Having a stable mixture of sulfanilamide polymorphs, estimation of the contents of α -, β- and γ-sulfanilamide polymorphs is possible, using 14N NQR spectra”.

2.2. 14N NQR in Famotidine

14N NQR spectra are much more complex for API molecules, which contain several non-equivalent nitrogen atoms [47], each of which contributes a quadrupole frequency set (QFS) of three characteristic 14N NQR lines.
As an example, we consider the API famotidine and application of 14N NQR in famotidine study.
A 2D projection of the famotidine molecule [48,49,50] is shown in Figure 7: the non-equivalent nitrogen atoms take seven positions in the famotidine molecule, and there are two famotidine polymorphs (A and B). Therefore, we expect seven QFSs of the lines ν+, ν and ν0 for each polymorph. Both famotidine polymorphs crystalize in monoclinic symmetry with four molecules per unit cell and are stable at room temperature.
The famotidine polymorph B was obtained at pharmaceutic grade on the local market. The polymorph A was prepared according to the references [50,51]. FTIR and DSC methods were used to prove the quality of the so prepared polymorph A.
The same NQR instrumentation, data acquisition and processing described in [25,26,46] were used in this research. The relatively long relaxation times T1 and T2 allowed the application of the MPSE technique [25,46,52] with up to 20 echoes in a single sequence. This multiplies the number of averages and improves the final S/N ratio.
Prior to the assignment of 14N NQR frequencies belonging to seven non-equivalent nitrogen atoms in polymorphs A and B of famotidine, these steps were followed:
“Step 1. Approximate frequencies of some of the resonance lines in famotidine A and B were found rather weak by the double resonance technique NQDR [18,19,53,54,55]. Thus, to unravel all the nitrogen NQR lines and their ν+0 connections using pure NQR, careful frequency scans and numerous trials of the most probable combinations into tentative quadrupole sets were necessary. Measurement of the NQR lines shapes in a low magnetic field [56] was also performed to discriminate between the ν+ character of the newly found lines, and to choose the probable region for further search for the missing lines.
The measured 14N NQR transition frequencies at room temperature and the calculated EFG parameters are collected in Table 2.
The correspondence of the successive quadrupole frequencies sets (QFS-s), i.e. the rows in the upper half of Table 2, to nitrogen atoms in the molecule A is in general different from the correspondence of QFS-s in the lower half of Table 2 to nitrogen atoms in the folded molecule B (see Figure 7).
Step 2. A tentative assignment was performed considering two criteria:
(i)
relative mutual similarity of the two chosen QFS-s when passing from polymorph A to B and their resemblance to QFS-s of known NQR spectra of other compounds with similar local molecular structure [43,57,58];
(ii)
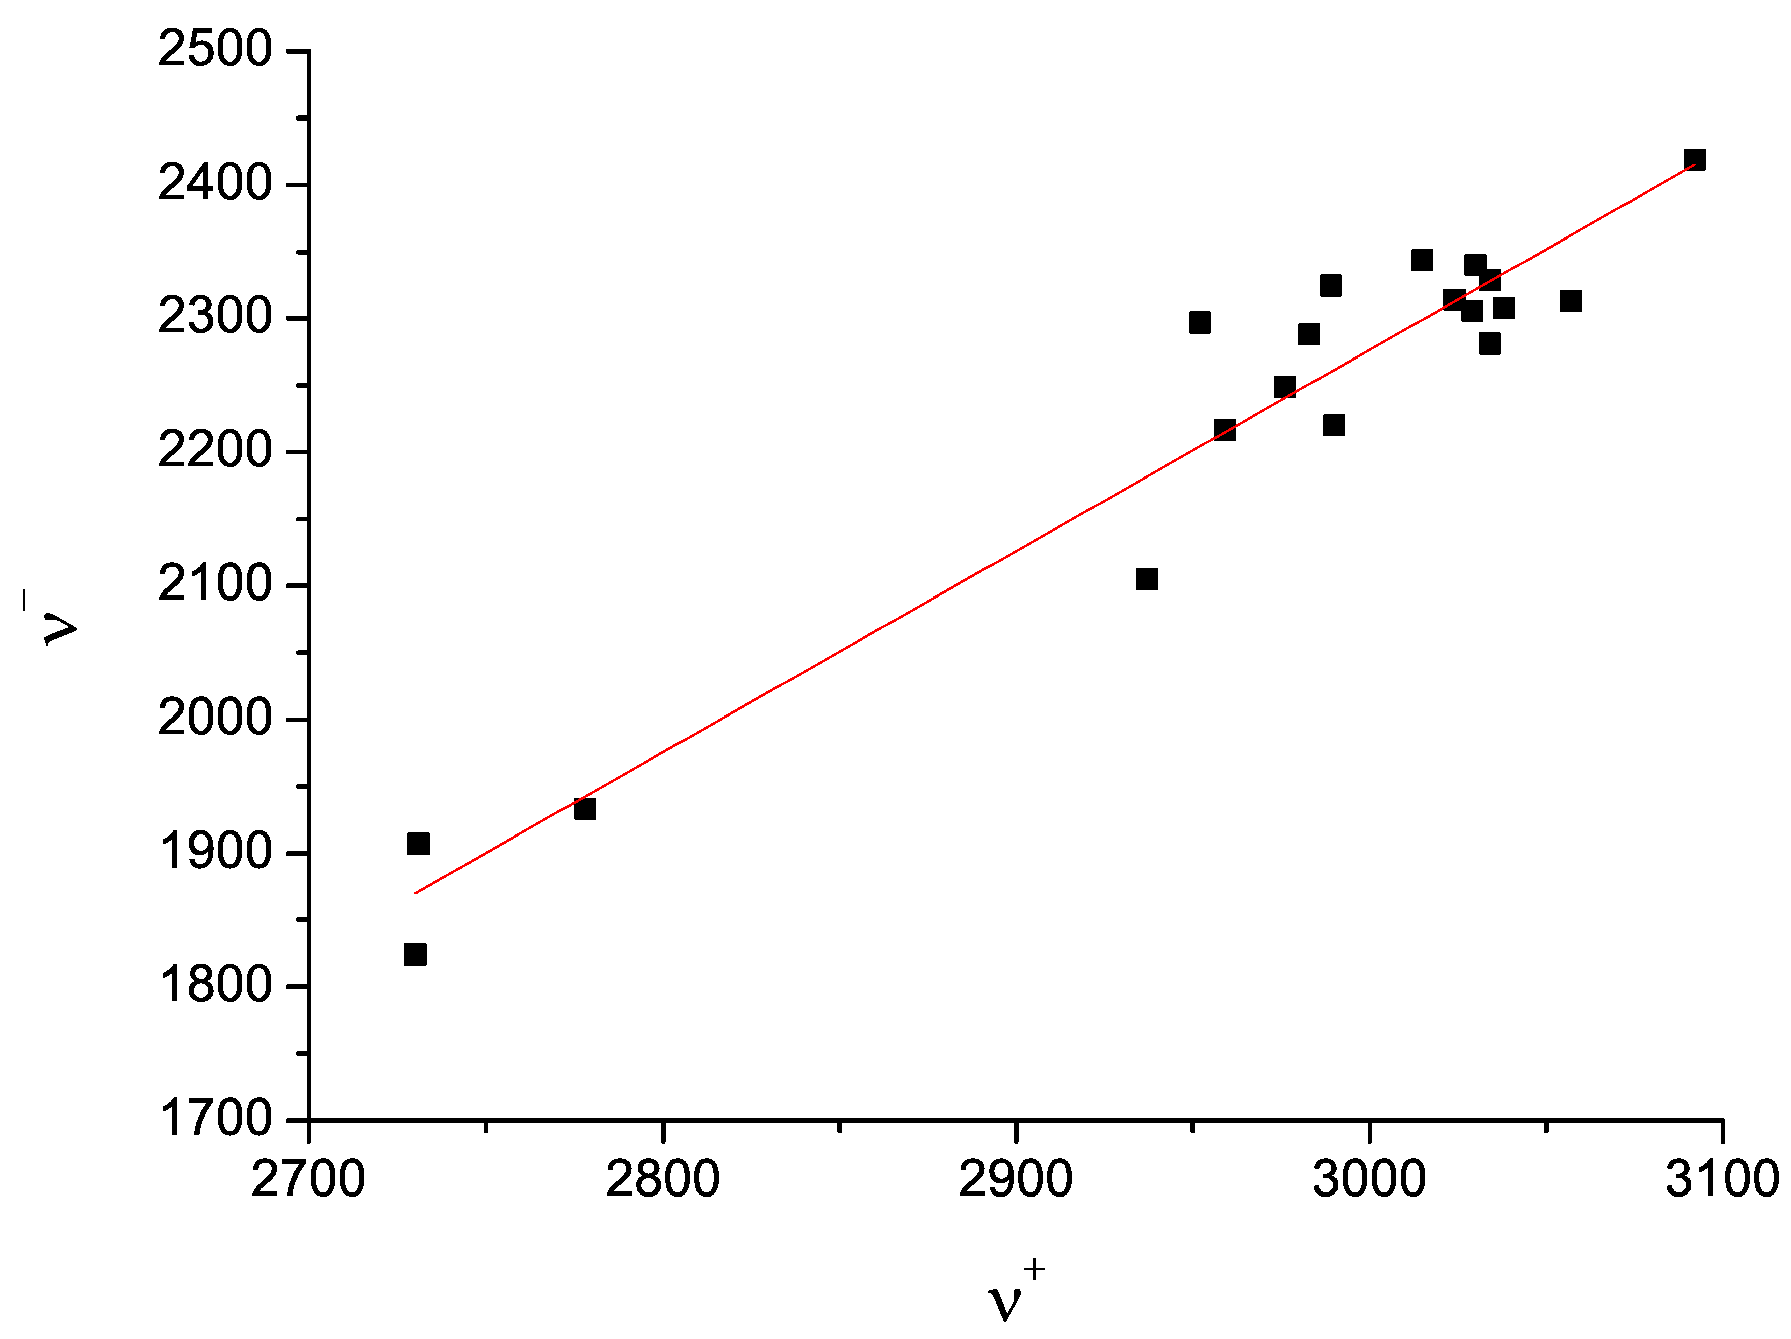
the correlation between the two pairs ν+ of the two tentatively equivalent nitrogen sites of the polymorphs A and B, should agree with the same empirically confirmed ν+ correlation, characteristic for many other molecules, containing the relevant structurally equivalent nitrogen surroundings [43,44,58,59,60,61] (cf. Figure 8)”.
To illustrate this approach, we cite the procedure of the assignment of the two nitrogen atoms with the highest QCC (see Table 2): “One in the polymorph A and the other in polymorph B. Arguments for other 6 good or some questionable correlations are in [26].
Lines Na, Nh −> N18. The two highest QCC-s belong to the line sets Na of polymorph A and Nh of polymorph B in the Table 2. Both tensors resemble those of the sulfonamide group in sulfanilamide and similar compounds [25,43,44,58]. Therefore, the QFS-s Na (polymorph A) and Nh (polymorph B) – both lying near the frequencies ν+~3.5 MHz, ν~2.5 MHz and ν0~1 MHz – are ascribed to the S17—N18H2 nitrogen atom, located in the “sulfa” tail of the famotidine molecule (criterion (i))”.
There is also one open assignment left [26]: “Two nitrogen atoms remain undetermined: N6 on the “guanidine” side of the famotidine chain (group C7==N6—C2) and N16 on the “sulfa” side (group C14==N16—S17). With our present understanding these two nitrogen atoms could only be alternatively connected with any of the remaining QFS-s Nf or Nd of polymorph A and with Nl or Nj of polymorph B”. For details, see reference [26].
It can be seen that not all seven identifications of nitrogen atoms are firm, but regarding the characterization of both famotidine polymorphs in an unknown famotidine sample, there is no uncertainty. It is enough “to select a very narrow frequency interval covering only two closely lying 14N NQR transition frequencies - one for each polymorph. The intensities of different 14N NQR transition lines and also their relaxation properties are not equal. The best choice is to select a pair with the maximal intensity which allows the greatest number of echoes in a single multi-pulse sequence. According to reference [26] such pairs of lines are: 2603 kHz, 2862 kHz and 3455 kHz of polymorph A and 2587 kHz, 2887 kHz and 3462 kHz of polymorph B. Each of the three pairs of 14N NQR transition lines can be observed simultaneously in the same spectral region for both polymorphic forms (Figure 9). From the 14N NQR spectra it is possible to quantify the polymorphic form and its purity. Additionally, for samples of heterogeneous mixtures of polymorphs and excipients it is possible to determine the concentration of different polymorphs. This is of special interest in studying transitions from one polymorphic form to the other [26]”.
The study of the drug Ulfamid (Krka, Pharmac. Comp., Slovenia), containing famotidine, pointed to an interesting effect. The authors in [26] observed: “14N NQR measurements of Ulfamid sample demonstrated the presence of famotidine polymorph B. The 14N NQR lines were broader compared to the lines of powder famotidine (Figure 10). It was concluded that the deformation of grains during the tablets preparation process may be the reason for the linewidth increase”. The detailed study of this phenomenon is described in Section 2.4.

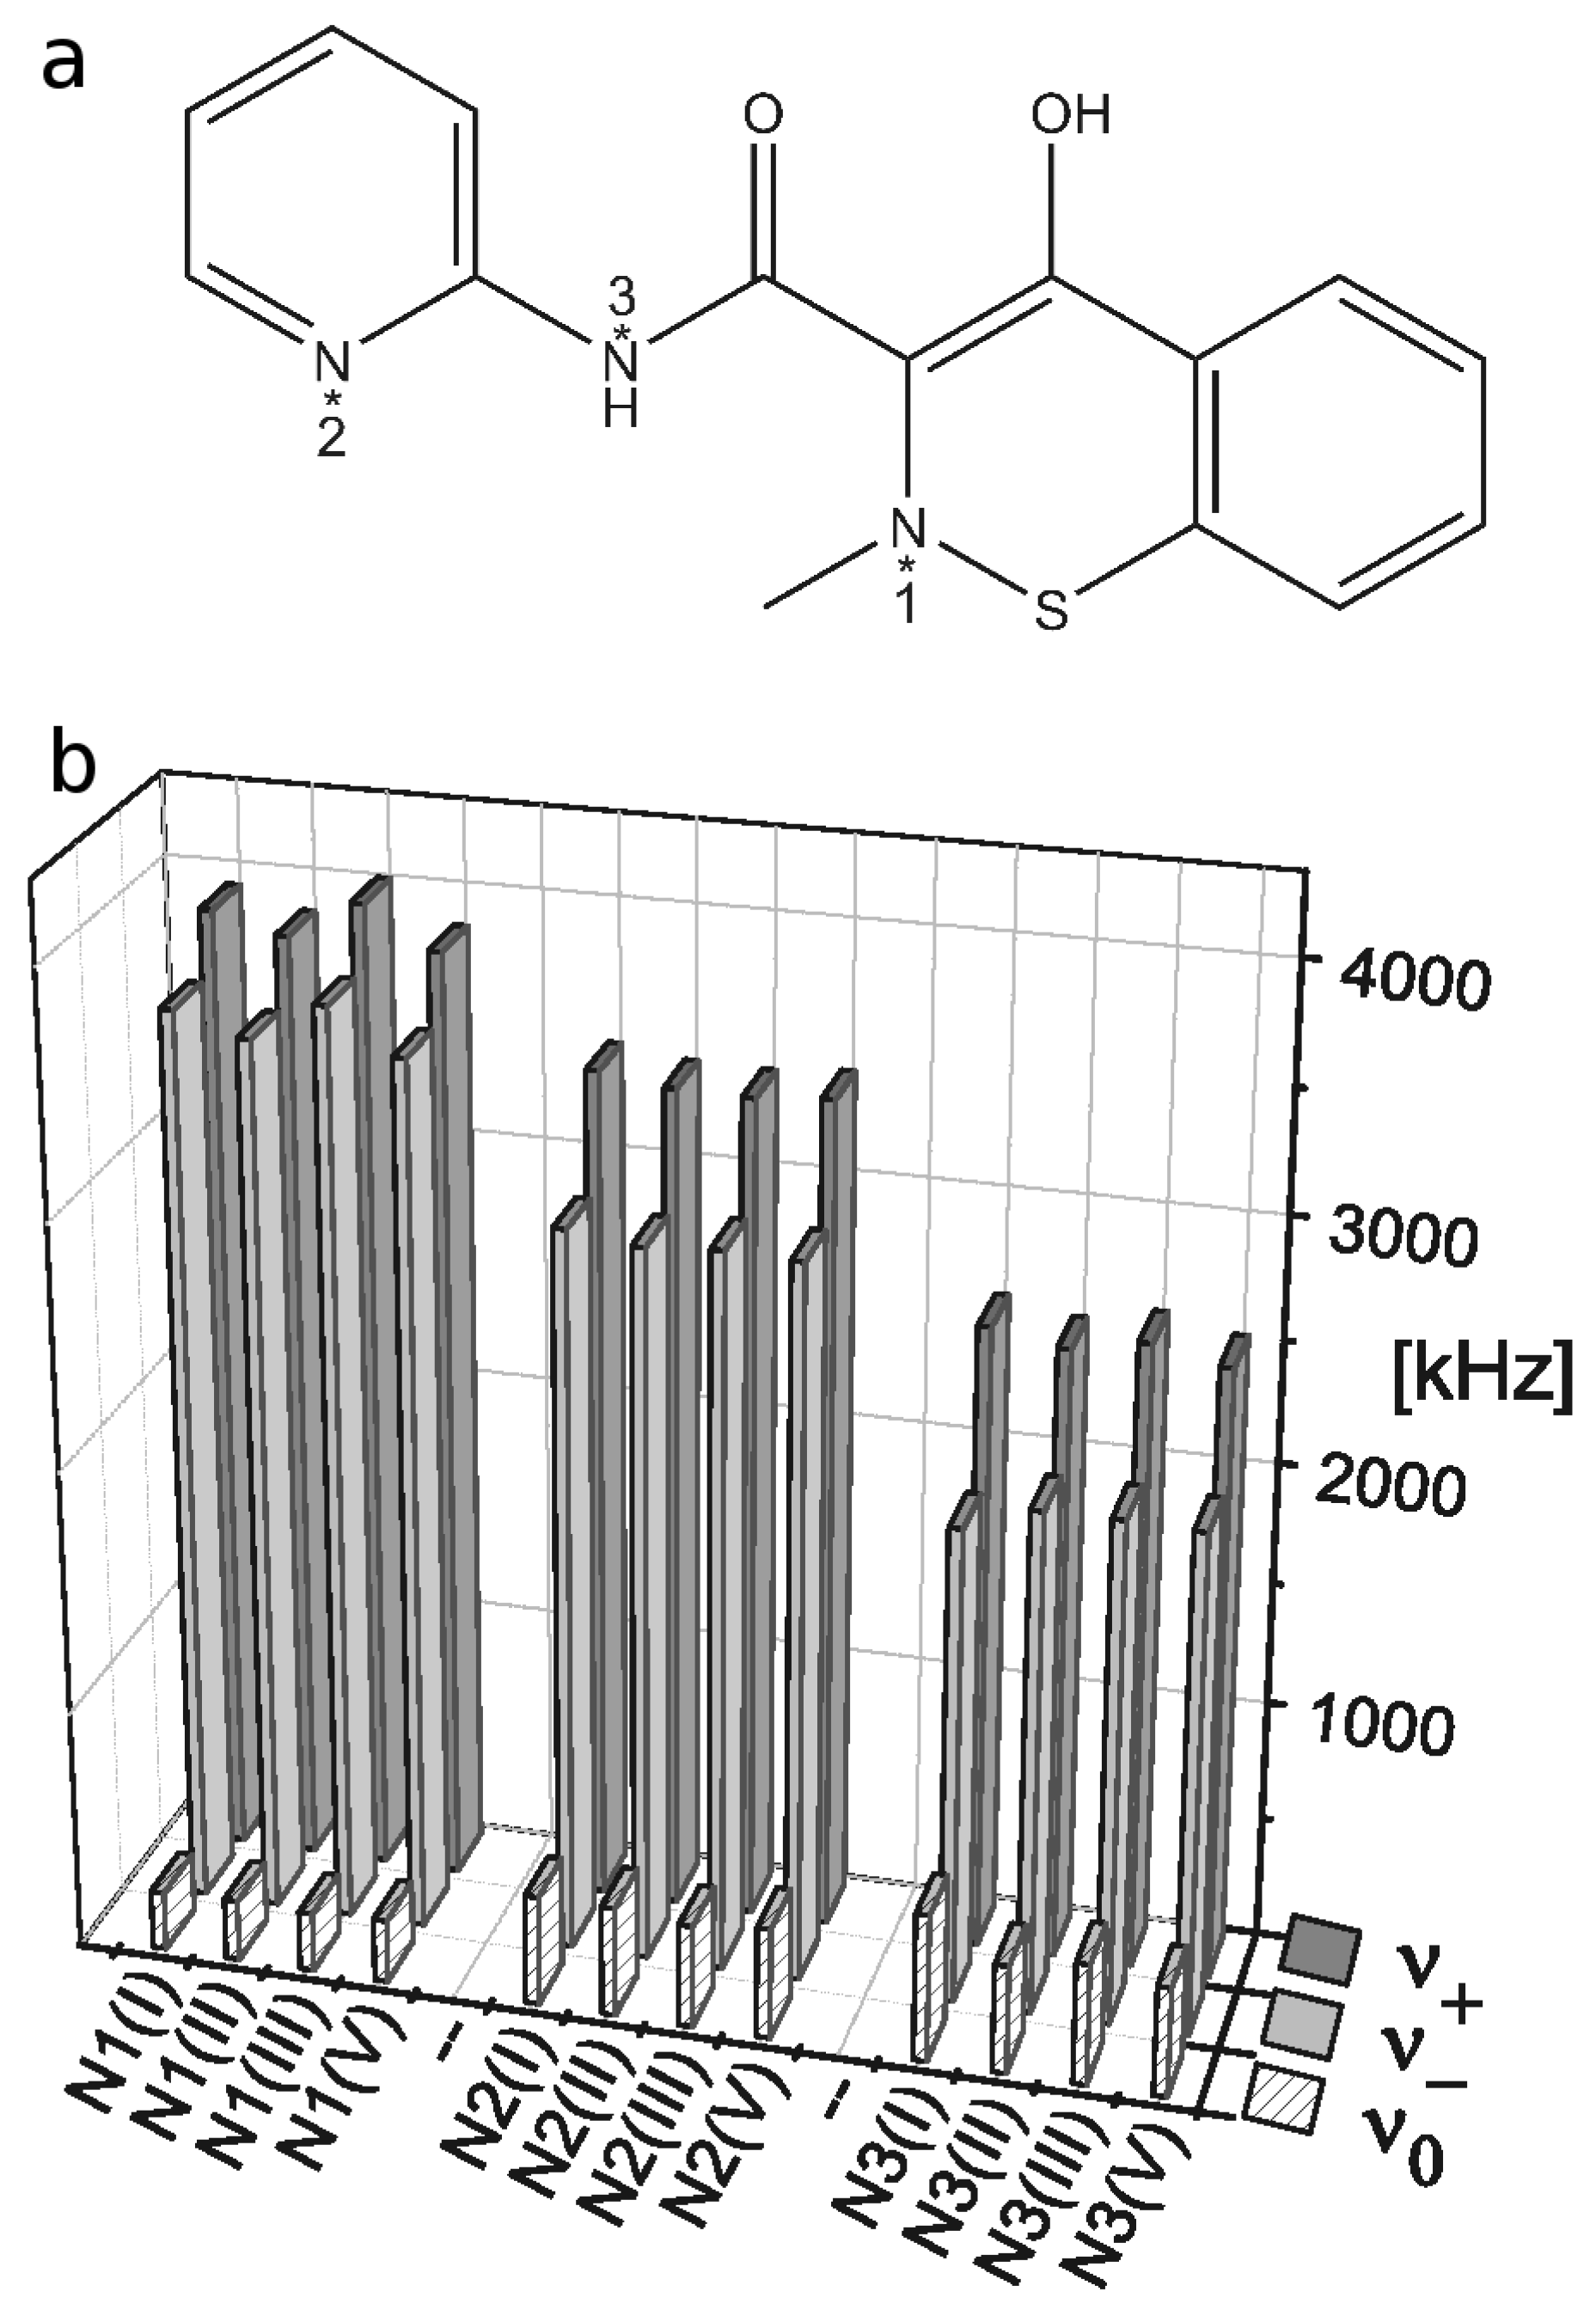
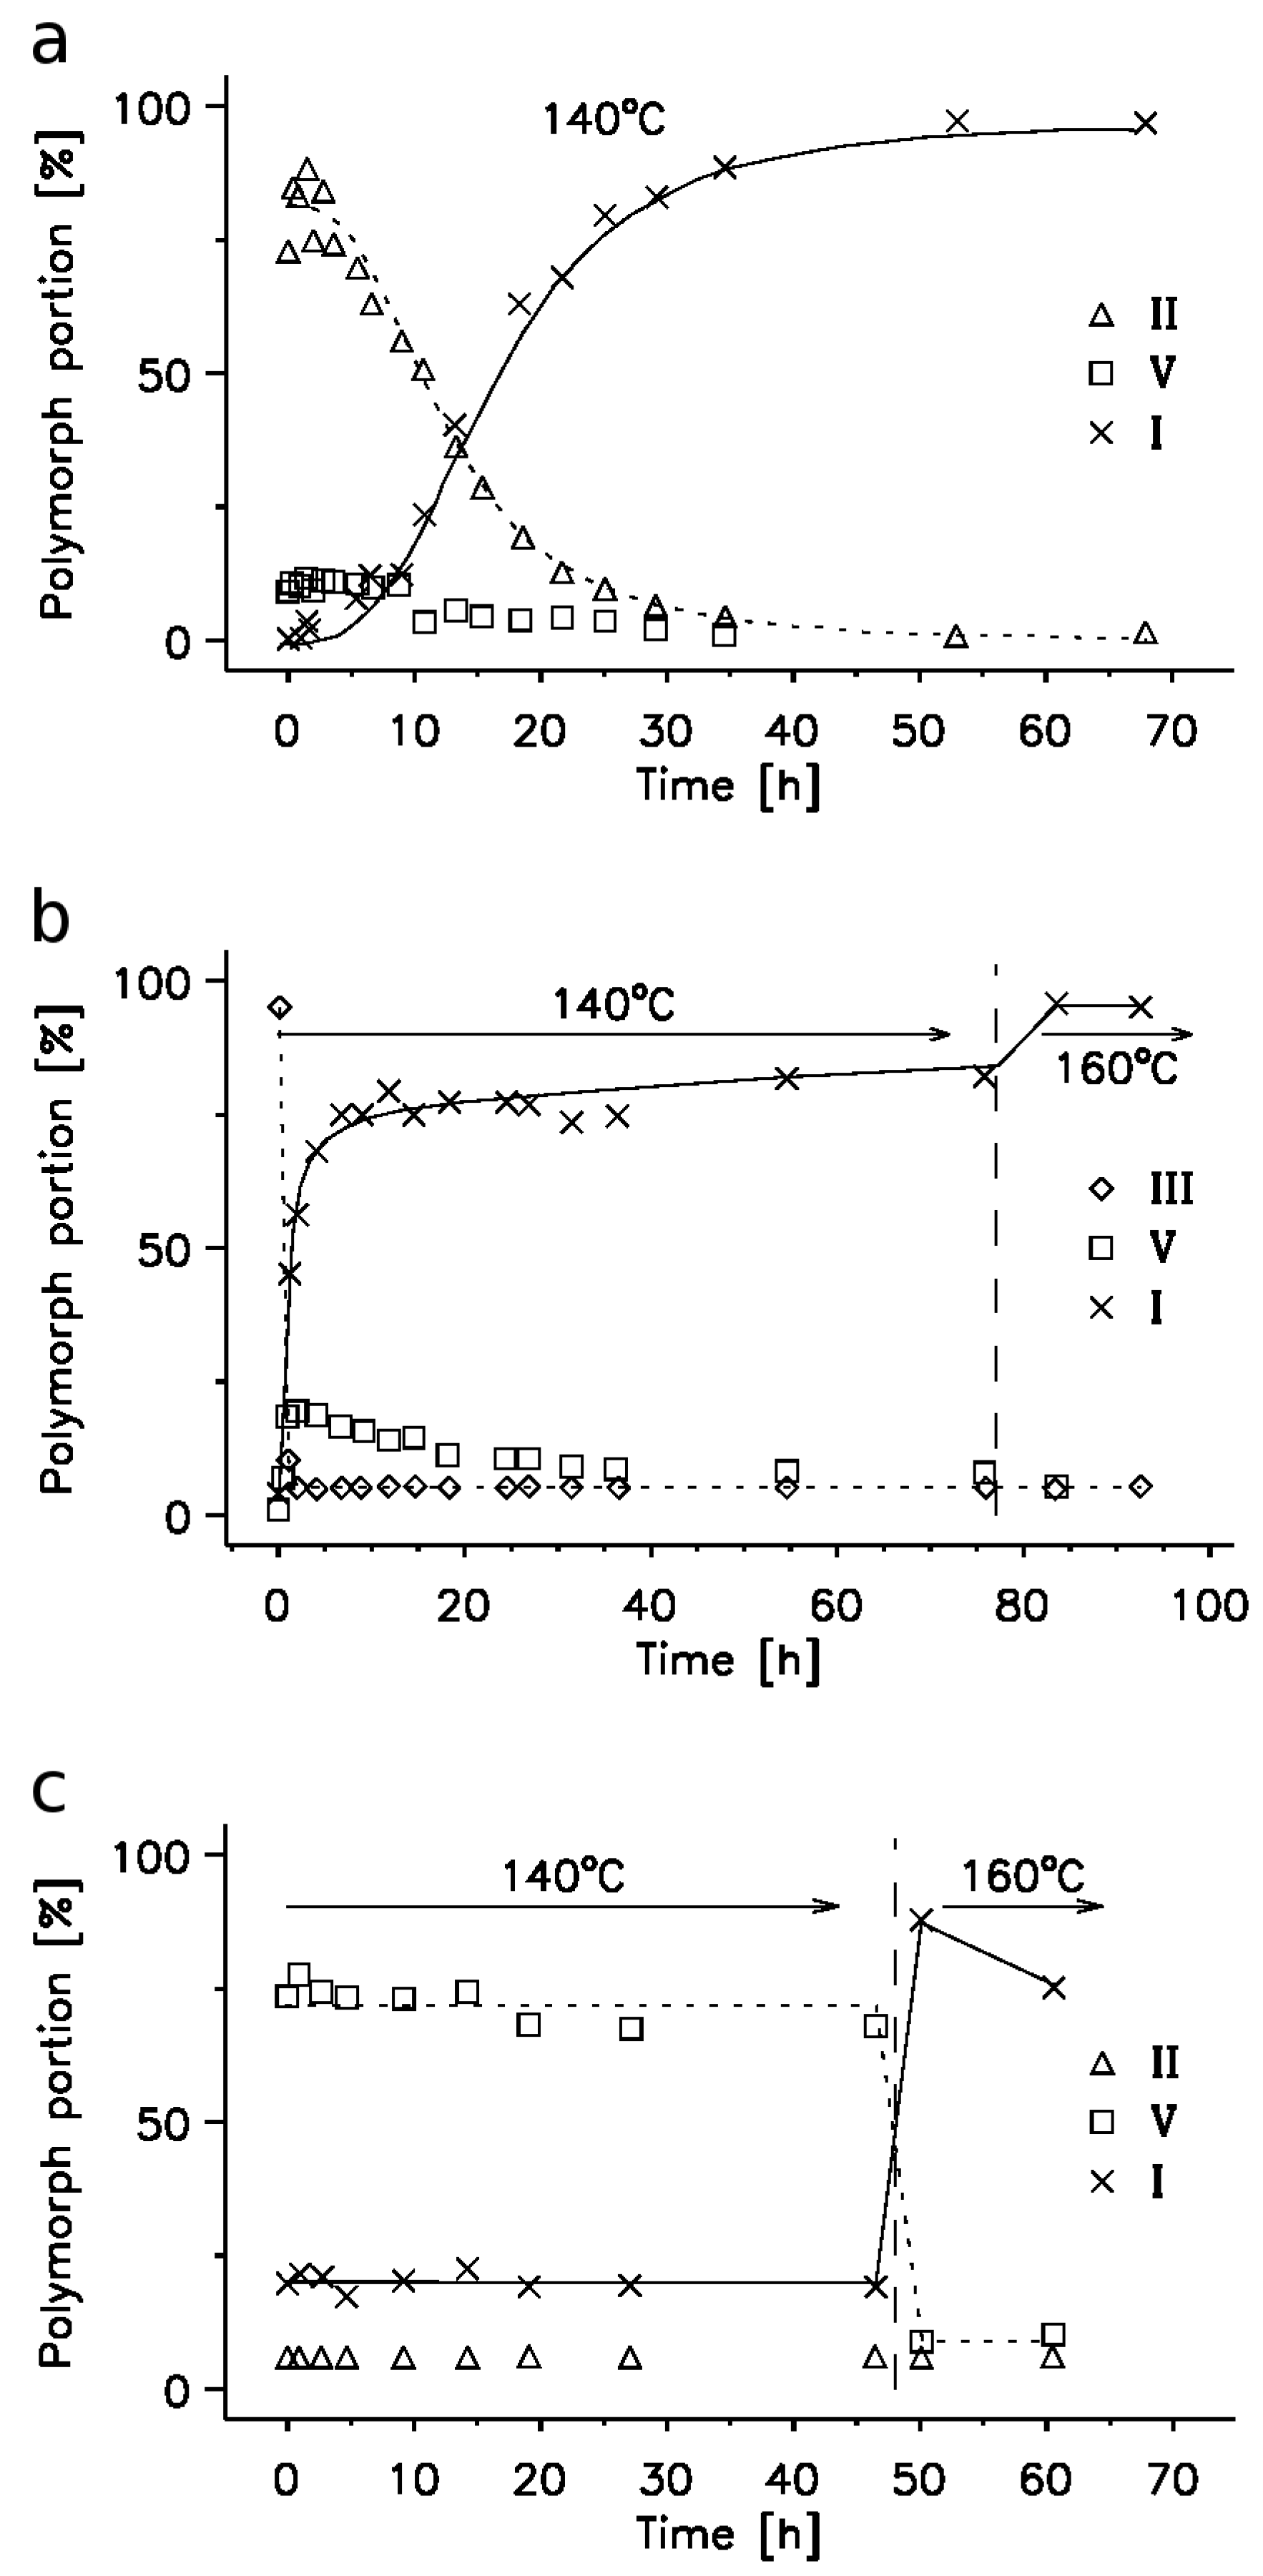
2.3. 14N NQR Study of Piroxicam

Two achievements are connected with this drug research by 14N NQR:
(i)
The discovery of a new polymorphic form of the nonsteroidal anti-inflammatory drug piroxicam, denoted in [28] as “V”, (Figure 11a);
(ii)
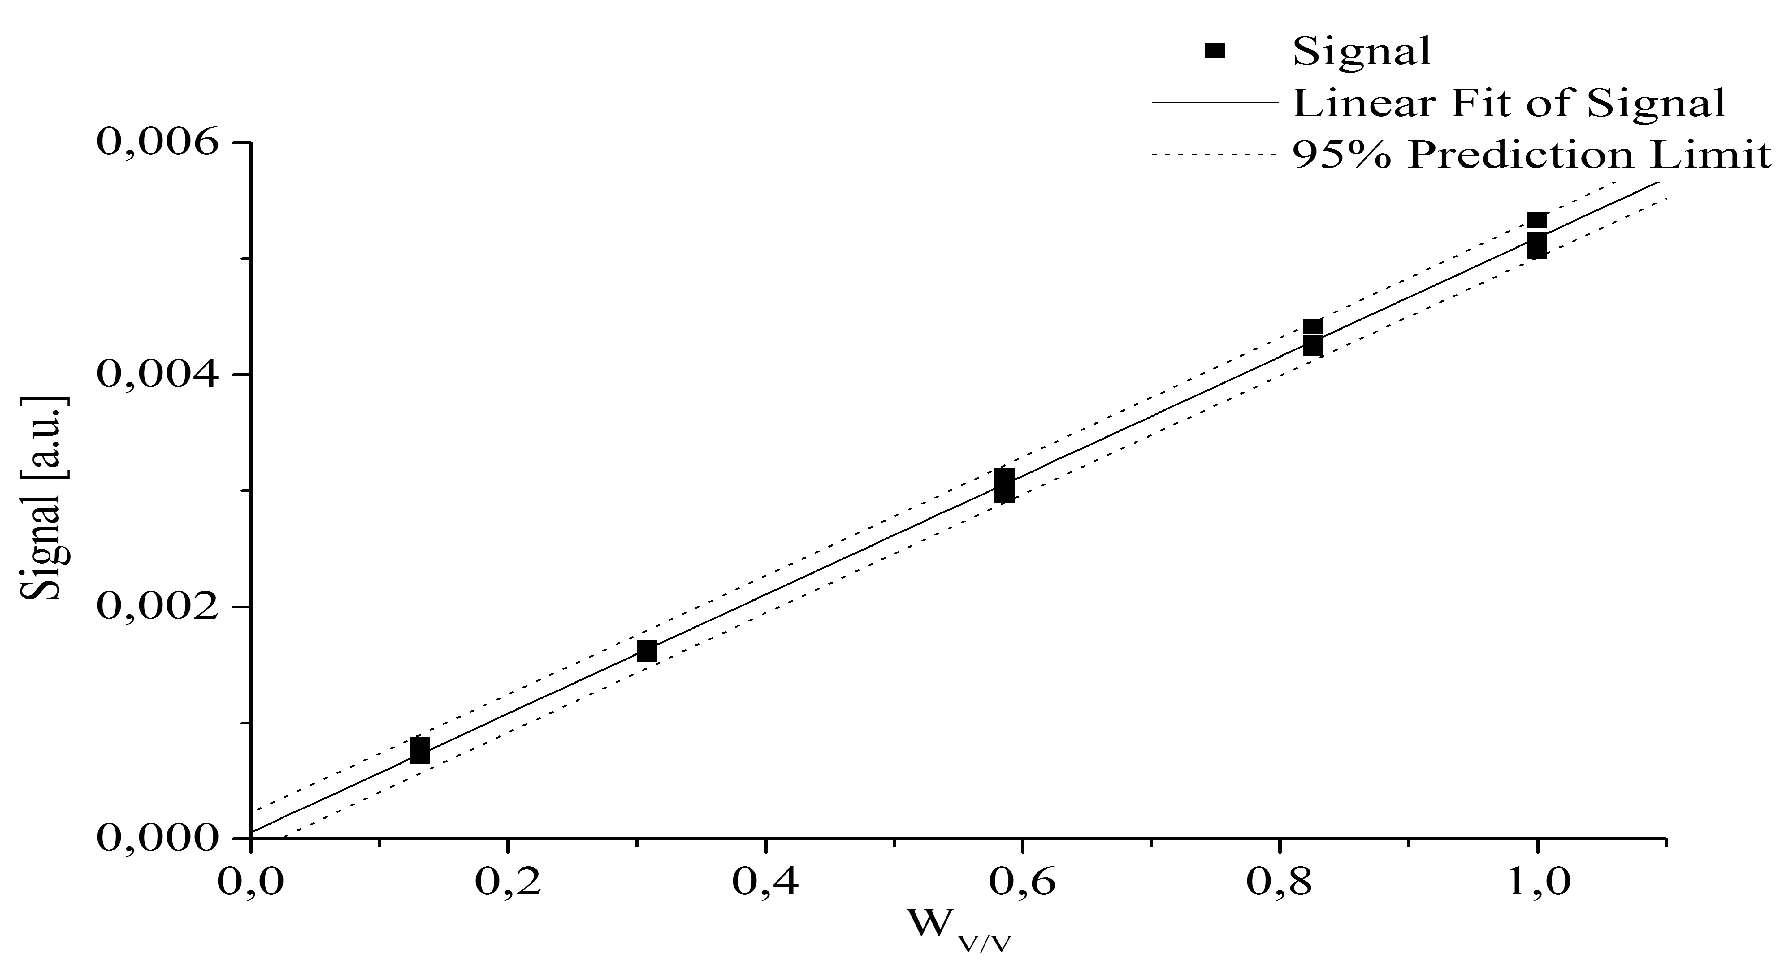
The quantitative determination of a particular piroxicam polymorph.
One can find in the literature [62,63,64,65,66,67,68,69,70] four polymorphs of piroxicam. However, some confusion on the number and nomenclature of the polymorphs exists [28]. It was only partly clarified by Sheth et al. [64] in a review article on piroxicam polymorphs.
The preparation of polymorphs I, II and III is rather straightforward. The existence of polymorph IV was suggested on the basis of DSC thermograms with a temperature program having an appropriate heating–cooling sequence [64]. The crystal structures of polymorph I (cubic) and polymorph II (monoclinic) were solved from single-crystal XRD and are deposited in the Cambridge Structural Database [63,67]. Some authors denote polymorph II as α and polymorph I as β [64]. The crystal structure of polymorph III was solved by Naelapää et al. [71]. The crystal structure of polymorph IV is, to our knowledge, unknown.
The piroxicam polymorphs II, III and V studied in [28], which we report here, were prepared according to the literature [27,28,64,71] using the anhydrous piroxicam polymorph I, purchased from Sigma Aldrich, as the starting material. All the solvents (analytic grade) were obtained from Merck and Co.
“The white poly-crystals of polymorph V were prepared by evaporative recrystallization from dichloromethane [28]. All polymorphs were tested by XRPD, Attenuated Total Reflection Fourier Transform Infrared (ATR-FTIR), DSC, THz absorbance spectra [72]”.
Figure 11 and Figure 12 and Table 3 show the results of the 14N NQR study of piroxicam. All the measurements were performed with the instruments described in [25,26].
These measurements [28] demonstrate the existence of a polymorph (form V) that has not been described previously. The authors of [28] found: “Functional groups in the vicinity of the measured 14N nuclei have a strong influence on the bonding orbitals and on the nitrogen EFG tensor. Each polymorphic form of piroxicam is defined by a set of nine characteristic 14N NQR resonant frequencies. The set of nine lines of each polymorphic form consists of: 3 pairs (ν+, ν) and 3 trivial low frequency lines ( ν 0 = ν + ν ) . Each pair belongs to one of the three nonequivalent 14N nuclei in the piroxicam molecule: the secondary amine N3 = Nketo, pyridine N2 = Npyr. and benzothiazine nitrogen N1 = Nb.thiaz. (Figure 11b and Table 3). Considering the published 14N NQR data for molecules with aromatic, secondary and tertiary amines with bonded aromatic, keto- and sulfonyl- moieties, we can sort the size of 14N quadrupole coupling constants and resonant frequencies [6,11]. Their magnitudes are ranked in the order N(sulfonyl) > N(pyridine) > N(keto). These observations have been compared to the measured 14N NQR frequencies of piroxicam samples to assign the above frequency pairs to the proper nitrogen atoms N1 (=Nb.thiaz.), N2 (=Npyr.) and N3 (=Nketo) (cf. Figure 11 b and Table 3), knowing that benzothiazine N1 belongs to the sulfonyl structures”.
In Figure 12 and in Table 3, it can be seen that it is enough to choose one 14N NQR transition frequency to identify each piroxicam polymorph. In Figure 12, the ν + 14N NQR transition frequencies of the nitrogen atom N2 were chosen.
The careful comparison of the 14N NQR lines, their intensities and linewidths in Figure 12 reveals that the polymorphs I and III were pure, while in this case, the polymorphs II and V were not pure—they contained the admixtures of the piroxicam polymorphs I and III [28].
The elevation of temperature has an influence on polymorphs and their transitions from one form to the others. The results of these experiments are presented in [28]. Figure 13a–c demonstrate transitions in the mixture of piroxicam polymorphs as a function of the exposure to elevated temperature.
Reck and all [67,68] introduced a model approach to answer the question for three or four piroxicam polymorphs [63,64,65,66,67,68,69,70]. They suggested the existence of polymorph II 2, very similar to polymorph II. XRPD experiments were done [70] to prove the existence of this fourth piroxicam polymorph. 14N NQR research of piroxicam polymorphism was undertaken not much later. The results are described in [28]: “14N NQR confirmed the existence of four polymorphs, however, we could not prepare the polymorph V without small amounts of impurities of polymorphs I and/or II. 14N NQR allows also a quantitative determination of these impurities. It is worth to mention that the similarity of polymorphs II and V was also reflected by the Raman and DSC measurements. We can therefore state that here the use of different measuring techniques demonstrated the high selectivity of NQR spectroscopy. 14N NQR resonances of forms II and V are well separated and we can clearly resolve these two polymorphs. The measured 14N NQR frequencies   ν + , ν and ν 0 enabled us to calculate the two NQR characteristic parameters QCC and η (Table 3). The QCC and η for all four polymorphic forms of piroxicam can be clearly associated with 3 different nitrogen atoms in the piroxicam molecule. The highest QCC and the smallest η is associated with the N1 atom of the benzo-thiazine ring, the middle QCC and the middle η is associated with the N2 atom of the pyridine ring and the smallest QCC and the biggest η is associated with the N3 atom of the amine nitrogen (=Nketo). The values of quadrupole parameters (QCC, frequency and η) in Table 3 indicate the similarity in charge distribution for all four polymorphs of piroxicam. Higher deviation from average can be noticed only for the two QCC-s of N1 for polymorphs I and III (Figure 14a). On the other hand, again for polymorphs I and III higher deviation is seen in η of N3 (Figure 14b).
One can elucidate this by considering the role of H-bonds in polymorphs I and II. Only N1 and N3 atoms are involved in H-bonds in all four polymorphs. N2 atoms are not involved in H-bonds [28,64,71].
The analytic ability of 14N NQR is illustrated in Figure 15 where the intensity of ν + 14N NQR signal of N3 nuclei in the mixture of polymorph piroxicam I with pyridine monohydrate is shown”.

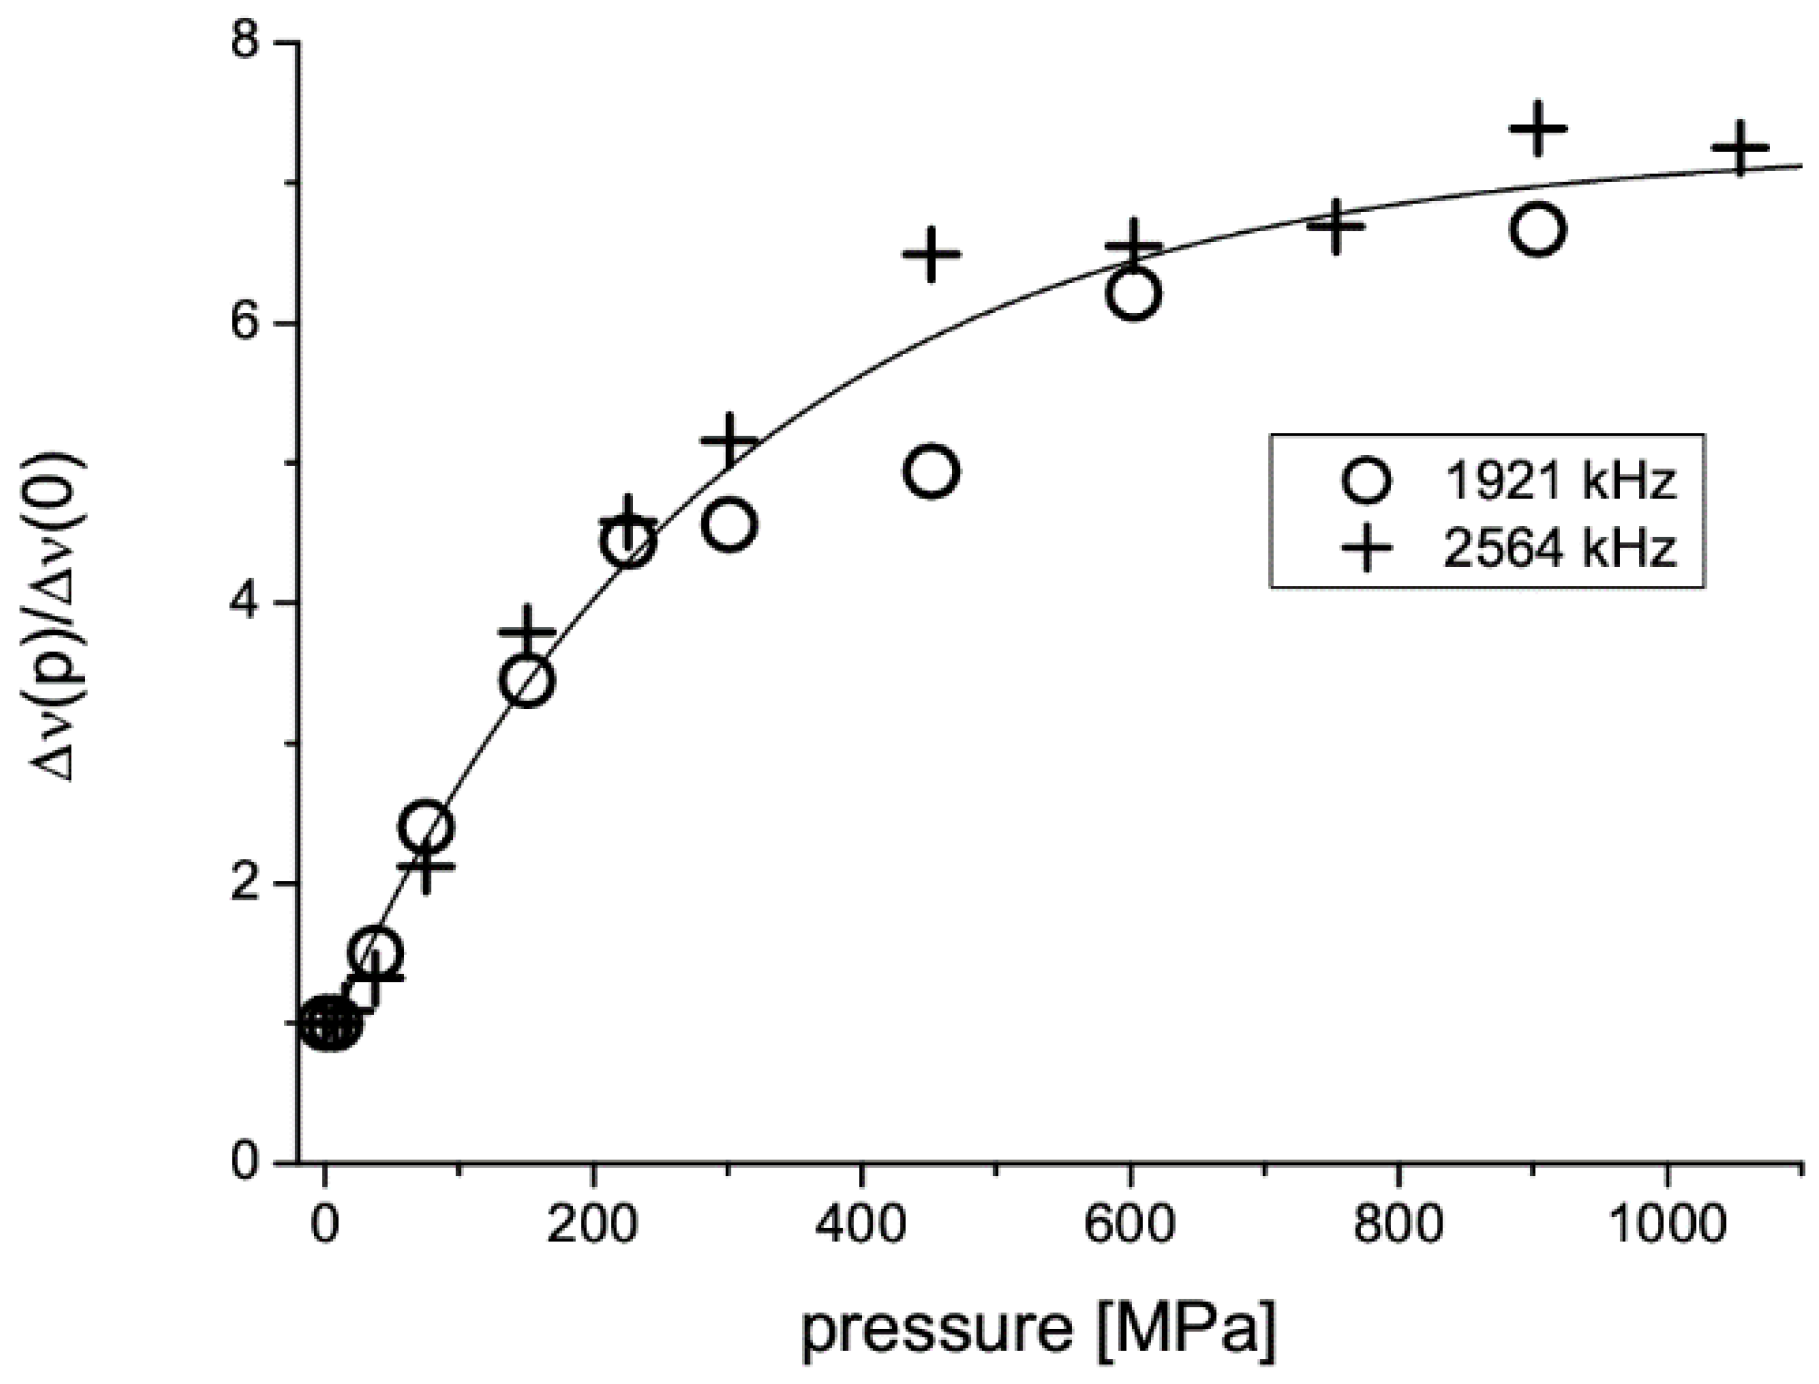
2.4. Tablet Compaction Pressure vs. Linewidth

The study of paracetamol polymorphism opened up an additional and unexpected application of 14N NQR in drug research [15]: the linewidth of the 14N NQR signal is correlated with the compaction pressure during the compression of particular tablets. The thermodynamically stable monoclinic paracetamol and the metastable orthorhombic polymorph were measured. In Figure 16, the relative 14N NQR linewidth for the ν+ and ν lines of monoclinic paracetamol is shown as a function of compaction pressure during the tablet preparation. Subsequently, the 14N NQR signals of the thermodynamically stable monoclinic paracetamol in different commercial paracetamol tablets available on the local market were measured. The results are shown in Figure 17a–b. It can be concluded that, in this way, the potential identification and authentication of the manufacturer is possible when needed, for instance, for the confirmation of fake drugs.
Notice that the ν line is persistently broader than the ν + line (Table 4, Figure 17). In fact, the relative broadening seems to grow with compaction pressure in parallel for both lines. This holds for both the model tablets and the commercial drug products. The relatively slow NQR relaxation (Table 4) indicates that the lifetime broadening contribution is negligible in comparison with other sources of broadening.
Equation (4) is a starting expression connecting the NQR line parameters and the EFG tensor alteration due to the crystal lattice deformation. During compaction, disordered individual grains are deformed in arbitrary directions. The measured NQR linewidths of ν + and ν are the sum of all the corresponding shifted 14N NQR lines coming from different deformed grains. One can write for the above relation within the linear terms
δ ν + ν + = δ q q + δ η 3 + η   and   δ ν ν = δ q q + δ η 3 η
Here, ν +, ν -, q and η are the non-shifted NQR line values and tensor components, whereas δν +, δν-, δq and δη are the corresponding shifts due to local deformations. One can also define standard deviations of the shifts of these values from the averages, like < δ ν ± > = < ( δ ν ± ) 2 > = Δ ν ± / 2 . Taking into account the inaccuracy of the linewidth estimation, the actual ratio of the ν + and ν linewidths is best explained by the following distribution width of the electric field gradient tensor components: Δ q = 2 < ( δ q ) 2 > 0 for all compaction pressures and Δ η = 2 < ( δ η ) 2 > growing from ~0.004 in powder to ~0.03 in model tablets, formed at 1.1 GPa, according to Figure 17.
Reference [15] concludes with: “The broadening of NQR lines was tried to be reversed by thermal relaxation at higher temperature (383 K), however even after long time “annealing” (24 hrs) no narrowing of the 14N NQR signals was observed. No narrowing effect was observed either with commercial tablet samples after similar thermal annealing. Partial narrowing was obtained only after milling of tablets in “ball mill” (Fritsch). After 40 min milling (final grain size below ~50 mm) the linewidths of 14N NQR signals of tablets prepared with 1.1 GPa pressure decreased to approximately half of the value obtained after tablet compaction. Yet, they remained much broader than those in the not pressed initial powder sample”.

2.5. Instrumentation Improvements

The application of low frequency 14N NQR measurements outside specialized laboratories may require substantial improvements in measuring speed and sensitivity. To accomplish that, several instrumentation improvements are being developed.
The SQUID magnetometer was introduced as a very sensitive detector of 14N NQR signals [33]. One can further improve the S/N ratio of a low frequency 14N NQR measuring system by a combination of a standard pulsed 14N NQR spectrometer, used today practically for all measurements, and an alkali metal optically pumped magnetometer (OPM) [73,74]. The latter will better detect the magnetic part of the 14N NQR signal, as first mentioned in [32]. A comparison of the measured 14N NQR signals by a classic pulsed NQR spectrometer and by a spectrometer combined with OPM [74] is shown in Figure 18.
The comparison of the K-OPM improved NQR spectrometer and classic NQR spectrometer revealed the expected higher sensitivity of the former one.

3. Conclusions

To conclude, we can state that 14N NQR is—in addition to NMR—a powerful contactless and non-destructive RF spectroscopic tool for detecting the appearance of polymorphism with a possibility to distinguish clearly and quantitatively among different polymorphs. This was demonstrated in several APIs containing 14N nuclei in up to seven chemically nonequivalent sites. Different compaction pressures in the production of tablets are reflected in the different linewidths of the 14N NQR lines.
The advantage of this method in comparison to other methods—such as XRD, high-resolution NMR, Raman, and IR spectroscopy—is that in NQR spectroscopy, there is no need for special sample preparation. APIs in their final drug forms (powders, granulates, tablets, etc.) can be used even in their original package if it is not completely metallic.
For more demanding 14N NQR measurements, an improved optical NQR measurement system is available.

Author Contributions

Conceptualization, Z.T., J.S., and S.S.; methodology, J.P., J.L., Z.L., S.B., T.A., V.Ž, and J.S.; software, V.J., S.B., and T.A.; validation, S.S.; formal analysis, T.A., V.J., Z.L., and S.B.; investigation, J.L., J.P., Z.L., V.Ž., and J.S.; resources, S.S. and Z.L.; writing—original draft preparation, Z.T.,.; writing—review and editing, Z.T., T.A.; visualization, V.J. and Z.L.; supervision, Z.T., S.S., and J.S.; project administration, Z.T. and T.A.; funding acquisition, Z.T., S.S., and T.A. All authors have read and agreed to the published version of the manuscript.

Funding

This research was funded by the Slovenian Research Programs P2−0384, P2−250, J7−9704; EC FP−7 Project under the Grant Nr. 261670 and MORS research grant RR−07−011.

Conflicts of Interest

The authors declare no conflict of interest.

References

  1. Brittain, H.G. Polymorphism in Pharmaceutical Solids (Drugs and the Pharmaceutical Sciences), 2nd ed.; CRC Press: New York, NY, USA, 2009. [Google Scholar]
  2. Hilfiker, R.; von Ramer, M. Polymorphism in the Pharmaceutical Industry; Solid Form and Drug Development; Wiley-VCH: Weinheim, Germany, 2019. [Google Scholar]
  3. Bernstein, J. Polymorphism in Molecular Crystals; Oxford University Press: Oxford, UK, 2002. [Google Scholar]
  4. Das, T.P.; Hahn, E.L. Nuclear Quadrupole Resonance Spectroscopy; Academic Press Inc.: New York, NY, USA, 1958. [Google Scholar]
  5. Abragam, A. The Principles of Nuclear Magnetism; Clarendon Press: Oxford, UK, 1961. [Google Scholar]
  6. Lucken, E.A.C. Nuclear Quadrupole Coupling Constants; Academic Press Inc.: London, UK; New York, NY, USA, 1969. [Google Scholar]
  7. Seliger, J. Nuclear quadrupole resonance: Theory. In Encyclopedia of Spectroscopy and Spectrometry; Lindon, J.C., Tranter, G.E., Holmes, J.L., Eds.; Academic Press: San Diego, CA, USA, 2000; pp. 1672–1680. [Google Scholar]
  8. Rigamonti, A. NMR-NQR—studies of structural phase transitions. Adv. Phys. 1984, 33, 115. [Google Scholar] [CrossRef]
  9. Grechishkin, V.S.; Sinyavskii, N.Y. New technologies: Nuclear quadrupole resonance as an explosive and narcotic detection technique. Phys-Uspekhi. 1997, 40, 393–406. [Google Scholar] [CrossRef]
  10. Balchin, E.; Malcolme-Lawes, D.J.; Poplett, I.J.F.; Rowe, M.D.; Smith, J.A.S.; Pearce, G.E.S.; Wren, S.A.C. Potential of Nuclear Quadrupole Resonance in Pharmaceutical Analysis. Anal. Chem. 2005, 77, 3925–3930. [Google Scholar] [CrossRef] [PubMed]
  11. Chihara, H.; Nakamura, N. Nuclear quadrupole resonance spectroscopy data. Supplement to III/20, III/31. In Landolt-Bornstein, Numerical Data and in Science and Technology, Group III; Condensed Matter; Springer: Berlin, Germany, 1997. [Google Scholar]
  12. Bailey, W.C. DFT and HF–DFT calculations of 14N quadrupole coupling constants in molecules. Chem. Phys. 2000, 252, 57–66. [Google Scholar] [CrossRef]
  13. Limandri, S.; Visñovezky, C.; Pérez, S.C.; Schurrer, C.A.; Wolfenson, A.E.; Ferro, M.; Cuffini, S.L.; Gonçalves de Souza, J.; Aguiar, F.A.; Masetto de Gaitani, C. Nuclear Quadrupole Resonance: A Technique to Control Hydration Processes in the Pharmaceutical Industry. Anal. Chem. 2011, 83, 1773–1776. [Google Scholar] [CrossRef] [PubMed]
  14. Gregorovič, A. Quantitative Analysis of Hydration Using Nitrogen−14 Nuclear Quadrupole Resonance. Anal. Chem. 2015, 87, 6912–6918. [Google Scholar] [CrossRef]
  15. Lužnik, J.; Pirnat, J.; Jazbinšek, V.; Lavrič, Z.; Srčič, S.; Trontelj, Z. The influence of pressure in paracetamol tablet compaction on 14N nuclear quadrupole resonance. Appl. Magn. Reson. 2013, 44, 735–743. [Google Scholar] [CrossRef]
  16. Kyriakidou, G.; Jakobsson, A.; Althoefer, K.; Barras, J. Batch-Specific Discrimination Using Nuclear Quadrupole Resonance Spectroscopy. Anal. Chem. 2015, 87, 3806–3811. [Google Scholar] [CrossRef]
  17. Slusher, R.E.; Hahn, E.L. Sensitive Detection of Nuclear Quadrupole Interactions in Solids. Phys. Rev. 1968, 166, 332–347. [Google Scholar] [CrossRef]
  18. Edmonds, D.T. Nuclear quadrupole double resonance. Phys. Rep. 1977, 29, 233–290. [Google Scholar] [CrossRef]
  19. Stephenson, D.; Smith, J.A.S. Nitrogen−14 Quadrupole Cross-Relaxation Spectroscopy. Proc. R. Soc. Lond. A 1988, 416, 149–178. [Google Scholar] [CrossRef]
  20. Seliger, J.; Žagar, V. New Methods for Detection of 14N NQR Frequencies. Appl. Magn. Reson. 2012, 43, 469–484. [Google Scholar] [CrossRef]
  21. Veinberg, S.L.; Friedl, Z.W.; Harris, K.J.; O’Dell, L.A.; Schurko, R.W. Ultra-wideline 14N solid-state NMR as a method for differentiating polymorphs: Glycine as a case study. CrystEngComm 2015, 17, 5225–5236. [Google Scholar] [CrossRef]
  22. Pérez, S.C.; Cerioni, L.; Wolfenson, A.E.; Faudone, S.; Cuffini, S.L. Utilization of pure nuclear quadrupole resonance spectroscopy for the study of pharmaceutical crystal forms. Int. J. Pharm. 2005, 298, 143–152. [Google Scholar] [CrossRef]
  23. Wolfenson, A.; Pérez, S.C.; Zuriaga, M.J.; Garnero, C.; Miranda, J.A.; Longhi, M.; Faudone, S.N. Structural and dynamic characterization of solid furosemide polymorphs by NQR and NMR methods. Chem. Phys. Lett. 2005, 641, 163–168. [Google Scholar] [CrossRef]
  24. Bavin, P.M.G.; Stephenson, D.; Smith, J.A.S. 14N Quadrupole Cross-Relaxation Spectroscopy of a Compound of Pharmacological Interest. Zeitschrift für Naturforschung A 1986, 41, 195–199. [Google Scholar] [CrossRef]
  25. Trontelj, Z.; Lužnik, J.; Pirnat, J.; Jazbinšek, V.; Lavrič, Z.; Srčič, S. Polymorphism in Sulfanilamide: 14N NQR Study. J. Pharm. Sci. 2019, 108, 2865–2870. [Google Scholar] [CrossRef]
  26. Lužnik, J.; Pirnat, J.; Jazbinšek, V.; Lavrič, Z.; Žagar, V.; Srčič, S.; Seliger, J.; Trontelj, Z. 14N Nuclear Quadrupole Resonance Study of Polymorphism in Famotidine. J. Pharm. Sci. 2014, 103, 2704–2709. [Google Scholar] [CrossRef] [PubMed]
  27. Lavrič, Z.; Pirnat, J.; Lužnik, J.; Seliger, J.; Žagar, V.; Trontelj, Z.; Srčič, S. Application of 14N NQR to the study of piroxicam polymorphism. J. Pharm. Sci. 2010, 99, 4857–4865. [Google Scholar] [CrossRef]
  28. Lavrič, Z.; Pirnat, J.; Lužnik, J.; Trontelj, Z.; Srčič, S. 14N NQR study of piroxicam: Confirmation of new polymorphic form V. J. Pharm. Sci. 2015, 104, 1909–1918. [Google Scholar] [CrossRef]
  29. Blinc, R.; Mali, M.; Osredkar, R.; Prelesnik, A.; Seliger, J.; Zupančič, I.; Ehrenberg, L. 14N NQR Spectroscopy of Some Amino Acids and Nucleic Bases via Double Resonance in the Laboratory Frame. J. Chem. Phys. 1972, 57, 5087. [Google Scholar] [CrossRef]
  30. Hartmann, S.R.; Hahn, E.L. Nuclear double resonance in the rotating frame. Phys. Rev. 1962, 128, 2042–2053. [Google Scholar] [CrossRef]
  31. Lužnik, J.; Pirnat, J.; Jazbinšek, V.; Apih, T.; Gregorovič, A.; Blinc, R.; Seliger, J.; Trontelj, Z. Polarization enhanced “single shot” N14 nuclear quadrupole resonance detection of trinitrotoluene at room temperature. Appl. Phys. Lett. 2006, 89, 123509. [Google Scholar] [CrossRef]
  32. Lee, S.-K.; Sauer, K.L.; Seltzer, S.J.; Alem, O.; Romalis, M.V. Subfemtotesla radio-frequency atomic magnetometer for detection of nuclear quadrupole resonance. Appl. Phys. Lett. 2006, 89, 214106. [Google Scholar] [CrossRef] [Green Version]
  33. Hürlimann, M.D.; Pennington, C.H.; Fan, N.Q.; Clarke, J.; Pines, A.; Hahn, E.L. Pulsed Fourier-transform NQR ofN14with a dc SQUID. Phys. Rev. Lett. 1992, 69, 684–687. [Google Scholar] [CrossRef]
  34. Alléaume, M.; Decap, J. Affinement tridimensionnel du sulfanilamide β. Acta Crystallogr. 1965, 18, 731–736. [Google Scholar] [CrossRef] [Green Version]
  35. Alléaume, M.; Decap, J. Affinement tridimensionnel du sulfanilamide χ. Acta Crystallogr. 1965, 19, 934–938. [Google Scholar] [CrossRef]
  36. O’Connell, A.M.; Maslen, E.N. X-ray and neutron diffraction studies of beta-sulfanilamide. Acta Crystallogr. 1967, 22, 134–145. [Google Scholar] [CrossRef]
  37. Van Zyp, C. Microscopische identificatie van sulfanilamide. Pharm. Weekbl. 1938, 75, 585–591. [Google Scholar]
  38. Toscani, S.; Dzyabchenko, A.; Agafonov, V.; Dugue, J.; Céolin, R. Polymorphism of Sulfanilamide: (II) Stability Hierarchy of α-, β- and γ- Forms from Energy Calculations by the Atom-Atom Potential Method and from the Construction of the p, T Phase Diagram. Pharm. Res. 1996, 13, 151–154. [Google Scholar] [CrossRef]
  39. Lin, H.O.; Guillory, J.K. Polymorphism in Sulfanilamide-d4. J. Pharm. Sci. 1970, 59, 972–975. [Google Scholar] [CrossRef] [PubMed]
  40. Portieri, A.; Harris, R.K.; Fletton, R.A.; Lancaster, R.W.; Threlfall, T.L. Effects of polymorphic differences for sulfanilamide, as seen through13C and15N solid-state NMR, together with shielding calculations. Magn. Reson. Chem. 2004, 42, 313–320. [Google Scholar] [CrossRef] [PubMed]
  41. Ildiz, G.O.; Akyüz, S. Conformational analysis and vibrational study of sulfanilamide. Vib. Spectrosc. 2012, 58, 12–18. [Google Scholar] [CrossRef]
  42. Toscani, S.; Thorén, S.; Agafonov, V.; Céolin, R.; Dugue, J. Thermodynamic Study of Sulfanilamide Polymorphism: (I) Monotropy of the α-Variety. Pharm. Res. 1995, 12, 1453–1456. [Google Scholar] [CrossRef]
  43. Subbarao, S.N.; Bray, P.J. Correlation of carbonic anhydrase inhibitor activities of benzenesulfonamides with the data obtained by use of nitrogen−14 nuclear quadrupole resonance. J. Med. Chem. 1978, 22, 111–114. [Google Scholar] [CrossRef]
  44. Blinc, R.; Seliger, J.; Zidanšek, A.; Žagar, V.; Milia, F.; Robert, H. 14N nuclear quadrupole resonance of some sulfa drugs. Solid State Nucl. Magn. Reson. 2006, 30, 61–68. [Google Scholar] [CrossRef]
  45. Barras, J.; Althoefer, K.; Rowe, M.D.; Poplett, I.J.; Smith, J.A.S. The Emerging Field of Medicines Authentication by Nuclear Quadrupole Resonance Spectroscopy. Appl. Magn. Reson. 2012, 43, 511–529. [Google Scholar] [CrossRef]
  46. Marino, R.A.; Klainer, S.M. Multiple spin echoes in pure quadrupole resonance. J. Chem. Phys. 1977, 67, 3388. [Google Scholar] [CrossRef]
  47. Hegedüs, B.; Bod, P.; Harsányi, K.; Péter, I.; Kalman, A.; Parkanyi, L. Comparison of the polymorphic modifications of famotidine. J. Pharm. Biomed. Anal. 1989, 7, 563–569. [Google Scholar] [CrossRef]
  48. Ferenczy, G.G.; Párkányi, L.; Ángyán, J.; Kálmán, A.; Hegedűs, B. Crystal and electronic structure of two polymorphic modifications of famotidine. An experimental and theoretical study. J. Mol. Struct. THEOCHEM 2000, 503, 73–79. [Google Scholar] [CrossRef]
  49. Overgaard, J.; Hibbs, D.E. The experimental electron density in polymorphs A and B of the anti-ulcer drug famotidine. Acta Crystallogr. Sect. A Found. Crystallogr. 2004, 60, 480–487. [Google Scholar] [CrossRef] [PubMed]
  50. Lu, J.; Wang, X.-J.; Yang, X.; Ching, C.-B. Polymorphism and Crystallization of Famotidine. Cryst. Growth Des. 2007, 7, 1590–1598. [Google Scholar] [CrossRef]
  51. Hassan, M.A.; Salem, M.S.; Sueliman, M.S.; Najib, N.M. Characterization of famotidine polymorphic forms. Int. J. Pharm. 1997, 149, 227–232. [Google Scholar] [CrossRef]
  52. Rudakov, T.; Mikhaltsevich, V. Multiple NQR spin echoes in phase cycled pulse experiments. Phys. Lett. A 2003, 309, 465–469. [Google Scholar] [CrossRef]
  53. Seliger, J.; Blinc, R.; Arend, H.; Kind, R. Proton-14N double resonance study of the structural phase transitions in the perovskite type layer compound (CH3NH3)2CdCl4. Eur. Phys. J. B 1976, 25, 189–195. [Google Scholar] [CrossRef]
  54. Grechishkin, V.S.; Shpilevoi, A.A. Indirect methods for studying nuclear quadrupole interactions in solids. Physics-Uspekhi 1996, 39, 713–725. [Google Scholar] [CrossRef]
  55. Seliger, J.; Žagar, V. Measurement of the 14N nuclear quadrupole resonance frequencies by the solid effect. J. Magn. Reson. 2008, 193, 54–62. [Google Scholar] [CrossRef]
  56. Luznik, J.; Jazbinšek, V.; Pirnat, J.; Seliger, J.; Trontelj, Z. Zeeman shift – A tool for assignment of 14N NQR lines of nonequivalent 14N atoms in powder samples. J. Magn. Reson. 2011, 212, 149–153. [Google Scholar] [CrossRef]
  57. Seliger, J.; Žagar, V.; Latosińska, M.; Latosińska, J.N. Electron Configuration and Hydrogen-Bonding Pattern in Several Thymine and Uracil Analogues Studied by 1H–14N NQDR and DFT/QTAIM. J. Phys. Chem. B 2012, 116, 8793–8804. [Google Scholar] [CrossRef]
  58. Oja, T. Nitrogen-14 nuclear quadrupole resonance study of the guanidinium ion. J. Chem. Phys. 1973, 59, 2668–2675. [Google Scholar] [CrossRef]
  59. Negita, H.; Kubo, T.; Shibata, K. 14N Nuclear Quadrupole Resonances of Sulfuric Diamide and Its Derivatives. Bull. Chem. Soc. Jpn. 1975, 48, 675–677. [Google Scholar] [CrossRef] [Green Version]
  60. Seliger, J.; Žagar, V. Nuclear Quadrupole Resonance Study of Hydrogen Bonds in Solid 2-Methylbenzimidazole and 5,6-Dimethylbenzimidazole. J. Phys. Chem. C 2013, 117, 20193–20200. [Google Scholar] [CrossRef]
  61. Seliger, J.; Žagar, V. Hydrogen Bonds in Cocrystals and Salts of 2-Amino-4,6-dimethylpyrimidine and Carboxylic Acids Studied by Nuclear Quadrupole Resonance. J. Phys. Chem. B 2013, 117, 6946–6956. [Google Scholar] [CrossRef] [PubMed]
  62. Lavrič, Z. Utilization of Nuclear Quadrupole Resonance for Qualitative and Quantitative Study of Nifedipine and Piroxicam Polymorphism (Uporaba Jedrske Kvadrupolne Resonance za Kvalitativno in Kvantitativno Proučevanje Polimorfizma Nifedipina in Piroksikama). BS Thesis, University of Ljubljana, Ljubljana, Slovenia, 2009. [Google Scholar]
  63. Kojic-Prodic, B.; Ruzic-Toros, Z. Structure of the antiinflammatory drug 4hydroxy2methylN2pyridyl2H1[lambda]6,2benzothiazine3carboxamide 1,1dioxide (piroxicam). Acta Crystallogr. Sect B. 1982, 38, 2948–2951. [Google Scholar] [CrossRef]
  64. Sheth, A.R.; Bates, S.; Muller, F.X.; Grant, D.J.W. Polymorphism in Piroxicam. Cryst. Growth Des. 2004, 4, 1091–1098. [Google Scholar] [CrossRef]
  65. Mihalić, M.; Hofman, H.; Kajfež, F.; Kuftinec, J.; Blažević, N.; Žinić, M. Physicochemical and analytical characteristics of piroxicam. Acta Pharm. Jugosl. 1982, 32, 13–20. [Google Scholar]
  66. Mihalić, M.; Hofman, H.; Uftinec, J.; Krile, B.; Caplar, V.; Kajfež, F.; Blažević, N. Piroxicam. In Analytical Profiles of Drug Substances; Florey, K., Ed.; Academic Press: Orlando, FL, USA, 1986; pp. 509–531. [Google Scholar]
  67. Reck, G.; Dietz, G.; Laban, G.; Günther, W.; Bannier, G.; Höhne, E. X-ray studies on piroxicam modifications. Die Pharm. 1988, 43, 477–481. [Google Scholar]
  68. Reck, G.; Laban, G. Prediction and establishment of a new crystalline piroxicam modification. Die Pharm. 1990, 45, 257–259. [Google Scholar]
  69. Vrečer, F.; Srčič, S.; Šmid-Korbar, J. Investigation of piroxicam polymorphism. Int. J. Pharm. 1991, 68, 35–41. [Google Scholar] [CrossRef]
  70. Vrecer, F.; Vrbinc, M.; Meden, A. Characterization of piroxicam crystal modifications. Int. J. Pharm. 2003, 256, 3–15. [Google Scholar] [CrossRef]
  71. Naelapää, K.; Van De Streek, J.; Rantanen, J.; Bond, A.D. Complementing High-Throughput X-ray Powder Diffraction Data with Quantum–Chemical Calculations: Application to Piroxicam Form III. J. Pharm. Sci. 2012, 101, 4214–4219. [Google Scholar] [CrossRef] [PubMed]
  72. Puc, U. Jožef Stefan International Postgraduate School. Personal communication: Ljubljana, Slovenia, 2014. [Google Scholar]
  73. Budker, D.; Romalis, M. Optical magnetometry. Nat. Phys. 2007, 3, 227–234. [Google Scholar] [CrossRef] [Green Version]
  74. Beguš, S.; Pirnat, J.; Jazbinšek, V.; Trontelj, Z. Optical detection of low frequency NQR signals: A step forward from conventional NQR. J. Phys. D Appl. Phys. 2017, 50, 1–10. [Google Scholar] [CrossRef]
Figure 1. (a) Quadrupole energy levels (schematic) and allowed transitions for the spin 1 nucleus. (b) Sulfanilamide molecular structure (schematic). The para amino nitrogen N(1) and the sulfonamide nitrogen N(2) are marked.
Crystals 10 00450 g001
Figure 2. 14N NQR transition frequencies (ν+, ν and ν0) at 295 K for the α-, β- and γ-sulfanilamide polymorphs. Vertical lines denote the nitrogen (N(1) and N(2)) quadrupole frequencies. Reproduced with permission from reference [25], Trontelj Z et al., Journal of Pharmaceutical Sciences; published by Elsevier, 2019.
Crystals 10 00450 g002
Figure 3. Part of the 14N NQR spectra of the nitrogen (N(1)) atoms with the frequency ν+ for all three polymorphs of sulfanilamide (3393 kHz for the α-, 3426 kHz for the β- and 3343 kHz for the γ-polymorph). The measurements took place at 295 K with approximately the same amount of all sulfanilamide samples (~ 4 g). The presence of traces of the β-polymorph in the 14N NQR scan of the α-polymorph is visible. To obtain this signal-to-noise (S/N) ratio, the measurement time for one polymorph was 20 minutes. Reproduced with permission from reference [25], Trontelj Z et al., Journal of Pharmaceutical Sciences; published by Elsevier, 2019.
Crystals 10 00450 g003
Figure 4. Temperature dependence of the nuclear quadrupole resonance (NQR) lines for all three polymorphs, α-, β- and γ-, of sulfanilamide: (a) ν+ of nitrogen N(1), (b) ν+ of nitrogen N(2), (c) ν- of nitrogen N(1) and (d) ν- of nitrogen N(2). Polymorphs α-, β- and γ- are labelled with diamond, triangle and square symbols, respectively. Reproduced with permission from reference [25], Trontelj Z et al., Journal of Pharmaceutical Sciences; published by Elsevier, 2019.
Crystals 10 00450 g004
Figure 5. Room temperature 14N NQR spectra of the nitrogen N(2) (the highest frequency ν+ line) for the initial α-polymorph (with traces of the β-polymorph). A sample of sulfanilamide was thermally treated at different temperatures, indicated at the left side of each 14N NQR scan, prior to the 14N NQR measurements. The starting temperature was 295 K (room temperature). Small variations in the 14N NQR frequency, especially of the β-polymorph, are due to small variations in room temperature during time-separated thermal cycles. Reproduced with permission from [25], Trontelj Z et al., Journal of Pharmaceutical Sciences; published by Elsevier, 2019.
Crystals 10 00450 g005
Figure 6. Estimated fractions of polymorphs α, β and γ- in a sulfanilamide sample, which was initially mainly composed of the α-polymorph with a small fraction of the β-polymorph. Polymorphs α, β and γ are labelled with diamond, triangle and square symbols, respectively. Error bars are shown if the estimated fraction uncertainty at a given temperature is higher than 0.02. Reproduced with permission from reference [25], Trontelj Z et al., Journal of Pharmaceutical Sciences; published by Elsevier, 2019.
Crystals 10 00450 g006
Figure 7. Famotidine molecule (2D projection): enumeration and folding of the atoms in polymorph A (Panel A) and the same for polymorph B (Panel B). From [48,49].
Crystals 10 00450 g007
Figure 8. Empirical correlation between quadrupole frequencies ν+ in the environment of an amino group bound to a guanidine ion [58]. Reproduced with permission from reference [26], Lužnik J et al., Journal of Pharmaceutical Sciences; published by Elsevier, 2014.
Crystals 10 00450 g008
Figure 9. Typical characteristic part of the 14N NQR spectrum for a mixed sample of forms A and B of famotidine (approximately 75% form A and 25% form B). Reproduced with permission from reference [26], Lužnik J et al., Journal of Pharmaceutical Sciences; published by Elsevier, 2014.
Crystals 10 00450 g009
Figure 10. Dependence of the 14N NQR relative linewidth on the compacting pressure of tablet fabrication. The relative linewidth of the same 14N NQR line recorded in “Ulfamid” is indicated by the dotted line. Reproduced with permission from reference [26], Lužnik J et al., Journal of Pharmaceutical Sciences; published by Elsevier, 2014.
Crystals 10 00450 g010
Figure 11. (a) Structural formula of the piroxicam molecule with numbered nitrogen atoms, according to the assignation of the 14N NQR resonance lines ν + , ν , ν 0 . (b) Bar diagram of all 14N NQR frequencies for the four studied polymorphs of piroxicam I, II, III and V. Reproduced with permission from reference [28], Lavrič et al., Journal of Pharmaceutical Sciences; published by Elsevier, 2015.
Crystals 10 00450 g011
Figure 12. Superimposed 14N NQR spectra in the 3370−3460 kHz RF-band for the four piroxicam polymorphs at room temperature (normalized, neglecting the weak signals of possible impurities). These NQR lines belong to the 14N atoms of the pyridine fragment (N2, ν + ). Reproduced with permission from reference [28], Lavrič Z et al., Journal of Pharmaceutical Sciences; published by Elsevier, 2015.
Crystals 10 00450 g012
Figure 13. (a) Dependence of the piroxicam polymorph portions, evaluated from 14N NQR signals around 3.4 MHz at the time of heating at 140 °C of the initial form II. Note the decrease in the polymorph II portion and increase in that of polymorph I. (b) Initial form III—dependence of the polymorph portions (obtained from 14N NQR) at the time of 140 °C heating; final shock to 160 °C completes the transformation of the remaining intermediate form V to the polymorph I. (c) Initial form V (unpure)—dependence of the polymorph portions (obtained from 14N NQR) at the time of 140 °C heating; final shock to 160 °C causes an almost abrupt transformation of the starting form V to the polymorph I. Reproduced with permission from reference [28], Lavrič Z et al., Journal of Pharmaceutical Sciences; published by Elsevier, 2015.
Crystals 10 00450 g013
Figure 14. Graphic comparison of QCCs (a) and corresponding asymmetry parameters η (b) in successive polymorphs of piroxicam. Reproduced with permission from reference [28], Lavrič Z et al., Journal of Pharmaceutical Sciences; published by Elsevier, 2015.
Crystals 10 00450 g014
Figure 15. ν+ (2587 kHz) 14N NQR signal intensity dependence on the volume fraction (WV/V) of piroxicam I (resonating 14N NQR quadrupolar nuclei N3) in mixture with pyridine monohydrate. Reproduced with permission from reference [27], Lavrič Z et al., Journal of Pharmaceutical Sciences; published by Elsevier, 2010.
Crystals 10 00450 g015
Figure 16. Relative 14N NQR ν + and ν linewidths in monoclinic paracetamol versus the compacting pressure of tablet preparation. Reproduced with permission from reference [15], ], Lužnik J et al., Applied Magnetic Resonance; published by Springer, 2013.
Crystals 10 00450 g016
Figure 17. Normalized 14N NQR ν+ and ν NQR signals from different monoclinic paracetamol commercial tablets for (a) 1921 kHz and (b) 2564 kHz lines. For comparison, the 14N NQR lines of an uncompressed powder sample are also included. Reproduced with permission from reference [15], Lužnik J et al., Applied Magnetic Resonance; published by Springer, 2013.
Crystals 10 00450 g017
Figure 18. Aminotetrazole monohydrate 14N NQR line at 1.2132 MHz. Signal obtained with the K-OPM improved NQR spectrometer, panel (a), and classic NQR spectrometer, panel (b). Signals in the frequency (upper two panels) and in temporal domains with real parts (thick line) and imaginary parts (thin line) (lower two panels). Reproduced with permission from reference [74], Begus S et al., Journal of Physics D: Applied Physics; published by IOP Publishing Ltd, 2017.
Crystals 10 00450 g018
Table 1. Measured 14N NQR transition frequencies, with the corresponding temperature coefficients, quadrupole coupling constants (QCC), asymmetry parameters η and spin-lattice relaxation time T1 of the α-, β- and γ-sulfanilamide polymorphs at 295 K. The upper rows belong to the N(1) and the lower rows to the N(2) atoms in the sulfanilamide molecule. Reproduced with permission from reference [25], Trontelj Z et al., Journal of Pharmaceutical Sciences; published by Elsevier, 2019.
PolymorphAtomν+
(kHz)
dν+/dT
(kHz/K)
ν
(kHz)
dν/dT
(kHz/K)
ν0
(kHz)
QCC
(kHz)
ηT1
(ms)
AN(1)3393−0.172416−0.1297738730.5025
N(2)3049−0.232516−0.2553337100.29400
ΒN(1)3426−0.352496−0.3293039470.4725
N(2)3074−0.402565−0.3950937430.29400
ΓN(1)3343−0.192400−0.1394438290.4925
N(2)3041−0.952541−1.1750037210.2725
Table 2. 14N NQR transition frequencies at room temperature for the polymorphic forms A and B of famotidine belonging to all seven different nitrogen positions in each of the two crystal unit cells. Reproduced with permission from reference [26], Lužnik J et al., Journal of Pharmaceutical Sciences; published by Elsevier, 2014.
Form A*ν+ (kHz)ν (kHz)ν0 (kHz)QCC (kHz)η
Na34552443101239320.51
Nb2862206579732850.49
Nc2819208073932660.45
Nd2738227446433410.28
Ne2735203070531770.44
Nf2603197163230490.41
Ng1979145752222910.46
Form B*ν+ (kHz)ν (kHz)ν0 (kHz)QCC (kHz)η
Nh3462247299039560.50
Ni2887236452335010.30
Nj2848223461433880.36
Nk2787204374432200.46
Nl2649213351631880.32
Nm2587176582229010.57
Nn1982133964322140.58
*Arbitrary enumeration Na,b,c,… in order of descending ν + .
Table 3. 14N NQR Frequencies, Quadrupole Coupling Constants (QCC) and Asymmetry Parameters η of Piroxicam Polymorphs I, II, III and V at room temperature. Reproduced with permission from Reference [28], Lavrič et al., Journal of Pharmaceutical Sciences; published by Elsevier, 2015
v+
[kHz]
v
[kHz]
v0
[kHz]
QCC
[kHz]
η
IN13928368624250760.0954
N23439298345642810.213
N32587197261530390.405
IIN13852360025249680.101
N23399294645542300.215
N32533208145230760.294
IIIN14008376324551810.0946
N23392296742542390.201
N32592208550731180.325
VN13849358726249570.106
N23419295646342500.218
N32532207545730710.298
Table 4. 14N NQR transition frequencies ν , linewidths Δ ν , and relaxation times T1 in two polymorphs of paracetamol at room temperature. Reproduced with permission from reference [15], Lužnik J et al., Applied Magnetic Resonance; published by Springer, 2013.
MonoclinicOrthorhombic
νΔνT1νΔνT1
[kHz][Hz][s][kHz][Hz][s]
2564140011257023006
192118005195530003
643 615

