Article

Fabrication of Hybrid Catalyst ZnO Nanorod/α-Fe2O3 Composites for Hydrogen Evolution Reaction

1
Department of Electro-Optical Engineering, National Taipei University of Technology, No.1, Section 3, Chung-Hsiao East Road, Taipei 106, Taiwan
2
Department of Chemical Engineering and Biotechnology, National Taipei University of Technology, No.1, Section 3, Chung-Hsiao East Road, Taipei 106, Taiwan
3
Department of Chemical and Environmental Engineering, University of Nottingham Malaysia, Broga Road, Semenyih 43500, Malaysia
*
Author to whom correspondence should be addressed.
Crystals 2020, 10(5), 356; https://doi.org/10.3390/cryst10050356
Submission received: 26 March 2020 / Revised: 26 April 2020 / Accepted: 28 April 2020 / Published: 30 April 2020
(This article belongs to the Special Issue Nanomaterials for Energy and Recycling)

Abstract

:
This report presents the synthesis of ZnO nanorod/α-Fe2O3 composites by the hydrothermal method with different weight percentages of α-Fe2O3 nanoparticles. The as-synthesized nanorod composites were characterized by different techniques, such as X-ray diffraction (XRD), Fourier transform-infrared (FT-IR), field emission scanning electron microscopy (FE-SEM), electrochemical impedance spectroscopy (EIS), and X-ray photoelectron spectroscopy (XPS). From our results, it was found that the ZnO/α-Fe2O3 (3 wt%) nanorod composites exhibit a higher hydrogen evolution reaction (HER) activity when compared to other composites. The synergetic effect between ZnO and (3 wt%) of α-Fe2O3 nanocomposites resulted in a low onset potential of −125 mV, which can effectively produce more H2 than pure ZnO. The H2 production rate over the composite of ZnO/α-Fe2O3 (3 wt%) clearly shows a significant improvement in the photocatalytic activity in the heterojunction of the ZnO nanorods and α-Fe2O3 nanoparticles on nickel foam.

Graphical Abstract

1. Introduction

In recent decades, fossil fuels have conventionally been the most important source of fuel, but the consumption of fossil fuels is a serious environmental concern. It is therefore essential to develop renewable energy resources that do not contaminate the environment. To date, many methods have been developed to produce alternative energy sources without the emission of carbon. Of these, solar energy has attracted much attention as a sustainable and clean alternative energy source [1,2]. The conversion of solar energy into chemical energy is a promising technique for producing renewable energy. This technology is an attractive way to directly utilize solar-converted energy in the form of water-splitting systems with high solar-to-hydrogen efficiencies. Photocatalysis and photovoltaic systems are the most important routes for the conversion of solar energy into chemical energy in an environmentally friendly way, so they have been of great interest for several decades. Specifically, the photocatalytic process has attracted enormous interest as an effective method for the treatment of environmental pollutants. In addition, the photogeneration of hydrogen under light irradiation using a photocatalyst has been considered as a potentially significant strategy for hydrogen production [3,4,5].
Over the past three decades, hydrogen production through the solar-driven method with the support of semiconductor photocatalysts has been a simple, cost-effective approach for converting solar energy into hydrogen [6,7]. The thermodynamic requirement for water splitting into H2 and O2 is 1.23 eV, so the bandgap energy of the photocatalyst should be higher than 1.23 eV [8]. This is the combination of two reactions, namely, oxygen evolution reaction (OER) and hydrogen evolution reaction (HER). Commonly, three main types of water-splitting methods have been adopted: photocatalysis, photoelectrochemical splitting, and electrocatalysis [9]. Among them, electrocatalytic water splitting is a remarkable, simple, and green process for hydrogen production [10,11,12,13,14]. Generally, a noble metal-based catalyst is used for electrolytic hydrogen production. However, various semiconductor materials have been studied because of their direct bandgap, physicochemical properties, and versatile catalytic activities. Based on the above superior properties, researchers have focused on semiconductor nanomaterials with a high surface area and plasmonic resonance, which are the crucible for novel applications such as energy devices and the removal of organic pollutants [15,16,17]. In addition, various semiconductors have been used for hydrogen generation, especially ZnO, TiO2, and α-Fe2O3, which is one of the most attractive materials for hydrogen production with an n-type semiconductor, and which has excellent optical properties [18,19]. It is the most stable and most abundant material on earth and has been used for various applications, such as photocatalysts, supercapacitors, and sensors. Other than α-Fe2O3, ZnO is another attractive semiconductor that has many potential applications, such as dye degradation, supercapacitors, and hydrogen evolution [20,21,22]. It can be favorable to study metal oxide photoanodes as they have a direct bandgap with favorable band edges for the water-splitting redox levels. To improve water-splitting performance, utilizing visible light is the most commonly used strategy by fabricating the ZnO heterostructure with other small bandgap materials. Many researchers have used ZnO and α-Fe2O3 as a heterojunction, resulting in hydrogenation with a low bandgap and the ability to stimulate the photoresponse of electrons and holes [23,24,25]. In addition, ZnO and α-Fe2O3 are both earth-abundant photocatalysts with good activity, and a synthesis of these hybrid materials improves photocatalytic performance [26,27,28,29]. Based on this, a coupling of hierarchical α-Fe2O3 with ZnO could be considered as a good strategy for constructing highly effective electrocatalysts for HER.
Recently, much research has focused on developing electrocatalysts for HER, OER, and overall water splitting based on earth-abundant transition metals. Interestingly, Ni-based catalysts, which include Ni2P, NiFeP, NiFe-layered double hydroxide [30,31,32], and Ni/NiO/carbon nanotube, are more attractive for water splitting. It has been shown that the activation of a Ni carbon-based catalyst through the application of electrochemical potential results in HER activity comparable to Pt in an acidic medium. To achieve the high current density with a large producing rate of H2/O2 bubbles, the conductive substrates are essential, such as carbon paper, FTO, nickel foil, iron substrates, and nickel foam [33,34,35]. Among these substrates, nickel foam has the advantages of good electrical conductivity, a high specific surface, and a porous structure. Therefore, using nickel foam in the generation of the hydrogen evolution process has attracted great consideration due to its high current density.
In this present work, we propose a hydrothermal method to fabricate ZnO nanorods with different weight percentages of α-Fe2O3 nanoparticles that are deposited on Ni foam for electrocatalytic studies. This Ni foam has good catalytic activity and acts as a durable electrolyte in the acidic electrolyte. The ZnO/α-Fe2O3 shows excellent morphology, crystal structure, and impedance performance. Systematic investigation of ZnO/α-Fe2O3 nanocomposites was performed, and they were found to be favorable for higher HER activity with better overpotential.

2. Materials and Methods

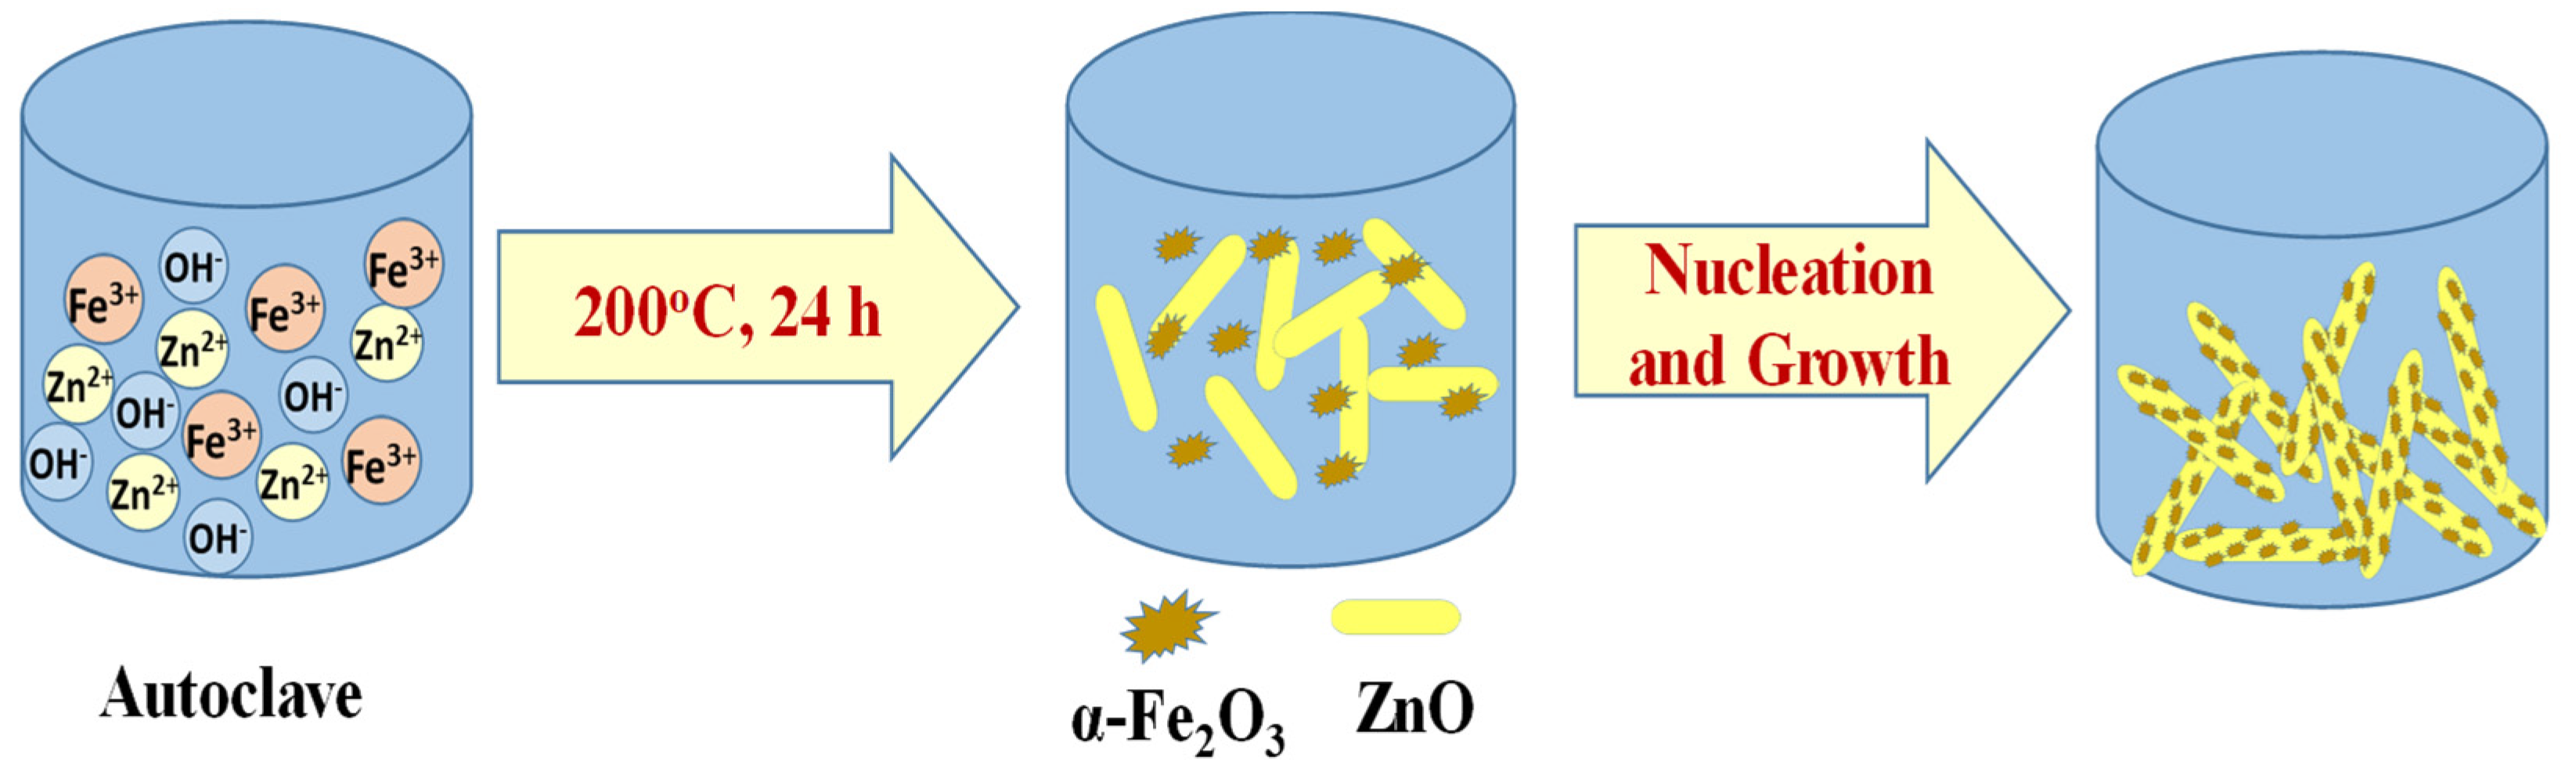
2.1. Preparation of ZnO/α-Fe2O3 Nanorod Composites

All the reagents and chemicals used for the preparation of the nanorod composites are analytical grade. In this study, 500 mg of zinc acetate and 5, 10, and 15 mg of ferric nitrate with sodium hydroxide (0.5M) were mixed with 20 ml of DI water. These solutions were transferred to 20 ml of Teflon-lined autoclave, followed by a hydrothermal treatment at 200 °C for 24 hours. After being cooled to ambient temperature, the brown solid was collected from the autoclave and thoroughly washed with ethanol to remove the impurities, followed by annealing at 450 °C for 4 h. The α-Fe2O3 nanoparticles were grown on ZnO nanorods through a simple co-precipitation method using the hydrothermal approach as illustrated in Scheme 1. In the beginning, both metals exist in the form of ions in the alkaline medium. The hydrothermal process initiates the co-precipitation of metal ions into hydroxides, followed by nucleation and growth of α-Fe2O3 nanoparticles decorated ZnO nanorods. A further annealing process leads to the formation of highly crystalline nanocomposites without impurities.

2.2. Hydrogen Evolution Reaction (HER)

The three-electrode electrochemical workstation (CHI 614 C, Austin, TX, USA) was used to measure the linear sweep voltammetry at room temperature. Platinum is the counter electrode, nickel foam is the working electrode with 0.5 M H2SO4, and Ag/AgCl is the reference electrode. The working electrode was prepared by mixing ZnO/α-Fe2O3 with 1 ml of 10 μl Nafion, 10 μl ethanol, and 80 μl distilled water under ultrasonication for 45 min. The linear sweep voltammetry (LSV) was measured between −0.8 and −1.6 eV vs. Ag/AgCl at 50 mVs−1. The onset overpotential generally denotes the applied potential, and thus, a current starts to appear. To improve the catalysts quantitatively, the overpotential at 10 mA cm−2 was taken as a reference. Before the electrocatalytic H2 evolution, the solution was purged with N2 for 30 min. In this measurement, the Ag/AgCl was used as the reference electrode and was converted with respect to a reversible hydrogen electrode (RHE):
E (RHE) = E (Ag/AgCl) + 0.204 Vx pH
The current density of the electrode was measured by dispersing the working electrode, then uniformly coated onto bare nickel foam with the mass loading of 20 mg and dried in an electric oven at 50 °C for 1 hr. Before each electrochemical test, the electrode was activated by 5~10 CV cycles in the corresponding testing electrolyte.

2.3. Characterization

The X-ray diffraction spectra were analyzed (Analytical X’Pert 246 PRO, Almelo, Netherlands) using filtered CuKα radiation (λ = 1.5418 Å). The chemical bonds were studied using a PerkinElmer (Seer Green, UK), an FT-IR spectrometer. The structural morphologies of the catalysts were studied using field emission scanning electron microscopy (FE-SEM) with a JEOL JSM-7100F (Tokyo, Japan). The binding energy of the nanocomposites was observed from the X-ray photoelectron spectra (XPS) obtained using a JEOL JPS-9030 (Tokyo, Japan). Transmission electron microscopy (TEM) was analyzed by a JEOL JEM-2100F (MA, USA). The electrochemical impedance measurement was carried out using a Zive Potentiostate, SP100. Electrochemical impedance spectroscopy (EIS) was used to observe the interfacial properties of the ZnO/α-Fe2O3 with various ratios of α-Fe2O3 with a modified glassy carbon electrode (GCE) in 0.1M KCl containing 5mM of Fe(CN)6, wherein bias potential = 0 V, amplitude = 5 mV, and frequency = 0.1Hz–100 kHz were applied.

3. Results and Discussion

Figure 1 shows the XRD spectra of ZnO and ZnO/α-Fe2O3 with a different weight percentage of α-Fe2O3 nanoparticles. The XRD peaks of the ZnO nanorods observed at 31.7.1° (100), 34.4° (002), 36.2° (101), 47.9° (102), and 56.81° (110) can be readily ascribed to the characteristic peaks of the ZnO phase, which is confirmed with a JCPDS card 79–0206 as shown in Figure 1 [22]. The distinct 2θ peaks observed at 32.2, 35.7, 40.9, and 49.4° confirmed the presence of the α phase of α-Fe2O3 nanoparticles according to the JCPDS map 79-0007 as shown in the inset Figure 1 [36]. After the addition of α-Fe2O3 nanoparticles, the small relative intensity peaks started to broaden at 32.2 and 35.7° with the increasing weight ratio of α-Fe2O3 nanoparticles as seen in Figure 1. The crystallite size of the ZnO and ZnO/α-Fe2O3 with different weight percentages of α-Fe2O3 nanoparticles was also calculated from the XRD spectra using Scherrer’s formula:
d = 0.9λ/B cosθ
where λ, θ, and B are the X-ray wavelength (1.54 Å), Bragg diffraction angle, and line of full width at half maximum, respectively. The particle size of the ZnO, ZnO/α-Fe2O3(1 wt%), ZnO/α-Fe2O3(3 wt%), and ZnO/α-Fe2O3(5 wt%) are 47.97, 36.62, 33.57, and 30.99 nm, respectively. The decreasing particle size is observed due to increasing the α-Fe2O3 concentration and decreasing the growth of the ZnO nanorods. However, the observed particle size of the nanocomposites is ~500 nm, which differs from the calculated crystallite size. This is because the nanocomposite particles are composed of several different crystallites, which results in changes in the size of the particle.
Figure 2 shows the FT-IR spectra of ZnO/α-Fe2O3 with a different weight percentage of α-Fe2O3. The peaks at 3436 and 1629 cm-1 are attributed to the stretching vibration of the hydroxyl groups of ZnO and α-Fe2O3. This confirms the presence of the adsorption site, i.e., the hydroxyl group that helps to increase the photocatalytic efficiency of the nanocomposites. A significant peak observed from 500 to 600 cm−1 was attributed to the stretching vibration of the Zn-O and Fe-O bonds in the ZnO nanorods and α-Fe2O3 nanoparticles [23,37,38]. The peaks at about 1326 and 1629 cm−1 are assigned to the symmetric and asymmetric stretching vibration of the carboxylate band, due to the presence of the acetate group, which may be formed as a surface species chelated to Zn(II) [39,40]. Hence, the FT-IR results agreed well with those of the XRD profiles, indicating the formation of α-Fe2O3 nanoparticles on the surface of the ZnO nanorods.
The FE-SEM images of the ZnO nanorods and ZnO/α-Fe2O3 with different weight percentages of α-Fe2O3 nanoparticles are illustrated in Figure 3. In Figure 3a, the ZnO nanorods with a length size of 500 nm appeared with a sharp end. After the introduction of 1 wt % α-Fe2O3, α-Fe2O3 nanoparticles with sizes of 20 nm are grown on the ZnO nanorods. More α-Fe2O3 nanoparticles are observed on the ZnO nanorods as shown in Figure 3b,c, when the weight percentage is increased to 3 and 5 wt %. In Figure 3d, the formation of more α-Fe2O3 nanoparticles is observed, which may influence the growth of the ZnO nanorods. After the growth of the 5 wt % of α-Fe2O3 nanoparticles on the ZnO nanorods, it is clearly observed that the entire surface of the ZnO nanorods is covered with the α-Fe2O3 nanoparticles. Subsequently, after the hydrothermal growth, the structure of the ZnO nanorods is still well preserved. The magnified TEM image of the ZnO/α-Fe2O3 (3 wt% α-Fe2O3) shows the ZnO nanorods with a 500 nm length and 20 nm width, which are covered by α-Fe2O3 nanoparticles as shown in Figure 3f. The TEM image of Figure 3f shows the needle-shaped ZnO nanorod covered with α-Fe2O3 nanoparticles, and it reveals the close interaction of ZnO with α-Fe2O3, which is reflected in the synergistic effect between the composites. An energy dispersive X-ray spectroscopy (EDS) analysis was carried out to examine the chemical composition of ZnO/α-Fe2O3 nanocomposites. The EDS results show the weight ratio of Zn (78.34), Fe (2.67), and O (18.74). As shown in Figure 3g, peaks for the elements of Fe, Zn, and O were detected, and no other impurities can be observed. This result shows the formation of ZnO/α-Fe2O3 nanocomposites and reveals that Fe, Zn, and O elements exist in the nanocomposites, as shown in Figure 3g.
The optical absorption spectra of the ZnO and ZnO/α-Fe2O3 nanocomposites with different weight percentages are shown in Figure 4, which shows the pure ZnO absorption peak at 345 nm exhibited in the UV region [41,42]. Further, it extends to the visible region after incorporating α-Fe2O3 with different weight percentages. The absorption spectra of α-Fe2O3 are included as the inset of Figure 4 and reveal the absorption edge at around 580 nm, which is the characteristic of α-Fe2O3 pristine [43,44]. Apparently, the ZnO and ZnO/α-Fe2O3 (1 and 3 wt%) nanocomposites show similar absorption edges. When adding more α-Fe2O3 (5 wt%) with ZnO nanorods, the absorption characteristics start to dominate, which show high absorption in the visible light region. This indicates that there is an increase in the optical absorption coefficient for ZnO/α-Fe2O3 at longer wavelengths compared to ZnO due to the fact that a semiconductor with a smaller bandgap, α-Fe2O3, is present in the nanocomposite material.
The XPS survey spectra revealed the elemental composition of the ZnO, α-Fe2O3, and ZnO/α-Fe2O3 as illustrated in Figure 5a. At the survey spectra of α-Fe2O3, the peak is observed at 711.18 eV, which corresponds to the 2p3/2 of Fe2O3. [45]. Moreover, peaks at 1022.3 and 1045.3 eV are present in the survey spectra of ZnO, corresponding to Zn 2p3/2 and Zn 2p1/2, which is attributed to Zn-O, thus confirming that Zn exists in the oxidation state [46,47]. In Figure 5b, the four peaks with different binding energies are fitted at 527.82, 530.85, and 532.7 eV for the ZnO/α-Fe2O3 nanocomposites. The peak at 529.95 arises from the Zn-O band. The peak which emerged at 530.85 eV and is observed from the surface lattice oxygen and at 532.7 eV is attributed to the surface-adsorbed oxygen species of O2- [47]. It should be noted that after adding α-Fe2O3, it leads to the energy levels of oxygen vacancies, which confirm the charge separation of photogenerated electrons and holes. It is noted that the peaks at 710.39, 711.75, and 713.57 eV are attributed to Fe3+, confirming the α-Fe2O3 nanoparticles on the ZnO nanorods as shown in Figure 5c [48]. The Fe3+ ion observed in the nanocomposites is evidence of the synergetic effect, which improves the photocatalytic process. From the analysis spectra of ZnO and the ZnO/α-Fe2O3 nanocomposites, the exhibited peaks at 1021.5 and 1045 eV correspond to Zn2p3/2 and Zn2p1/2 respectively, as shown in Figure 5d [47,49]. The high-intensity major peak at 1022.3 eV represents the Zn2+ of the deposited ZnO, whereas the low-intensity peak at 1021.5 eV of the ZnO/α-Fe2O3 nanocomposites indicates the changed chemical environment. The binding of Zn2+ with the surface oxygen attached to Fe3+ probably results in the shifting of binding energy as shown in Figure 5d. These results indicate the formation of the ZnO/α-Fe2O3 containing Zn, Fe, O, and C elements with their binding energies.
The electrochemical impedance spectra were also recorded for ZnO and ZnO/α-Fe2O3 with different weight percentages of α-Fe2O3 (1, 3, and 5 wt%) as illustrated in Figure 6. EIS was carried out to analyze the photoinduced charge-transfer resistance on the interfacial layers of the different modified electrodes [50]. This method is used to measure the amplitude of the alternating current (AC) signal with different frequencies that are able to observe the ratio of the AC signal voltage to the current with the variation of sinusoidal frequency (ω) or the phase angle of impedance. Further, this method is used to determine the frequency-dependent impedance of the electrochemical system by applying equivalent circuit modeling to observe the electrical properties of the system. Nyquist plots indicate the decrease in charge-transfer resistance, and they lead to a fast interfacial charge-transfer process as well as an effective separation of photogenerated electron–hole pairs [51]. Moreover, they give information about the nanomaterial properties, such as conductivity and the dielectric constant and interfacial region of capacitance and derived quantities. The semicircle of all the materials normally consists of charge-transfer resistance (Rct) [52] and interfacial resistance (Rint) [53]. Nevertheless, Rct and Rint are not easily separated from the depressed semicircle because their time constants are near to each other. Here, we consider the total resistance (Rtot), which is generally reflected in the electrical conductivity of all the materials. The low Rct suggests that these electrodes have a lower interfacial resistance with a better charge transfer. The smallest semicircle radius was observed in ZnO/α-Fe2O3 (3 wt%), which has low impedance when compared with the other weight percentages of α-Fe2O3 (1 and 5 wt%). This low impedance is due to the synergistic effect between ZnO and α-Fe2O3 and thus improves the electron transfer charge. In addition, the importing interfacial charge separation between ZnO and α-Fe2O3 also reduces exciton quenching and energy dissipation.

Hydrogen Evolution Reaction (HER)

The electrocatalytic activity of hydrogen evolution was measured for ZnO and the ZnO/α-Fe2O3 nanocomposites with different weight percentages of the α-Fe2O3 nanoparticles as shown in Figure 7. A HER study for all the catalysts was evaluated under identical conditions. The ZnO/α-Fe2O3 (3 wt%) nanocomposite shows a low onset potential of −125 mV to reach the current density of 10 mA cm−2. However, the required onset potential for pure ZnO is −210 mV, which is higher than the hybrid nanocomposites to attain the benchmark current density of 10 mA cm−2. This onset potential of ZnO/α-Fe2O3 (3 wt%) is shifted negatively compared with that of ZnO/α-Fe2O3 (1 and 5 wt%) and thus enhances the catalytic activity due to the superior electron transfer efficiency caused by the electronic conductivity, which is confirmed by EIS. Consequently, the ZnO/α-Fe2O3 (3 wt%) is perfect for hydrogen adsorption and enhances HER activity. The particular combination of α-Fe2O3 helps to improve the redox sites between the ZnO and α-Fe2O3 heterojunction to increase the conductivity. Further, the incorporation of Fe could enhance the adsorption of water on the surface of the nanocomposites. This leads to the transfer of electrons to the water molecules, thereby accelerating the formation of Hads. Thus, the increased HER activity of ZnO/α-Fe2O3 (3 wt%) probably originates in the facile charge transfer between the catalyst and the water molecules. From these results, we observed that the HER performance from a negative electrode arose from the reduction of the protons to H atoms on the ZnO/α-Fe2O3 nanorod composites and produced hydrogen gas with the recombination of two H atoms. Moreover, acidic electrolytes of 0.5 M H2SO4 were used, which is beneficial for the production of hydrogen for the large supply of H+ ions in the solution.

4. Conclusions

The fabrication of ZnO nanorods/α-Fe2O3 composites was effectively prepared by the hydrothermal method. The synthesized photocatalyst demonstrates superior photocatalytic efficiency with moderate hydrogen evolution. The ZnO/α-Fe2O3 nanocomposites show the best HER results when compared with other ZnO and α-Fe2O3 materials. The photogenerated electrons were successfully separated and transferred, and the recombination of electron–hole pairs was avoided; thus, ZnO/α-Fe2O3 significantly improves the photocatalytic hydrogen production performance of the nanocomposites. The main advantages of this unique architecture, the ZnO/α-Fe2O3 nanocomposites, can provide a large number of active sites, and the highly conductive Ni foam can promote the transfer of electrons. The three-dimensional-networked structure can facilitate the diffusion and penetration of the electrolyte. Electrochemical measurements reveal that ZnO/α-Fe2O3 on Ni foam electrodes exhibits greatly improved performance for HER with a low onset overpotential (−125 mV). The achieved results will open up the fabrication of ZnO-based hybrid devices with low-cost materials.

Author Contributions

K.U., T.C.-K.Y. and J.-H.L. conceived and designed the research concept; K.U., S.C. and E.M. prepared the setup and performed the experiments; K.U. analyzed the data; J.-H.L. did the funding acquisition; T.C.-K.Y., J.-H.L. and K.U. finished the manuscript. All authors have read and agreed to the published version of the manuscript.

Funding

This research was funded by Ministry of Science and Technology (MOST), “108-2112-M-027-001” and 108-2112-M-027-003“. The APC was funded by “National Taipei University of Technology, Taipei, Taiwan”.

Acknowledgments

We acknowledge the Precision Analysis and Materials Research Center, NTUT, Taipei for their support.

Conflicts of Interest

There are no conflicts of interest in this work.

References

  1. Hashimoto, K.; Kawai, T.; Sakata, T. Photocatalytic reactions of hydrocarbons and fossil fuels with water. Hydrogen production and oxidation. J. Phys. Chem. 1984, 88, 4083–4088. [Google Scholar] [CrossRef]
  2. Shimura, K.; Yoshida, H. Heterogeneous photocatalytic hydrogen production from water and biomass derivatives. Energy Environ. Sci. 2011, 4, 2467–2481. [Google Scholar] [CrossRef]
  3. Wang, L.; Xu, N.; Pan, X.; He, Y.; Wang, X.; Su, W. Cobalt lactate complex as a hole cocatalyst for significantly enhanced photocatalytic H2 production activity over CdS nanorods. Catal. Sci. Technol. 2018, 8, 1599–1605. [Google Scholar] [CrossRef]
  4. Ran, J.; Gao, G.; Li1, F.; Ma, Y.; Du, A.; Qiao, S. Ti3C2 M Xene co-catalyst on metal sulfide photo-absorbers for enhanced visible-light photocatalytic hydrogen production. Nat. Commun. 2017, 8, 13907. [Google Scholar] [CrossRef] [PubMed] [Green Version]
  5. Li, L.; Fang, W.; Zhang, P.; Bi, J.; He, Y.; Wang, J.; Su, W. Sulfur-doped covalent triazine-based frameworks for enhanced photocatalytic hydrogen evolution from water under visible light. J. Mater. Chem. A 2016, 4, 12402–12406. [Google Scholar] [CrossRef]
  6. Li, H.; Yu, K.; Tan, Z.; Guo, B.; Lei, X.; Fu, H.; Zhu, Z. Charge-Transfer Induced High Efficient Hydrogen Evolution of MoS2/graphene Cocatalyst. Sci. Rep. 2015, 5, 18730. [Google Scholar] [CrossRef] [Green Version]
  7. Huang, C.-W.; Wu, M.-C.; Nguyen, V.-H.; Nguyen, B.-S. Preparation and Characterization of Nanocrystalline TiO2 on Microsericite for High-Efficiency Photo-Energy Conversion of Methanol to Hydrogen. Crystals 2019, 9, 380. [Google Scholar] [CrossRef] [Green Version]
  8. Walter, M.G.; Warren, E.L.; McKone, J.R.; Boettcher, S.W.; Mi, Q.; Santori, E.A.; Lewis, N.S. Solar Water Splitting Cells. Cells. Chem. Rev. 2010, 110, 6446–6473. [Google Scholar] [CrossRef]
  9. Merki, D.; Hu, X. Recent developments of molybdenum and tungsten sulfides as hydrogen evolution catalysts. Energy Environ. Sci. 2011, 4, 3878–3888. [Google Scholar] [CrossRef] [Green Version]
  10. Yan, Y.; Xia, B.; Xu, Z.; Wang, X. Recent Development of Molybdenum Sulfides as Advanced Electrocatalysts for Hydrogen Evolution Reaction. ACS Catal. 2014, 4, 1693–1705. [Google Scholar] [CrossRef]
  11. Lv, R.; Robinson, J.A.; Schaak, R.E.; Sun, D.; Sun, Y.; Mallouk, T.E.; Terrones, M. Transition Metal Dichalcogenides and Beyond: Synthesis, Properties, and Applications of Single- and Few-Layer Nanosheets. Acc. Chem. Res. 2015, 48, 56–64. [Google Scholar] [CrossRef] [PubMed]
  12. Li, Z.; Dai, X.; Du, K.; Ma, Y.; Liu, M.; Sun, H.; Ma, X.; Zhang, X. Reduced Graphene Oxide/O-MWCNT Hybrids Functionalized with p-Phenylenediamine as High-Performance MoS2 Electrocatalyst Support for Hydrogen Evolution Reaction. J. Phys. Chem. C 2016, 120, 1478–1487. [Google Scholar] [CrossRef]
  13. Pellegrino, F.; Sordello, F.; Minella, M.; Minero, C.; Maurino, V. The Role of Surface Texture on the Photocatalytic H2 Production on TiO2. Catalysts 2019, 9, 32. [Google Scholar] [CrossRef] [Green Version]
  14. Abdulrazzak, F.H.; Hussein, F.H.; Alkaim, A.F.; Ivanova, I.; Emelinee, A.V.; Bahnemannde, D.W. Sonochemical/hydration–dehydration synthesis of Pt–TiO2 NPs/decorated carbon nanotubes with enhanced photocatalytic hydrogen production activity. Photochem. Photobiol. Sci. 2016, 15, 1347–1357. [Google Scholar] [CrossRef] [PubMed] [Green Version]
  15. Wang, D.; Geng, Z.; Hou, P.; Yang, P.; Cheng, X.; Huang, S. Rhodamine B Removal of TiO2@SiO2 Core-Shell Nanocomposites Coated to Buildings. Crystals 2020, 10, 80. [Google Scholar] [CrossRef] [Green Version]
  16. Guo, M.; He, Q.; Wang, A.; Wang, W.; Fu, Z. A Novel, Simple and Green Way to Fabricate BiVO4 with Excellent Photocatalytic Activity and Its Methylene Blue Decomposition Mechanism. Crystals 2016, 6, 81. [Google Scholar] [CrossRef] [Green Version]
  17. Jia, T.; Li, J.; Long, F.; Fu, F.; Zhao, J.; Deng, Z.; Wang, X.; Zhang, Y. Ultrathin g-C3N4 Nanosheet-Modified BiOCl Hierarchical Flower-Like Plate Heterostructure with Enhanced Photostability and Photocatalytic Performance. Crystals 2017, 7, 266. [Google Scholar] [CrossRef]
  18. Zhu, J.; Yin, Z.; Yang, D.; Sun, T.; Yu, H.; Hoster, H.E.; Hng, H.H.; Zhang, H.; Yan, Q. Hierarchical hollow spheres composed of ultrathin Fe2O3 nanosheets for lithium storage and photocatalytic water oxidation. Energy Environ. Sci. 2013, 6, 987–993. [Google Scholar] [CrossRef]
  19. Osterloh, F.E. Inorganic nanostructures for photoelectrochemical and photocatalytic water splitting. Chem. Soc. Rev. 2013, 42, 2294–2320. [Google Scholar] [CrossRef]
  20. Chen, Y.; Tse, W.H.; Chen, L.; Zhang, J. Ag nanoparticles-decorated ZnO nanorod array on a mechanical flexible substrate with enhanced optical and antimicrobial properties. Nanoscale Res. Lett. 2015, 10, 106. [Google Scholar] [CrossRef] [Green Version]
  21. Yang, P.; Yan, H.; Mao, S.; Russo, R.; Johnson, J.; Saykally, R.; Morris, N.; Pham, J.; He, R.; Choi, H.-J. Controlled Growth of ZnO Nanowires and Their Optical Properties. Adv. Funct. Mater. 2002, 12, 323–331. [Google Scholar] [CrossRef]
  22. Su, Y.; Zhao, Z.; Li, S.; Liua, F.; Zhang, Z. Rational design of a novel quaternary ZnO@ZnS/Ag@Ag2S nanojunction system for enhanced photocatalytic H2 production. Inorg. Chem. Front. 2018, 5, 3074–3081. [Google Scholar] [CrossRef]
  23. Mao, N. Investigating the Heteronjunction between ZnO/Fe2O3 and g-C3N4 for an Enhanced Photocatalytic H2 production under visible-light irradiation. Sci. Rep. 2019, 9, 12383. [Google Scholar] [CrossRef] [PubMed] [Green Version]
  24. Tama, A.M.; Das, S.; Dutta, S.; Bhuyan, M.D.I.; Islamb, M.N.; Basith, M.A. MoS2 nanosheet incorporated α-Fe2O3/ZnO nanocomposite with enhanced photocatalytic dye degradation and hydrogen production ability. RSC Adv. 2019, 9, 40357–40367. [Google Scholar] [CrossRef] [Green Version]
  25. Sankaran, S.; Panigrahi, S. Development and Evaluation of ZnO-Fe2O3 Based Nanocomposite Sensors for Butanol Detection. J. Nanosci. Nanotechnol. 2012, 12, 2346–2352. [Google Scholar] [CrossRef] [PubMed]
  26. Song, X.; Li, L.; Chen, X.; Xu, Q.; Song, B.; Pan, Z.; Liu, Y.; Juan, F.; Xu, F.; Cao, B. Enhanced triethylamine sensing performance of α-Fe2O3 nanoparticle/ZnO nanorod heterostructures. Sens. Actuators B Chem. 2019, 298, 126917. [Google Scholar] [CrossRef]
  27. Li, Y.; Wang, K.; Wu, J.; Gu, L.; Lu, Z.; Wang, X.; Cao, X. Synthesis of highly permeable Fe2O3/ZnO hollow spheres for printable photocatalysis. RSC Adv. 2015, 5, 88277–88286. [Google Scholar] [CrossRef]
  28. Wolcott, A.; Wolcott, B.; Smith, W.A.; Kuykendall, T.R.; Zhao, Y.; Zhang, J.Z. Photoelectrochemical Study of Nanostructured ZnO Thin Films for Hydrogen Generation from Water Splitting. Adv. Funct. Mater. 2009, 19, 1849–1856. [Google Scholar] [CrossRef]
  29. Christoforidis, K.C.; Fornasiero, P. Photocatalytic Hydrogen Production: A Rift into the Future Energy Supply. ChemCatChem 2017, 9, 1523–1544. [Google Scholar] [CrossRef] [Green Version]
  30. Hunter, B.M.; Hieringer, W.; Winkler, J.R.; Graya, H.B.; Muller, A.M. Effect of interlayer anions on [NiFe]-LDH nanosheet water oxidation activity. Energy Environ. Sci. 2016, 9, 1734–1743. [Google Scholar] [CrossRef] [Green Version]
  31. Gong, M.; Dai, H. A mini review of NiFe-based materials as highly active oxygen evolution reaction electrocatalysts. Nano Res. 2015, 8, 23–39. [Google Scholar] [CrossRef] [Green Version]
  32. Gong, M.; Li, Y.; Wang, H.; Liang, Y.; Wu, J.Z.; Zhou, J.; Wang, J.; Regier, T.; Wei, F.; Dai, H. An Advanced Ni–Fe Layered Double Hydroxide Electrocatalyst for Water Oxidation. J. Am. Chem. Soc. 2013, 135, 8452–8455. [Google Scholar] [CrossRef] [PubMed]
  33. Yang, G.-W.; Xu, C.-L.; Li, H.-L. Electrodeposited nickel hydroxide on nickel foam with ultrahigh capacitance. Chem. Commun. 2008, 6537–6539. [Google Scholar] [CrossRef] [PubMed]
  34. Jiang, N.; Bogoev, L.; Popova, M.; Gul, S.; Yano, J.; Sun, Y. Electrodeposited nickel-sulfide films as competent hydrogen evolution catalysts in neutral water. J. Mater. Chem. A 2014, 2, 19407–19414. [Google Scholar] [CrossRef] [Green Version]
  35. Ledendecker, M.; Calderon, S.K.; Papp, C.; Steinrück, H.P.; Antonietti, M.; Shalom, M. The Synthesis of Nanostructured Ni5P4 Films and their Use as a Non-Noble Bifunctional Electrocatalyst for Full Water Splitting. Angew. Chem. Int. Ed. 2015, 54, 12361–12365. [Google Scholar] [CrossRef] [PubMed]
  36. Hjiri, M. Highly sensitive NO2 gas sensor based on hematite nanoparticles synthesized by sol–gel technique. J. Mater. Sci. Mater. Electron. 2020, 31, 5025–5031. [Google Scholar] [CrossRef]
  37. Ivanovskaya, M.I.; Tolstik, A.I.; Kotsikau, D.A.; Pankov, V.V. The structural characteristics of Zn-Mn ferrite synthesized by spray pyrolysis. Russ. J. Phys. Chem. A 2009, 83, 2081–2086. [Google Scholar] [CrossRef]
  38. Sawant, S.Y.; Cho, M.H. Facile and single-step route towards ZnO@C core–shell nanoparticles as an oxygen vacancy induced visible light active photocatalyst using the thermal decomposition of Zn(an)2(NO3)2. RSC Adv. 2016, 6, 70644–70652. [Google Scholar] [CrossRef]
  39. Gayathri, S.; Nirmal Ghosh, O.S.; Sathishkumar, S.; Sudhakara, P.; Jayaramudu, J.; Ray, S.S.; Kasi Viswanath, A. Investigation of physicochemical properties of Ag doped ZnO nanoparticles prepared by chemical route. Appl. Sci. Lett. 2015, 1, 8. [Google Scholar]
  40. Znaidi, L.; Soler Illia, G.J.A.A.; Benyahia, S.; Sanchez, C.; Kanaev, A.V. Oriented ZnO Thin Films Synthesis by Sol–Gel Process for Laser Application. Thin Solid Film 2003, 428, 257–262. [Google Scholar] [CrossRef]
  41. Mitra, P.; Dutta, D.; Das, S.; Basu, T.; Pramanik, A.; Patra, A. Antibacterial and Photocatalytic Properties of ZnO–9-Aminoacridine Hydrochloride Hydrate Drug Nanoconjugates. ACS Omega 2018, 3, 7962–7970. [Google Scholar] [CrossRef] [PubMed]
  42. Rajab, F.H.; Korshed, P.; Liu, Z.; Wang, T.; Li, L. How did the structural ZnO nanowire as antibacterial coatings control the switchable wettability. Appl. Surf. Sci. 2019, 469, 593–606. [Google Scholar] [CrossRef]
  43. Li, X.; Wang, Z.; Zhang, Z.; Chen, L.; Cheng, J.; Nil, W.; Wang, B.; Xie, E. Light Illuminated α−Fe2O3/Pt Nanoparticles as Water Activation Agent for Photoelectrochemical Water Splitting. Sci. Rep. 2015, 5, 9130. [Google Scholar] [CrossRef] [PubMed] [Green Version]
  44. Jun, H.; Im, B.; Kim, J.Y.; Im, Y.-O.; Jang, J.-Y.; Kim, E.S.; Kim, J.Y.; Kang, H.J.; Hong, S.J.; Lee, J.S. Photoelectrochemical water splitting over ordered honeycomb hematite electrodes stabilized by alumina shielding. Energy Environ. Sci. 2012, 5, 6375–6382. [Google Scholar] [CrossRef] [Green Version]
  45. Grosvenor, A.P.; Kobe, A.; Biesinger, M.C.; McIntyre, N.S. Investigation of multiplet splitting of Fe 2p XPS spectra and bonding in iron compounds. Surf. Interface Anal. 2004, 36, 1564–1574. [Google Scholar] [CrossRef]
  46. Caglar, Y. Sol–gel derived nanostructure undoped and cobalt doped ZnO: Structural, optical and electrical studies. J. Alloy. Compd. 2013, 560, 181–188. [Google Scholar] [CrossRef]
  47. Aksoy, S.; Ilican, S.; Caglar, M. Sol–gel derived Li–Mg co-doped ZnO films: Preparation and characterization via XRD, XPS, FESEM. J. Alloy. Compd. 2012, 512, 171–178. [Google Scholar] [CrossRef]
  48. Karamat, S.; Rawata, R.S.; Lee, P.; Tan, T.L.; Ramanujan, R.V. Structural, elemental, optical and magnetic study of Fe doped ZnO and impurity phase formation. Prog. Nat. Sci. Mater. Int. 2014, 24, 142–149. [Google Scholar] [CrossRef] [Green Version]
  49. Jin, Y.; Cui, Q.; Wen, G.; Wang, Q.; Hao, J.; Wang, S.; Zhang, J. XPS and Raman scattering studies of room temperature ferromagnetic ZnO:Cu. J. Phys. D Appl. Phys. 2009, 42, 215007. [Google Scholar] [CrossRef]
  50. Ye, S.; Ding, C.; Chen, R.; Fan, F.; Fu, P.; Yin, H.; Wang, X.; Wang, Z.; Du, P.; Li, C. Mimicking the Key Functions of Photosystem II in Artificial Photosynthesis for Photoelectrocatalytic Water Splitting. J. Am. Chem. Soc. 2018, 140, 3250–3256. [Google Scholar] [CrossRef]
  51. Liu, Y.; Yan, X.; Kang, Z.; Li, Y.; Shen, Y.; Sun, Y.; Wang, L.; Zhang, Y. Synergistic Effect of Surface Plasmonic particles and Surface Passivation layer on ZnO Nanorods Array for Improved Photoelectrochemical Water Splitting. Sci. Rep. 2016, 6, 29907. [Google Scholar] [CrossRef] [PubMed]
  52. Chang, J.; Huang, X.; Zhou, G.; Cui, S.; Halla, P.B.; Jiang, J.; Hurley, P.T.; Chen, J. Multilayered Si Nanoparticle/Reduced Graphene Oxide Hybrid as a High-Performance Lithium-Ion Battery Anode. Adv. Mater. 2014, 26, 758–764. [Google Scholar] [CrossRef] [PubMed]
  53. Zhang, Y.; Wang, C.-Y.; Tang, X. Cycling degradation of an automotive LiFePO4 lithium-ion battery. J. Power Sources 2011, 196, 1513–1520. [Google Scholar] [CrossRef]
Scheme 1. Synthesis of ZnO/α-Fe2O3 nanocomposites by the hydrothermal method.
Crystals 10 00356 sch001
Figure 1. XRD patterns of (a) ZnO; (b) ZnO/α-Fe2O3(1 wt%); (c) ZnO/α-Fe2O3(3 wt%); and (d) ZnO/α-Fe2O3(5 wt%).
Crystals 10 00356 g001
Figure 2. FT-IR spectra of (a) ZnO; (b) ZnO/α-Fe2O3(1 wt%); (c) ZnO/α-Fe2O3(3 wt%); and (d) ZnO/α-Fe2O3(5 wt%).
Crystals 10 00356 g002
Figure 3. FE-SEM of (a) ZnO; (b) ZnO/α-Fe2O3(1 wt%); (c) ZnO/α-Fe2O3(3 wt%); (d) ZnO/α-Fe2O3(5 wt%); (e) and (f) TEM of ZnO/α-Fe2O3(3 wt%) with low and high magnification. (g) Energy dispersive X-ray Analysis (EDX) of ZnO/α-Fe2O3(5 wt%).
Crystals 10 00356 g003
Figure 4. UV-vis spectra of (a) ZnO; (b) ZnO/α-Fe2O3(1 wt%); (c) ZnO/α-Fe2O3(3 wt%); and (d) ZnO/α-Fe2O3(5 wt%).
Crystals 10 00356 g004
Figure 5. XPS survey spectra of (a) α-Fe2O3, ZnO and ZnO/α-Fe2O3(3 wt%); (b) O1s (ZnO/α-Fe2O3); (c) Fe-2p (ZnO/α-Fe2O3); and (d) Zn-2p binding energy spectra of ZnO and ZnO/α-Fe2O3.
Crystals 10 00356 g005
Figure 6. Electrochemical impedance spectroscopy (EIS) spectra of ZnO; ZnO/α-Fe2O3(1 wt%); ZnO/α-Fe2O3(3 wt%); and ZnO/α-Fe2O3(5 wt%).
Crystals 10 00356 g006
Figure 7. Hydrogen evolution reaction (HER) activity of ZnO; ZnO/α-Fe2O3(1 wt%); ZnO/α-Fe2O3(3 wt%); and ZnO/α-Fe2O3(5 wt%).
Crystals 10 00356 g007

