2.2.1. The Surface Effect on the Molecular Ordering in thin LC Systems on a Solid Surface
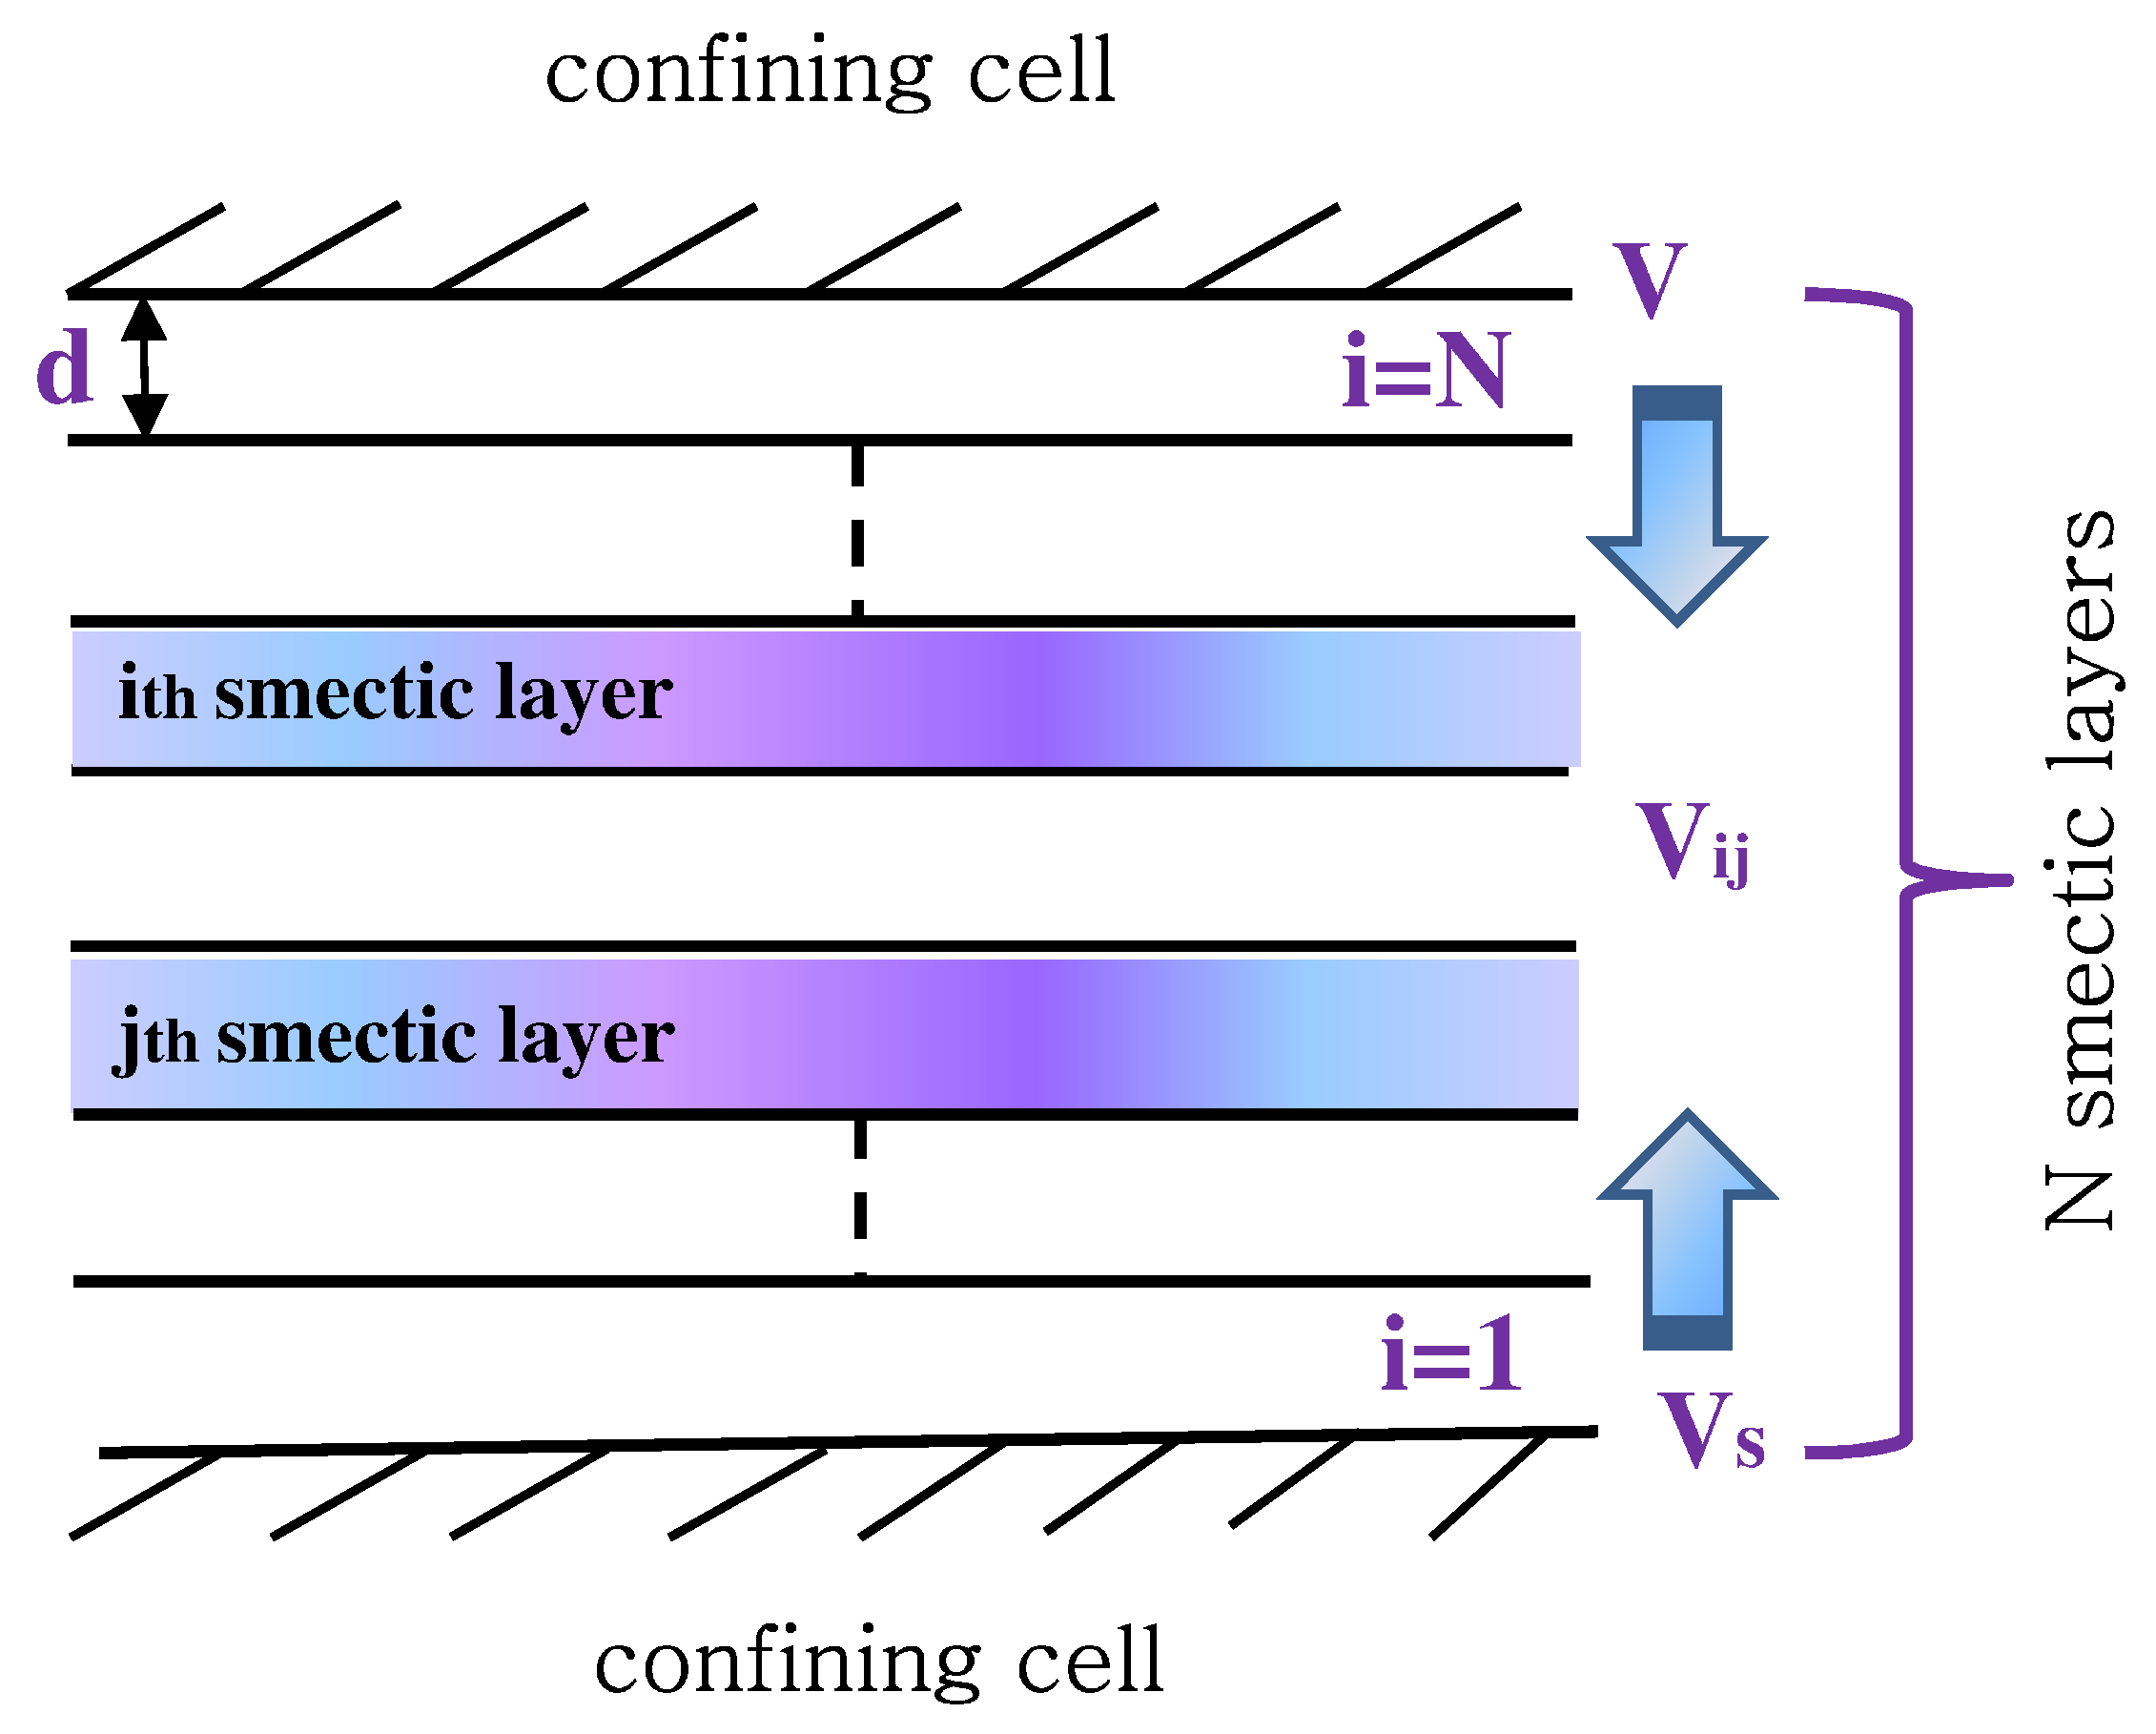
In this Section it will be considered the LC system confined between two parallel surfaces. Both the structural and optical properties of such LC system will be considered in the framework of the mean-field model [
25,
26]. The smectic phase, consisting of
N smectic layers (each of the thickness
d) oriented parallel to the bounding surfaces was considered to be the initial state of the LC system. The geometry of the LC system used for theoretical analysis is shown in
Figure 1.
Two types of interactions will be considered, first, the short-range, rapidly decaying with distance, interactions of the smectic layers with confining surfaces (
) and, second, the long-range van der Waals interactions between smectic layers (
) [
25,
26]. Taking into account that the length of the smectic layers is much bigger than the thickness
, we can suppose that all the physical quantities depend only on the
z-coordinate counted from the lower bounding surface.
The set of the effective anisotropic potentials
(
) within the
ith smectic layer can be introduced in the framework of the mean-force approach [
25,
26]:
with
where
is the local orientational order parameter (OP), while
is the local translational order parameter,
is the second-order Legendre polynomial,
is the polar angle or the angle between the long axis of the molecule from the
i-th layer and the director, whereas
is the dimensionless position of the molecule from the
i-th layer, and the overbar has been (and will be) eliminated in the following equations. It should be noted that both these potentials
and
describe the interactions of the
ith layer with confining surfaces and the pair interactions between
ith and
jth molecules, respectively. Here
is the statistical–mechanical average with respect to the one-particle distribution function of the
ith layer [
7,
38]
where
T is the absolute temperature of the system,
is the Boltzmann constant,
is the partition function of the
ith layer, respectively. Please note that in the smectic phase both OPs
and
are nonzero, whereas in the nematic phase
and
, respectively. Finally, in the isotropic phase both OPs
and
are equal to zero. Both sums
and
can be considered to be some weighted local order parameters. The constant
implicitly characterizes molecular packing within smectic layers, and
is a characteristic length associated with the rigid core of the molecule.
Taking into account the experimental results, both potentials
and
are well described by an exponentially decaying functions [
25,
26]
and
Please note that both parameters
and
are positive, because all abovementioned interactions are attractive. For simplicity, we assume that the surface potential
[Equation (
6)] is symmetric with respect to distances from surfaces. Furthermore, the characteristic length scale
, specifying the range of the surface interactions, has been chosen equal to one [
27]. It should be pointed out that the inverse square distance dependence for the pair interlayer potential
is in accordance with the theoretical result obtained for a pair of interacting surfaces [
39,
40]. Here, for convenience, the inverse reduced temperature
has been used rather than the pure temperature [
25,
26].
The set of the OPs
and
, corresponding to the
ith layer of the film composed of a stack of
N layers can be obtained by solving the system of
nonlinear self-consistent Equations (
1)–(
5), at a given number of film layers
N, temperature
T, and two parameters
and
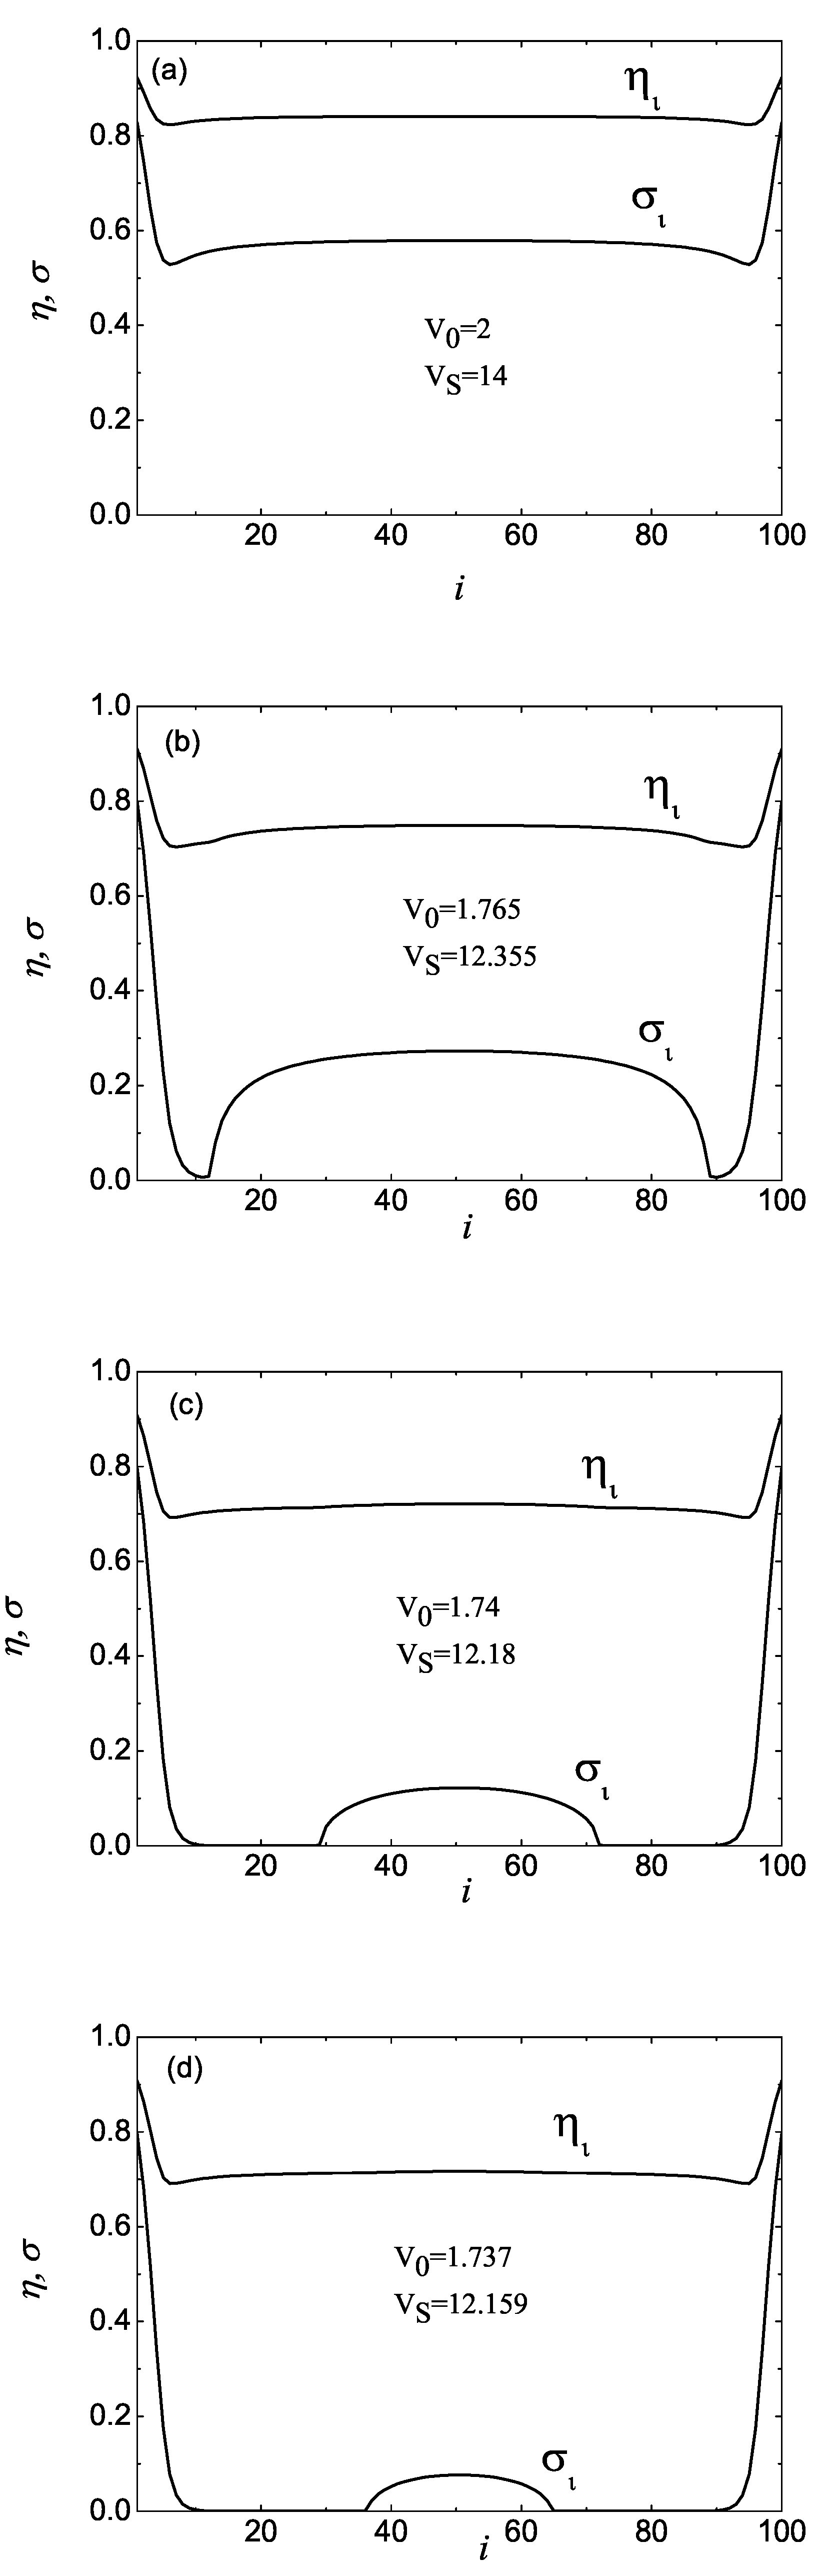
of the model. The distributions of the OPs
and
across the
layer smectic film, at nine values of
is shown in
Figure 2a–d,
Figure 3e–h, and
Figure 4i [
41], respectively.
It should be pointed out that the ratio corresponds to the case of rather strong surface interactions.
“Calculations showed that both OPs
and
are positive for all layers, when the temperature takes sufficiently low values (
) [
41] (
Figure 2a). This means that the SmA phase exists in the whole confined LC system. Because both the surface and interlayer interactions are attractive, smectic layers are more strongly stabilized in the middle part of the LC system than in the vicinity of the bounding surfaces. On the other hand, the studied system is surface stabilized, and hence the LC molecules exhibit the SmA ordering in domains close to surfaces. As the temperature further rises, the smectic ordering begins to vanish in the vicinity of the bounding surfaces and, simultaneously, the nematic ordering starts to arise in these domains [
42]. This is illustrated in
Figure 2b, where the orientational OP
, whereas the translational OP
is equal to zero. Calculations showed that for
, the nematic phase starts to arise at the temperature
[
41], corresponding to
, whereas the smectic ordering still prevails in the central domain of the LC system.
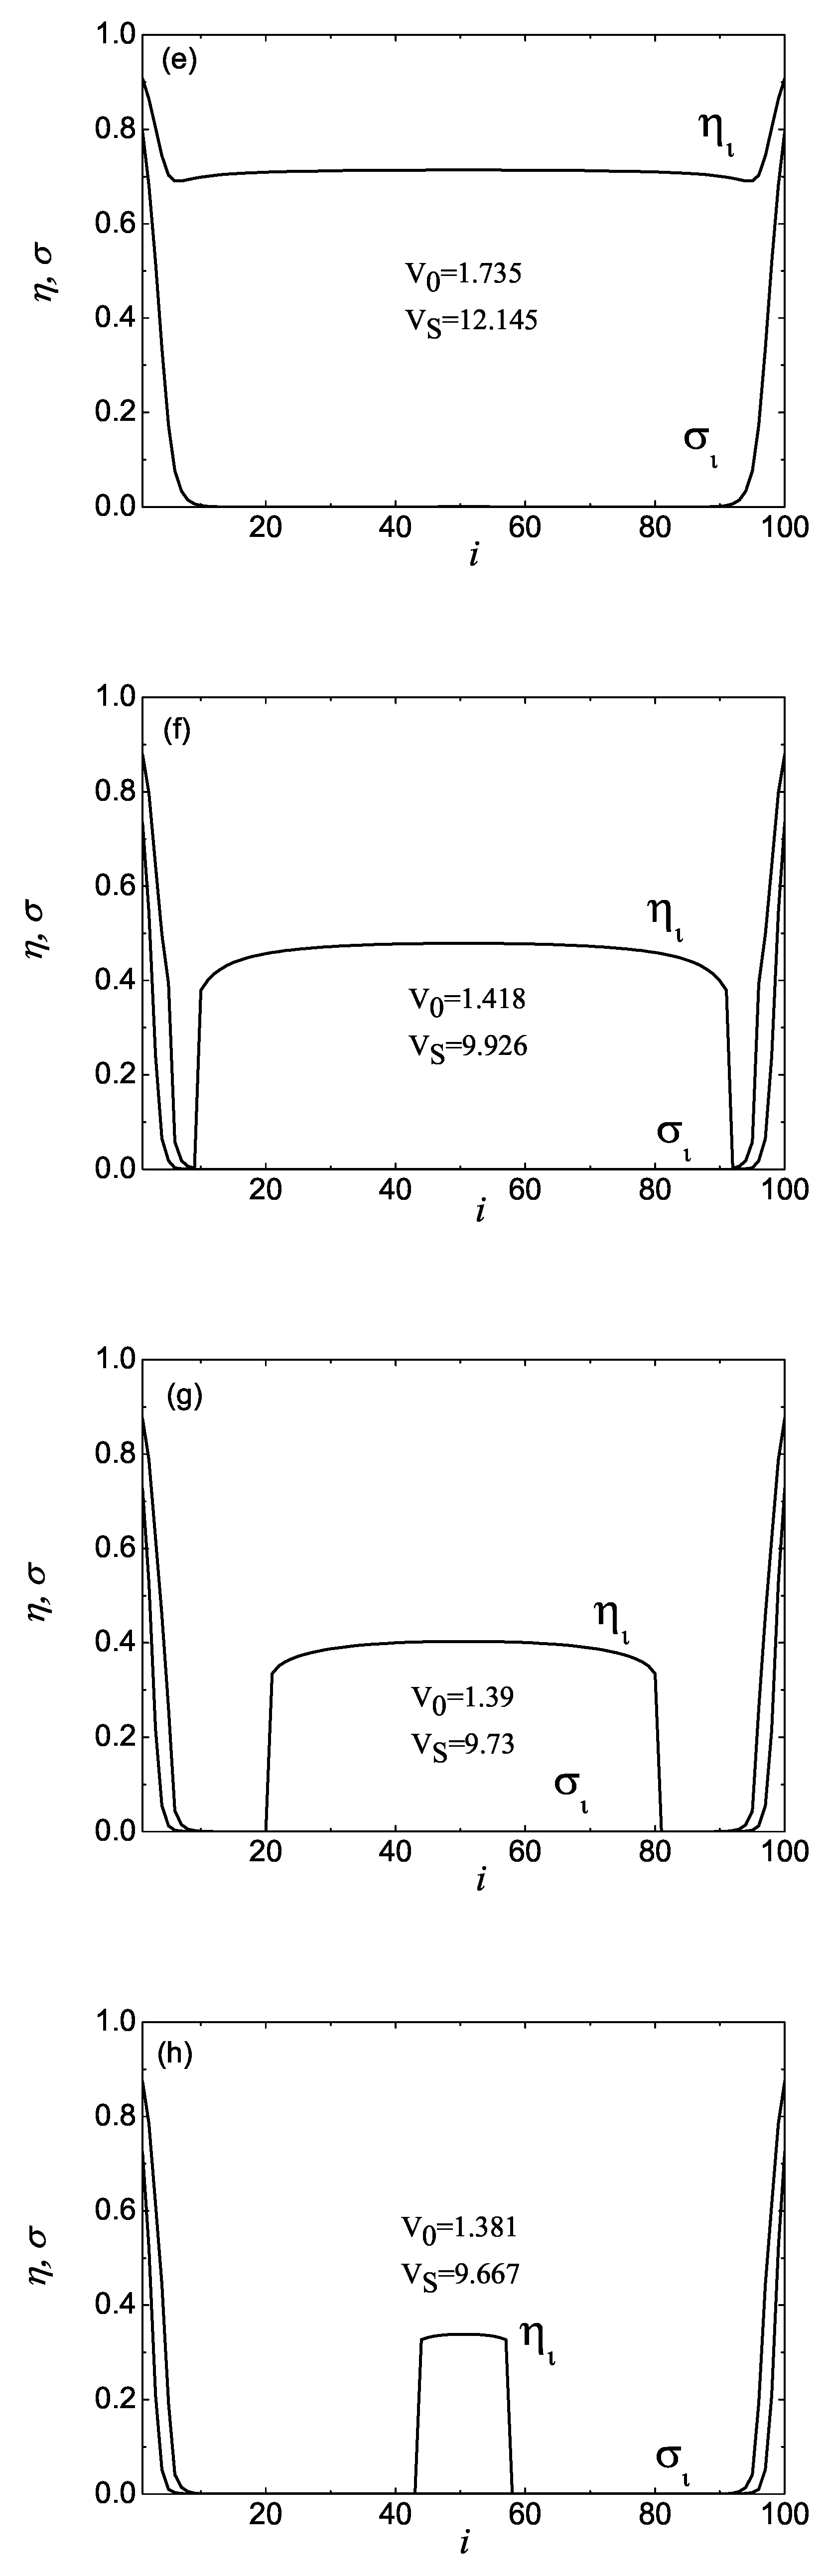
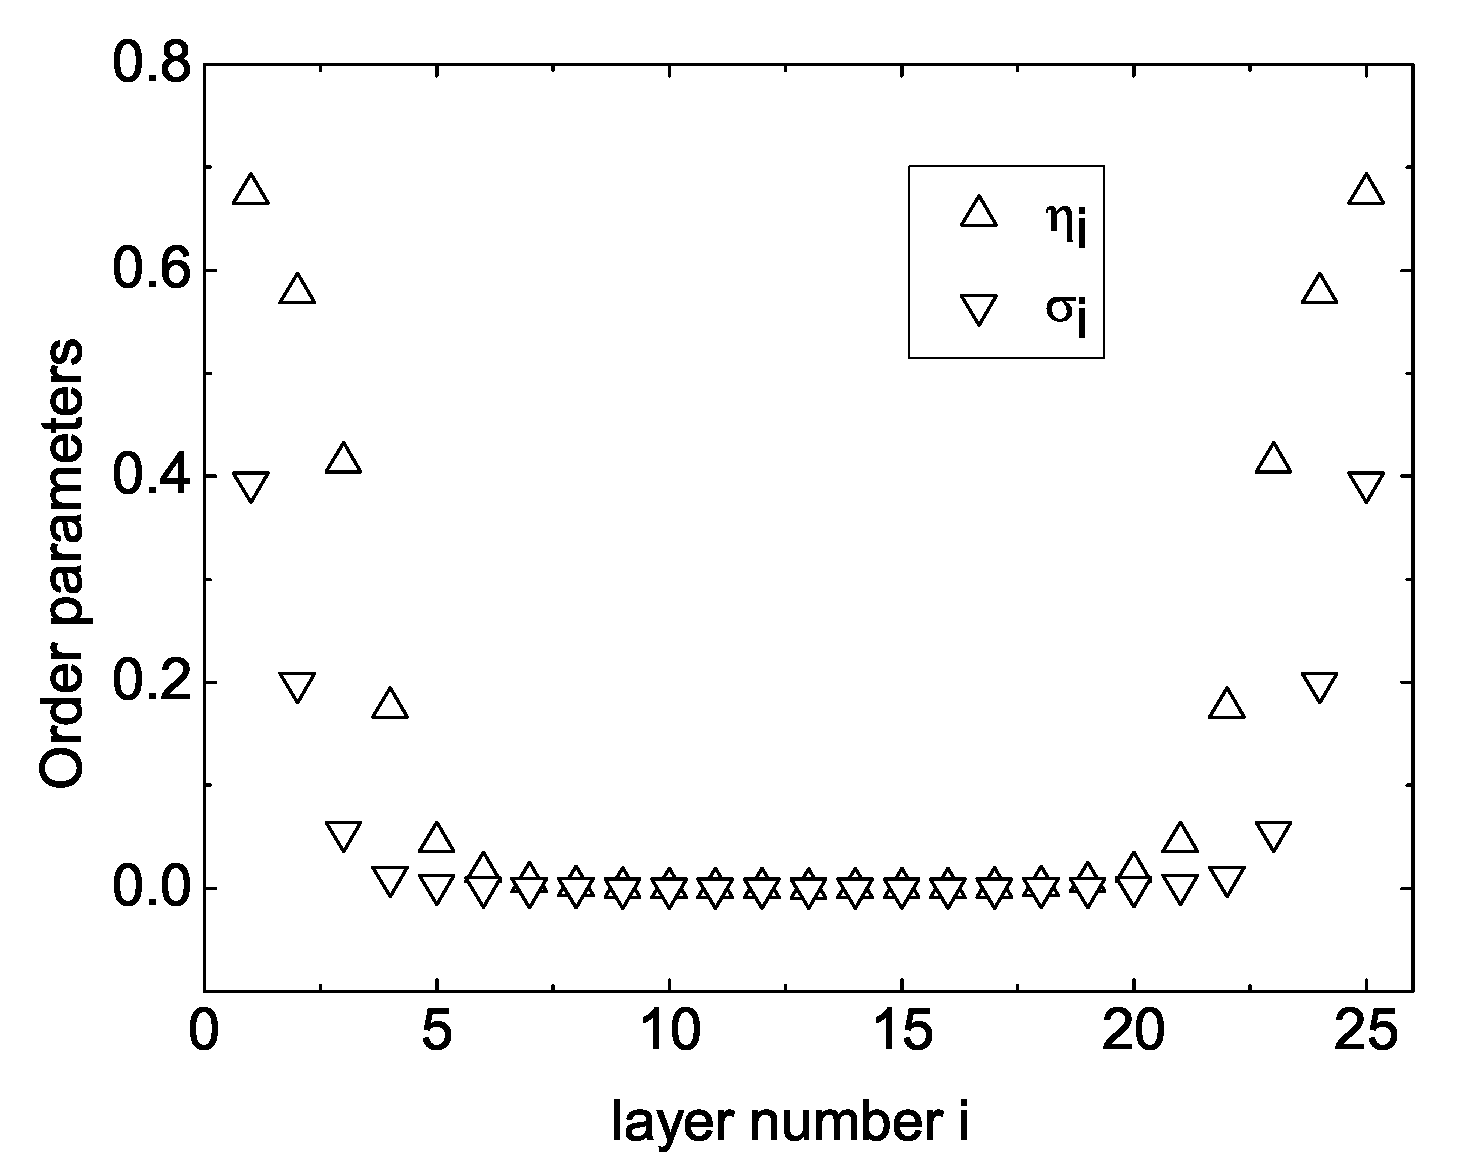
Figure 2c,d shows how with further increase of temperature, the layer melting transition from the smectic-A to the nematic ordering propagates, largely into interior of the LC system. In turn, as shown in
Figure 3e, at higher temperature
(corresponding to
, the smectic phase completely disappears in the central domain of the LC system and, afterwards, for the temperature
(corresponding to
), the local isotropic domain (associated with
and
) begins to form in the vicinity of the bounding surfaces, as shown in
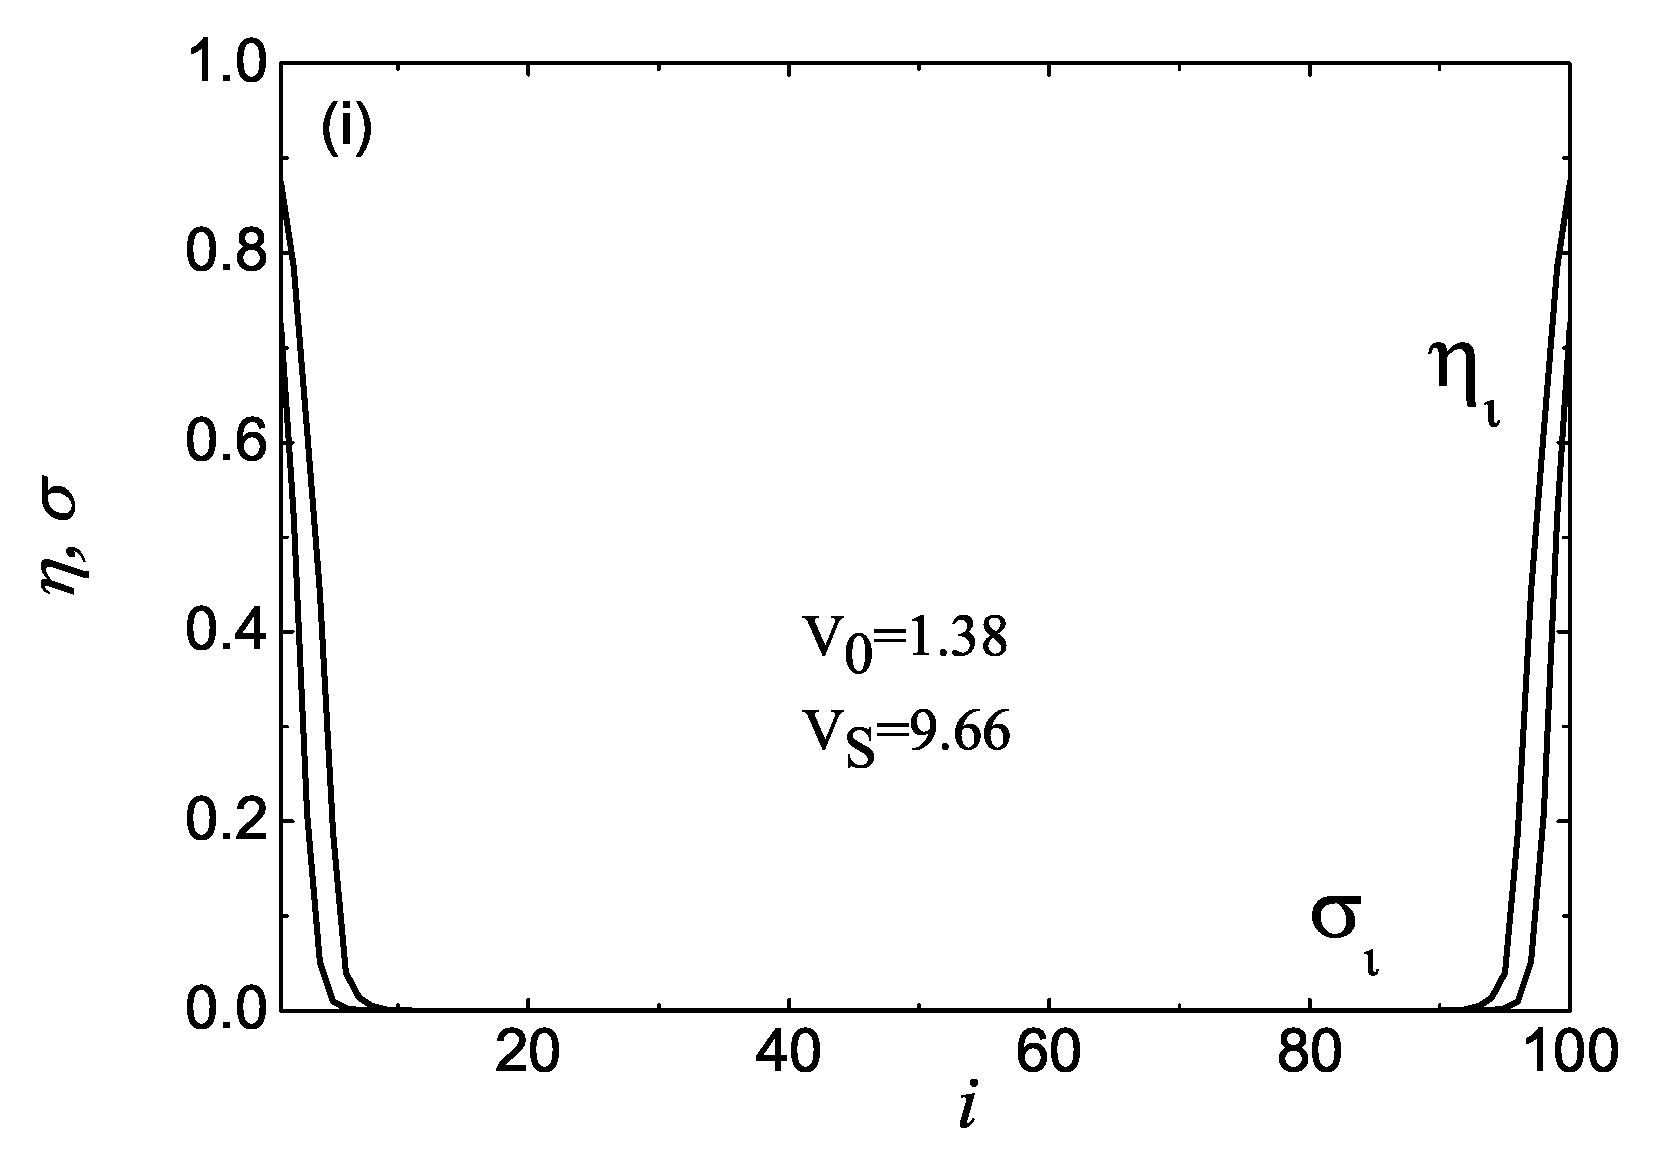
Figure 3f. As a consequence,
Figure 4i shows that with increase of temperature, the frontiers between the isotropic and centrally arising nematic domains move (
Figure 3g–h), until the nematic ordering completely vanishes (at the temperature
, corresponding to
). In the case when
, i.e., above the reduced temperature
, the isotropic phase occurs in whole the LC sample, except for the small domains close to surfaces, where the surface interactions hamper the disorder process, promoting the smectic order, which persists also at high enough temperatures. Accordingly, smectic layers formed in the immediate vicinity of each of surfaces can coexist with nematic and centrally formed smectic domain (
Figure 2b–d), or can coexist with isotropic and centrally formed nematic domain (
Figure 3f–h). When temperature increases, fronts between nematic or isotropic domains and the SmA domain, as well as fronts between isotropic and nematic domains move, mainly towards the center of the LC system. Results presented in
Figure 2,
Figure 3 and
Figure 4 show the very complex behavior of both orientational and translational OPs, due to the interplay between pair long-range intermolecular and nonlocal, relatively short-range [
41] surface interactions. Calculations also showed that the SmA, nematic and isotropic phases can coexist, whereas the phase transitions from SmA to nematic, as well as from nematic to isotropic phases, as the temperature increases, does not occur simultaneously in the whole volume of the LC system but only in some domains of the LC sample. It should be pointed out that there are four characteristic temperatures,
, at which particular phases arise or vanish. (Please note that
is the corresponding value of the reduced temperature.) For instance, at temperature
the nematic phase starts to form in the vicinity of the bounding surfaces. Simultaneously, the smectic-A phase disappears within these domains, as shown in
Figure 2b. How it is shown in
Figure 3e, the vanishing process of the smectic phase in the central domain of the LC system takes place at somewhat higher temperature
. In turn,
Figure 3f shows that like the nematic phase, the isotropic phase begins to appear also in the vicinity of the bounding surfaces, but at temperature
. Finally, at temperature
, the nematic phase completely disappears.” [
42].
Clearly, when the system is not very thin, its interior (sufficiently far from surfaces) is controlled by interlayer interactions. However, when the thickness of a system is relatively small, in comparison with the range of surface interactions, the behavior of the system is dominated by surface anchoring couplings. Calculations showed [
25] that the profiles presented in
Figure 5 are qualitatively consistent with those derived also for
, but assuming that surface potentials are strictly local and that two-layer potentials are independent of distance between the layers [
7,
19,
20,
21]. This indicates that the underlying method based on averaging such potentials at each iteration of self-consistent procedure applies for rather very thin real systems, entirely or almost entirely governed by surface anchoring interactions.
It should be pointed out that in the framework of the abovementioned mean-field approach for description of LC system confined in the microsized volume [
25,
26], the reduced temperature
T was defined as
. In the case where it is necessary to calculate the temperature values with high accuracy, for example, in the case of unusual layer-thinning transition observed in FSSF, composed of partially fluorinated H10F5MOPP molecules [
1], a precise definition of the dimensionless temperature is needed. It will be done in
Section 2.2.3.
In turn, a new type of scaling behavior of the LC system interacting with the solid substrate will be analyzed in the next Section.
2.2.3. Mean-Field Theory with Anisotropic Forces for Description of the Layer-Thinning Transition in FSSFs
In this Section we will present an overview of mean-field approaches for describing the structural and thermodynamic properties, such as the Helmholtz free energy, entropy, and heat capacity, of free-standing smectic films. This will be done in the framework of the mean-field approaches, with anisotropic forces [
7,
12,
17], where a free-standing smectic-A film is composed of
N discrete smectic layers with a thickness of the order of the molecular length
d and with total number of particles
, where
is the number of molecules per layer, which is assumed to be the same for all layers. The molecules within each layer are assumed to interact only with molecules of the same layer and those of the two neighboring ones. In the framework of these mean-field approaches, the set of potentials
within the
ith smectic layer can be introduced [
7,
38]
where
is the dimensionless distance through the smectic film,
is the force potentials which is responsible for the molecule-molecule interaction,
is the parameter corresponding to “enhanced” pair interactions in the bounding layers, and the constant
implicitly characterizes molecular packing across smectic layers [
38]. Physically, these approaches indicate that we replace
by
within the first and last layers, whereas for all interior layers
the interaction coefficient
has not been changed. It should be pointed out that the effective anisotropic potential
in the form of Equation (
9) is a reduced version of the potential
in the form of Equation (
1).
The set of OPs
and
corresponding to the
ith layer of the smectic film composed of a stack of
N SmA layers in air can be obtained by solving the system of 2
N nonlinear self-consistent Equations (
3)–(
5), with the effective anisotropic potential
in the form of Equation (
9), at a given number of film layers
N, temperature
T, and the two parameters
and
of the model. Having obtained the set of OPs
and
(
), one can calculate the full Helmholtz free energy of the LC system as
, where
is the Helmholtz free energies corresponding to the
ith layer. In turn, the dimensionless full Helmholtz free energy per molecule for each layer can be written as
, where
is the dimensionless Helmholtz free energy corresponding to the
ith layer, which can be calculated as [
7,
12,
17,
46]
where
is the dimensionless temperature and
, (
) is the partition function of the
ith layer, respectively.
In the scope of our research interest is also to investigate the experimentally observed phenomenon of the stepwise reduction of the value of heat capacity [
7,
17]
as the temperature
is raised above the dimensionless
[
1]. In order to calculate the values of
, one must first calculate the entropy of the system per molecule
, where
Here is the dimensionless entropy per molecule corresponding to the ith layer.
Recently, an experimental phenomenon of the stepwise behavior of surface tension upon heating the smectic-A film above
has been observed [
9]. It was shown that the film tension
, at each thinning abruptly jumps to a lower value and then continues to increase with a smaller slope [
9]. In the framework of the mean-field approach, the dimensionless surface tension
of the smectic film per molecule at constant volume
, can be calculated as [
11,
46]
where
p is the dimensionless pressure per molecule and
is the area per molecule at constant
p and
v. At the same time, the calculation of surface tension
took into account the fact that
, where
F is the Helmholtz free energy of the smectic film and
A is the LC/vacuum interface area.
In the case when the FSSF is subjected to the external electric field
directed both across
and along
the smectic layers, the set of effective anisotropic potentials
can be rewritten in the form [
11]
where
and
is the dimensionless parameter corresponding to the electric field
applied across or along the smectic layers. Here
is the dielectric permittivity of vacuum,
is the dielectric constant of the smectic film, and
is the number of density. In the framework of the mean-field approach, the dimensionless Helmholtz free energy corresponding to the
ith layer can be written as [
11]
where
.
Equations from (
3) to (
5), with the effective anisotropic potential
in the form of Equations (
9)–(
12) and (
15) are the relations which are needed to calculate both the structural, optical and thermodynamic properties of the free-standing SmA films. The set of external parameters used in calculations are
N,
, and
, respectively. For the case of films composed of the partially fluorinated
molecules, both calorimetric and optical reflectivity studies were carried out with initially 25-layer thick films, above the bulk SmA-Isotropic transition temperature (
358 K). Taking into account this fact, in the theoretical investigations the initial thickness of the film was chosen as being equal to
[
7,
11,
12,
17,
19,
20,
21]. According to the McMillan’s theory [
38], the first-order bulk
transition occurs for
, so, the choosing of
is acceptable. When choosing the value of
, one is usually guided by the fact that the partially fluorinated free-standing smectic films composed of the
molecules are stable above the
. This allows the assumption that the value of the interaction constant
should be greater than
. In the number of theoretical investigations [
7,
11,
12,
17,
19,
20,
21] the strong surface-enhanced pair interactions with
has been chosen. Taking into account that the partially fluorinated compound
has bulk SmA-I transition temperature
K, (
) and for
, according to the McMillan’s theory [
38], the value of
, one can estimate that the value of
is equal to
J. Please note that values of the dimensionless temperature
often vary between 0.60 (
K) and 0.80 (
K) [
7,
11,
12,
17].
In the next Section we will review several examples of numerical simulation of the layer-thinning transitions in free-standing partially fluorinated smectic films as the temperature is increased above .
2.2.4. Layer-Thinning Transitions in Free-Standing Partially Fluorinated Smectic Films
“When the temperature
is slowly increased above
towards either the nematic or isotropic phases, competition between surface and finite-size effects leads to unusual properties of FSSFs. High-resolution optical reflectivity investigations show [
33] that in the partially fluorinated compound, such as 2-4-(1,1-
dihydro-2-(2-
perfluorobutoxy)
perfluoroethoxy)
phenyl-5-
octyl pyrimidine (H8F(4,2,1)MOPP), the order of the surface layers appears to enhance, so they become ordered at temperatures well above
. The temperature
s effect on the behavior of the orientational
and translational
OPs in the smectic film with
layers has been investigated numerically by solving the set of
self-consistent nonlinear equations from (
3) to (
5), with the effective anisotropic potential
in the form of Equation (
9) [
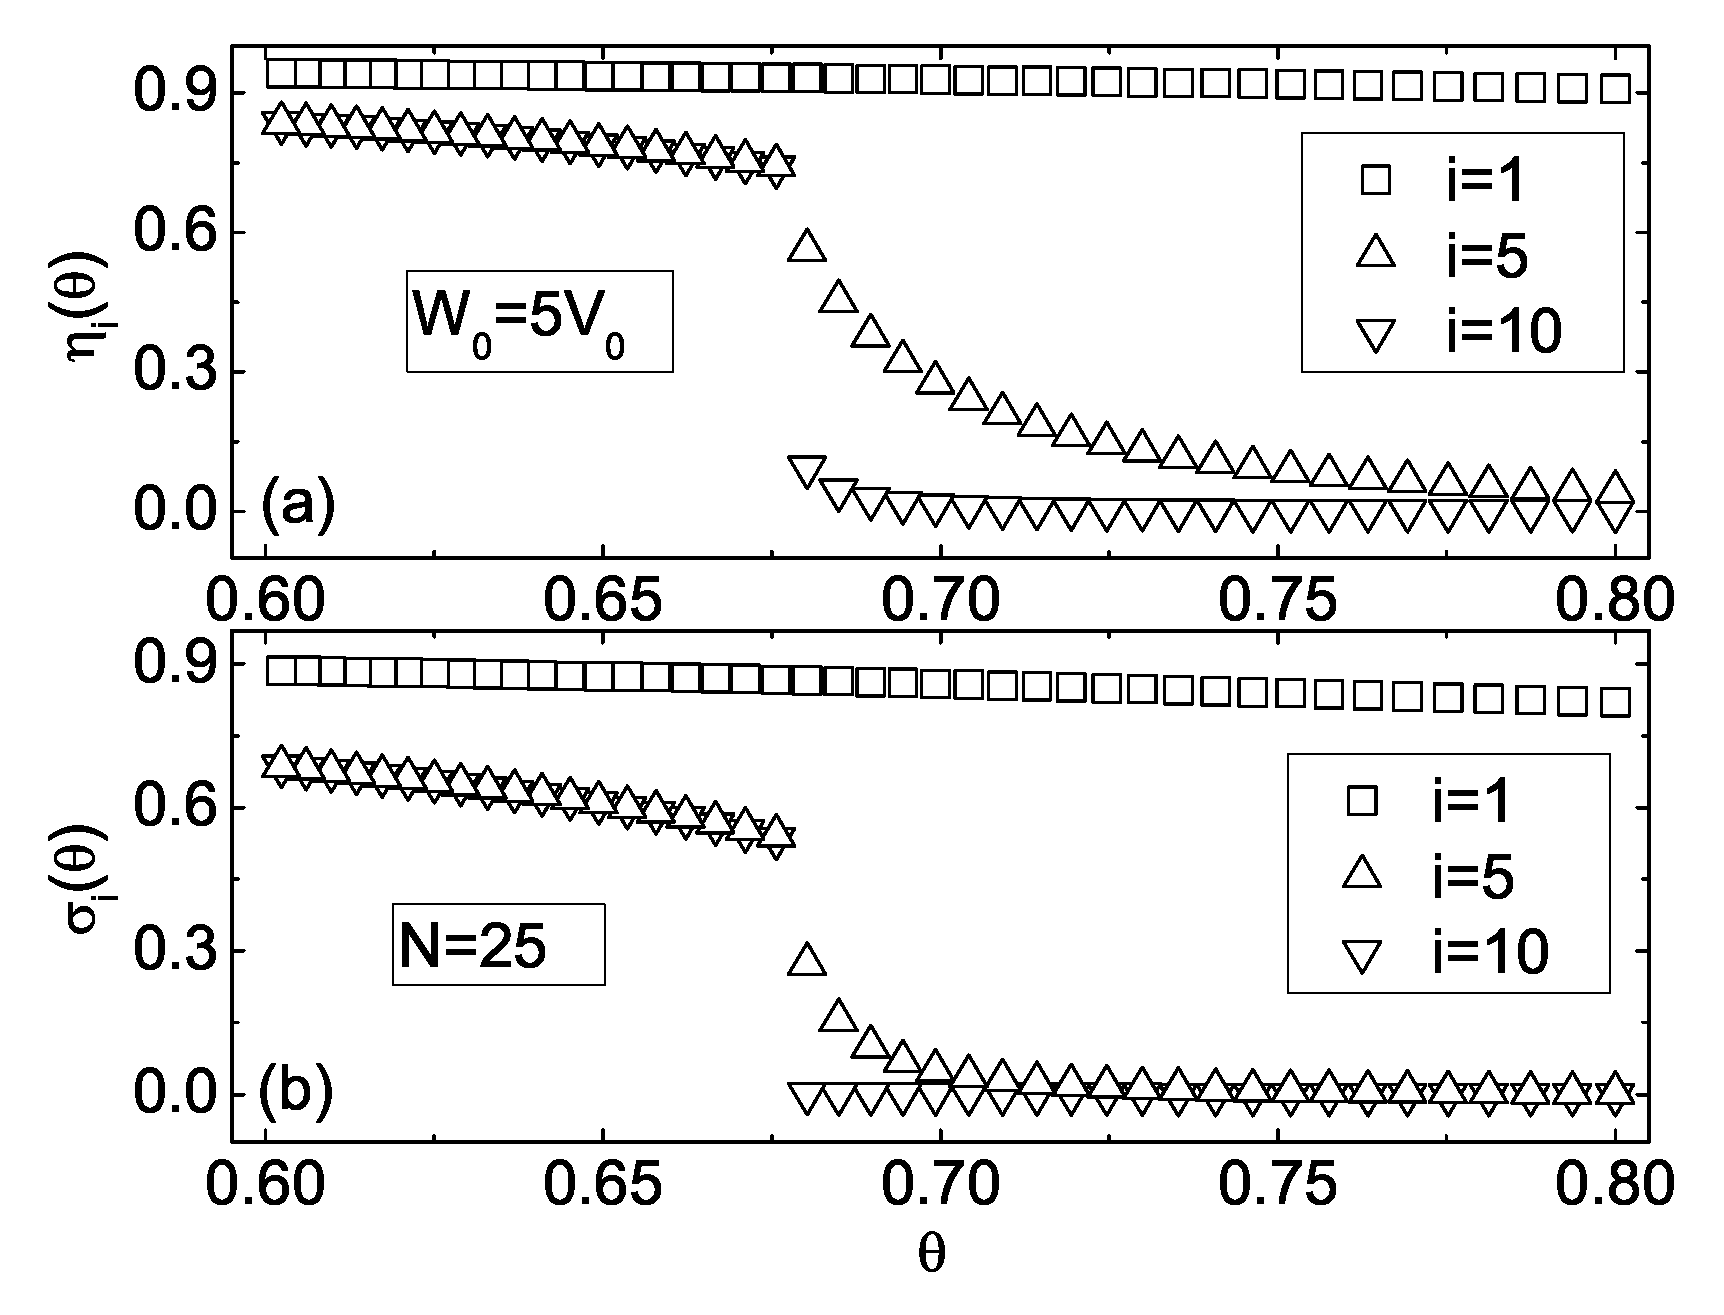
7], and the numerical result is shown in
Figure 8a,b.
The set of the model parameters used in these calculations are
,
, and
, respectively. In the low-temperature region
(
), results for orientational
(
Figure 8a and translational
OPs (
Figure 8b OPs showed [
7] that these equations have a stable unique solution, which is characterized by high values of
(
Figure 8a, squares and up and down triangles) and
OPs (
Figure 8b, squares and up and down triangles), both in the vicinity of the bounding surfaces, as well as near the film center. In the high-temperature region
(
), one also has a stable unique solution, which is characterized by vanishing both OPs
and
near the film center, whereas in the vicinity of the bounding surfaces, both OPs still maintain relatively high values. In [
7,
19], this type of solution was called a “quasi-smectic” state. At intermediate temperatures
(
) both types of solutions of the self-consistent equations exist, although, for clarity,
Figure 8 shows only the quasi-smectic profiles.
Calculations also showed that both
and
profiles demonstrate strong ordering in the vicinity of the bounding surfaces, due to the stronger pair interactions within the first and last layers than for all interior layers, which decreases rapidly with distance from those surfaces. For instance, both the
(
Figure 8a, up triangles (
)) and
(
Figure 8b, up triangles (
)) OPs fall continuously to some finite values [
7], whereas those parameters corresponding to the interior layers close to the film center (
Figure 8a,b, down triangles (
)) drop to 0.
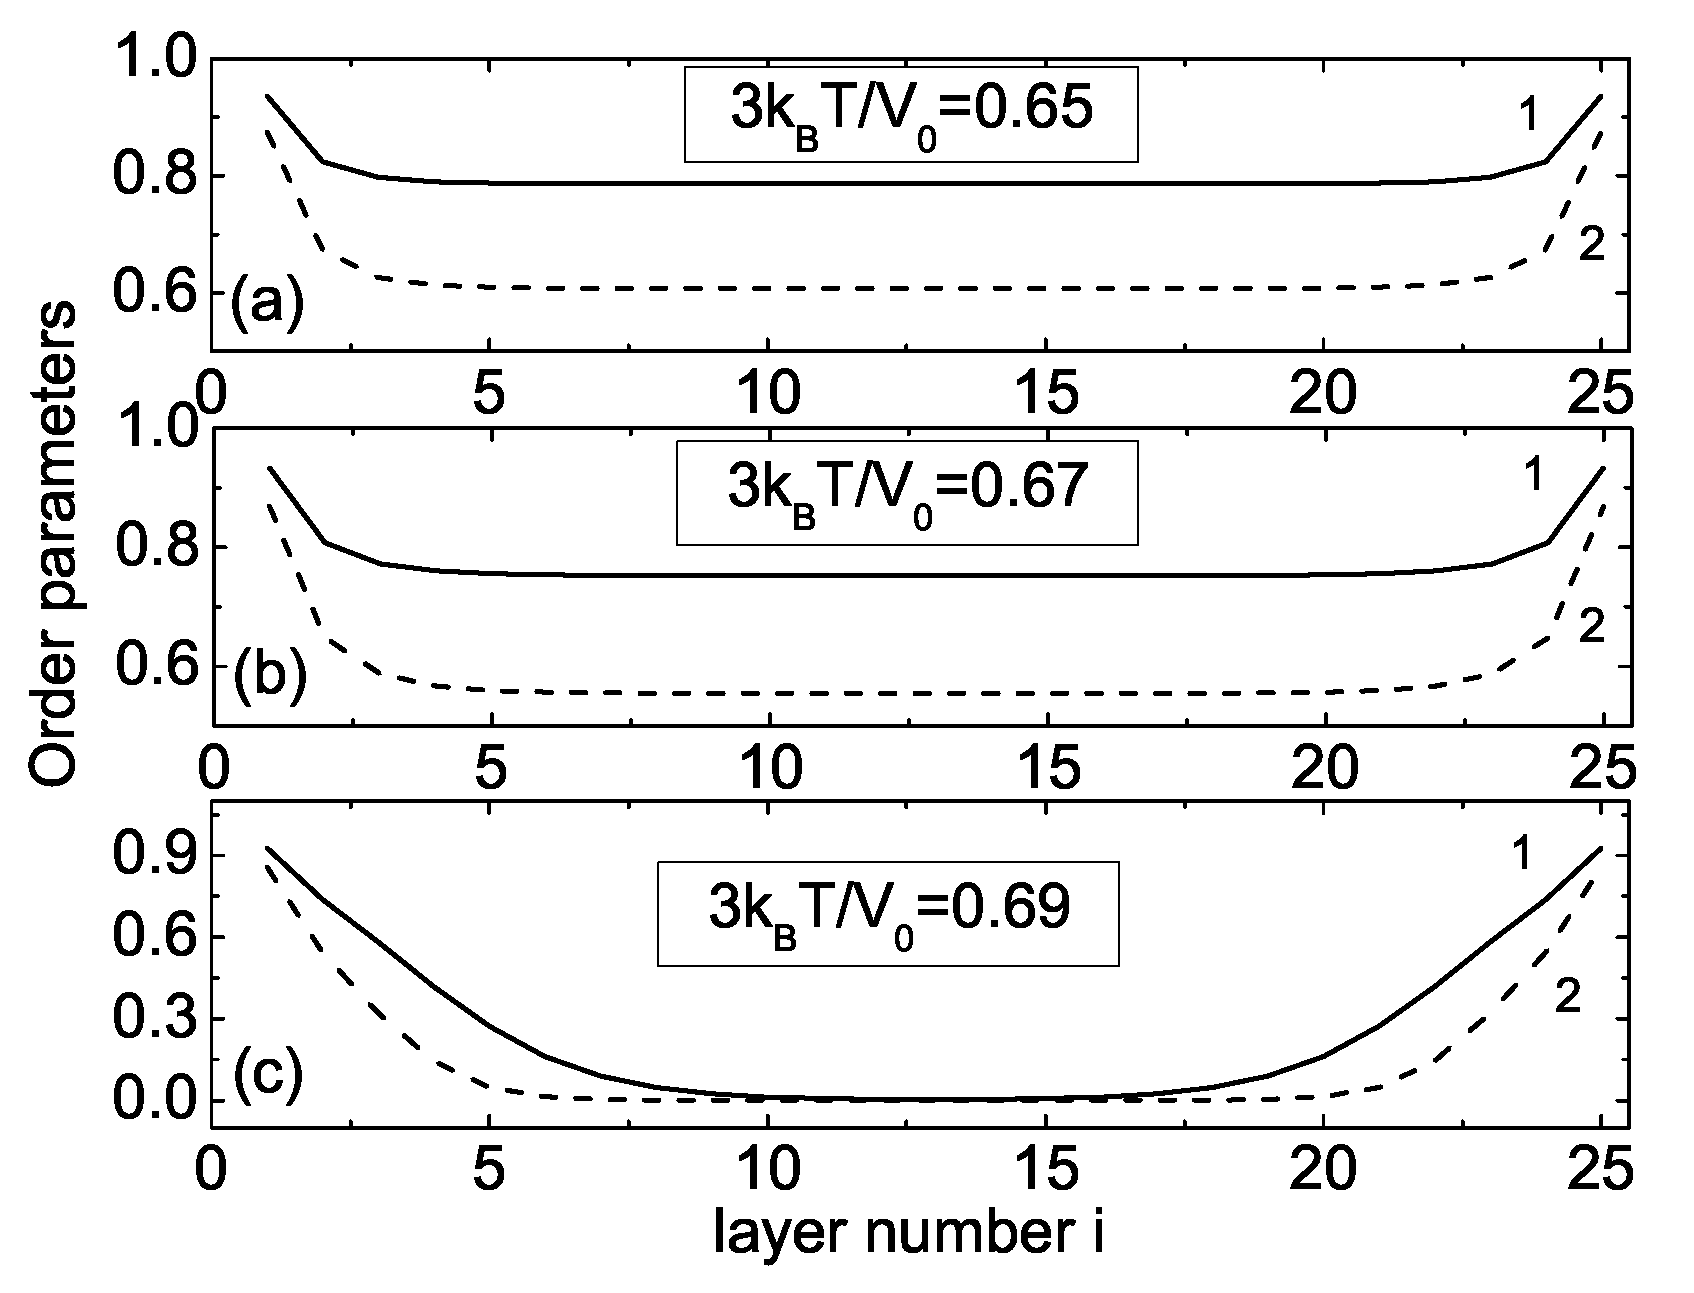
Furthermore, on the basis of the behavior of the free energy, one can calculate the values of the layer-thinning transition temperatures [
7]. For instance, in the case of strong (
) “enhanced” pair interactions in the bounding layers, the value of the temperature
is equal to
. Here
and
denote the dimensionless and dimensional layer-thinning transition temperatures, respectively. According to these calculations [
7], the distributions of the OPs
and
across the 25-layer smectic film, at three dimensionless temperatures
,
, and 0.69
, are characterized by a monotonic decrease of both
and
with increasing distance (or number of layers) from the bounding surface towards the interior of the film.
In the case of strong (
) “enhanced” pair interactions in the bounding layers, (see
Figure 9a–c [
7]) these distributions are characterized by minima in the middle part of the film and decreasing values of these OPs with increase in temperature.
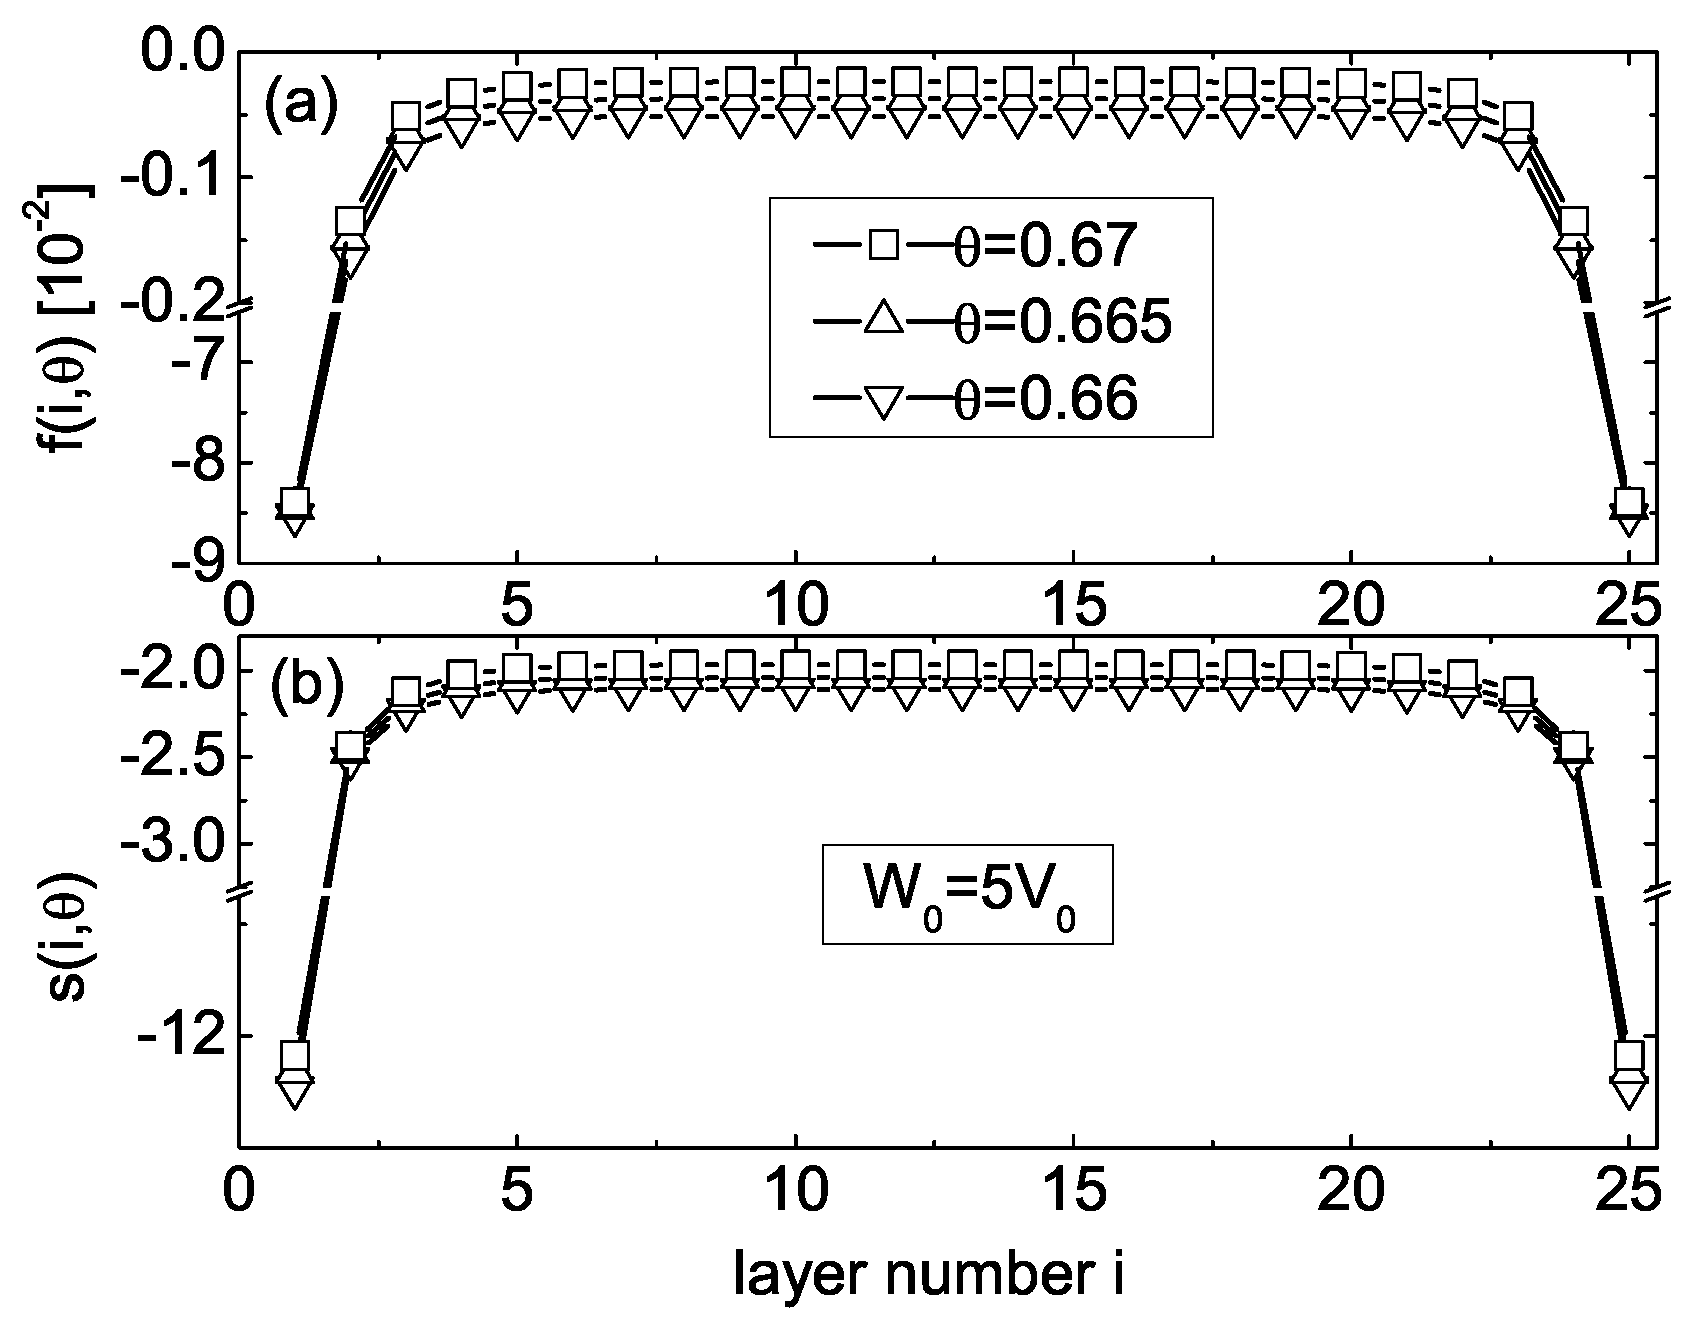
Having obtained the profiles of OPs
and
, and using Equations (
10) and (
11), the distributions of both the dimensionless Helmholtz free energy
(
Figure 10a) and entropy
(
Figure 10b) can be calculated [
7].
Calculations that were performed for three temperature
values [
7]: 0.66 (down triangles), 0.665 (up triangles), and 0.67 (squares), showed that the free-energy profiles demonstrate monotonic growth of the value of
up to the 8th layer from each boundary, where the function
saturates and does not change with further increase of
i. Physically, this means that all film layers are subjected to attractive forces from the bounding surfaces. The results of calculations shown in
Figure 8 indicate that at temperatures close to the layer-thinning value
, strong ordering takes place only in the vicinity of the bounding surfaces, whereas far from the surfaces ordering drops to lower values than in the bounding layers. As a result, anyone can find that when the temperature varies from below
to a lower value
, there are smaller differences between the Helmholtz free-energy
profiles (see
Figure 10a, contrasting the up and down triangles from the squares). The same tendency can be seen in the case of the entropy
profiles (see
Figure 10b). The distribution of the free-energy profiles across the smectic film changes dramatically as the temperature increases. When the layer-thinning transition temperature corresponding to the case of strong interaction with
(
(
)) for a film initially containing 25 layers is reached, the interior layers become unstable and the system undergoes the discontinuous transition to the quasi-smectic state [
7]. Such an effect has been seen earlier in the behavior of the order parameters in
Figure 8. The distributions of both the
and
profiles in the high-temperature region
are shown in
Figure 11a,b, for temperatures
(squares), 0.685 (up triangles), and 0.69 (down triangles), respectively.
Now the distribution of across the layer smectic film is characterized by maxima in the vicinity of both bounding surfaces. Calculations showed that the forces acting on the interior layers are in the opposite direction to the attractive ones. As a result, the interior layers are compressed and squeezed by the bounding layers.
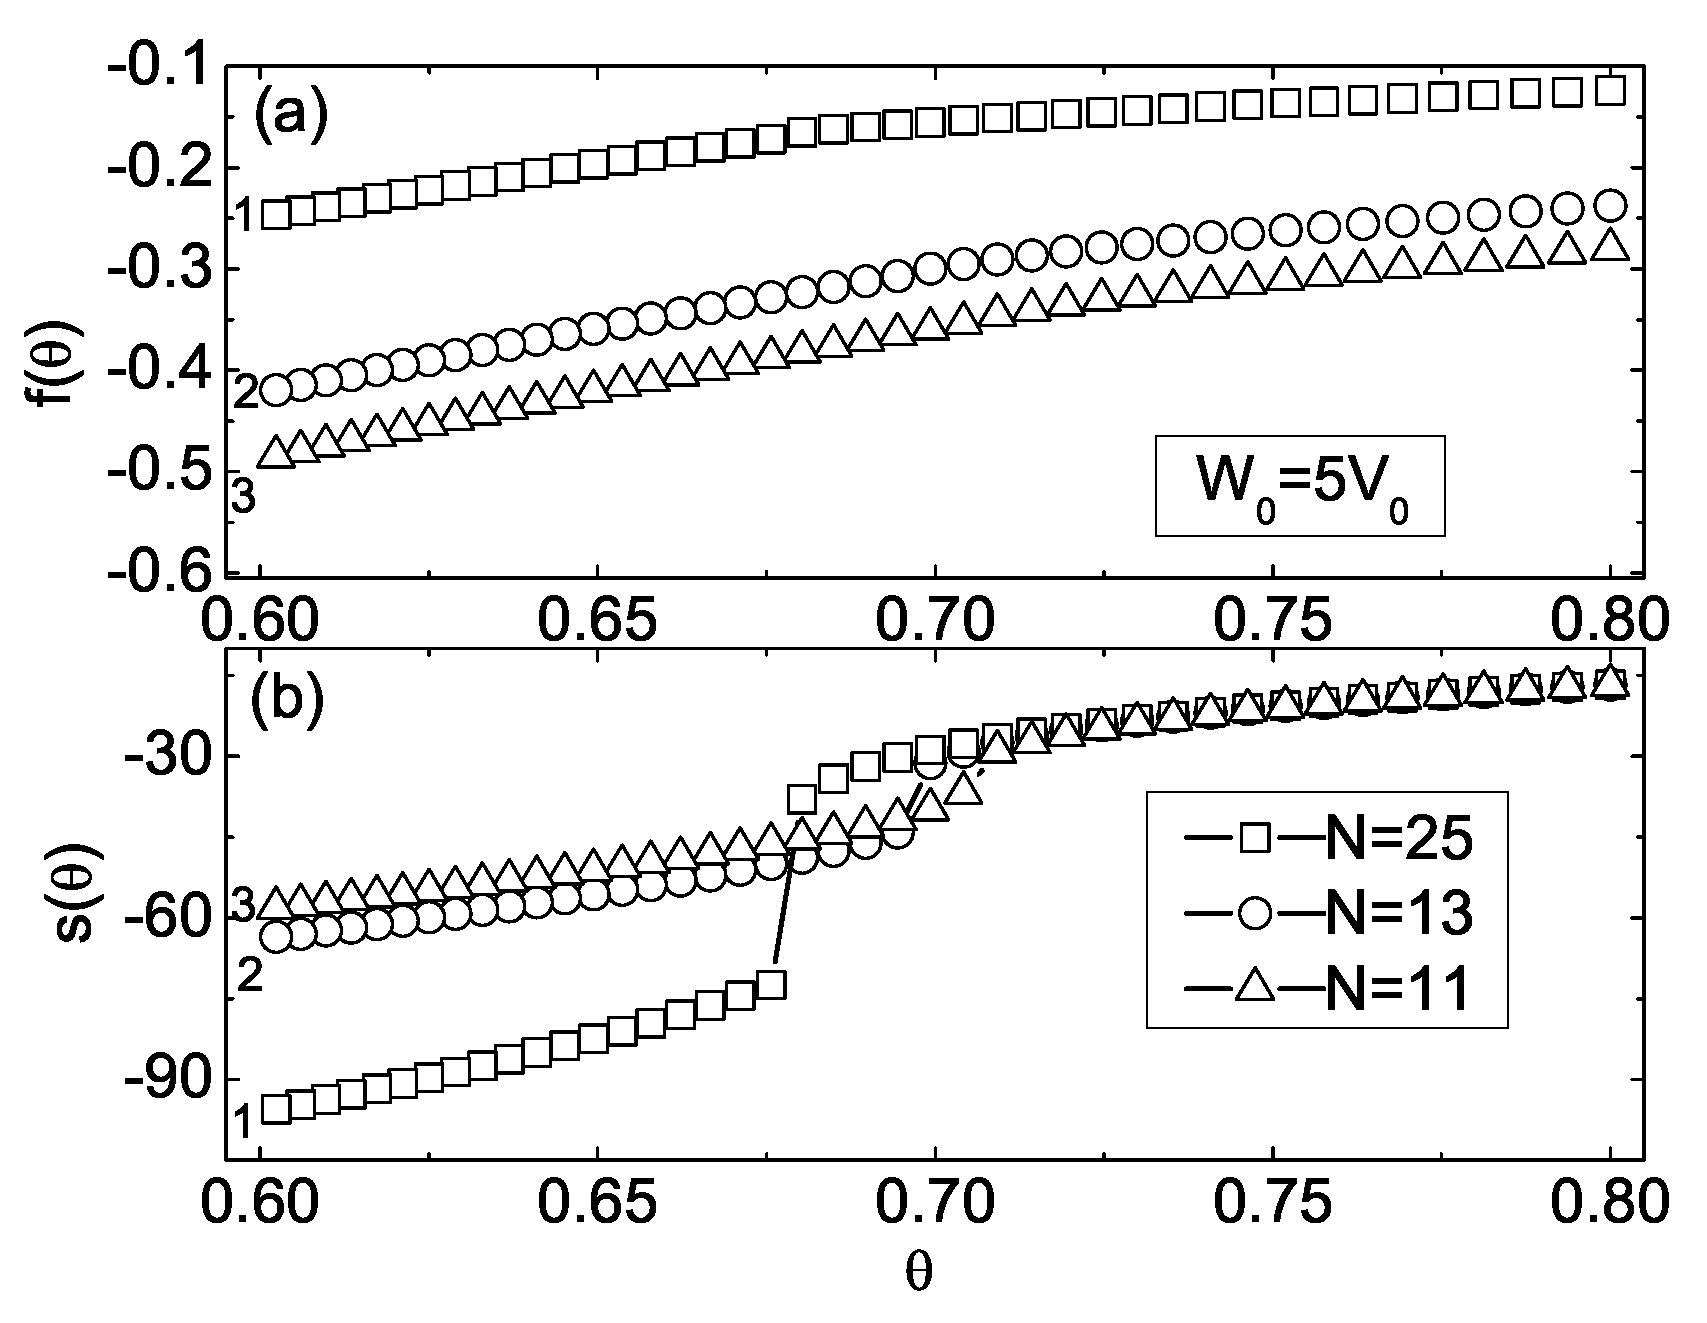
The temperature
s effect on the Helmholtz free energy
and entropy
of the smectic films containing 25, 13, 11, 10, 8, and 6 layers are shown in
Figure 12a,b and
Figure 13a,b, respectively.
Calculations were carried out for the set of the model parameters [
7]
and
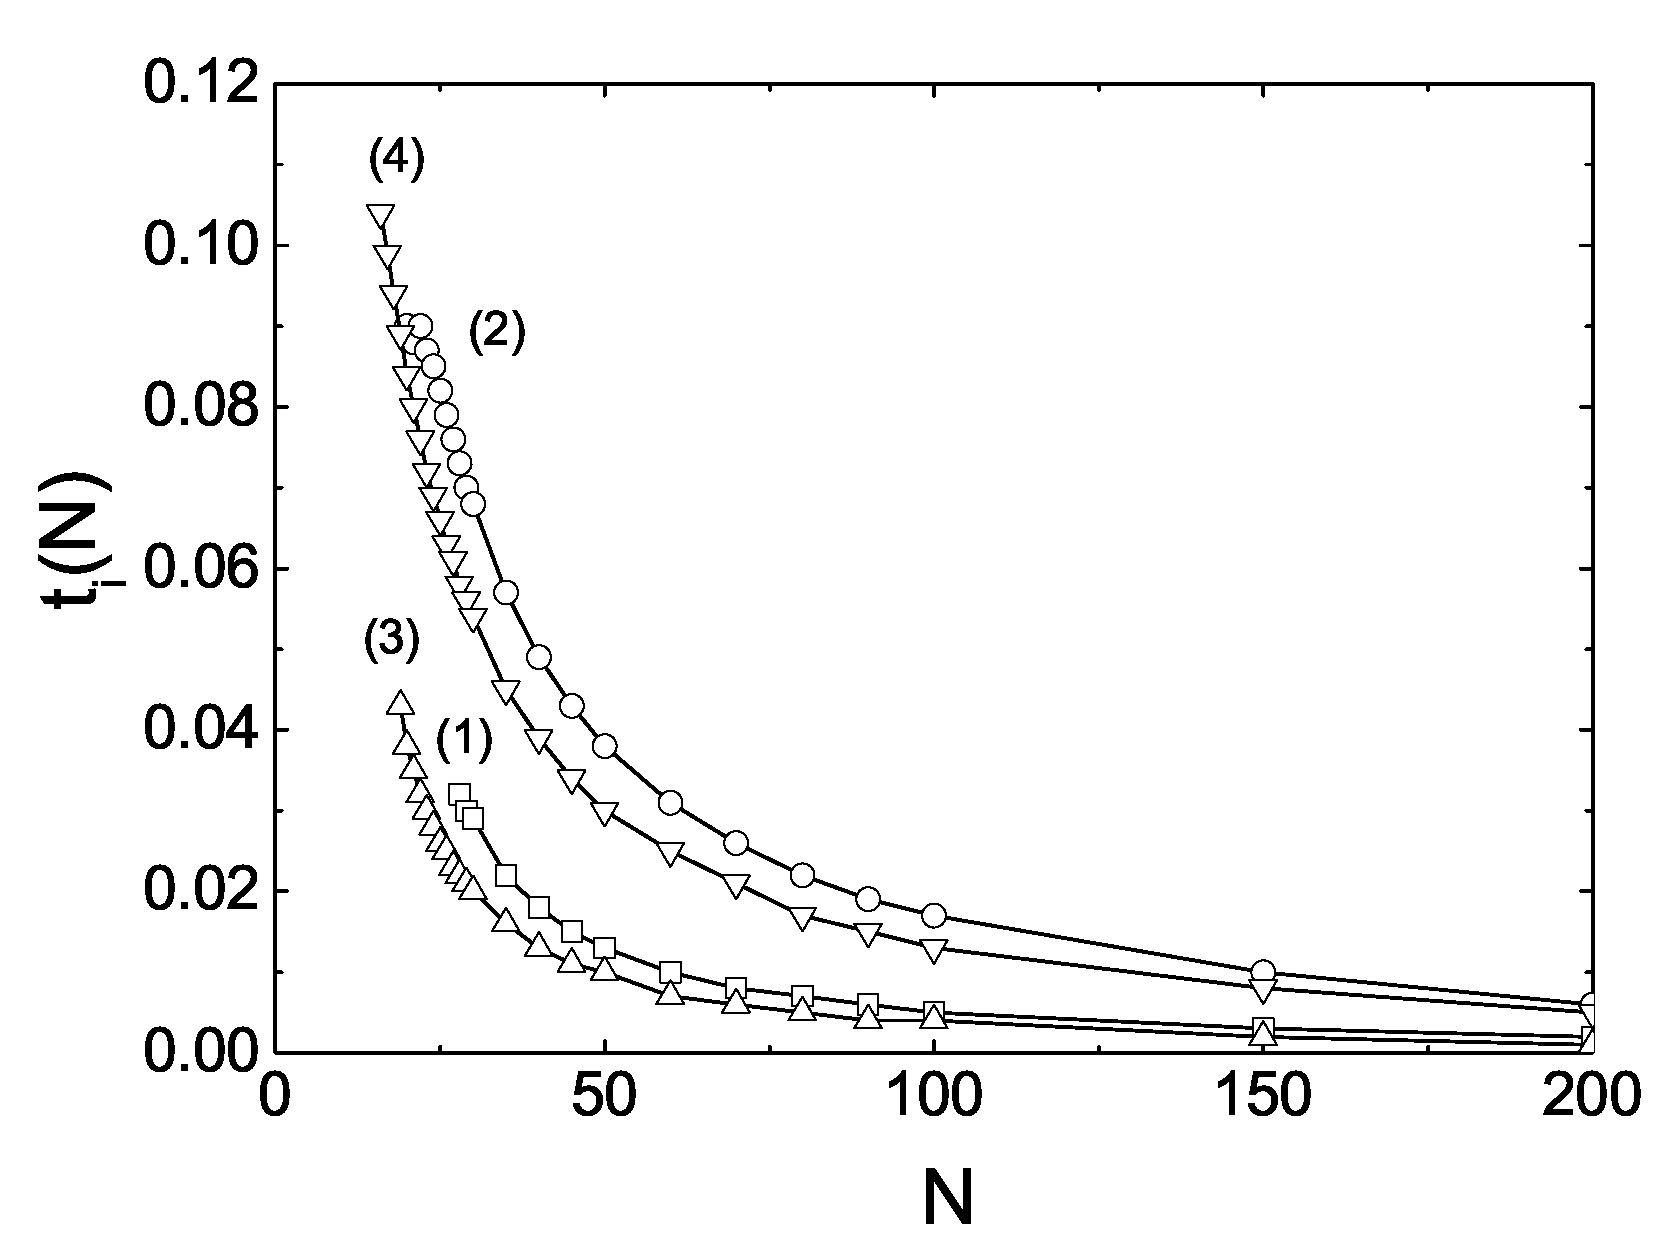
, respectively. In
Figure 12a,b the distribution of both the
and
vs.
, for several film thicknesses:
(curve 1),
(curve 2), and
(curve 3) (
Figure 12a,b), and
(curve 1),
(curve 2), and
(curve 3) (
Figure 13a,b), respectively are shown. Results of calculations showed that the SmA-I transition occurs through the sequence of layer-thinning transitions
, as the temperature is increased. The calculated free energy
per molecule for the 25-layer thick film vs.
is shown in
Figure 12a (curve 1), and demonstrates smooth behavior with increase of
, whereas the value of
(
Figure 12b, (curve 1)) demonstrates a discontinuous rise at
greater than
per molecule, due to the transition to the quasi-smectic state and corresponding change in slope of the free-energy curves. A similar discontinuity in
is seen in
Figure 13b for
(curve 1). Discontinuities in
also occur for the other values of
N, but are not seen in the figures due to the fixed vertical length scale.
Following the transition of
N-layer film to the quasi-smectic state, it has been determined the number of layers (
) remaining in the film with non-vanishing smectic order near the film center to be such as to provide a lower free energy than the
N-layer state at the same temperature, as well as with a higher transition temperature. Calculations showed [
7] that the next stable state with lower free energy occurs at
, then at
, etc. The corresponding layer-thinning temperatures
are:
,
,
,
,
,
,
,
, etc.
In the following Section several structural, thermodynamic and optical properties of free-standing smectic films, as the temperature is above
, will be considered [
7].
2.2.5. Heat Capacity, Surface Tension, Disjoning Pressure and Optical Refectivity of FSSFs
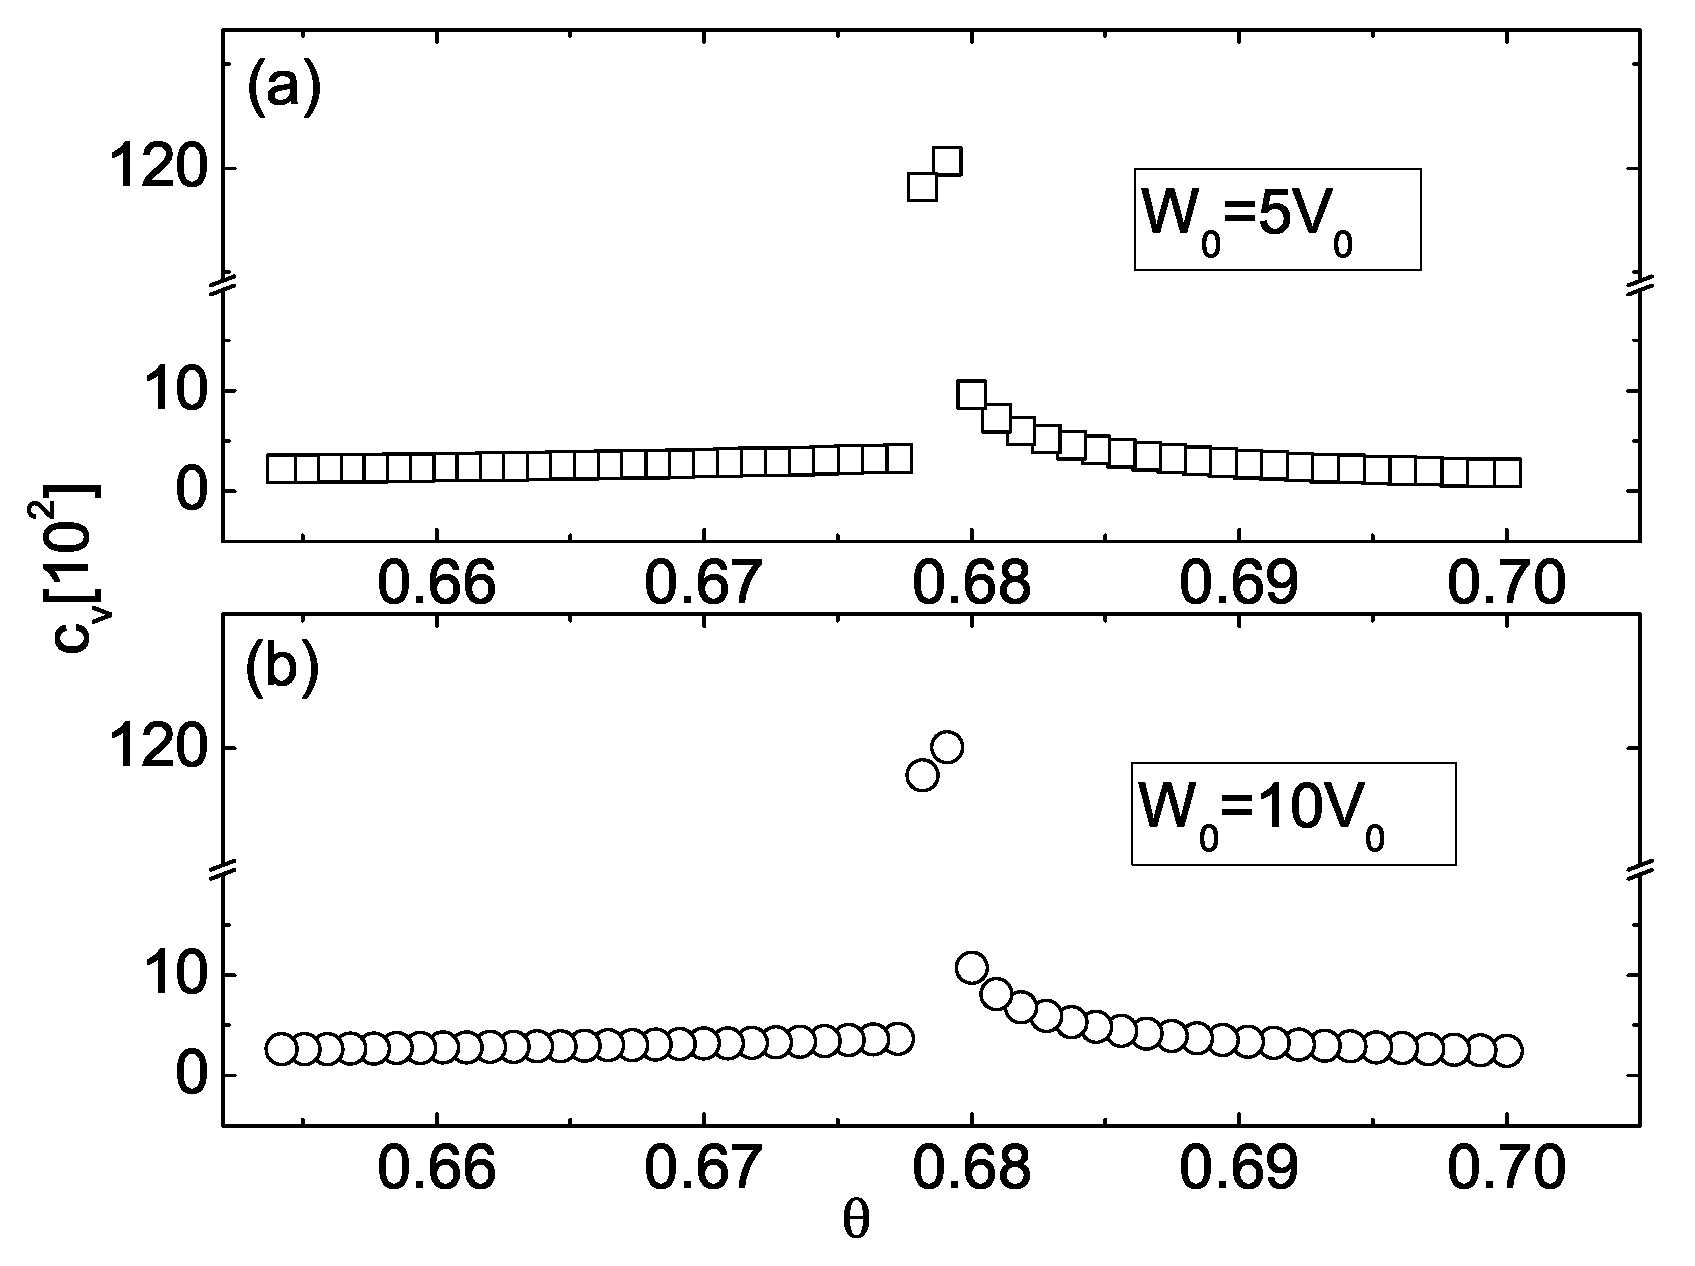
A great variety of thermodynamic properties has been observed in FSSFs. Among other, a very interesting phenomena is the stepwise reduction of heat capacity
when the temperature is increased above
. In the framework of the abovementioned mean-field approach, the temperature
s effect on the
at constant volume of the smectic film with 25 layers, in two cases of strong interactions
and
, has been investigated numerically [
7] and the results are shown in
Figure 14a,b [
7].
Calculations showed that the heat capacity
anomaly (i.e., heat-capacity peaks) (
Figure 14a) at temperature
, is associated with the interior first-order SmA-I transition, where the entropy change is greater than
(
Figure 12b, curve 1) per molecule, and demonstrates a discontinuous rise at
, whereas the value of
(
Figure 14a), in the temperature range
, varies between 280, at
, and 450, at
, respectively. Please note that in the case when the “enhanced” pair interactions in the bounding layers are in two times stronger
, the temperature
s effect on the
has the same qualitative behavior (see
Figure 14b) and the value of the layer-thinning transition temperature
is practically the same as in the weaker case. In the temperature range
the value of
(
Figure 14b) varies between 300, at
, and 480, at
, respectively.
“Heat capacity
values of the partially fluorinated H10F5MOPP 25-layer film, calculated in the framework of the mean-field approach, at temperature
(
), below both the bulk SmA-Isotropic transition temperature and the layer-thinning transition temperature corresponding to strong (
) interactions in the bounding layers, are equal to
, or
, or
[
7], respectively. In turn, the measured, by means of calorimetric techniques, value of
, at the same temperature corresponding to “plateau” values of the heat capacity, is equal to
, or
[
1]. Hence, it has been obtained a good agreement between the theoretically predicted [
7] and experimentally obtained [
1] results. In recalculations of the theoretical values of
per
molecule to compare with the measured
values, it has been used the fact that the total number of molecules
M per unit area in the film, denoted as
, can be estimated as
, where
is the number density and
is the thickness of the
N-layer film. Since
d is of the order of the molecular length
nm [
33],
can be estimated as
.
The result of comparing of the calculated value on , obtained in the framework of the mean-field approach, and the experimentally measured values of shows that the extended McMillan’s approach “enhanced” by anisotropic interactions in the bounding layers, with , is more suitable for describing both the structural and thermodynamic properties of a partially fluorinated smectic film than with , which gives , or , at temperature ().
The calculated data [
7] on the dimensionless heat capacity
per molecule, and the recalculated dimensional heat capacity
, corresponding to
N layer films, as well as the “plateau” temperatures
for the sequence of the abovementioned layer-thinning transitions (with
) are collected in
Table 1. Calculations showed that these plateau temperatures satisfy [
7]:
, where the numbers correspond to the successive layer-thinning transition temperatures given earlier. The observed data on
for the free-standing partially fluorinated
smectic films also correspond to a series of “plateau” values for the sequence of the layer-thinning transitions
etc., [
1]. In the range of film thicknesses investigated, the reduction of
is, at least qualitatively, in agreement with the experimentally observed decrease of
with decrease of
N.
Comparisons of the theoretical and experimental reductions of heat-capacity values at “plateau” regions in thin smectic films away from the layer-thinning transition temperatures should be unaffected by questions of the layer-thinning mechanisms. Nevertheless, these mechanisms may affect the “anomalies” shown by the heat-capacity peaks in
Figure 14. Such anomalies have not been presented in experimental studies of SmA layer-thinning transitions, to our knowledge, but only in studies of SmA to hexatic-B transitions of smectic films [
22], and we hope the present review will spur further experimental work in this direction [
7].
Recently, it has been carried out the high-resolution study of the film tension
as the film is heated through the layer-by-layer melting process, and the sawtooth behavior of the surface tension upon heating the FSSF above
was observed [
9,
10]. The understanding of how confinement influences the
of thin smectic film when one or several layer(s) is(are) squeezed-out to meniscus has been investigated theoretically [
11,
12,
47]. It has been done in the framework of the mean-field approach with anisotropic forces [
7]. “The temperature
s effect both on the dimensionless Helmholtz free energy
(see Equation (
10)) and surface tension
(see Equation (
13)) per H10F5MOPP molecule in the smectic film, in the case when there is no electric field
or
, corresponding to a sequence of layer-thinning transitions
, has been investigated numerically by solving the set of
self-consistent nonlinear equations from (
3) to (
5), with the effective anisotropic potential
in the form of Equation (
9). The results are shown in
Figure 15a,b [
11].
Calculations showed that above
, both the 25-layer free energy
and surface tension
profiles demonstrate monotonic growth of these values with the smaller slope and abruptly jumps to the lower and higher values, respectively, at
, where the film thins to 13 layers. This effect tends to repeat for the rest sequence of layer-thinning transitions
, where each thinning is characterized by abrupt jumps to the lower or higher values, both for
and
, respectively, and then continues to increase with the smaller, practically constant, positive slope. Please note that the value of
per H10F5MOPP molecule of the 25-layer film is lower by a factor ∼4 than the value of
per molecule of the 6-layer film, where the numbers correspond to the successive layer-thinning process described earlier. In order to carry out the direct comparison between the high-resolution measured data on the surface tension
[
9,
10] and calculated, in the framework of the extended McMillan’s approach “enhanced” by anisotropic interactions in the bounding layers, with
, value on
[
11], the dimensionless value of
has been obtained. The calculated value of
, for the case of H10F5MOPP 25-layer at temperature
(∼353 K), is equal to
or
N/m, while the measured value of
is equal to 0.014 N/m. Hence, it has been obtained a good agreement between the theoretically predicted [
11] and experimentally obtained [
9,
10] results.
It should be noted that the calculated values of surface tension show relatively small decrease of
as the film thins in correspondence to the sequence of the layer-thinning transitions
. Calculations also showed [
11] that the corresponding average values of
are:
,
,
,
,
,
,
, and
. Here all data are in [N/m] [
12].
These results show that the extended McMillan’s approach “enhanced” by anisotropic interactions in the bounding layers is suitable for describing both the structural and thermodynamic properties of a partially fluorinated smectic film through the sequence of the abovementioned layer-thinning transitions.
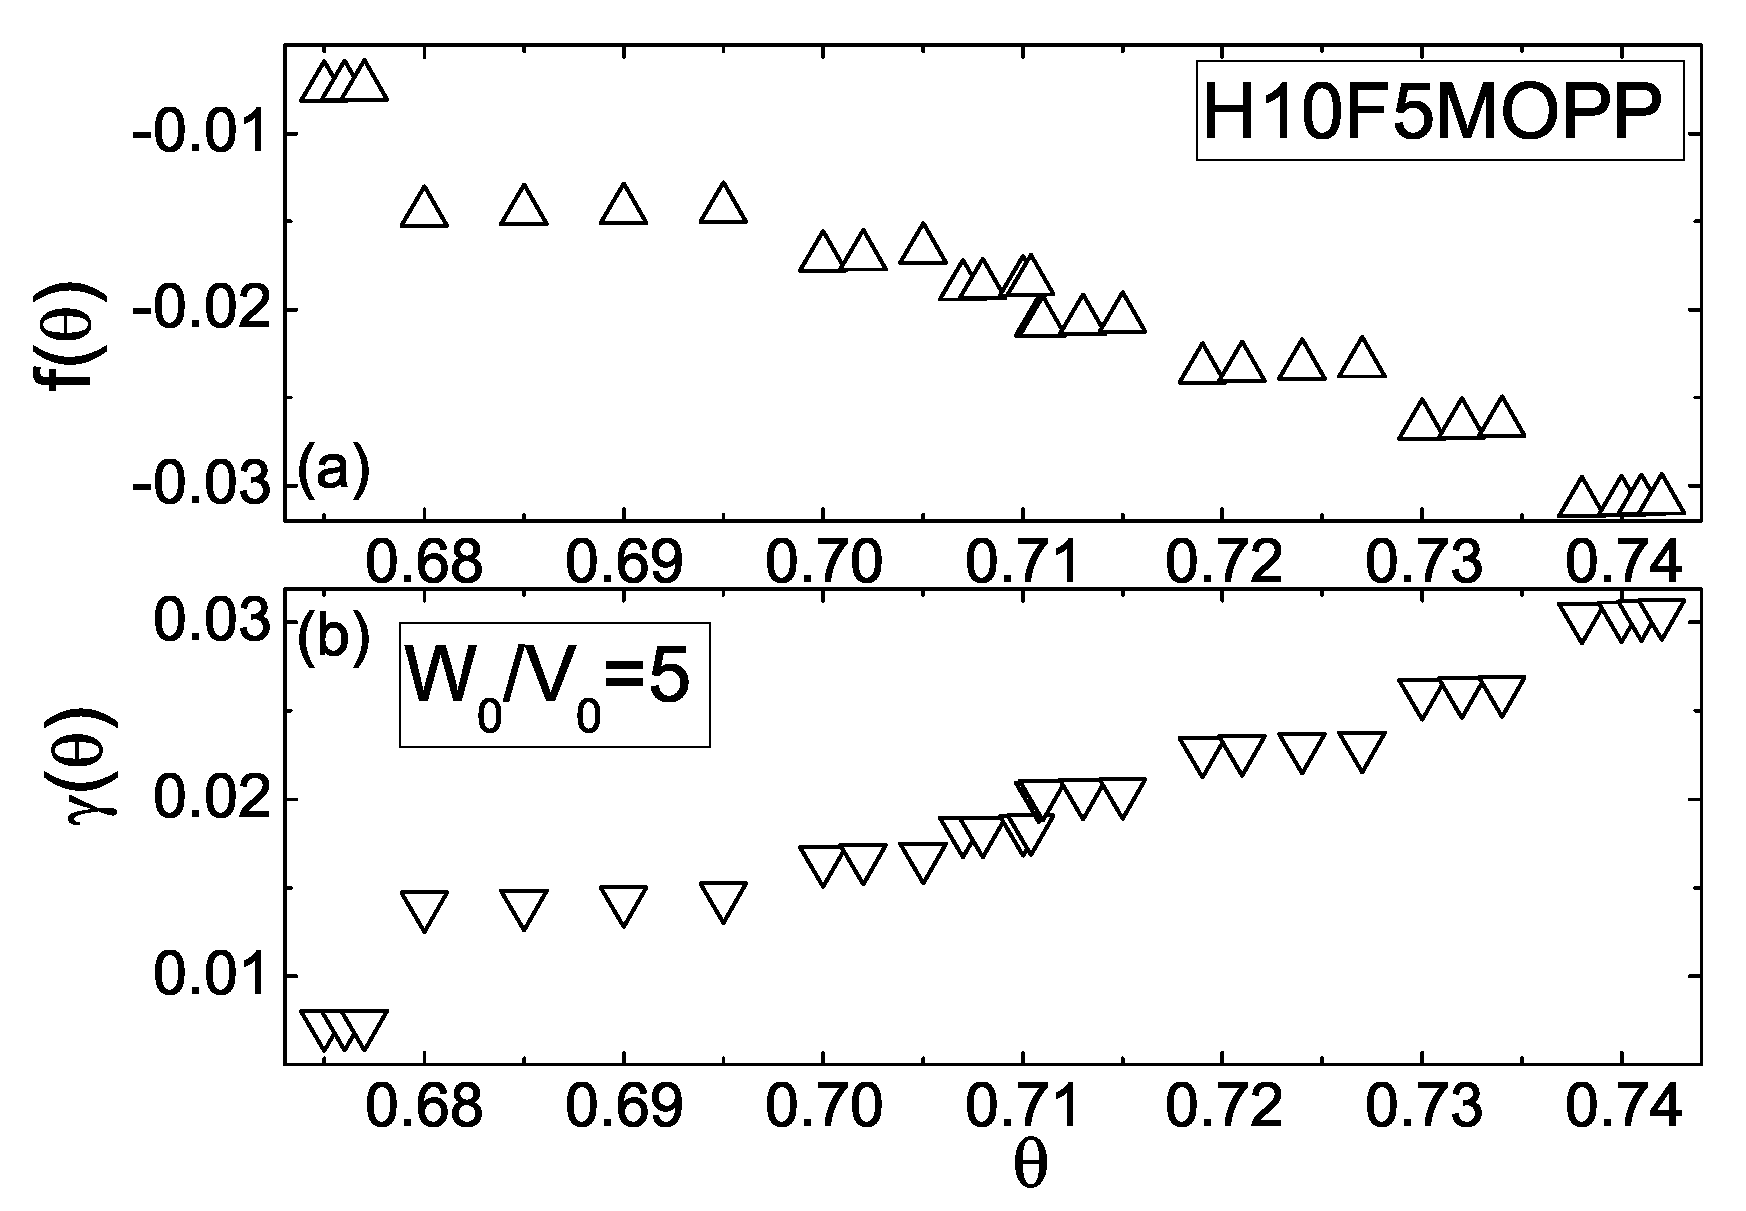
“To examine the external field
’s effect on the layer-thinning transition sequence and both on
and
, calculations of the above values, for the case when the electric field
is directed across the film [
11,
47], has been carried out. Calculations showed that the dimensionless field
’s effect on the layer-thinning sequence is reflected in the change of the layer-thinning transition sequences and of both values of the first multilayer jumps in the thickness and the corresponding layer-thinning temperatures
. For instance [
11,
47], in the case of
the corresponding layer-thinning temperatures
are:
,
,
,
,
,
,
, and
, whereas in the case of
the corresponding layer-thinning temperatures
are:
,
,
,
,
,
,
, and
, respectively. In these calculations the following model parameters were chosen as
and
. Therefore, in the case of
, the first thinning transition from
takes place at
, whereas with the growth of
up to 0.08, the first thinning transition from
takes place at
, what is on 13.8 K higher than in the case of
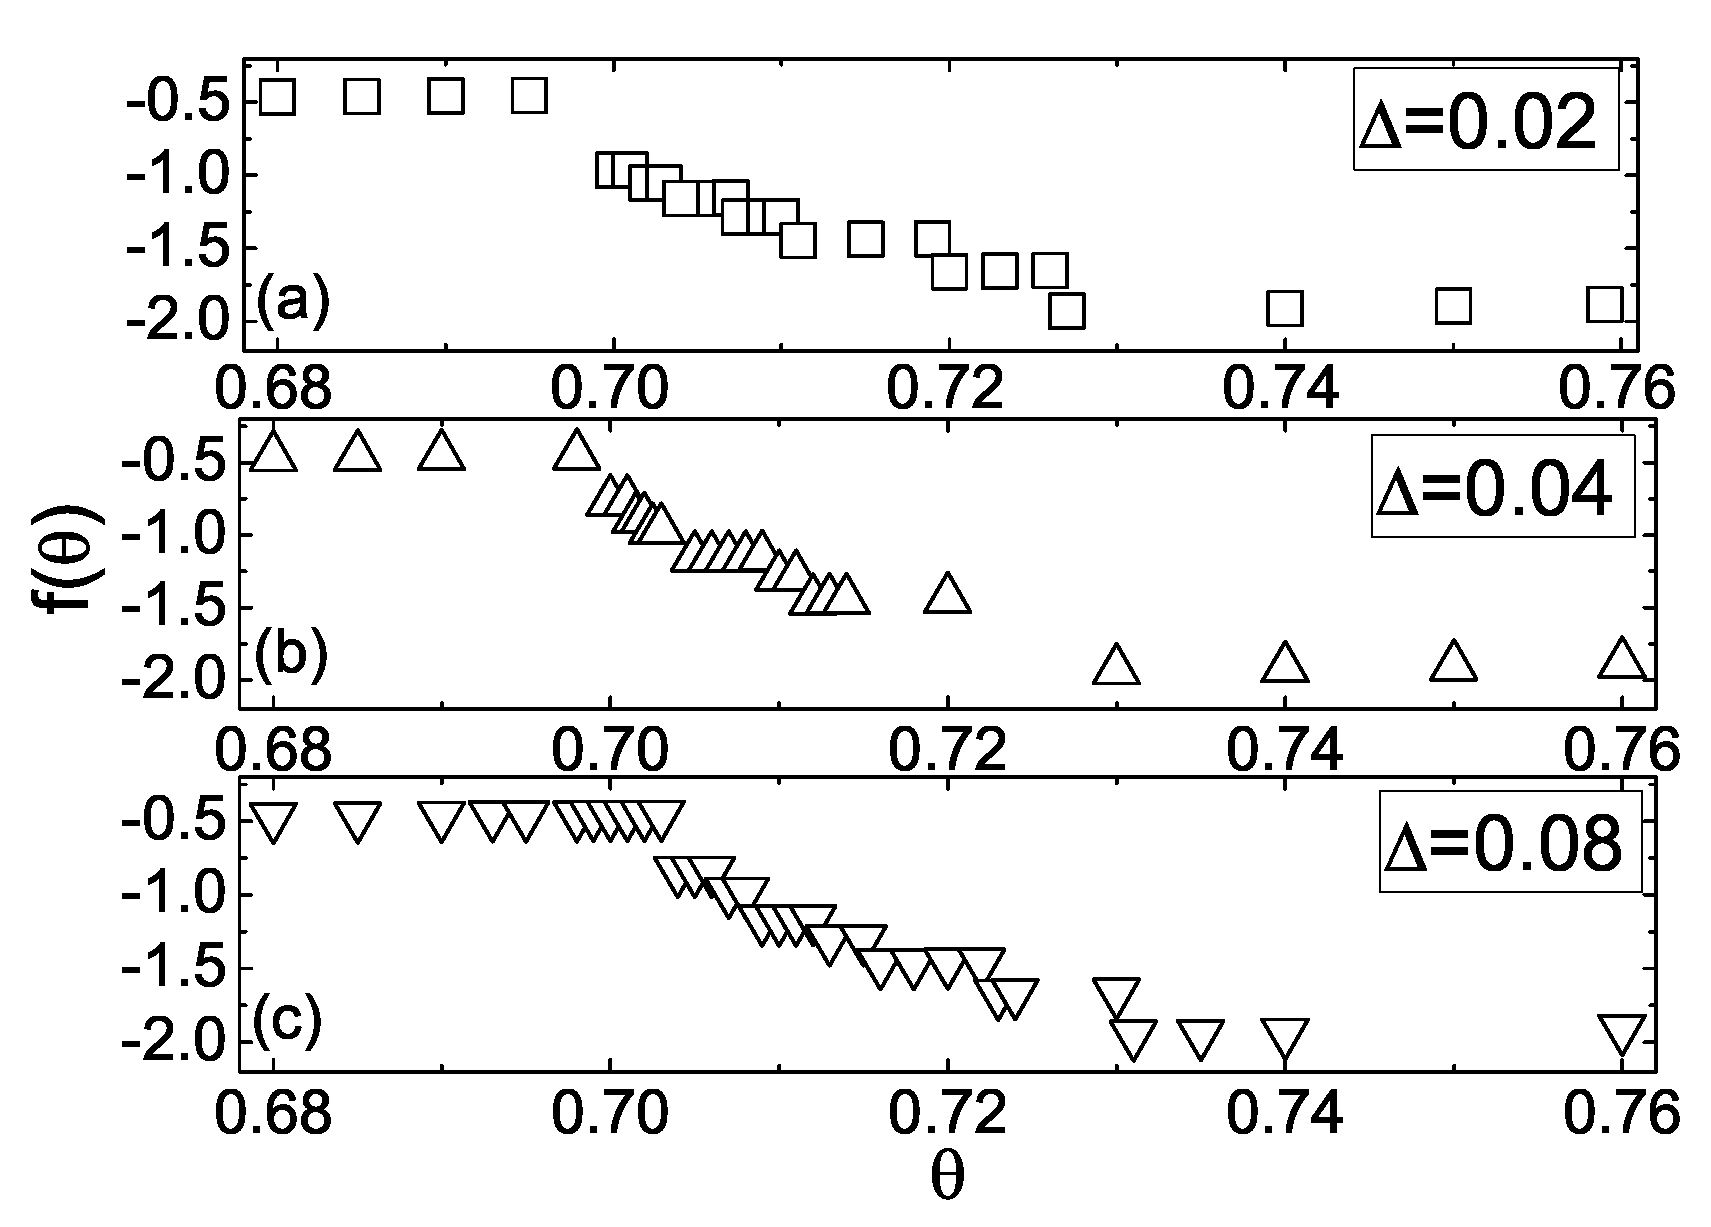
. Both the temperature
and field
’s effects on the dimensionless Helmholtz free energy
in the smectic-A film, for the cases of
, 0.04, and 0.08, is shown in
Figure 16a–c, respectively.
Above
the 25-layer free energy
per H10F5MOPP molecule increases with the smaller slope and abrupt jumps to the lower values at
,
, and
, where the film thins to 12, 15, and 14 layers, respectively. This effect tends to repeat for the rest sequence of layer-thinning transitions
, for
,
, for
, and
, for
, respectively, where each thinning is characterized by abrupt jump to the lower values of
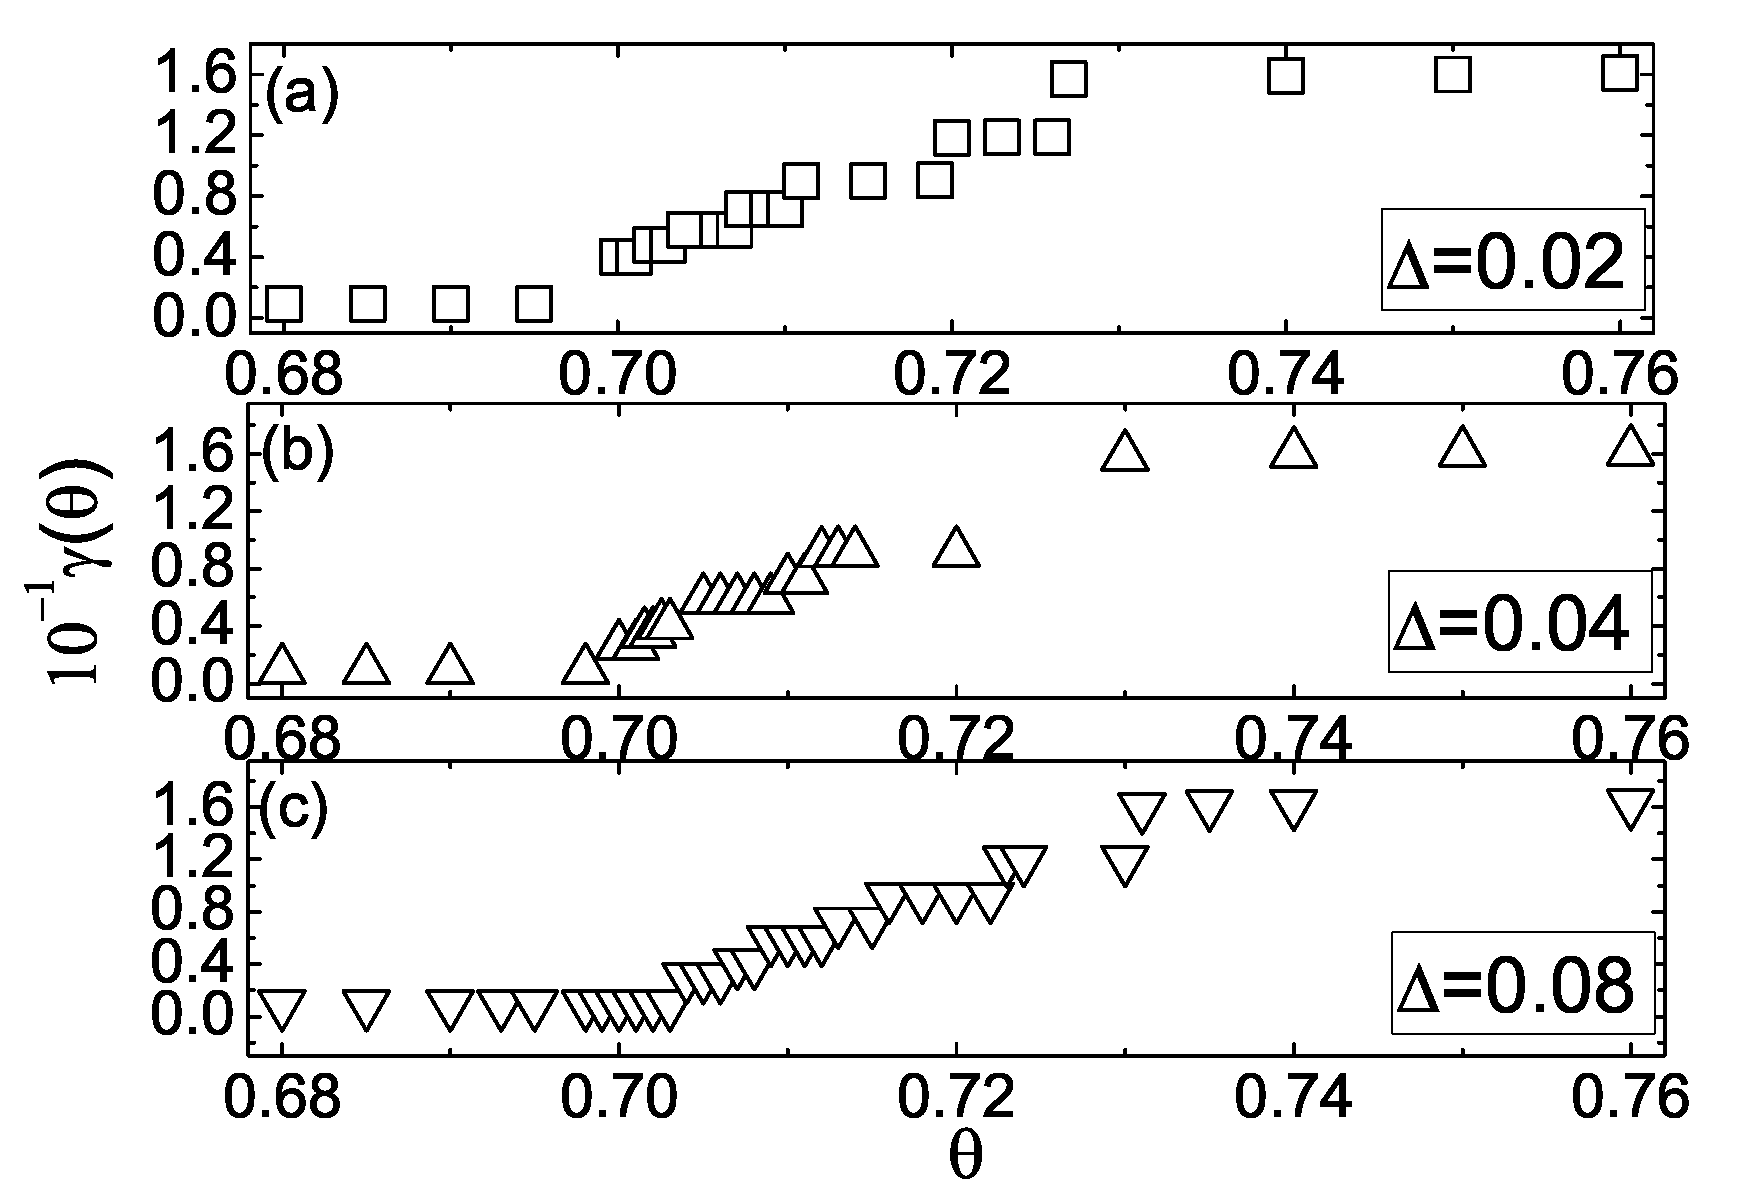
, and then continues to increase with the smaller, positive slope. Both the temperature
and field
’s effects on the
per H10F5MOPP molecule in the smectic-A film, for the cases of
, 0.04, and 0.08, is shown in
Figure 17a–c, respectively.
These calculations showed that at each thinning the film tension
abruptly jumps to the higher value and then continues to increase with the smaller slope [
11,
47], with growth of
within the temperature interval
. The calculated data both on the dimensionless
and dimension
surface tension per H10F5MOPP molecule for the 25-layer film [
11], vs.
, at the fixed temperature
, are collected in
Table 2 [
11].
According to these calculations, the ’s effect is characterized by increase of up to 29% with increasing of from 0.0 up to 0.08.
We can now estimate the magnitude of the electric field necessary for the experimental observation of the effect of on the change of the first layer-thinning transition temperature from , in the case of , to , in the case of . It can be obtained by applying the electric field across the 25-layer smectic-A film.
Therefore, based on these calculations one may conclude that the external electric field may affect not only the layer-thinning transition sequences, but also the change of the first multilayer jump in the film thickness and increase the value of the surface tension. Later effect is caused by enhancing of the order in the surface layers under the influence of the electric field applied across the layers.
These results indicate that the mean-field approach based on the extended McMillan’s theory can be usefully applied for describing the effect of the external electric field both on the layer-thinning transitions and surface tension of free-standing smectic films. It has been shown, by solving the self-consistent nonlinear equations for the order parameters, that for the regime of strong interaction with
, both the layer-thinning transition temperatures and values of the surface tension grow with increasing of
. Taking into account that there is good agreement between theoretical predictions and experimental results, this work lends credibility to the theoretical interpretation of the surface tension data and to the validity of the mean-field approach.”[
11].
The number of the optical techniques, such as the measurements of the optical transmission spectra [
6] or the optical reflectivity [
1,
2,
6] of thin smectic films, are the most effective experimental techniques which allow us to study these smectic films with the high-resolution. Measurements of the optical reflectivity
of thin smectic film composed of partially fluorinated molecules (H10F5MOPP) revealed a remarkable phenomenon of layer-thinning melting in smectic films upon heating above
[
1]. It was shown that the experimentally obtained values of
decrease in a series of sharp steps separated by plateaus as the temperature is increased [
1,
6]. In turn, the theoretical description of reflectivity
, which has been done in the framework of mean-field approach [
8,
47], shows that the values of
also decrease in a series of the stepwise reduction of reflectivity when the temperature is increased above
. In the limiting case, when the smectic film is sufficiently thin and the wavelength
of incident radiation is within the visible range, the reflectivity
can be written as [
8,
47]
where the refractive indices
can be expressed in terms of the OP
and the film thickness
, corresponding to the
ith layer. In turn, the film thickness
can be found as [
7,
8]
where
is the disjoining pressure acting on the film layers from the bounding surfaces, and
is the compressibility modulus of the
ith layer. Here
, where
is the thickness of the
ith layer,
and
are the values of the translational OPs corresponding to the
ith layer and the bulk SmA phase, respectively, and
and
are the compressibility modulus and the layer thickness in the absence of the disjoining pressure, respectively. It should be pointed out that the set of translational OP
, corresponding to the
ith layer, as well as the change
of the total Helmholtz free energy of the smectic film, can be calculated in the framework of the abovementioned mean-field theory [
7,
8,
12]. Please note that the change of the total Helmholtz free energy
of the smectic film is equal to the work which must be performed on the film unit surface area to decrease its thickness by one layer. Here
, is the full Helmholtz free energy corresponding to the
N-layer smectic film. In principle, two variants can be realized, the first variant is when the value of
is positive, then the disjoining pressure
prevents the thinning of FSSF, and the film layers are subjected to a stretching force. On the other hand, when the value of
is negative, the disjoining pressure promotes a thinning of the smectic film, and its layers are subjected to a compressive force. Calculations showed that both the
and
OPs for smectic layers demonstrate strong ordering in the bounding domains, and the profiles of
and
are characterized by rapid decrease of both OPs with distance from those surfaces. This nonuniformity of the film was taken into account when the reflectivity and layer-thinning compression have been computed.
The electric field
’s effect on the smectic layers should give rise to the change of their thicknesses
. According to Equations (
17)–(
19), the thickness
of the
ith film layer is the function of the disjoining pressure
and the compressibility modulus
for each layer
i of FSSF of a given thickness
N.
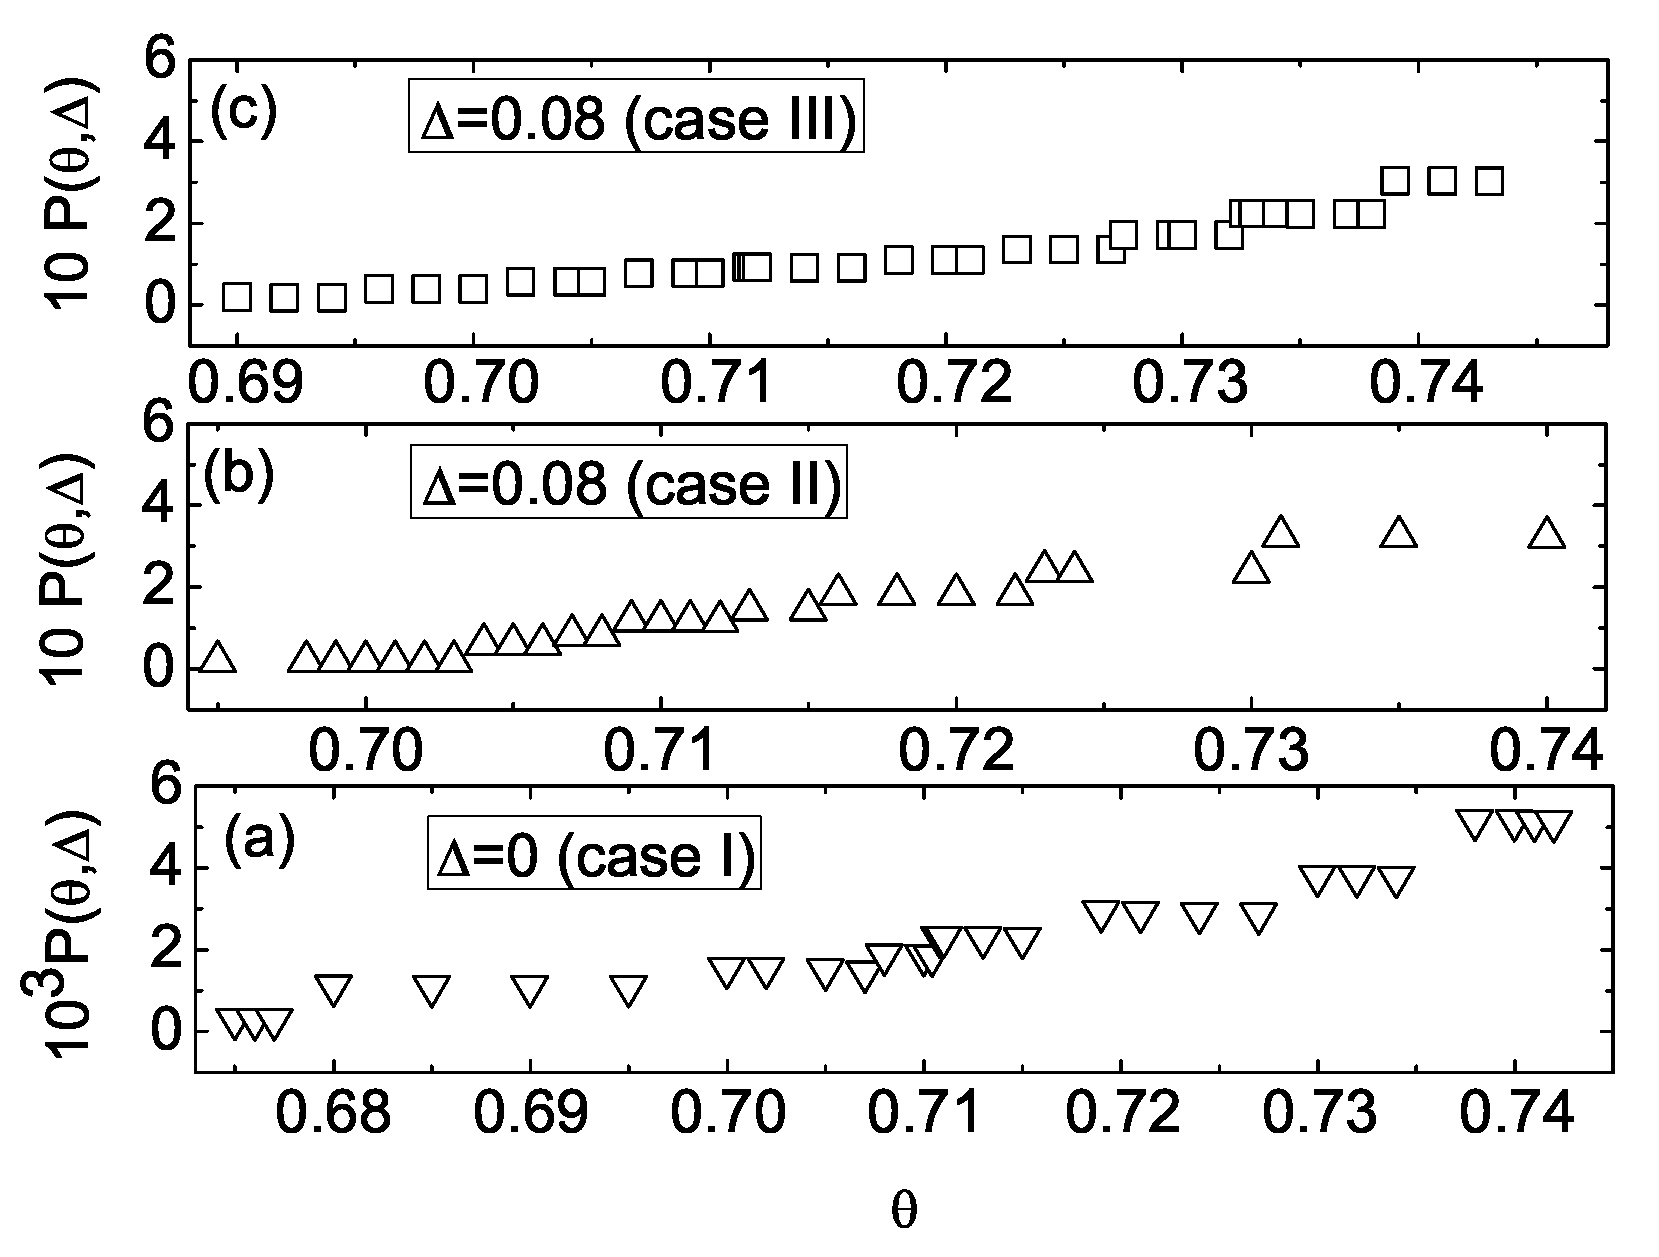
The temperature
s effect on the dimensionless disjoining pressure
, investigated in the framework of the mean-field approach, is shown in
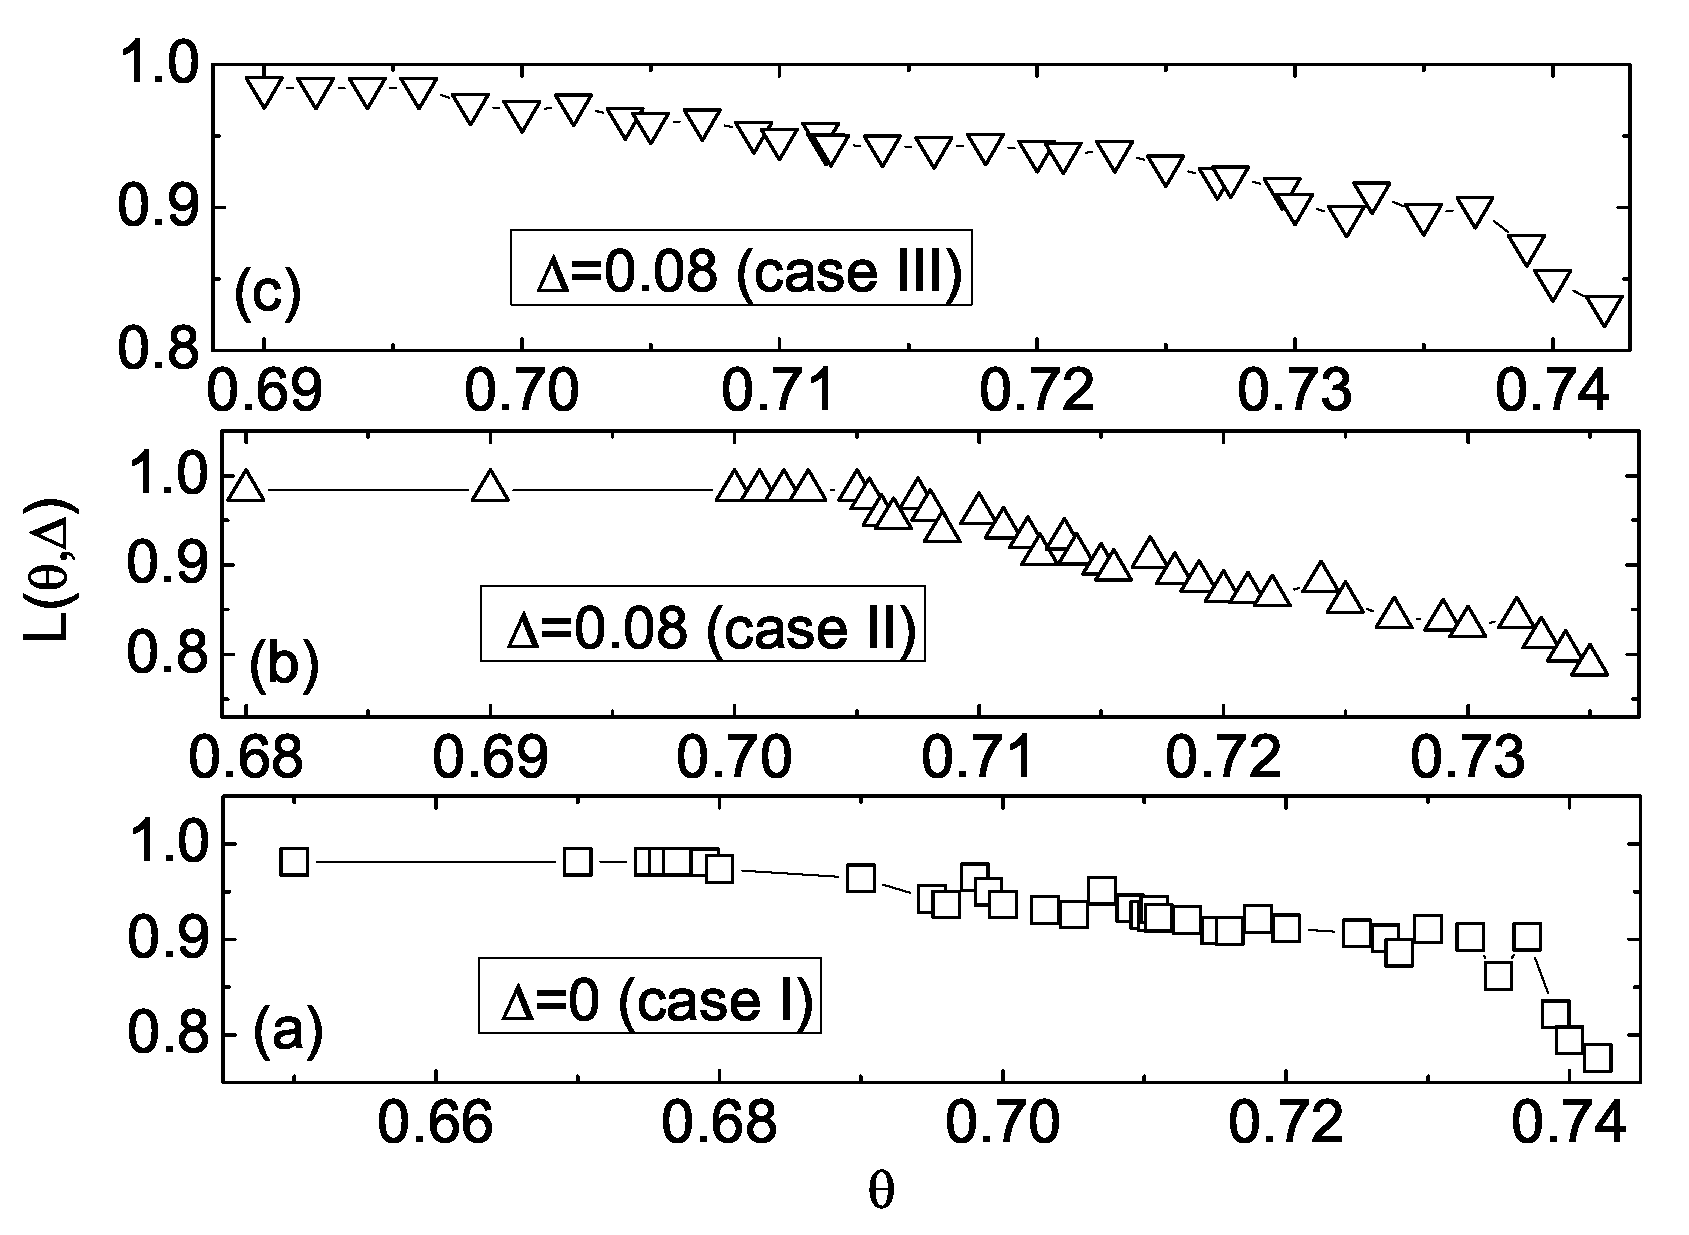
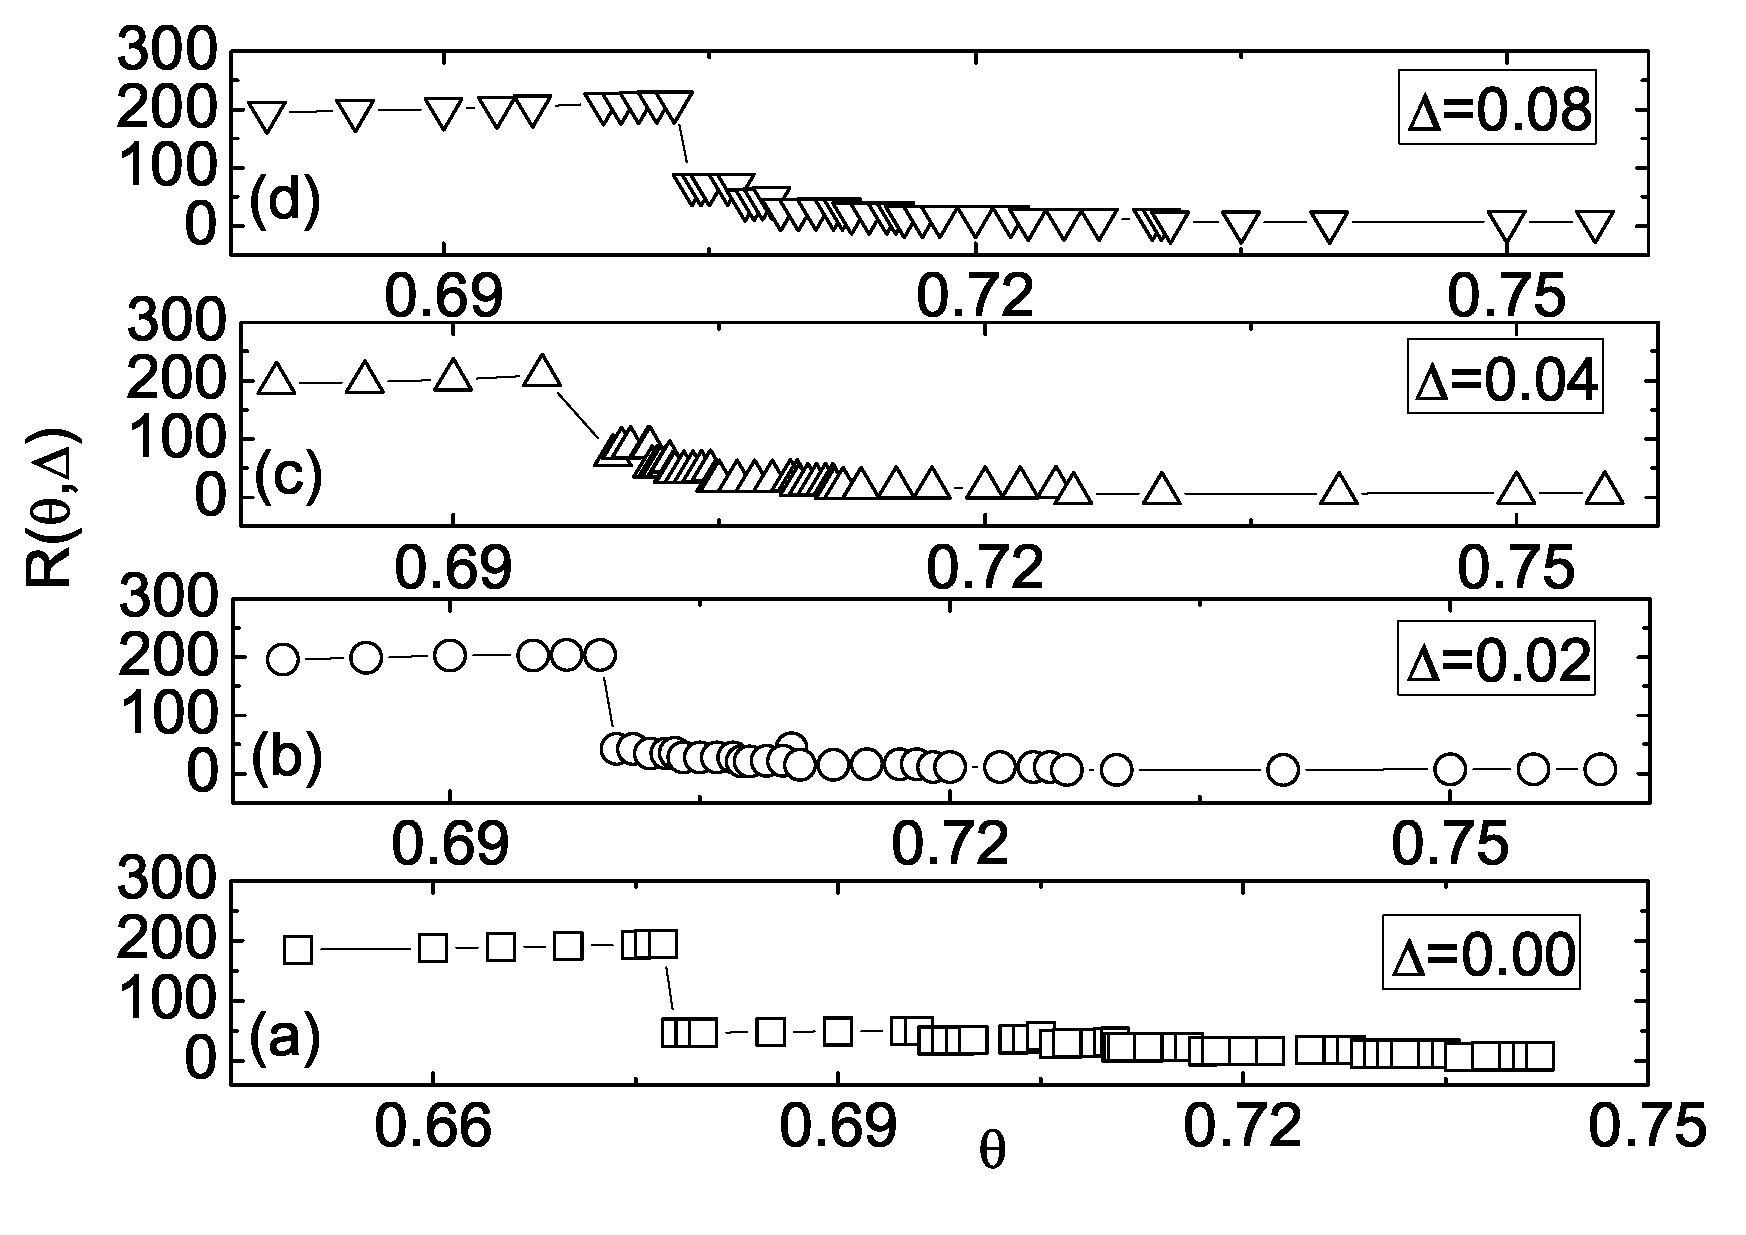
Figure 18.
These calculations correspond to the sequences of the layer-thinning transitions, for three cases [
47]:
(case I),
(case II), and
(case III), respectively, and showed that the external electric field (
), both directed across (case II) and along (case III) smectic film, has the strong influence on
. Indeed, in both cases II and III, the values of
(
Figure 5b,c) are on average by two orders of magnitude greater than the value of
(
Figure 18a) for the case I. Please note that the nature of such the electric field
’s effect on
is due to the
’s effect on the Helmholtz free energy
. Indeed, the values of
are approximately by one order of magnitude greater than the values of
(see
Figure 15 and
Figure 16), when the electric field is absent. As a result, anyone can find that the values of
are on average by two orders of magnitude greater than the value of
. This means that the average dimensional disjoining pressure
in the smectic film with
layers is [
47]
Based on these calculations, one can conclude that the layer-thinning transitions are characterized by abrupt (stepwise) increase of
when the film thins from
N-layer to
-layer film, then from
-layer to
-layer film, and so on. All smectic layers during the thinning process are subjected to the compressive force which grows with
N as [
12]
. The electric field
’s effect on the smectic layers should give rise to the change of their dimensionless thicknesses
. The behavior of the dimensionless smectic layer thickness profiles
across the 25-layer partially fluorinated H10F5MOPP smectic film, for several values of
[
47], showed that the interior film layers are compressed much stronger than the bounding layers. In the case of
, the interior layers are compressed weaker than in cases when the electric field is applied. Calculations also showed that with decreasing of the film thickness the biggest compressions of interior layers are increased, from
, for 25-layer film, to
, for 10-layer film, respectively. Physically, this means that in the case of thinner films all the layers are subjected to bigger compressive forces than in the case of thicker ones. The dimensionless field
’s effect on the average film thicknesses
in the smectic film corresponding to the sequence of the abovementioned layer-thinning transitions is shown in
Figure 19, and characterized by the stepwise decreasing of
[
8,
47].
Calculations showed that at each thinning the film thickness abruptly jumps to the higher values and then continues to decrease with the smaller slope, with growth of within the temperature interval . Here is the number of smectic layers remaining in the film after each thinning.
Behavior of the average film thicknesses
measured in the smectic film composed of 2-(4-(1,1-dihydro-2-(2-perfluorobutoxy) perfluoroethoxy) perfluoroethoxy) phenyl-5-octyl pyrimidine (H8F(4,2,1)MOPP) molecules also exhibit the upward jumps at each thinning transition [
33]. These results show that the extended McMillan’s approach “enhanced” by anisotropic interactions in the bounding layers is suitable for describing the stepwise reductions of the smectic film thickness through the sequence of the abovementioned layer-thinning transitions. Hence, it has been obtained a good agreement between the theoretically predicted [
8] and experimentally observed decrease of
with decrease of
N, for the FSSF composed of partially fluorinated molecules H8F(4,2,1)MOPP.
The understanding of how the temperature
and the electric field
effects on the reflectivity
in the smectic film [
47] through the sequence of the abovementioned layer-thinning transitions, has been obtained in the framework of the mean-field approach [
47]. The calculation results are shown in
Figure 20 and indicate that the reflectivity also demonstrates the stepwise reductions of
during the sequence of the abovementioned layer-thinning transitions. Plot of
vs.
, for the case II, and several values of
[
47] is shown in
Figure 20. Here the set of
values are: 0 (a),
(b),
(c), and
(d), respectively.
These results indicate that the mean-field approach based on the extended McMillan’s theory can be usefully applied for describing not only the layer-thinning transitions which occurs through the series of layer-thinning causing the films to thin in a stepwise manner as the temperature is increased above , but also several structural, thermodynamic and optical properties of free-standing smectic films. Taking into account that there is a good agreement between theoretical predictions and experimental results, this mean-field approach lends credibility to the theoretical interpretation of a wide range of structural and optical data.
In the next Section the diffusion phenomena in thin smectic films will be discussed.
2.2.6. Translational and Orientational Diffusion across the Smectic Films
Although several approaches have been proposed to theoretically describe the diffusion process in liquid crystals [
48,
49,
50,
51], it is still too early to talk about the development of a theory which would make it possible to describe the diffusion processes in thin smectic films based only on the form of the Hamiltonian. In the bulk of the SmA phase the translational diffusion process across the smectic layers implies a passage through a potential barrier
. Taking into account that in the smectic-A phase the coordinate system is chosen so that the direction of
z-axis coincides with direction of the director
, the potential barrier
is a periodic function of
z, with the period
d, which is the layer spacing. The jump rate for molecular diffusion in the bulk of the SmA phase can be described, for instance, by the translational diffusion model [
52], which assumes a stochastic Brownian process, in which each molecule moves in time as a sequence of small steps caused by collisions with its surrounding molecules and under the influence of the potential
, which is set up by these molecules. This diffusional process can be described by the translational diffusion tensor whose principal elements (
,
) are determined in a frame fixed on the molecule.
Recently, a molecular model based upon the random walk theory [
52] has been proposed to describe translational diffusion in freely suspended smectic films [
53]. It was shown that for the calculation of the translational diffusion coefficient (TDC)
across the smectic layers both in the bulk of the film, as well as in the vicinity of the bounding surfaces the set of
and
OPs, obtained by using the mean-field McMillan’s approach [
7] with anisotropic forces [
39] are required.
“The random walk theory allows us to calculate the translational diffusion across the smectic layers when a molecule makes a jump from
th to
ith layer. It can be realized when the molecule reaches “the boundary” between these layers with a “positive” momentum. Here the layers are counted from the film/air interface to the bulk of the film. In that case, the TDC can be written as [
53]
where
is the mean-square jump length from
th to
ith layers,
is the one-particle distribution function (see Equation (
5)), and
is the time required the molecule to jump from
th layer to the
ith ones. In turn, the time
can be written as
where
is the time of oscillation of the molecule about the equilibrium position in the bulk of the smectic film, and
is the height of the potential barrier. Here
and
are the values of maxima and minima neighborhood potentials belonging to
ith and
th layers, respectively. For calculation of the potential barrier
one needs an effective anisotropic periodic potential
within the
ith smectic layer. By implementing the integration in the last equation one obtains the set of expressions for the height of the potential barrier
where
is the dimensionless space variable. Notice that the overbar in the space variable
z has been (and will be) eliminated in the last as in the following equations.
Furthermore, it is convenient to rewrite expressions for potential barriers as [
53]
Having obtained the set of OPs
and
(
) one can calculate the potential barrier
, the mean-square jump length from
th to
ith layers [
53]
and the TDC
.
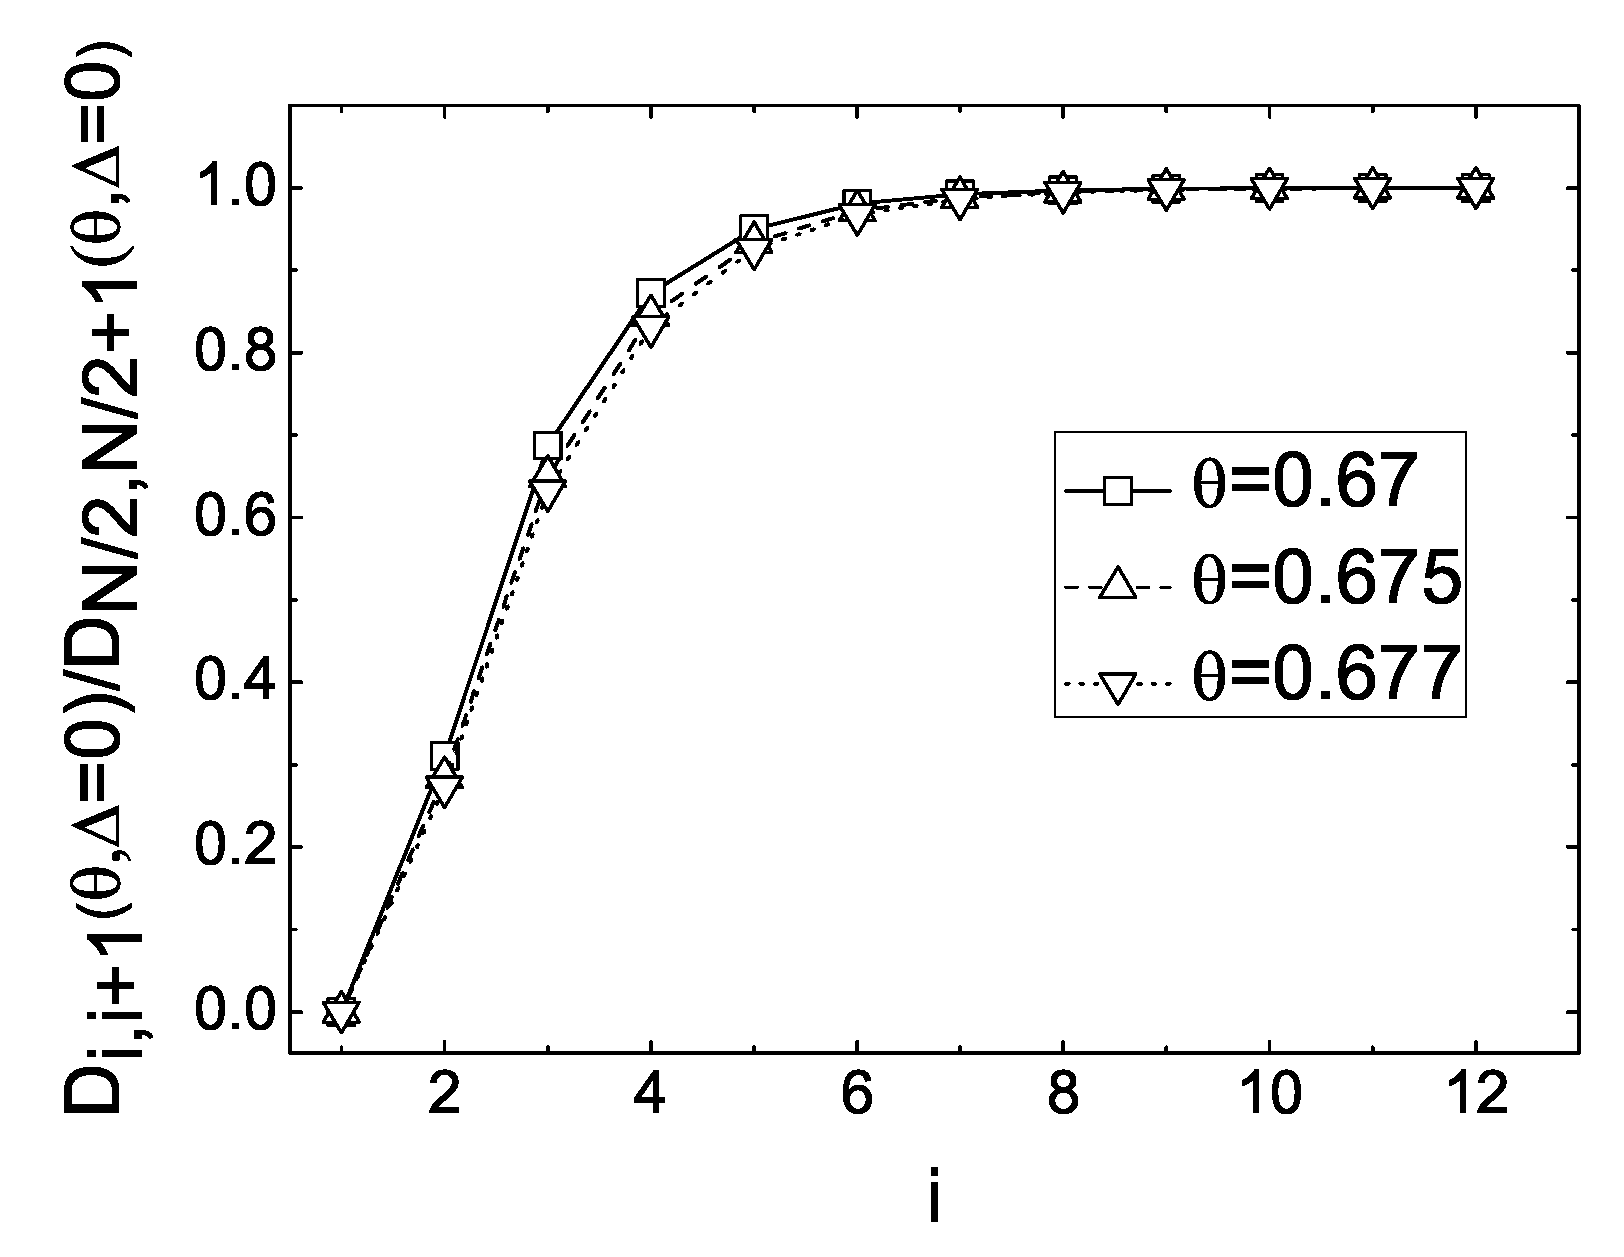
The calculated values of
vs. the number
i, in the smectic film with
layers and in the absence of the electric field (
) are shown in
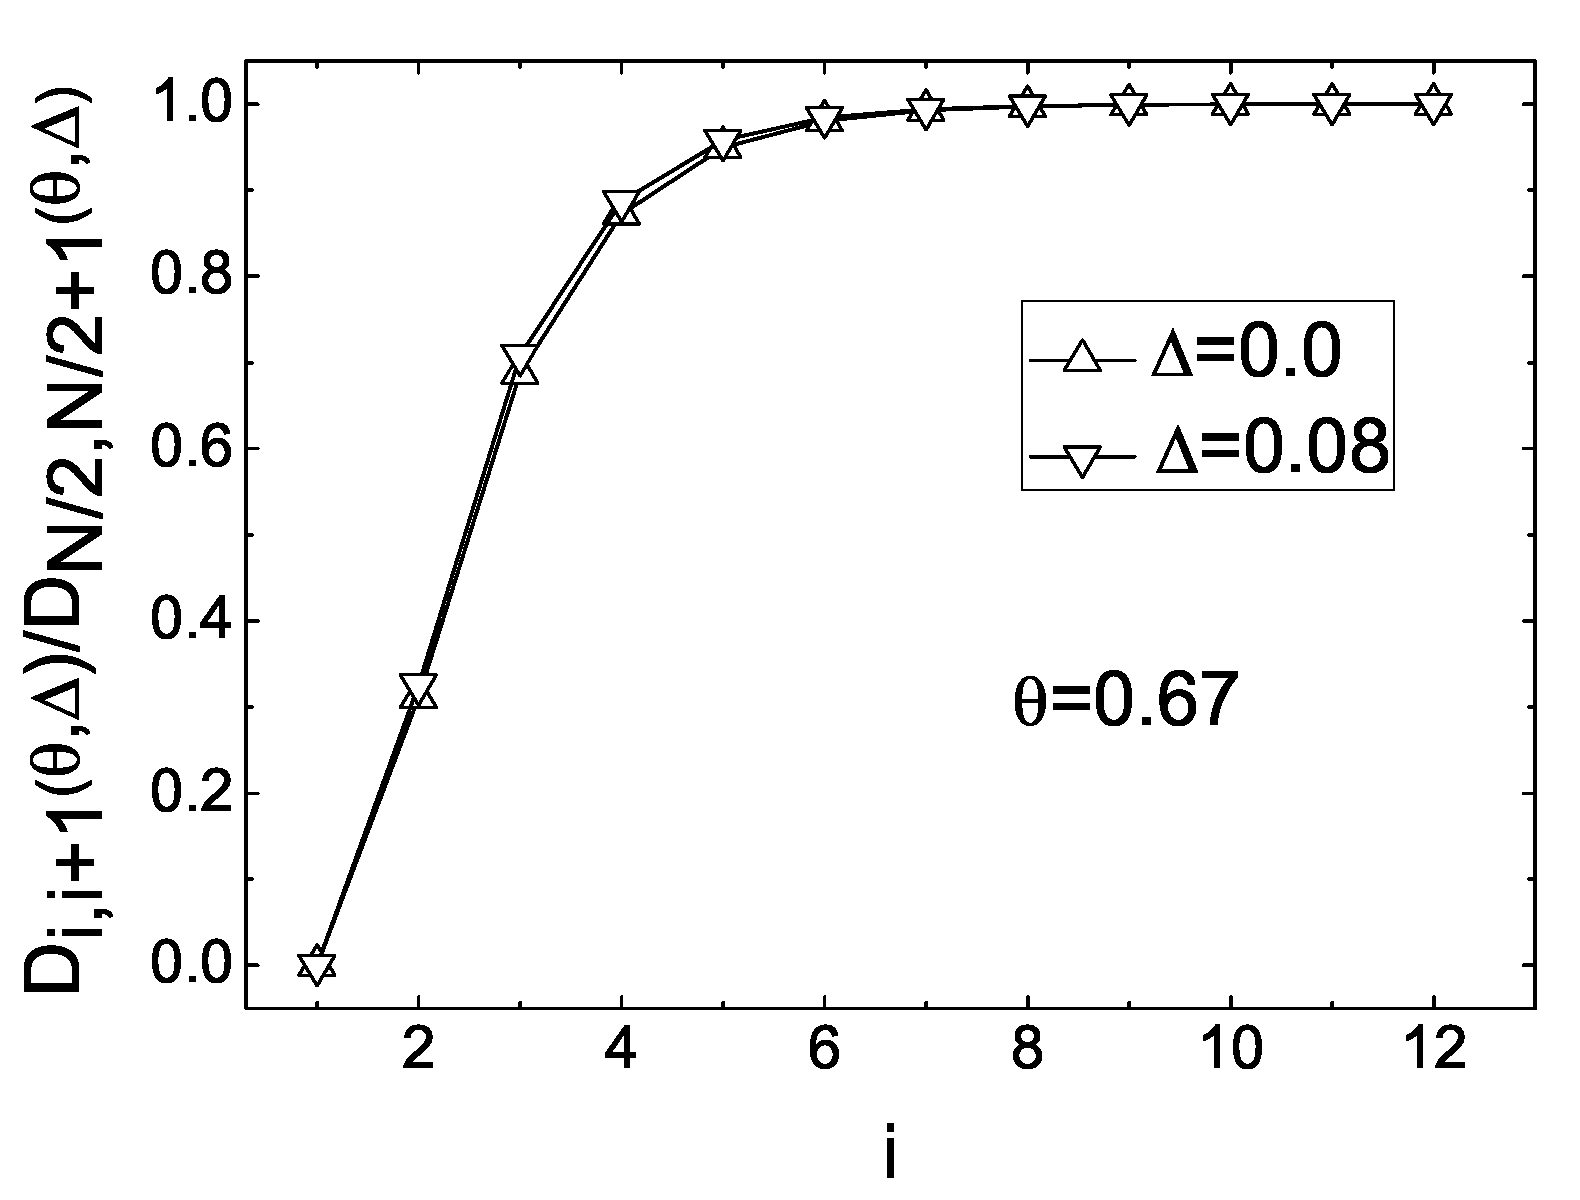
Figure 21.
Calculations showed [
53] that the distribution of the profiles
across the 25 layer smectic film, in the absence of the electric field (
), corresponding to three temperature
values 0.67 (squares), 0.675 (up triangles), and 0.677 (down triangles), respectively, are characterized by the monotonic increase of the ratio
up to the middle-film’s values, with increasing distance (or number of layers) from the bounding surface towards the interior of the film. In the case of strong (
) “enhanced” pair interactions in the bounding layers these distributions demonstrate monotonic growth of the value of
up to the eighth layer from each boundary, where the function
saturates and does not change with further increase of
i. In turn, near the bounding surface the motional constant
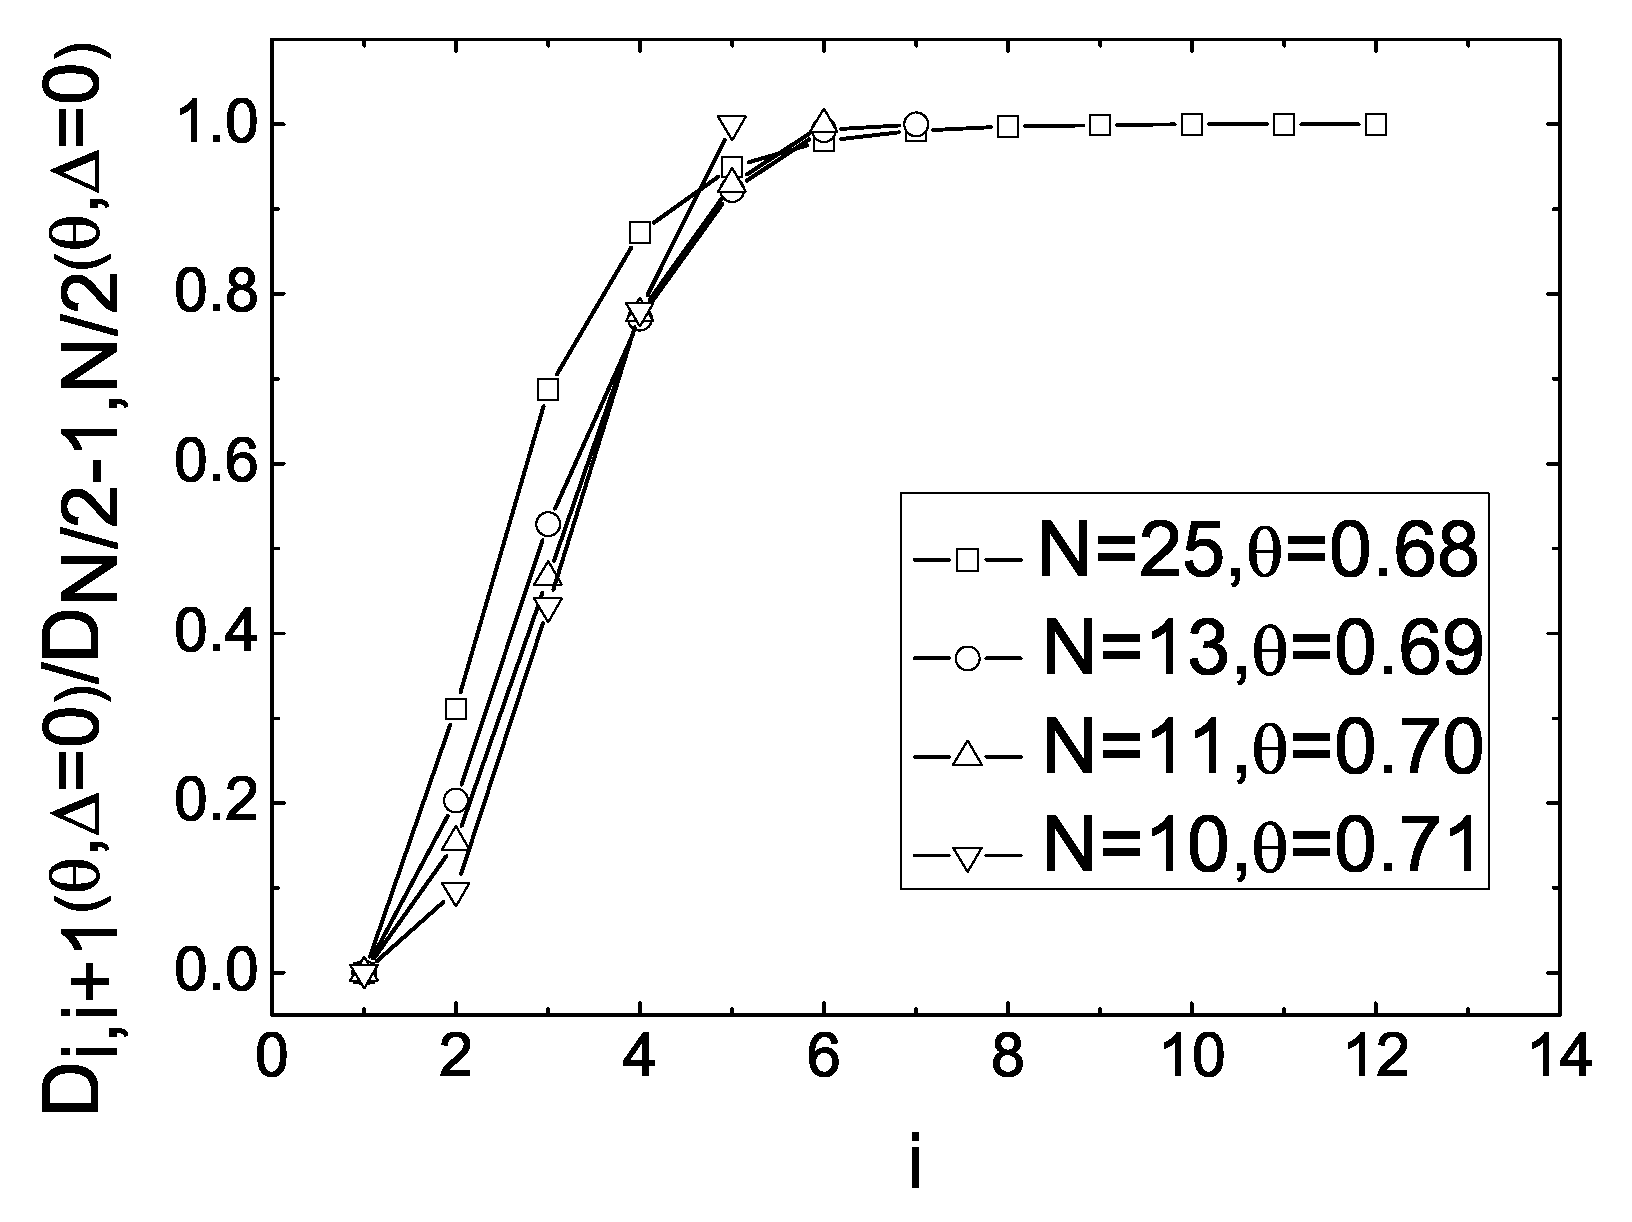
drops to zero, i.e., the strong “enhanced” pair interactions completely suppresses the diffusion process in the bounding layers. The distribution of the number of
profiles across the smectic films, during the sequence of the layer-thinning transitions
[
53], as the temperature is increased above the value
, is shown in
Figure 22.
Here, calculations have been carried out in the absence of the electric field (
) [
53]. The electric field
s effect on the dimensionless translational diffusion coefficient
as a function of layer number
i, in the smectic film with
layers, both in the cases of
and
) [
53], is shown in
Figure 23.
These calculations showed that the electric field
has a weak effect on distribution of
across the 25-layer smectic film and the diffusion process is completely suppressed in the bounding layers [
53]. Such behavior of the TDC is due to the fact that the potential barrier
is much bigger than
as the temperature is increased above the bulk value
, because of the strong ordering in the vicinity of the bounding layers.
It should be noted that the abovementioned mean-field model is applicable to describe diffusion across smectic layers, because one deals with the potential barrier which is set up across the smectic layers but not within the smectic layers.
To calculate the dimension value of translational diffusion coefficient
in the smectic film one can use the Maclaurin expansion of momentum autocorrelation function
. For such purposes, the function
, in the form of damped oscillation, has been adopted for calculation of the dimensional value of diffusion coefficient [
53]
where the angle brackets indicate the equilibrium ensemble average [
52]. Taking into account that the coefficients of Maclaurin series in time of function
are in principle calculable [
53], a two-parameter functional expression for
takes the form [
54]
where the parameter
determines the rate of decay, and
gives the rate of oscillation relative to the time scale determined by
. All this allows us to record the diffusion coefficient
, in terms of
and
, which takes the form [
54]
where parameters
and
are given in Ref. [
53]. The calculated data on
, at
(
) and
[
55], for 25-layer partially fluorinated H10F5MOPP smectic film, gives
. In turn, the experimentally obtained data on
, for 25-layer smectic film composed of 4-octyl-4′-cyanobiphenyl molecules, gives
[
56,
57]. Hence, it has been obtained a good agreement between the theoretically predicted [
53] and experimentally obtained [
55] results.” [
53].
“In turn, the rotational dynamics of a uniaxial molecule in anisotropic phase can be described in the framework of the rotational diffusion model [
58], which is based on the concept that the molecular reorientation proceeds through a random sequence of large-amplitude angular jumps from one orientation to another [
51]. In that model, a molecule is considered to be an ellipsoid aligned along, or close to
, where the diffusional jump results in rotation of the molecule from
to
. This assumes that a molecule to make jump by a minimal successful angle
, if reaches “the boundary” between the
and
orientations, and has a positive angular-momentum projection
onto any axis perpendicular to
.. In the framework of this model, the rotational self-diffusion (RSD) coefficient
can be written as [
51]
where
is the rotational jump rate,
is the moment of inertia of the molecule with respect to the minor axis of the ellipsoid,
and
are the angular-momentum components,
is the one-particle distribution function of the LC film on the solid surface. The function
does not depend on the azimuthal angle
, and, moreover, in the vicinity of the equilibrium state, the momentum projections are neither correlated between them nor with the conjugated angles
and
. In this case, the function
can be written as a product of three functions
where
and
are the Maxwellian distribution functions, whereas
is the ODF. By integrating Equation (
31) one obtains the final expression for the coefficient RSD [
51,
59,
60]
Thus,
is the function of temperature
,
, and the value of the ODF at
. Physically, this means that the one-particle function
of the LC phase has a rather sharp maximum at the point
(i.e., around the director
), rapidly decreasing as
tends to
. At
the function
is small but finite, and defines the “gate” width in orientational space through which the molecule diffuses from one orientation to another. Therefore, having obtained the ODF
, one can calculate, using Equation (
33),
as the function of
and
.
The numerical analysis of rotational diffusion processes in thin smectic film (
) deposited on the solid surface (with
and
) showed that only a strong electric field
has a visible effect on the dimensionless coefficient [
61]
(see
Figure 24).
Here
and
are two parameters of the LC system which are defined for the enhanced pair interactions in the LC/vacuum and LC/solid bounding layers, respectively, and the dimensionless electric field
can be obtained by applying the electric field
across the 25-layer smectic film. Calculations showed that the motional constant
decreases in the low-temperature range (
), up to 20% [
61], with increasing of
from 0 to 0.1, both in the first (
,
Figure 24a) and the last (
,
Figure 24b) layers [
61]. In the high-temperature range (
) the effect of the electric field
decreases, and finally disappears at the end of the temperature interval (
). In the case of a strong electric field (
), calculations showed that curves describing
vs.
, both for the first (
) and the last (
) layers, are practically congruent curves [
61].
The parameter
’s effect on
for two values of
is shown in
Figure 25 and
Figure 26.
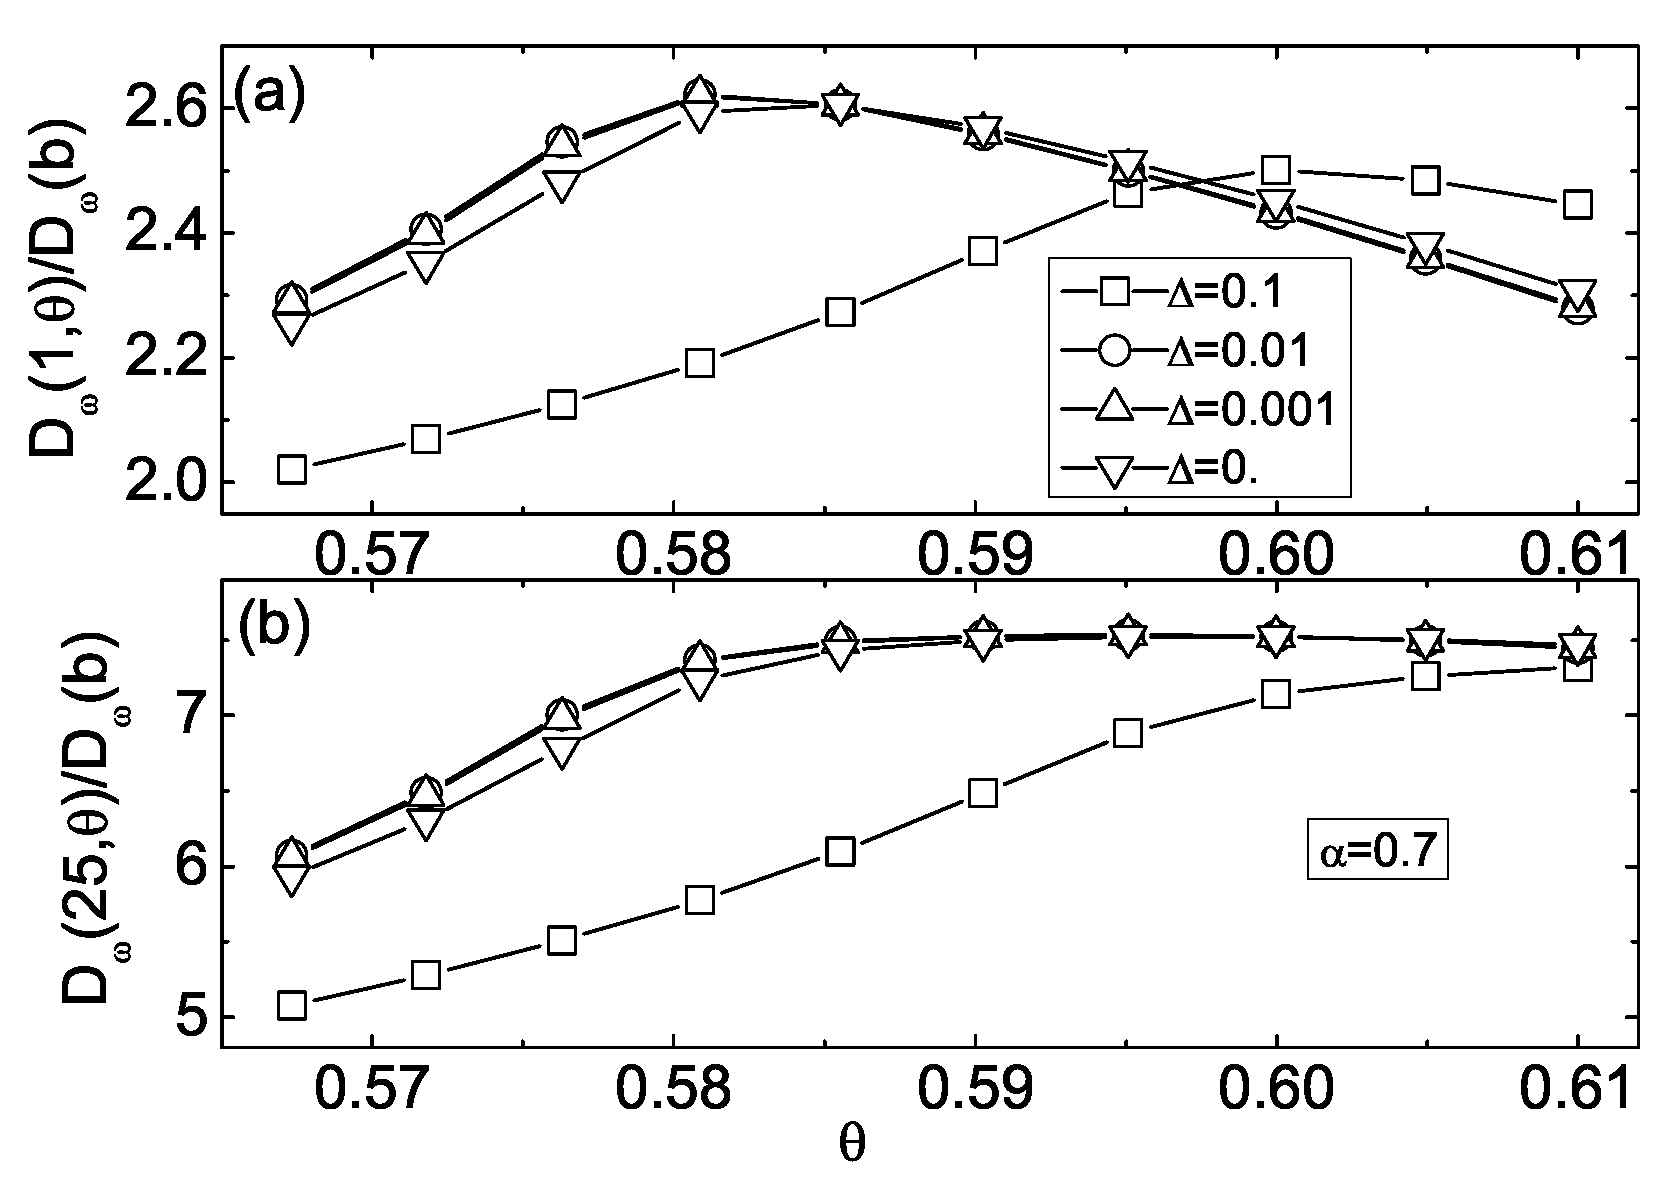
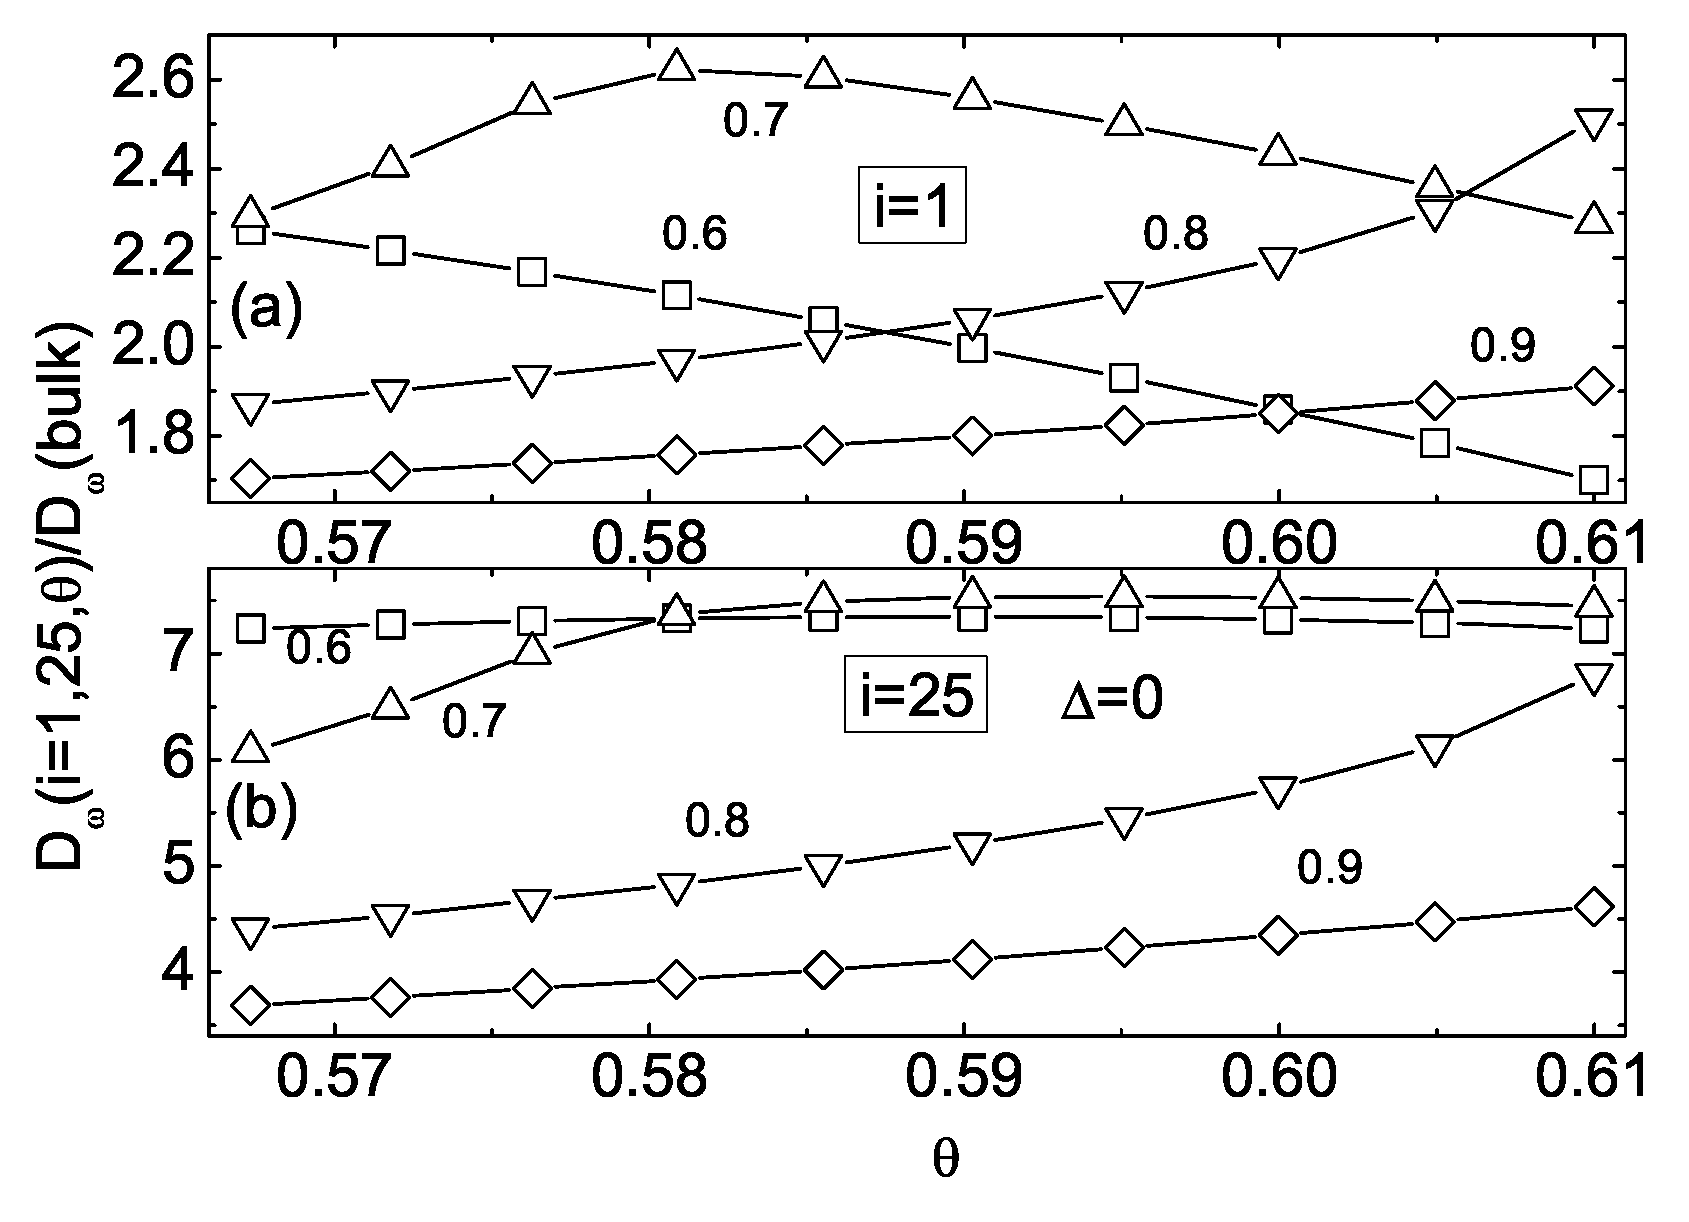
Calculations showed [
61] that in the case when the electric field is absent (
), and in the low-temperature limit
, the lower values of
, i.e., 0.6 and 0.7, produce the higher values of
(see
Figure 26b), whereas in the first layer (
), the lower values of
produce the higher dimensionless RSD coefficient only at the beginning of that temperature interval. At the end of the temperature interval
the higher values of
are produced at
(see
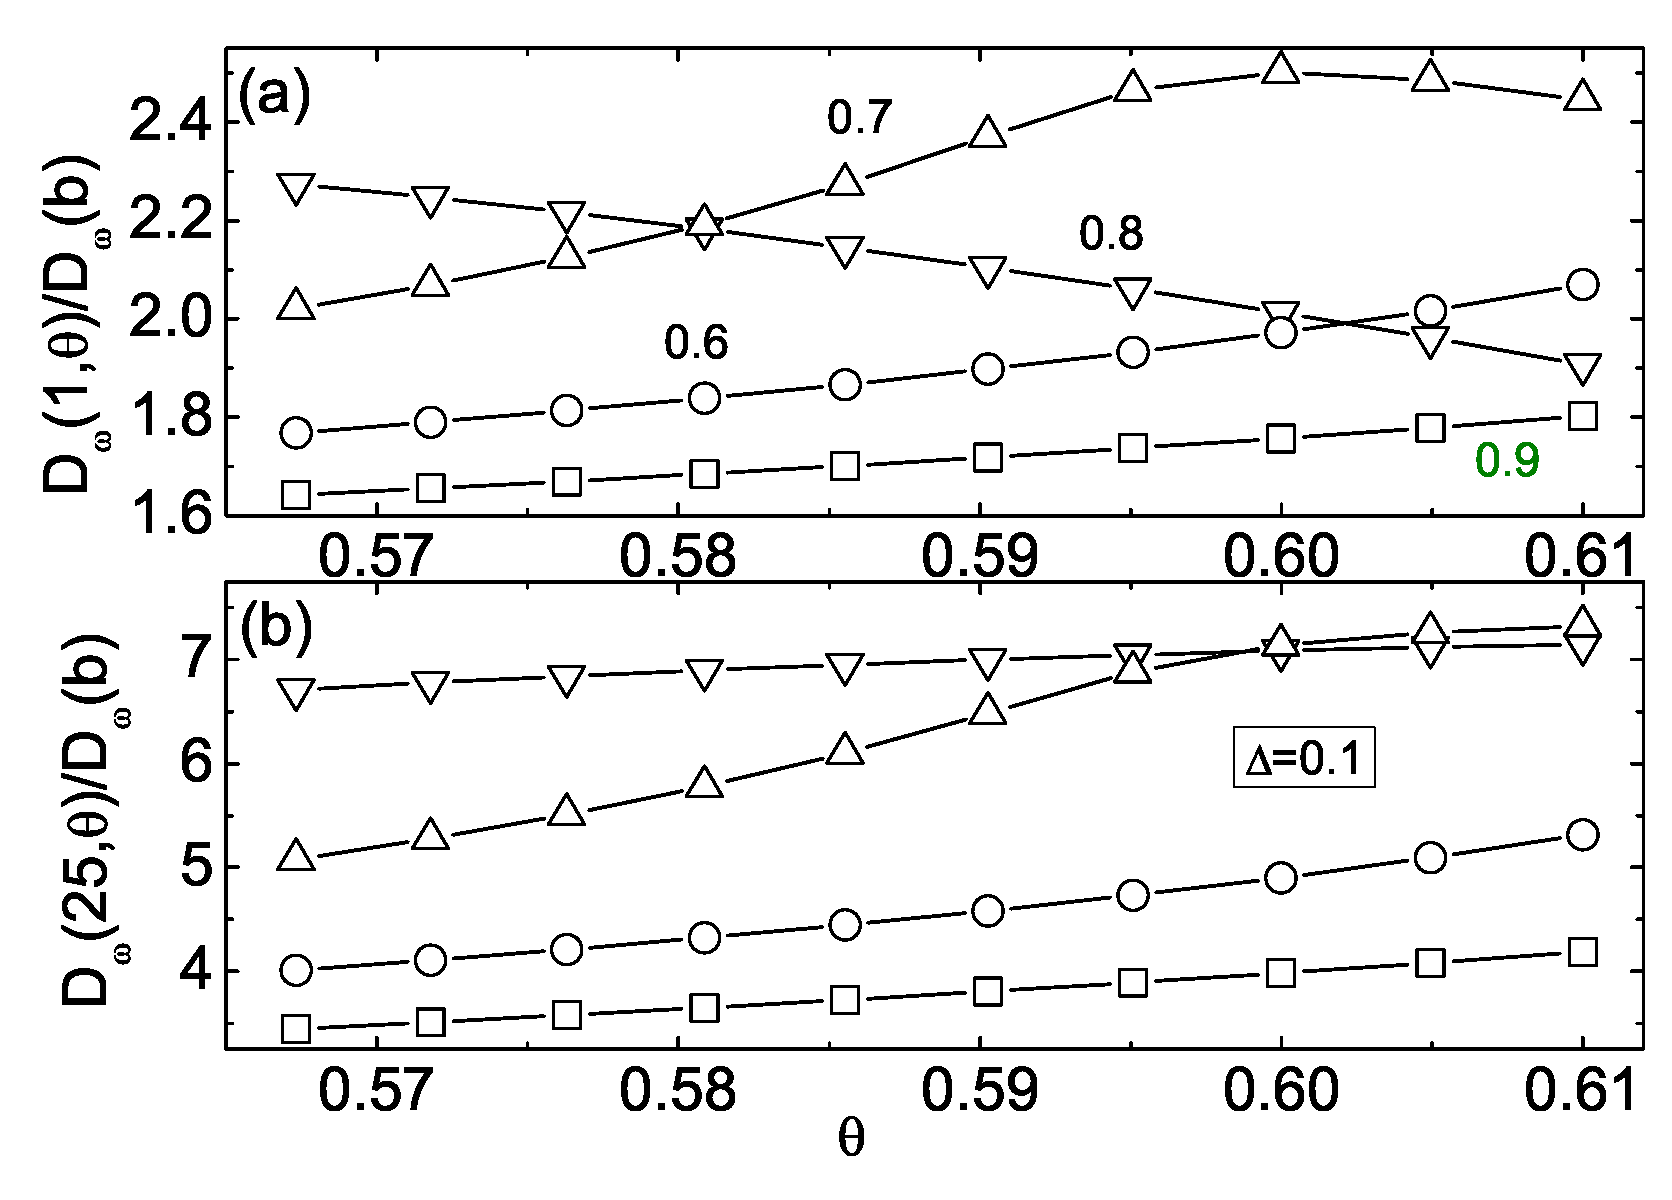
Figure 26a). In the case of a strong electric field (
), the dependence of
vs.
is shown in
Figure 26, and demonstrates the same qualitative behavior as in the case when the electric field is absent, only in the last (
) (see
Figure 26b) layer. In the first layer (
) and at the end of that temperature interval the higher values of
are produced at
(see
Figure 26a). With the growth of the value of
from 0 to 0.1, the biggest values of
(
) [
61] are produced by the molecules with the lower values of the alkyl tail length
, and 0.8. These calculations, based on the alkyl tail length
’s effect on
(
), and displayed in
Figure 24,
Figure 25 and
Figure 26, showed that the parameter
has a strong effect on the rotational diffusion process in the smectic film deposited on the solid surface and subjected to the strong electric field. In all the cases described above, the value of the moment of inertia of the molecule with a change in
, did not change [
61]. Calculations of the coefficient
in the bulk of the LC phase composed of 8CB molecules, at
, with
and
, gives
, which is in a good agreement with experimental
H NMR
[
62] values. Please note that the function
has been obtained by solving the system of nonlinear Equations (
3) and (
4), for two bulk OPs
and
with the effective anisotropic potential
.” [
61].
Taking into account that from an order-of-magnitude point of view, there is a good agreement between theoretical predictions and experimental results for RSD coefficient in the bulk of the LC phase, this mean-field model lends credibility to the theoretical interpretation of the motional data and to the validity of that theoretical approach.
We conclude
Section 2 by pointing out that the combination of the mean-field models with the experimental techniques provides a powerful tool for exploring and understanding the mechanisms which clarify the relevant underlying physical interactions.


