Abstract
Solid solutions of PbZr1−xTixO3 (PZT) are one of the most widely used piezoelectric materials with perovskite structure. Despite the decades of research, the phase diagram of PZT reported in 1971 has not been resolved yet. Recently, it turned out that single crystals of good quality of these solid solutions can be grown. By means of top-seeded solution growth (TSSG) technique, we succeeded to grow a single PbZr0.87Ti0.13O3 crystal. Hence, a partial verification of the diagram could be performed through investigations of the optical, dielectric, pyroelectric and elastic properties of this crystal, in a wide temperature range. The obtained results confirmed that the PbZr0.87Ti0.13O3 crystal undergoes a sequence of phase transitions, such as those observed in ceramics of similar chemical composition. However, additional anomalies of investigated physical properties were observed and discussed. Moreover, the influence of electric field on optical properties has been investigated for the first time and has proven the existence of local polar character of the phase above TC in a limited temperature range.
1. Introduction
After more than six decades, solid solutions of PbZr1−xTixO3 (PZT) still continue to be intensively studied piezoelectric materials and are among the most interesting compounds from the application perspective. Recently, ferromagnetic properties were also found in a PZT crystal [1], which means that these materials can be classified as multiferroics and may find even wider application. For a long time, the PZT phase diagram developed by Jaffe et al. [2] has been accepted as the basic characterization of the PZT solid solution. However, many reports [3,4,5,6,7,8,9] show that the Jaffe’s diagram needs verification. One of the reasons for it is that it was developed on the basis of ceramics only, because PZT crystals growth process has been developed only recently. As early as 40 years ago, Whatmore et al. [10] found that the diagram for ceramics differs from that for crystals. Only a few reports described the properties of PZT single crystals [1,9,10,11,12,13,14,15,16], mainly due to above mentioned technological difficulties related to their growth. Our high quality single PbZr0.87Ti0.13O3 crystal enabled investigations of phase transformations, domain structure, optical, dielectric, pyroelectric and elastic properties. One of the most important experimental results for this crystal is the proof for the existence of local polarity above Tc.
According to report [2], the PZT demonstrates a complex temperature-composition phase diagram, including the so-called morphotropic phase boundary (MPB) in the range of Ti content of x = 0.4 < x < 0.6. In this region, the values of piezoelectric coefficients reach maximum values e.g., [17]. In the PZT phase diagram, the Zr-rich rhombohedral (R) region consists of two ferroelectric phases: R3c (FE1) and R3m (FE2). At lower temperatures, the R3m space group is characterized by a crystalline structure with cation shifts along the pseudocubic direction [111], and with oxygen octahedral tilts of the a-a-a- type [18]. At higher temperatures, the loss of the octahedral tilts causes the space group to become R3m [19]. Recent structural studies of the PZT crystal with Ti content of x = 0.13 have shown that in 300 K the monoclinic phase Cm fits the structure better than the rhombohedral (R) one [9]. This is in line with the diagram proposed by Zhang et al. (see figure 7 in [4]) for ceramics. In that report, it was ascertained that long-range average rhombohedral and both long- and short-range monoclinic regions coexist in all PZT compositions. Such significant changes in the PZT phase diagram prompted us to re-analyze the dielectric properties and phase transformations in a single PbZr0.87Ti0.13O3 crystal.
The appearance of polar clusters in the paraelectric phase has already been observed in PZT ceramics [20,21] and even in the well-known ferroelectrics, such as BaTiO3 (BT) crystal [22,23,24]. The existence of pertinent piezoelectric response far above TC, accompanied by strong changes in the elastic properties, was attributed to the existence of, and interaction between, polar regions in paraelectric phase. Burns and Dacol [25] reported that the role of precursor in the paraelectric phase of BT is performed by randomly-oriented polar regions with local symmetry-breaking, while the macroscopic cubic phase is preserved. The substantial elastic anisotropy observed in the paraelectric phase of BT was attributed to temperature evolution of sizes of precursor polar clusters formed by correlated Ti motions [24,25]. Theoretical calculations reported in [26] have shown that these polar precursors, correlated with the interrelated softening of optic and acoustic modes, may appear even 80K above the phase transition temperature. From the measurements of birefringence, for the first time conducted under the action of d.c. electric field, we have proved the polar character of precursor in the paraelectric phase, in the single PbZr0.87Ti0.13O3 crystal investigated. Moreover, we have shown that the existence of local polarity above TC is consistent with the theoretically predicted temperature range.
2. Materials and Methods
Powder diffraction measurements executed on crushed transparent single PbZr0.87Ti0.13O3 crystal grown by top-seeded solution growth (TSSG) technique had been performed at room temperature [9]. The concentrations of elements were examined by SEM technique, using JSM-5410 electron microscope by Jeol with energy dispersion x-ray spectrometer EDS by Oxford Instruments. It was verified that the distribution of all elements was homogenous within the accuracy of the method used. The PZT single crystal was cut perpendicular to [001] pseudo-cubic perovskite axis and polished to the thickness of 0.3 mm.
A single PbZr0.87Ti0.13O3 crystal was electroded with silver paste and rejuvenated at 600 K for half an hour. The Agilent 4192A Impedance Analyzer that was used registered the capacity C and the conductance G for selected frequencies on heating and cooling, with the rate of 1K/min. The real ε’, and imaginary ε’’ part of the permittivity were calculated from the following formulas: ε’ = C/C0; ε’’ = G/(2πf C0) with C0 = (ε0S)/d, where S is the electrode surface, d is sample thickness (0.3 mm) and f stands for frequency. In dielectric measurements, the intensity of electric field was of the order of 0.01 kV/cm. Additionally, the real ε’ part of permittivity for crystal poled in d.c. electric field was determined on heating. The sample was poled at d.c. electric field having the strength of 7 kV/cm, applied for 20 min at 350 K and subsequently cooled in this field to 300 K, at which temperature the field was switched off. Then, the crystal was heated, applying the rate of 1K/min, to 670 K.
The pyroelectric current of the sample was registered by means of Keithley 6514 System Electrometer on heating and cooling, with the constant rate of 3 K/min. The measurements were performed in the temperature range from 300 K to 600 K, which covered the points of phase transitions. The pyroelectric current was also measured on heating of polarized single PbZr0.87Ti0.13O3 crystal. Prior to measurement, the sample was poled in d.c. external electric field having the strength of 7 kV/cm, applied for 20 min in 350 K and subsequently cooled in this field to 300 K, at which temperature the field was switched off. Then the sample was heated applying the rate of 3 K/min, to 600 K, with pyroelectric current registered.
The elastic properties, as a function of temperature, were determined through the measurement of piezoelectric resonance. Prior to the experiments, the sample in the shape of a bar 2 mm × 0.6 mm × 0.3 mm (thickness), fulfilling the conditions for determination of d31 piezoelectric coefficient, was poled in d.c. electric field. The poling conditions were the same as in dielectric and pyroelectric measurements. For certain temperatures, the complex admittance Y = ?Y?eiθ as a function of frequency f was measured by means of Agilent 4192A Impedance Analyzer. The model of forced harmonic oscillator [27] was applied to find piezoelectric resonance frequency fo and damping coefficient γ. These data permitted to calculate the real s11’ and imaginary s11’’ part of complex elastic coefficients s11:
where l is the length of sample (2 mm) and ρ the density of crystal (7990 kg/m3).
The measurements of birefringence were performed by means of Oxford Cryosystems Metripol Birefringence Imaging System (Metripol). The details of the technique have been described elsewhere [28]. The sample was heated in a high-precision Linkam TMSG600 temperature stage, and the temperature ramps were performed at the rates of 0.2 K min−1.
The technique used for birefringence measurement allowed us to determine the values of ∆n in two ways. In the first way, for temperature range below TC, we measured the change in the optical retardation Γ = Δn*d, where d is the crystal thickness of 0.3 mm, thus allowing the variation of Γ with temperature to be determined, for temperatures at which the maxima occurring for the periodic output signal, obtained from the rotating-analyzer apparatus, provided Γ=0.25 × (2N + 1)λ, where N is an integer. Secondly, for temperatures above TC, in which birefringence is very small, it is based on the measurement of the phase difference δ = (2πd × Δn)/λ between the polarized light components for the same crystal, where λ is the wavelength of the light. Linkam THMS600E temperature microscope stage allowed also to observe changes in the domain structure and perform birefringence measurements in the external electric field. The birefringence measurements of a transparent single PbZr0.87Ti0.13O3 crystal were carried out in a wide temperature range, from 300 K to 673 K. Before starting each experiment the crystal was heated to 673 K and left for several minutes, in order to release any strain. Each run was carried out with a constant temperature rate, and the images of birefringence were taken at constant time intervals. The temperature runs were performed at the rates of 1 K/min. The direction of the electric field applied, having the intensity of 7 kV/cm was parallel to [001] direction. The crystal was placed in glass plate capacitor coated with transparent electrodes.
3. Results and Discussion
The dielectric properties of the investigated crystal are collected and presented in Figure 1. The temperature dependence of the real part of the permittivity ε’(T) for five arbitrarily chosen frequencies is shown in Figure 1a. The maximum of ε’ associated with phase transition from ferroelectric (FE) to paraelectric (PE) phase was observed at about 540 K, showing no thermal hysteresis between the maximum of ε’(T) on heating and cooling (Figure 1b). However, transition between two ferroelectric phases (inset in Figure 1b) is of diffused character and with significant thermal hysteresis. It should be noted that not every experimental technique is sensitive enough to register it. Earlier studies have shown that this transition is difficult to be registered in PZT ceramics (e.g., [29]). It is worth mentioning that there is clear dispersion in permittivity values around Tc, while temperature points are independent on the measuring field frequency. This is connected mainly with domains and domain wall movements in the electric field. The transition from FE to PE phase is accompanied by the maximum of the imaginary ε’’ part of the complex permittivity (Figure 1c). It appeared that the most interesting results, presented in Figure 1d, are connected with temperature dependence of the inverse of the real part of the complex permittivity at 500 kHz. We have found that the Curie–Weiss law ε’-1 ~(T-T0), where T0 is the Curie–Weiss temperature, is obeyed above 600 K only. Moreover, the best fit to this law, shown in Figure 1d, was obtained for T0 = 555 K, which is higher than TC. This unusual relation of T0 > TC will be discussed further in the text, although it can be said immediately that the phase above TC is certainly not of pure paraelectric character. However, it is interesting that in the vicinity of T0 the permittivity dispersion vanishes (Figure 1a).
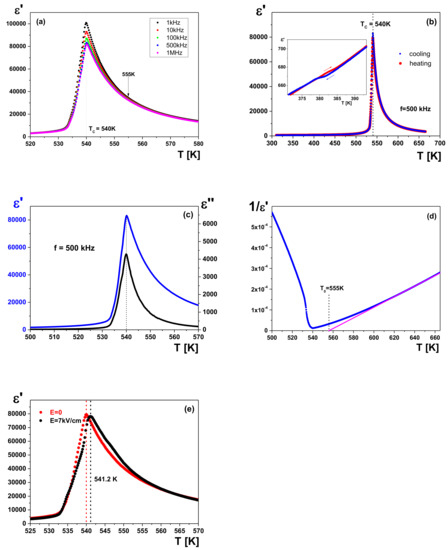
Figure 1.
Dielectric characteristics: (a) the temperature dependence of the real part of the complex permittivity ε’ of a single PbZ0.87Ti0.13O3 crystal at the different probe frequencies; (b) anomalies on ε’(T) runs on heating (in red) and cooling (in blue) connected with transitions between the ferroelectric and paraelectric phase at TC, and between two ferroelectric phases FE1 and FE2 (inset); (c) real ε’ (blue) and imaginary ε’’ (black) part of complex permittivity, corresponding to transition from centrosymmetric to non-centrosymmetric phase; (d) the inverse of the real part of the complex permittivity measured at 500 kHz. The high-temperature data with a fit to the Curie–Weiss law; (e) The influence of d.c. poling electric field on ε’(T) run on heating, measured at 500 kHz.
The ε’(T) measured after poling in the electric field having the strength of 7 kV/cm revealed a shift of TC of the order of 1 K, which most probably is the result of the influence of pyroelectric effect on permittivity while approaching the transition point (Figure 1e), rather than a change of symmetry under electric field action, as observed for PZTs from morphotropic phase boundary [30].
Another proof for polar phase transition occurrence is the observation of pyroelectric phenomena associated with flowing current due to changes of temperature only. In the case of ferroelectric materials, the total pyroelectric current consists of two parts. The first one is connected with temperature changes of spontaneous polarization (PS), while the second one is produced due to mutual interactions between the thermal expansion, elastic and piezoelectric properties. The faster the changes of temperature and PS, the higher the changes of total pyroelectric current. PS quickly disappears while approaching transition point, therefore the pyroelectric current is of the highest intensity. Such changes of the pyroelectric current that are associated with transition in TC point and between two ferroelectric phases in virgin PbZr0.87Ti0.13O3 crystal are presented in Figure 2. Changes in the sign of current registered, when passing transition point on heating and then on cooling, are the direct proof that the current is induced due to the pyroelectric phenomenon. The observed anomalies correspond to changes of complex permittivity in the same temperature ranges (Figure 1). For virgin sample, the pyroelectric current is an effect of partially ordered domain structure that may take place due to pinning of domains on lattice defects or internal stresses. Local current peaks (jumps) seen in Ipyro (T) run below TC (Figure 2) represent Barkhausen pulses connected with domain appearance or disappearance, depending on the direction of temperature changes.
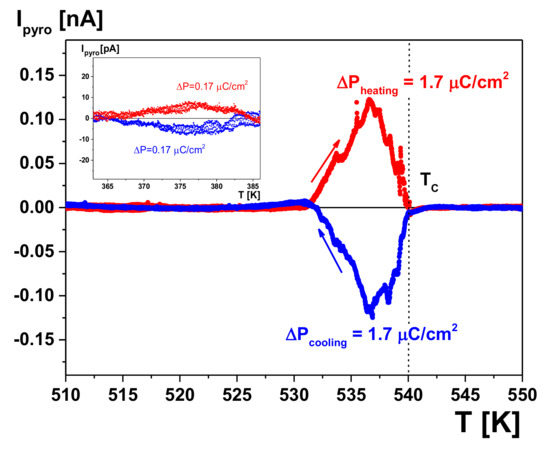
Figure 2.
Temperature dependence of the pyroelectric current Ipyro on heating (in red) and cooling (in blue) for virgin PbZ0.87Ti0.13O3 crystal with the rate of 3 K/min, appearing against a background originating from thermally stimulated currents. Changes of polarization at Tc and at transition between ferroelectric phases (see inset) have been estimated as 0.17 and 1.7µC/cm2, respectively. The most important fact is that there is no thermal hysteresis for transition point at TC.
To determine the temperature-dependent changes of polarization, the investigated crystal had to be poled in d.c. electric field. The pyroelectric currents are shown in Figure 3 as a function of temperature for such polarized crystal. As was expected, the changes on Ipyro near transitions at 380 K and 540 K are much stronger than for virgin crystal, and correspond to changes of polarization of the of order of 2.6 and 13 µC/cm2, respectively. However, these values are smaller than PS observed earlier in standard Tower-Sawyer system [11]. It means that poling of PZT crystals in d.c. electric field is not an easy process. One of the reasons is dielectric breakdown, which already appears for fields stronger than 7 kV/cm at the temperature of 350 K. In both transitions irregular runs of the pyroelectric current, like the two clear peaks recorded near the TC, testify for creep movements of domains close to the transition point.
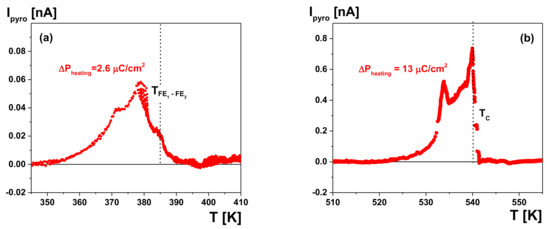
Figure 3.
Changes of pyroelectric current Ipyro on heating for polarized PbZr1−xTixO3 (PZT) single crystal near phase transition: (a) between two ferroelectric phases; (b) around TC. The runs were obtained after subtraction of background coming from thermally stimulated currents. It has to be remembered that the Ipyro is the total pyroelectric current which originates from the primary and secondary pyroelectric effect, and is not related to changes of spontaneous polarization only, i.e., only to primary pyroelectric effect.
Changes in elastic properties taking place with temperature were determined for the crystal poled in strong electric field and are presented in Figure 4. The imaginary part of the elastic compliance s11’’ has anomalies at about 390 K and 448 K. Starting from 520 K, the s11’’ value fluctuates and reaches its maximum value around 555 K. Similarly, the real part of the elastic compliance s11’ reveals abnormal behavior at 390 K, 448 K and 554 K. What is interesting is that both coefficients, determined based on piezoelectric resonances, vanished at the temperature that well corresponds to the T0 obtained from linear fit of high temperature run of reciprocal permittivity (Figure 1d). Except for transition between two ferroelectric phases, other local anomalies have been observed at different temperatures (Figure 3 and Figure 4). The reason is that the pyroelectric current and elastic compliance were measured with different heating rates. It should be noted that the temperature of 448 K is related to a transition associated with lattice instability, reported by Cordero et al. and Lazar et al. [7,8,9].
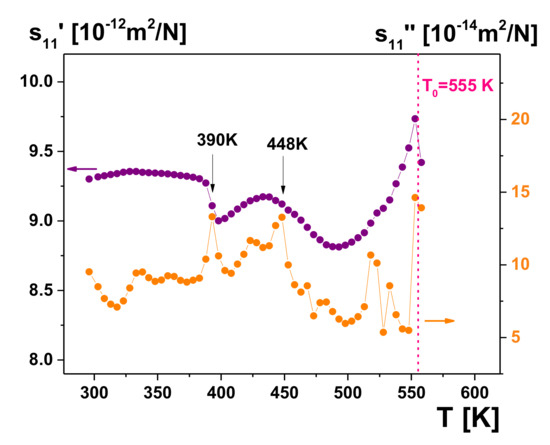
Figure 4.
The dependence on temperature of the real s11’ (purple) and imaginary s11’’ (orange) part of the elastic compliances s11 for PZT single crystal, determined from recorded piezoelectric resonances at frequencies of the order of hundreds kHz.
It has already been proven that PZT single crystals have complex domain structures over a wide temperature range [11]. In spite of that, the method we used for birefringence measurement permitted to determine the birefringence ∆n for a region of 25 × 30 μm2 inside a domain. The results presented in Figure 5 confirmed that at least two phase transitions occur in investigated single PbZ0.87Ti0.13O3 crystal. The transition between two ferroelectric phases has been identified as a kink on the ∆n(T) dependence, while at TC point the birefringence disappeared almost completely. In those studies, we did not observe an anomaly connected with additional phase transition appearing due to suggested distinct lattice instability between 377 K and 540 K. Since in studies concerning elastic properties this transition was clearly observed, and these properties were encountered for crystal poled in d.c, field, the birefringence measurements were conducted in d.c. electric field.
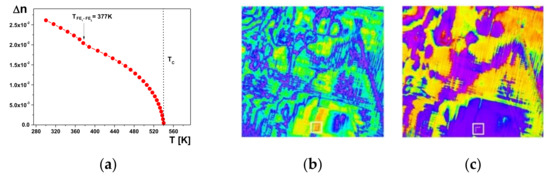
Figure 5.
(a) Temperature changes of ∆n (T) in the single PbZ0.87Ti0.13O3 crystal. The values of ∆n were calculated for a region of 25 μm × 30 μm which is shown inside the white square in (b) and (c); (b) maps of birefringence at 540 K are also a proof of complex domain structure of the investigated crystal. Different colors correspond to different domains with different orientations of optical indicatrix; (c) optical indicatrix orientations at 540 K. This region has been chosen in order to be within the domain of defined orientation of optic indicatrix.
Figure 6 shows the influence of this field on ∆n(T) function for a single PbZ0.87Ti0.13O3 crystal. The calculations of birefringence were carried out for a region inside the domain, having the surface area of 25 × 30 μm2. The electric field slightly reduced the ∆n value, but shifted the temperature at which birefringence disappears towards higher values. In a crystal subjected to d.c. field having the strength of 7 kV/cm, the birefringence disappeared at 548 K, i.e., distinctly higher than TC, as expected for ferroelectric transition. It should be remembered that the strongest changes of elastic coefficients s11’ and s11’’ were also observed near T0 (Figure 4).
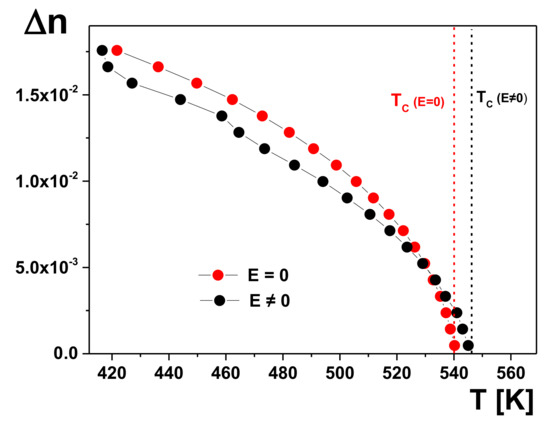
Figure 6.
The influence of electric field on birefringence of PZT single crystal subjected to the field having the strength of 7 kV/cm. Calculations of ∆n were carried out for a single-domain region measuring 25μm × 30μm.
As in other perovskites [22,23,24], birefringence was observed far above TC = 540 K. Figure 7a shows an example of ∆n(T) run above TC and the influence of electric field on this dependence. As in the case of dielectric and elastic measurements, the temperature of 555 K has been distinguished with clear anomaly in the ∆n(T). Birefringence finally disappears near 600 K. While birefringence was measured under action of d.c. electric field applied inside ferroelectric field, the point of TC and anomaly near T0 were shifted towards higher temperatures (Figure 7b). Additionally, the anomaly near T0 became more diffuse, with a small thermal hysteresis. However, the electric field almost did not shift the temperature at which ∆n disappeared. According to the theory reported in [26], below the temperature T=1.1*TC, i.e., starting inside the paraelectric phase, polar regions with the size of some 10–15 lattice units appear. In the investigated crystal, this temperature is equal to T = 1.1 × 540 K = 594 K. The fact that in d.c. electric field the anomaly near T0 becomes diffused and moves to higher temperatures proves the existence of polar regions above T C in a wide temperature range. To the best of our knowledge, this is the first proof of local polarity existence in PZT single crystal. At the same time, we exclude the induction of local polarity due to change in symmetry while d.c. is acting. On the other hand, it is known that ∆n ~q2, where q is an order parameter [31]. In the investigated crystal, the P S is the order parameter, therefore, the presence of birefringence above TC indicates once again that the phase is polar. It is worth mentioning that polar nano-regions in a macroscopically centrosymmetric lattice appear well above TC in other oxide perovskites, such as BaTiO3, SrTiO3, PbTiO3 or PbZrO3:Nb (e.g., [22,23,24,26,32]).
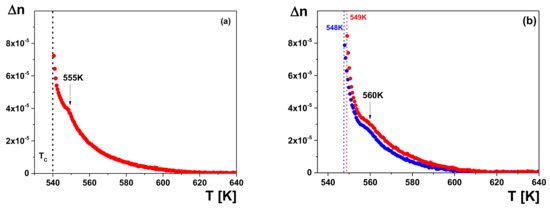
Figure 7.
The temperature dependence of birefringence above TC. ∆n was calculated for a region of 25 μm × 30 μm for processes of heating (red) and cooling (blue). (a) In non-polarized single PbZ0.87Ti0.13O3 crystal; (b) under electric field having the strength of E = 7 kV/cm.
4. Conclusions
PbZr0.87Ti0.13O3 single crystal undergoes transition of diffused character between two ferroelectric phases around 380 K, and transition at TC= 540 K. The fact that there is no thermal hysteresis of transition at TC allows to state that this phase transition is of continuous character. Only the temperature dependence of elastic properties confirms the presence of a transition associated with lattice instability around 448 K. The measurements of dielectric, pyroelectric, elastic and optical properties of virgin crystal proved that an anomaly of these properties near 555 K is sensitive to the action of d.c. electric field. It is the direct proof that there are polar regions in the investigated crystal, and those regions can exist far above TC. The polar regions vanish, and the crystal becomes isotropic, only above around 600 K.
Author Contributions
Investigation, I.L., A.M., A.S. and K.R.; conceptualization, I.L. and K.R.; formal analysis, I.L. and K.R.; writing—original draft preparation, I.L. and K.R. All authors have read and agreed to the published version of the manuscript
Funding
This research was funded by the National Science Centre, Poland, grant number 2016/21/B/ST3/02242.
Acknowledgments
The authors thank Janusz Koperski from the University of Silesia for technical assistance during EDS measurements.
Conflicts of Interest
The authors declare no conflict of interest.
References
- Lazar, I.; Oboz, M.; Kubacki, J.; Majchrowski, A.; Piecha, J.; Kajewski, D.; Roleder, K. Weak ferromagnetic response in PbZr1−xTixO3 single crystals. J. Mater. Chem. C 2019, 7, 11085–11089. [Google Scholar] [CrossRef]
- Jaffe, B.; Cook, W.R.; Jaffe, H. Piezoelectric Ceramics; Academic Press: London, UK, 1971. [Google Scholar]
- Noheda, B.; Cox, D.E.; Shirane, G.; Gonzalo, J.A.; Cross, L.E.; Park, S.-E. A monoclinic ferroelectric phase in the Pb(Zr1−xTix)O3 solid solution. Appl. Phys. Lett. 1999, 74, 2059–2061. [Google Scholar] [CrossRef]
- Zhang, N.; Yokota, H.; Glazer, A.M.; Ren, Z.; Keen, D.A.; Keeble, D.S.; Thomas, P.A.; Ye, Z.-G. The missing boundary in the phase diagram of PbZr1−xTixO3. Nat. Commun. 2014, 5, 5231. [Google Scholar] [CrossRef] [PubMed]
- Zhang, N.; Yokota, H.; Glazer, A.M.; Keen, D.A.; Gorfman, S.; Thomas, P.A.; Rena, W.; Ye, Z.-G. Local-scale structures across the morphotropic phase boundary in PbZr1-xTixO3. IUCrJ 2018, 5, 73–81. [Google Scholar] [CrossRef]
- Li, M.J.; Xu, L.P.; Shi, K.; Zhang, J.Z.; Chen, X.F.; Hu, Z.G.; Dong, X.L.; Chu, J.H. Interband electronic transitions and phase diagram of PbZr1−xTixO3 (0.05 ≤ x ≤ 0.70) ceramics: Ellipsometric experiment and first-principles theory. J. Phys. D Appl. Phys. 2016, 49, 275305. [Google Scholar] [CrossRef]
- Cordero, F.; Trequattrini, F.; Craciun, F.; Galassi, C. Octahedral tilting, monoclinic phase and the phase diagram of PZT. J. Phys. Condens. Matter 2011, 23, 415901. [Google Scholar] [CrossRef]
- Cordero, F.; Trequattrini, F.; Craciun, F.; Galassi, C. Merging of the polar and tilt instability lines near the respective morphotropic phase boundaries of PbZr1−xTixO3. Phys. Rev. B 2013, 87, 094108. [Google Scholar] [CrossRef]
- Lazar, I.; Oh, S.H.; Ko, J.-H.; Zajdel, P.; Kajewski, D.; Majchrowski, A.; Piecha, J.; Koperski, J.; Soszyński, A.; Roleder, K. Additional phase transition in a PbZr0.87Ti0.13O3 single crystal. J. Phys. D Appl. Phys. 2019, 52, 115302. [Google Scholar] [CrossRef]
- Whatmore, R.W.; Clarke, R.; Glazer, A.M. Tricritical behaviour in PbZrxTi1−xO3 solid solutions. J. Phys. C Solid State Phys. 1978, 11, 3089–3102. [Google Scholar] [CrossRef]
- Lazar, I.; Kajewski, D.; Majchrowski, A.; Soszyński, A.; Koperski, J.; Roleder, K. A contribution to understanding the complex phase diagram of PZT compounds. Ferroelectrics 2016, 500, 67–75. [Google Scholar] [CrossRef]
- Frantti, J.; Fujioka, Y.; Puretzky, A.; Xie, Y.; Ye, Z.-G.; Glazer, A.M. A statistical model approximation for perovskite solid-solutions: A Raman study of lead-zirconate-titanate single crystal. J. Appl. Phys. 2013, 113, 174104. [Google Scholar] [CrossRef]
- Burkovsky, R.G.; Bronwald, Y.A.; Filimonov, A.V.; Rudskoy, A.I.; Chernyshov, D.; Bosak, A.; Hlinka, J.; Long, X.; Ye, Z.-G.; Vakhrushev, S.B. Structural Heterogeneity and Diffuse Scattering in Morphotropic Lead Zirconate-Titanate Single Crystals. Phys. Rev. Lett. 2012, 109, 097603. [Google Scholar] [CrossRef] [PubMed]
- Phelan, D.; Long, X.; Xie, Y.; Ye, Z.-G.; Glazer, A.M.; Yokota, H.; Thomas, P.A.; Gehring, P.M. Single Crystal Study of Competing Rhombohedral and Monoclinic Order in Lead Zirconate Titanate. Phys. Rev. Lett. 2010, 105, 207601. [Google Scholar] [CrossRef]
- Bokov, A.A.; Long, X.; Ye, Z.-G. Optically isotropic and monoclinic ferroelectric phases in Pb(ZrxTi1-x)O3 (PZT) single crystals near morphotropic phase boundary. Phys. Rev. B 2010, 81, 172103. [Google Scholar] [CrossRef]
- Gorfman, S.; Keeble, D.S.; Glazer, A.M.; Long, X.; Xie, Y.; Ye, Z.-G.; Collins, S.; Thomas, P.A. High-resolution x-ray diffraction study of single crystals of lead zirconate titanate. Phys. Rev. B 2011, 84, 020102. [Google Scholar] [CrossRef]
- Jaffe, B.; Roth, R.S.; Marzullo, S. Piezoelectric properties of lead zirconate- lead titanate solid-solution ceramics. J. Appl. Phys. 1954, 25, 809–810. [Google Scholar] [CrossRef]
- Glazer, A.M. The classification of octahedral tilts in perovskites. Acta Cryst. B 1972, 28, 3384–3392. [Google Scholar] [CrossRef]
- Michel, C.; Moreau, J.-M.; Achenbach, G.D.; Gerson, R.; James, W. Atomic structures of two rhombohedral ferroelectric phases in the Pb(Zr, Ti)O3 solid solution series. Solid State Commun. 1969, 7, 865–868. [Google Scholar] [CrossRef]
- Franke, I.; Roleder, K.; Klimontko, J.; Ratuszna, A.; Soszyński, A. Anomalous piezoelectric and elastic properties of a tetragonal PZT ceramic near morphotropic phase boundary. J. Phys. D Appl. Phys. 2005, 38, 749–753. [Google Scholar] [CrossRef]
- Lazar, I.; Adamczyk-Habrajska, M.; Pawełczyk, M.; Górny, M.; Zawada, A.; Roleder, K. Piezoelectric and elastic properties of relaxor-like PZT:Ba ceramics. J. Electroceramics 2018, 40, 203–210. [Google Scholar] [CrossRef]
- Ziębińska, A.; Rytz, D.; Szot, K.; Górny, M.; Roleder, K. Birefringence above Tc in single crystals of barium titanate. J. Phys. Condens. Matter 2008, 20, 142202. [Google Scholar] [CrossRef]
- Lee, J.W.; Ko, J.-H.; Roleder, K.; Rytz, D. Complete determination of elastic stiffness coefficients and local symmetry breaking in the paraelectric barium titanate. Appl. Phys. Lett. 2019, 114, 072901. [Google Scholar] [CrossRef]
- Oh, S.H.; Ko, J.-H.; Lee, H.-Y.; Lazar, I.; Roleder, K. Precursor Phenomena of Barium Titanate Single Crystals Grown Using a Solid-State Single Crystal Growth Method Studied with Inelastic Brillouin Light Scattering and Birefringence Measurements. Molecules 2018, 23, 3171. [Google Scholar] [CrossRef] [PubMed]
- Burns, G.; Dacol, F.H. Polarization in the cubic phase of BaTiO3. Solid State Commun. 1982, 42, 9–12. [Google Scholar] [CrossRef]
- Bussmann-Holder, A.; Beige, H.; Völkel, G. Precursor effects, broken local symmetry, and coexistence of order-disorder and displacive dynamics in perovskite ferroelectrics. Phys. Rev. B 2009, 79, 184111. [Google Scholar] [CrossRef]
- Roleder, K.; Franke, I.; Glazer, A.M.; Thomas, P.A.; Miga, S.; Suchannicz, J. The piezoelectric effect in Na0.5Bi0.5TiO3 ceramics. J. Phys. Condens. Matter 2002, 14, 5399–5406. [Google Scholar] [CrossRef]
- Geday, M.A.; Kreisel, J.; Glazer, A.M.; Roleder, K. Birefringence imaging of phase transitions: Application to Na0.5Bi0.5TiO3. J. Appl. Crystal. 2000, 33, 909–914. [Google Scholar] [CrossRef]
- Szeremeta, A.Z.; Lazar, I.; Molak, A.; Gruszka, I.; Koperski, J.; Soszyński, A.; Kajewski, D. Improved piezoelectric properties of Pb(Zr0.70Ti0.30)O3 ceramics doped with non-polar bismuth manganite. Ceram. Int. 2019, 45, 18363–18370. [Google Scholar] [CrossRef]
- Guo, R.; Cross, L.E.; Park, S.-E.; Noheda, B.; Cox, D.E.; Shirane, G. Origin of the High Piezoelectric Response in PbZr1−xTixO3. Phys. Rev. Lett. 2000, 84, 5423–5426. [Google Scholar] [CrossRef]
- Egert, G.; Jahn, I.R.; Renz, D. Birefringence and order parameter of ammonium bromide. Solid State Commun. 1971, 9, 775–778. [Google Scholar] [CrossRef]
- Kajewski, D.; Jankowska-Sumara, I.; Ko, J.-H.; Lee, J.W.; Sitko, R.; Majchrowski, A.; Bussmann-Holder, A.; Roleder, K. Influence of Nb5+ ions on phase transitions and polar disorder above TC in PbZrO3 studied by Raman spectroscopy. J. Am. Ceram. Soc. 2020. [Google Scholar] [CrossRef]


© 2020 by the authors. Licensee MDPI, Basel, Switzerland. This article is an open access article distributed under the terms and conditions of the Creative Commons Attribution (CC BY) license (http://creativecommons.org/licenses/by/4.0/).