Article

Optical Investigation of Eu3+ Doped Bi12GeO20 (BGO) Crystals

1
Institute of Microelectronics and Optoelectronics, Warsaw University of Technology, Koszykowa 75, 00-662 Warsaw, Poland
2
Institute of Inorganic Chemistry, Siberian Branch, Russian Academy of Sciences, Novosibirsk 630090, Russia
*
Author to whom correspondence should be addressed.
Crystals 2020, 10(4), 285; https://doi.org/10.3390/cryst10040285
Submission received: 21 March 2020 / Revised: 5 April 2020 / Accepted: 7 April 2020 / Published: 9 April 2020
(This article belongs to the Special Issue Rare Earths-Doped Materials)

Abstract

:
The spectroscopic properties of Eu3+ doped Bi12GeO20 (BGO) sillenite bulk crystals that were grown by the low-thermal-gradient Czochralski technique (LTG Cz) were investigated. The absorption spectra and the emission properties have been measured at room temperature (300 K) and at 10 K. Luminescence was observed both due to the direct Eu3+ ion excitation, as well as under UV excitation due to the energy transfer between Bi3+ and Eu3+ ions. Bi3+ → Eu3+ energy transfer mechanisms in Eu3+:BGO doped host were investigated. The Ωλ parameters, as well as radiative lifetimes, were calculated based upon the Judd-Ofelt formalism. The branching ratios and electric dipole transition probabilities were also determined, based upon the obtained experimental results. Luminescence has been observed from the 5D0,1,2 levels of Eu3+, with emissions from the 5D0 level being the strongest. The strongest observed luminescence band corresponds to the 5D07F0 transition at 578.7 nm. Reasons for the strong presence of the theoretically forbidden 5D07F0 emission were investigated.

1. Introduction

Bi12GeO20 (BGO) crystal finds application in many photonic devices and systems [1,2,3,4,5,6]. For example, it is commonly found in Pockels cells and sensors due to its high electro-optic coefficient (3.3 pm/V) [1,2]. It is also used in piezoelectric, Surface Acoustic Wave (SAW) devices [5]. The early works mainly focused on photorefractive and photoconductive effects in BGO and their applications within the visible light spectrum, such as early optical memory storage trials [6,7,8]. In recent years, metal-ion doping of BGO and other sillenites (mostly with 3d transition metal ions, such as Cr, Fe, Cu, Co, etc.) has been extensively studied as a means of further improving their efficiency as a holographic memory medium [9,10,11,12,13,14].
The pure Bi12GeO20 structure and properties have already been thoroughly investigated as early as in 1967 in its undoped form and many practical applications were proved [1,2,3,4,5,6,7,8]. BGO has a structure of the type of sillenite, which belongs to the space group I23 number 197 and possesses a cubic cell symmetry with lattice constant that is equal to 10.1455 Å and unit-cell volume of 1044.288244 Å3, whereas the Bi-O bond lengths vary between 2.07 and 3.17 Å, as reported in the literature [1].
Generally, luminescence occurs when excitation radiation is absorbed by the material and electron transitions from the ground state (1S0 in case of Bi3+ and 7F0 in case of Eu3+) to one of the higher lying states, such as, for example, 3P1 or 3P0 states for Bi3+ ion and 5D0, 5D1, 5D2, or 5D3 states in the case of the Eu3+ ion. Upon return to the ground state from the excited state, a photon is emitted, resulting in observable luminescence of a given material. In special cases, such as in the case of the Eu3+ and Bi3+ ions, positions of their respective energy levels are aligned, allowing for an efficient energy transfer between the ions, as has been illustrated on Figure 1.
The trivalent europium ion (Eu3+) ion is uniquely suited in its role as a spectroscopic probe for the investigation of properties of various dielectric matrixes. This is because the 5D0 and 7F0 energy levels of Eu3+ are non-degenerate, resulting in a single line for transition between these levels in the spectra (see the partial Eu3+ energy diagram in Figure 1). Additionally, because the 5D07F1 transition is of a magnetic dipole origin, its intensity is independent of the environment and, thus, can be applied as a reference to other transitions during emission spectrum analysis [15].
In this work, we have applied the Judd-Ofelt theory [15,16] to analyze and describe the BGO:Eu3+ crystal system photoluminescence and excited states dynamics, in order to further expand the knowledge regarding the Eu3+ interaction in a isotropic I23 class sillenite crystal system, and to evaluate its further potential uses, for example, as an active lasing medium candidate. The doubly reduced matrix elements U22,4,6 elements have non-zero value for only single parameter U2 for a given transition, which makes it possible to determine the intensity Ω2,4,6 parameters in a relatively straightforward manner just from emission spectra alone, which is not possible in the case of other lanthanide ions [15]. The Ω2,4,6 parameters allow for the determination of crucial factors, such as emission transition probabilities, which is important, for example, where considering a given material as a lasing medium candidate [15,16].

2. Materials and Methods

2.1. Crystal Growth

For crystal growth, the low-thermal-gradient Czochralski (LTG Cz) technique was used. The LTG Cz technique was developed at Nikolaev Institute of Inorganic Chemistry SB RAS (Novosibirsk, Russia) for growing large oxide crystals from melt. It is a modified Czochralski technique with axial and radial temperature gradients being sustained below 1 K/cm during the entire growth process, which is 1–2 orders of magnitude lower than in the conventional Czochralski technique. As a consequence, local overheating of the melt is eliminated, volatilization of melt components is suppressed, and the amount of thermoelastic stresses in the crystals is greatly lowered, which is extremely important for obtaining large single crystals of high optical quality. Using LTG Cz technique, numerous scintillating crystals of unique quality and size were obtained, such as Bi4Ge3O12, CdWO4, ZnMoO4, and Li2MoO4 [17].
Previously, undoped Bi12GeO20 and Bi12SiO20 crystals were grown by LTG Cz at Nikolaev Institute of Inorganic Chemistry SB RAS (Novosibirsk, Russia) during the investigation of temperature gradients influence on crystal morphology and quality. Low temperature gradients conditions and the resulting faceted crystallization front proved to be more suitable for growing Bi12GeO20 (BGO) single crystals [18].
In this work, three Eu3+ doped BGO single crystals (0.3 mol.%, 1 mol.%, and 3 mol.%) were obtained by the low-thermal-gradient Czochralski technique. Crystal growth experiments were carried out in platinum crucible covered with platinum lid with a pipe socket at air atmosphere. Seeding in first crystal growth process was conducted on platinum seed holder, and a polycrystal was grown, from which seeds for further experiments were cut out. The BGO single crystals were grown in [001] direction with growth rate 1 mm/h and rotation rate 20 rpm. Crystals showed a strong tendency to the rapid development of square cross-section and lateral faceting. The crystallization fronts of grown crystals were faceted by single (001) facet.
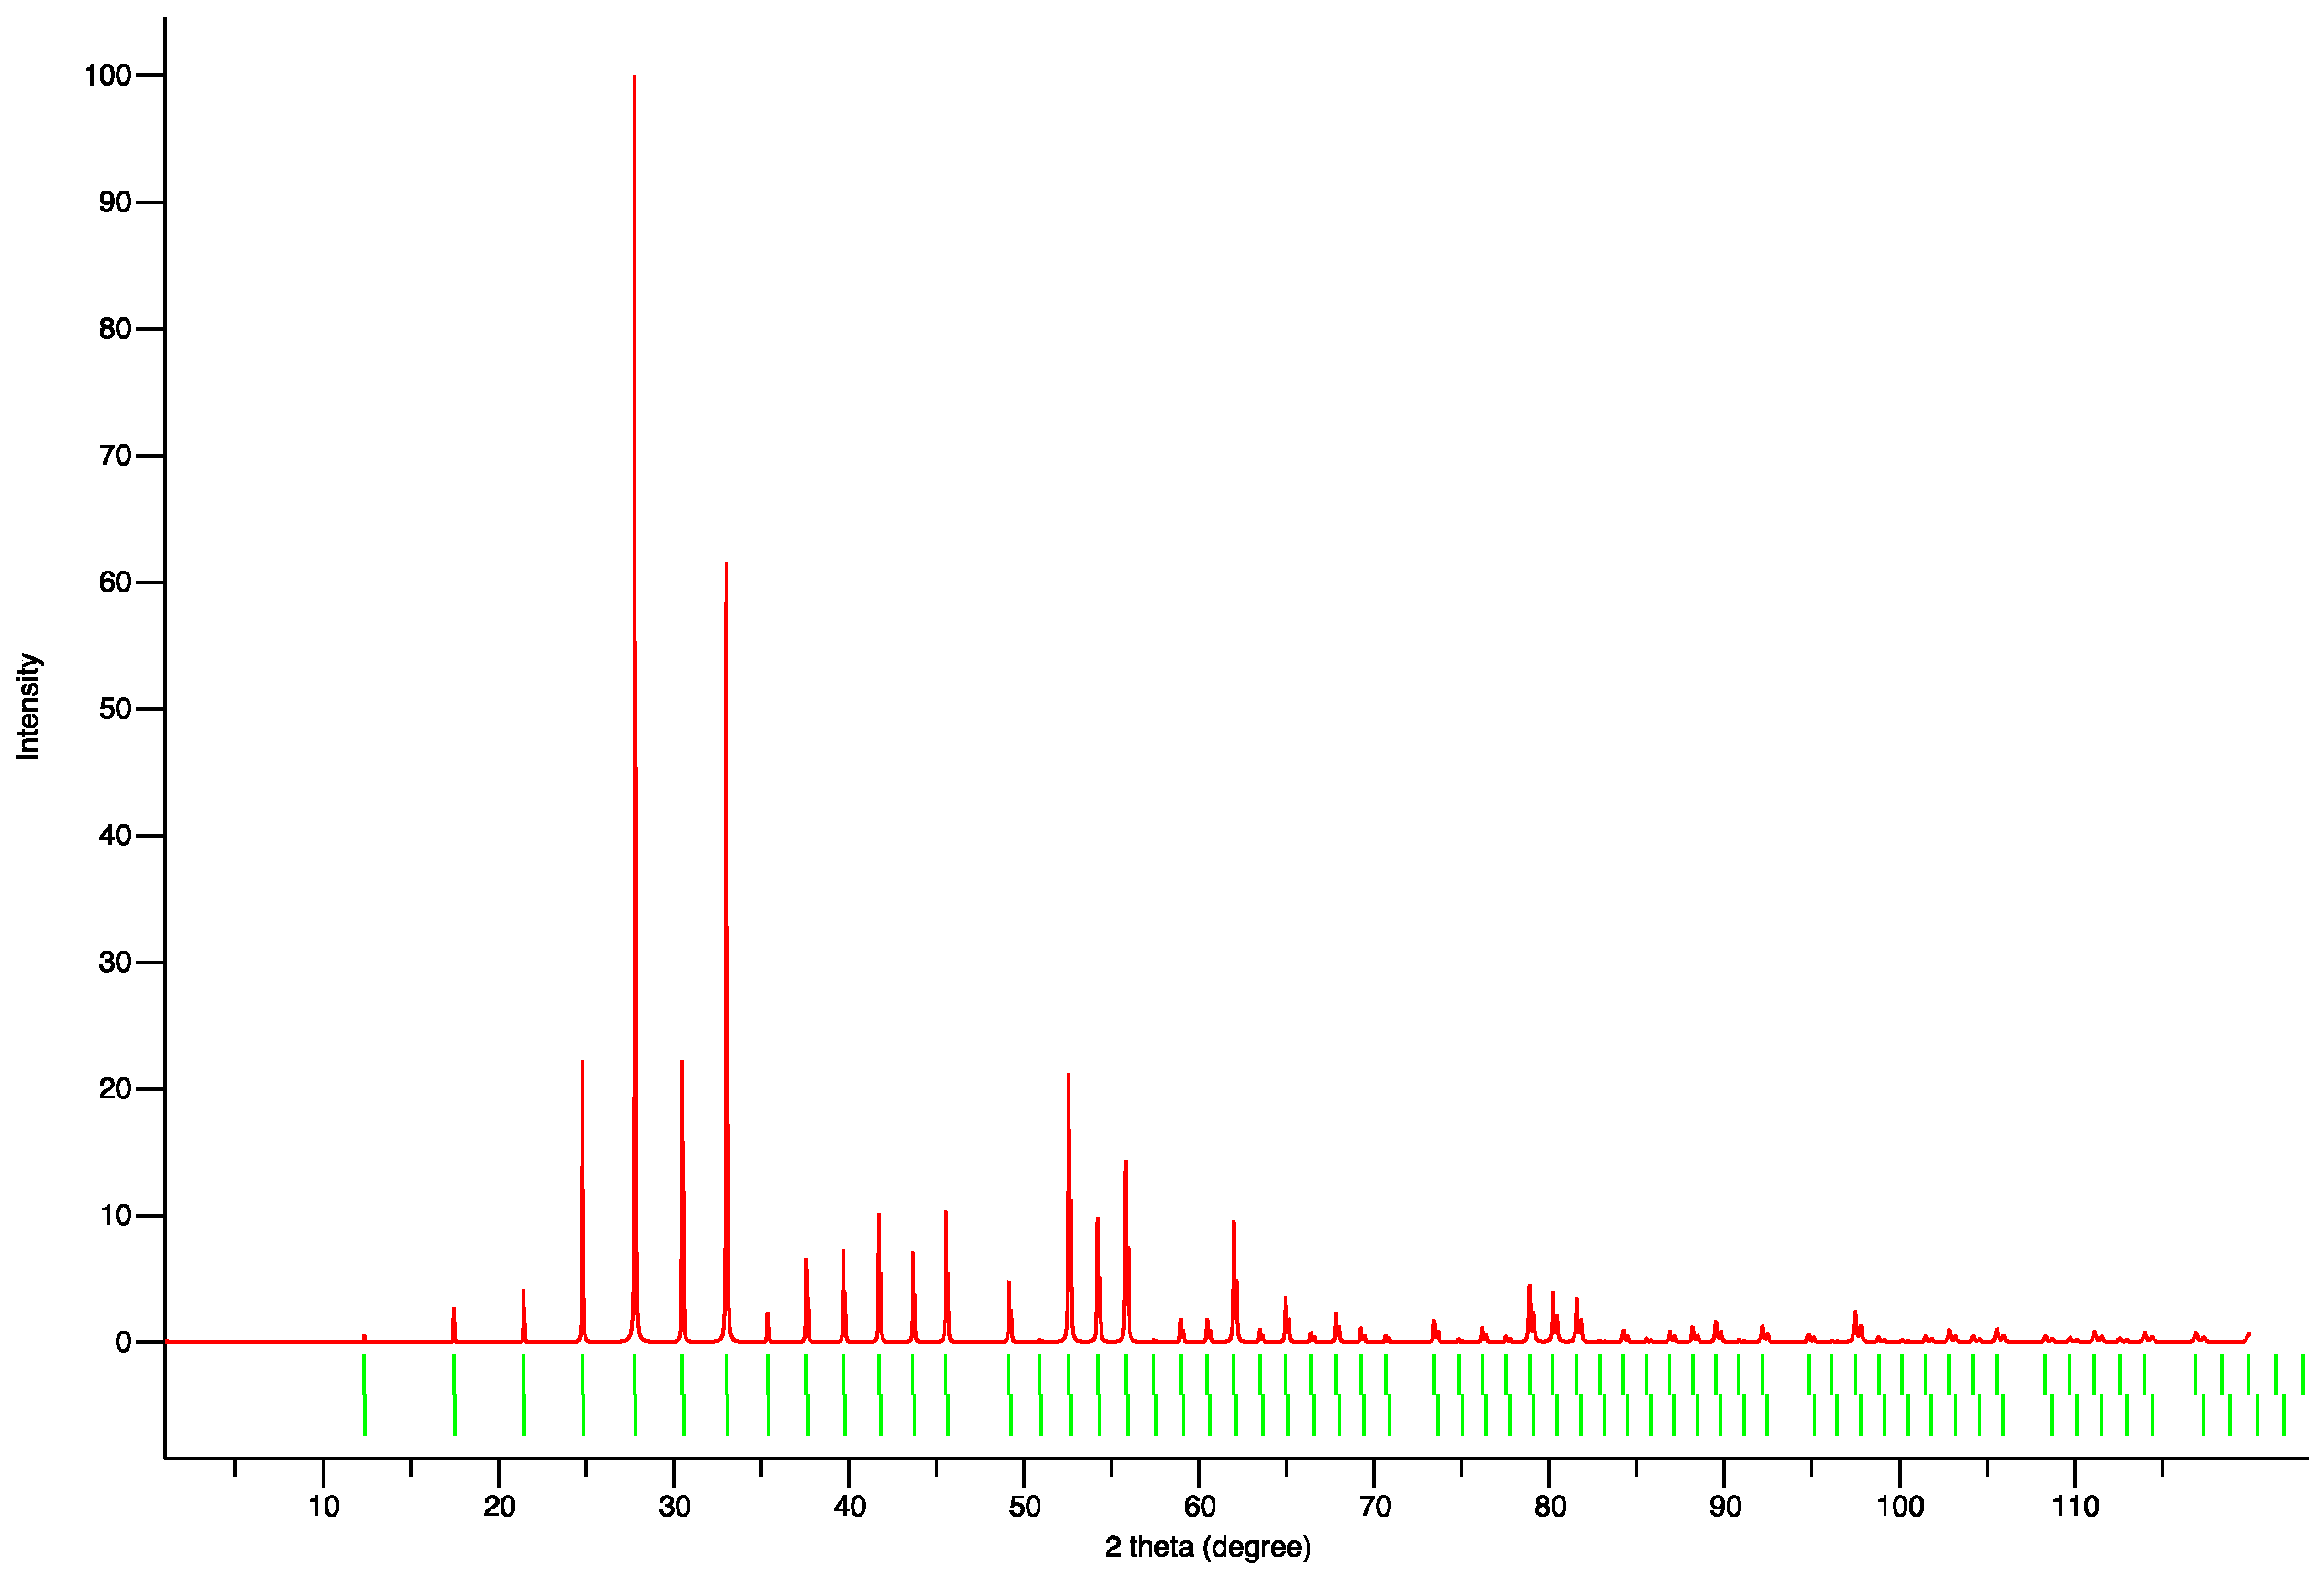
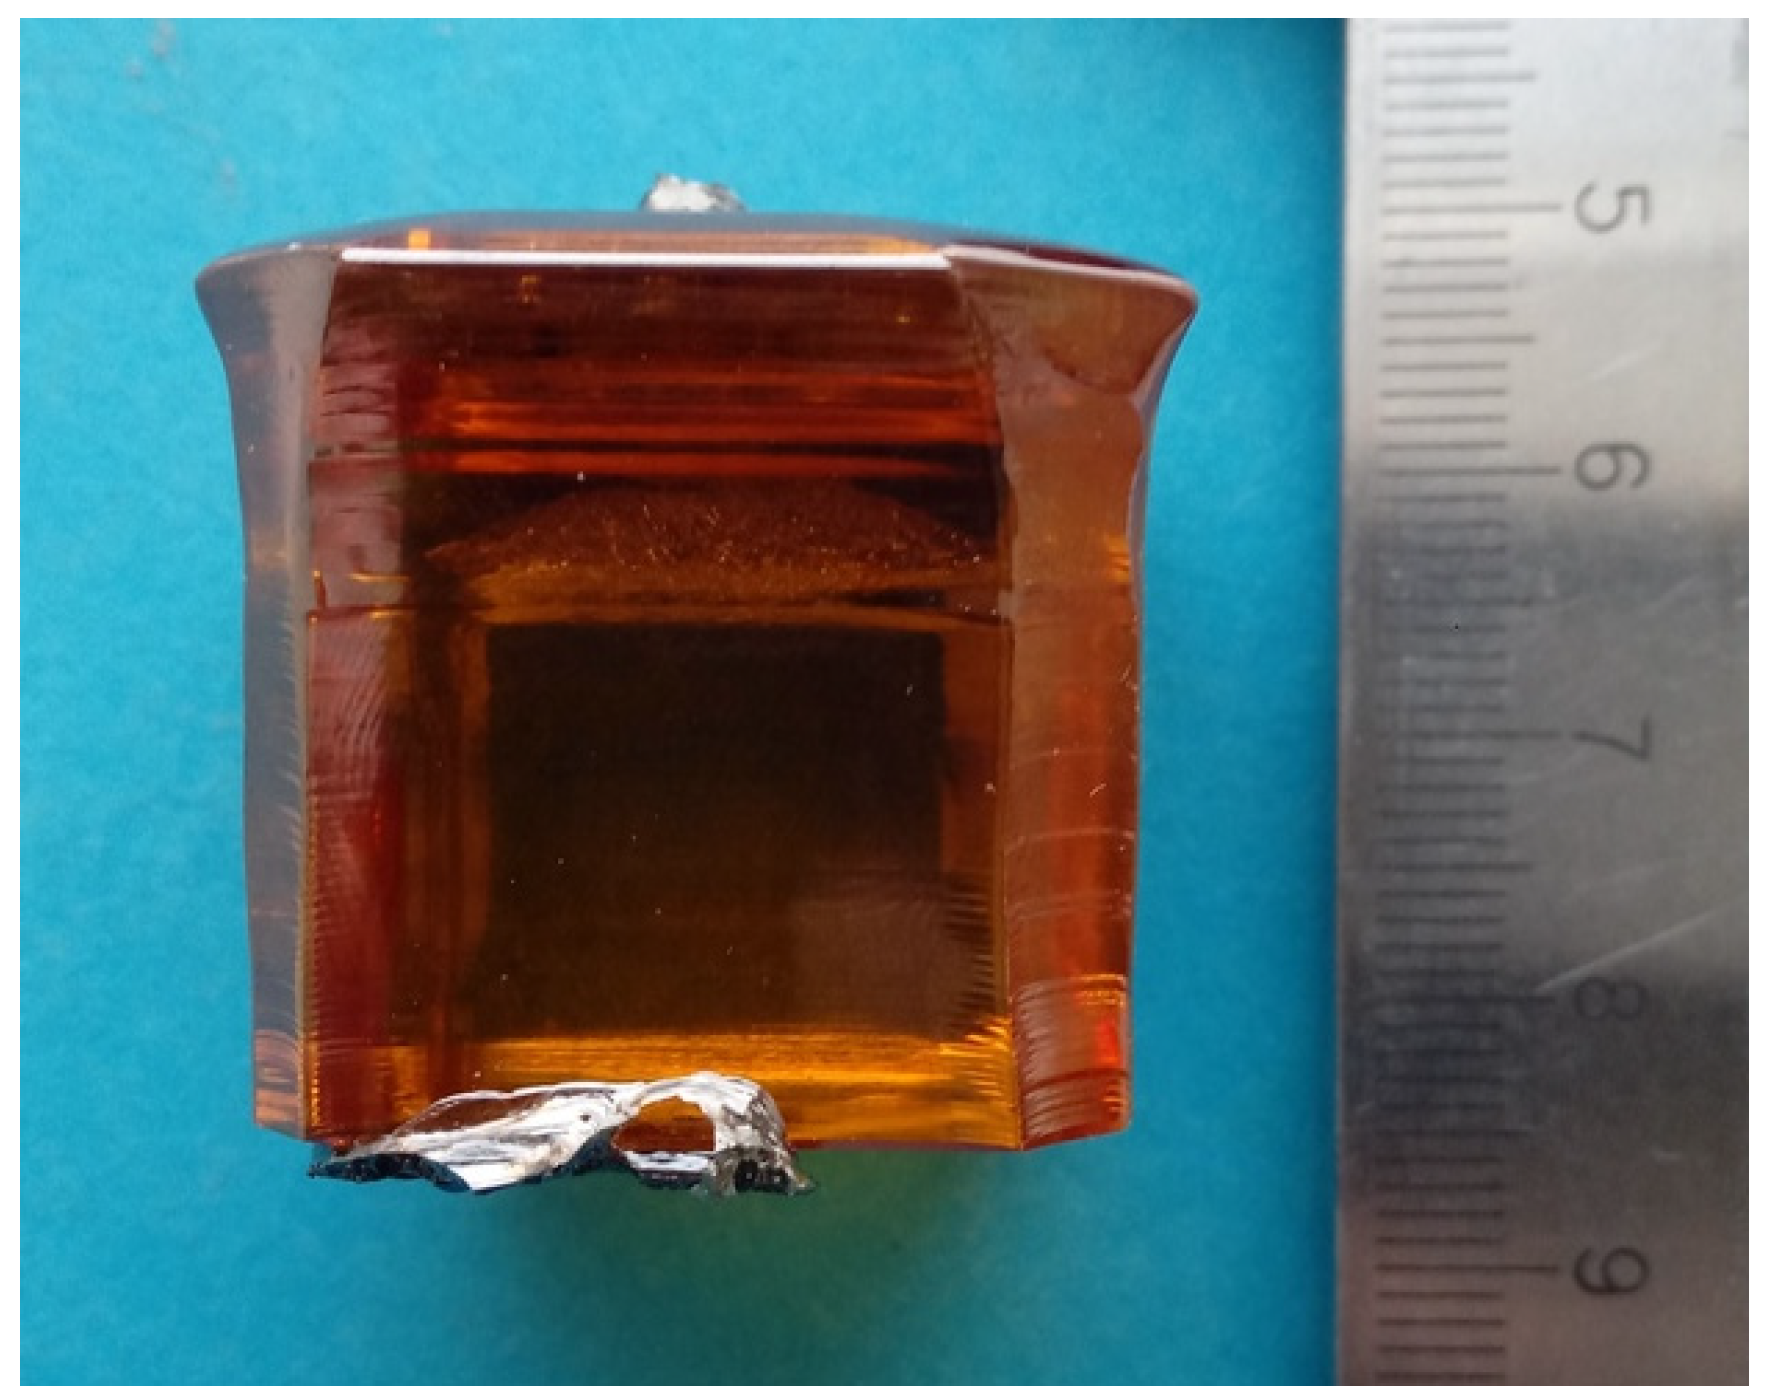
The doping concentration was 0.3, 1, and 3 mol.%. From grown crystals (as shown in Figure 2), samples for optical studies were cut out, perpendicularly to [001] axis, and then polished: 20 × 20 × 10 mm3 samples from 0.3 and 1 mol.% doped crystals and 10 × 10 × 5 mm3 samples from 3 mol.% doped crystal. In accordance with the Goldschmidt substitution rules, the Eu3+ ion (1.07 Å) substitutes the Bi3+ (0.96 Å) atom within the Eu:BGO crystal cell. The difference between the radii of Ge4+ (0.39 Å) and Eu3+ is too large to allow for potential Ge4+ substitution. The pure BGO cell structure is shown in Appendix A Figure A1 for reference. The XRD technique confirmed the structure of the Eu3+: BGO sample. All of the recorded diffraction peaks agree well with the standard card for the Bi12GeO20 and no additional peaks were observed, which suggested that the Bi12GeO20 crystals were successfully synthesized and the substitution of Eu3+ ions did not significantly change the crystal structure (as shown in Appendix A Figure A2).

2.2. Samples Characterization

The absorption spectrum was taken at room temperature using a Perkin–Elmer Lambda 950 spectrophotometer. Emission measurements were performed while using a Photon Technology International spectrophotometer. Emission spectra were also measured using a SP-2500i double set monochromator followed by a PMT and SR-400 photon counting system. The samples were excited by a pulsed (10 ns pulse-width, repetition rate 10 Hz) tunable optical parametric oscillator (Continuum) that was pumped by a frequency-tripled Nd: YAG pulse laser (Continuum Surelite II). The fluorescence dynamics profiles were recorded with a SR-430 multi-channel analyzer that was controlled with a PC computer. Sample cooling was provided by a closed cycle He optical cryostat, which allowed for the temperature to be varied between 10 and 300 K.

3. Results and Discussion

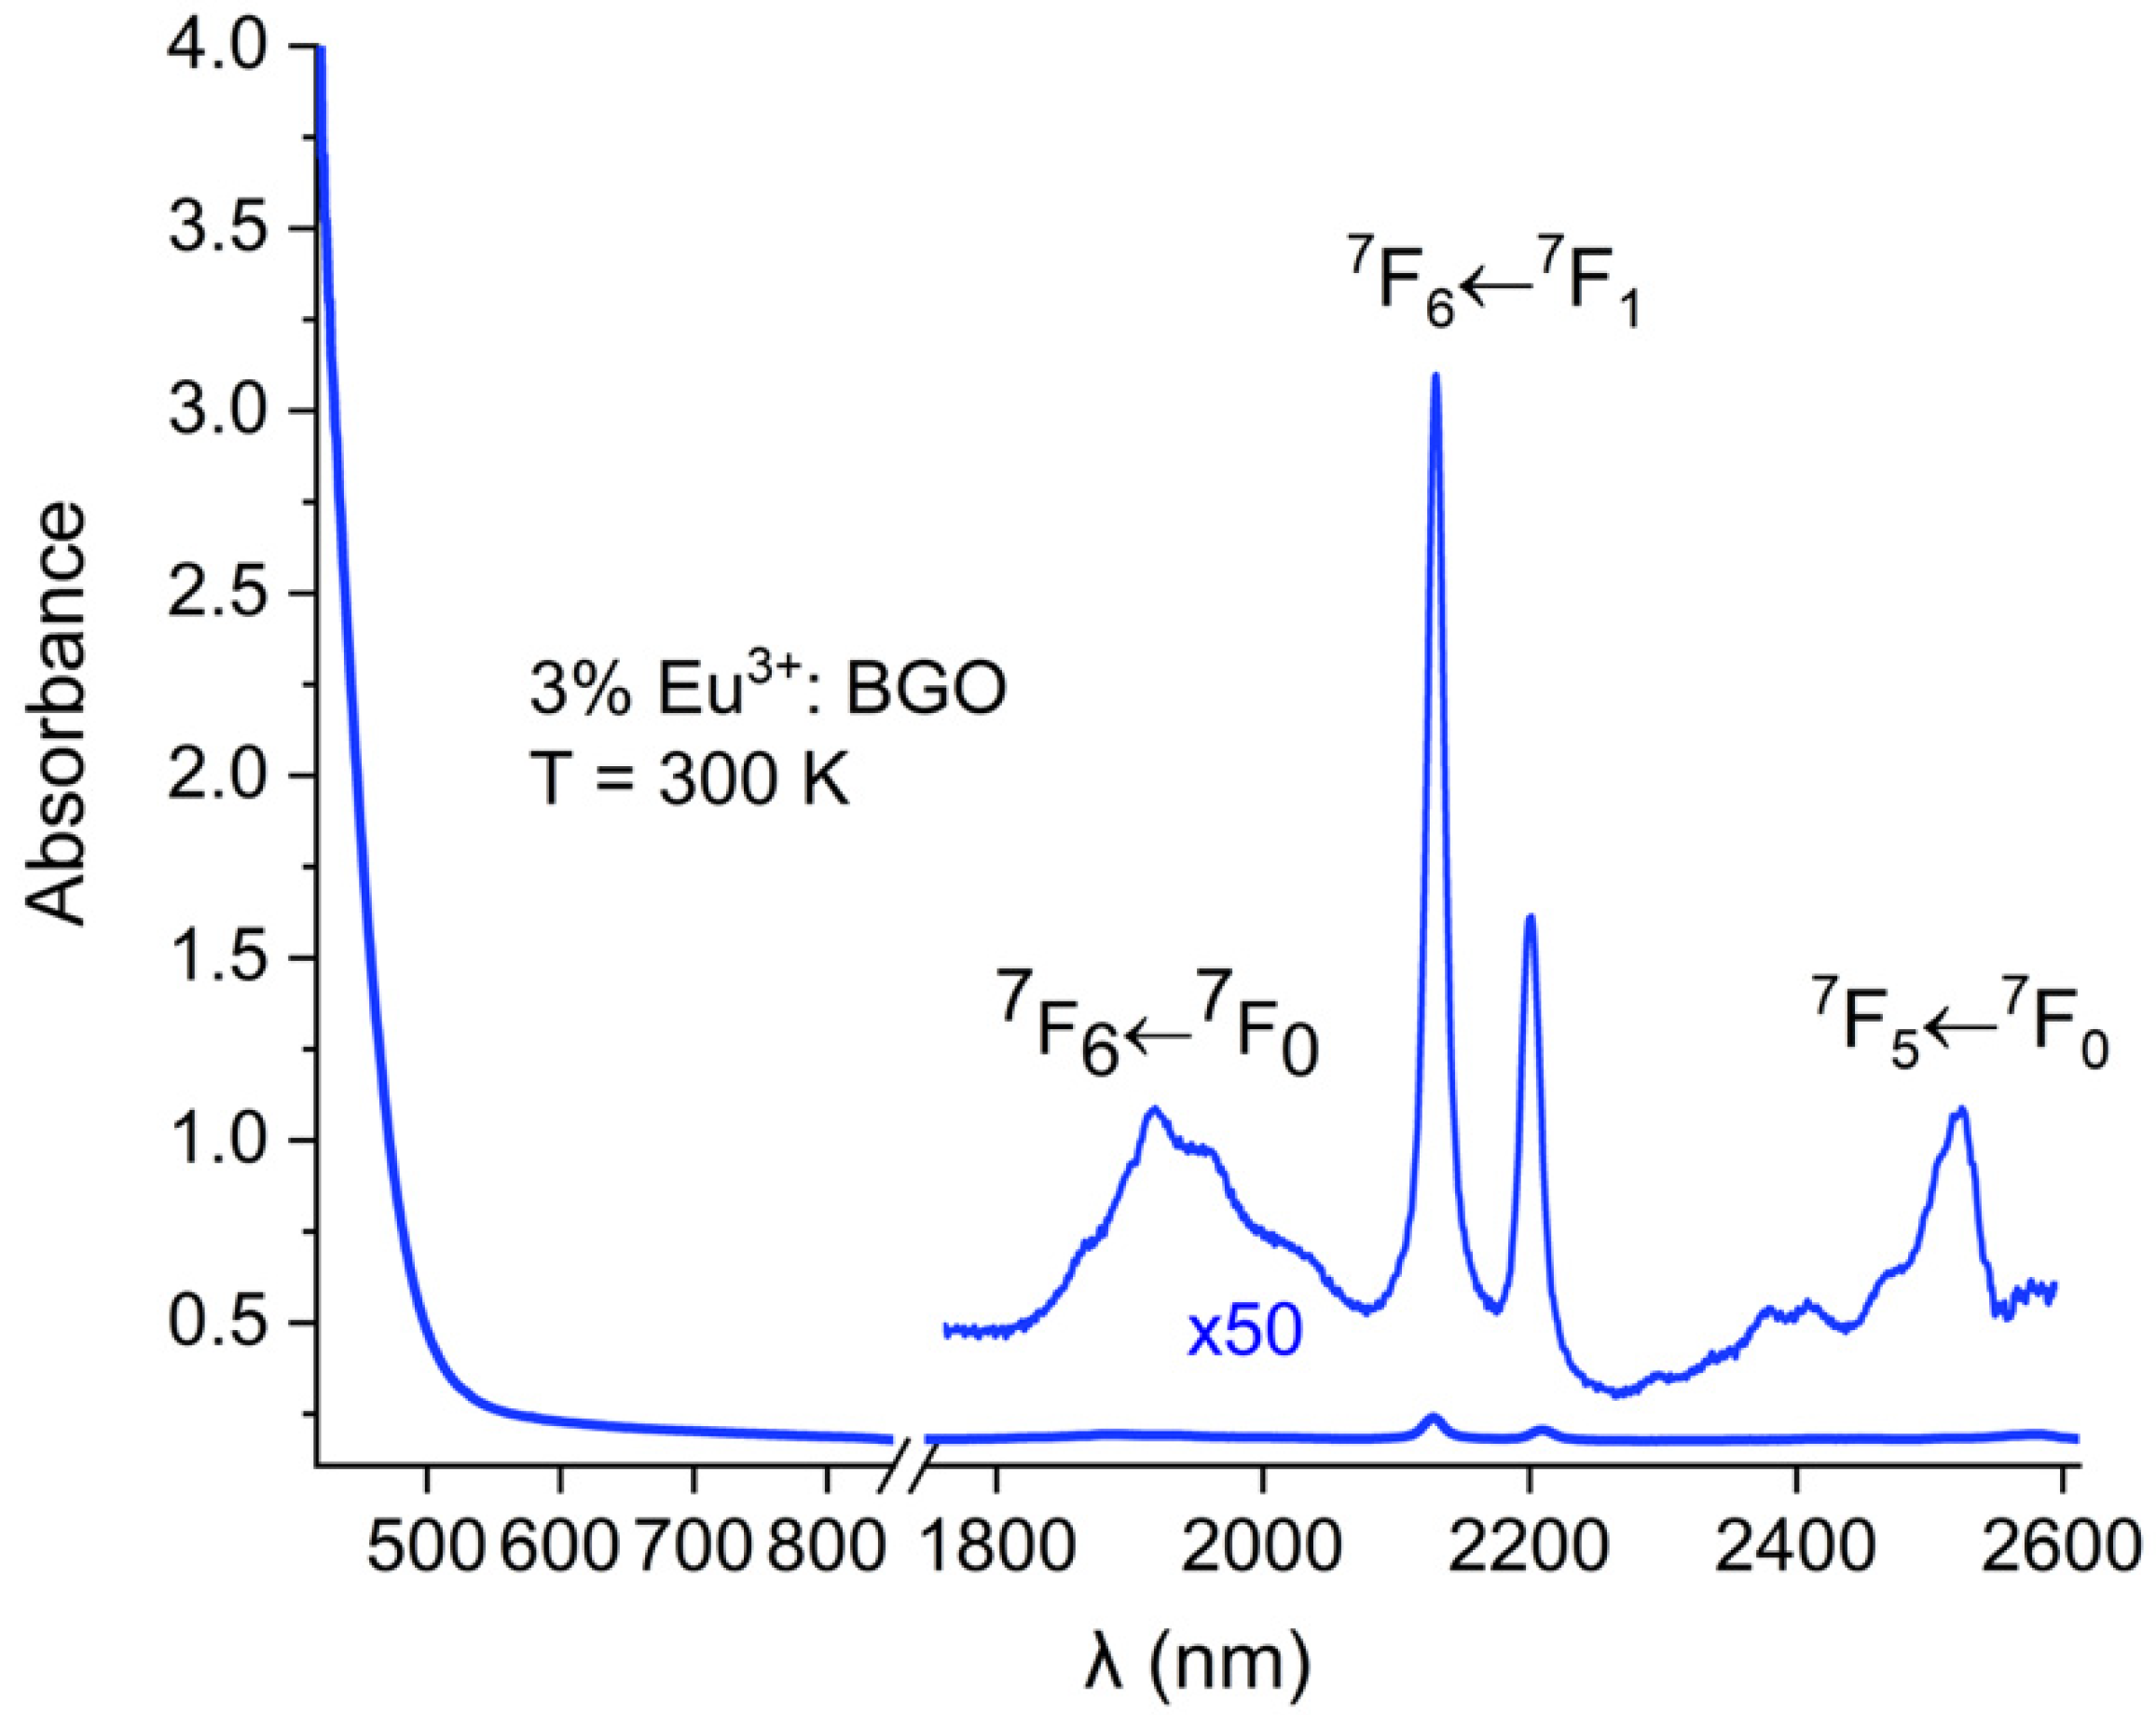
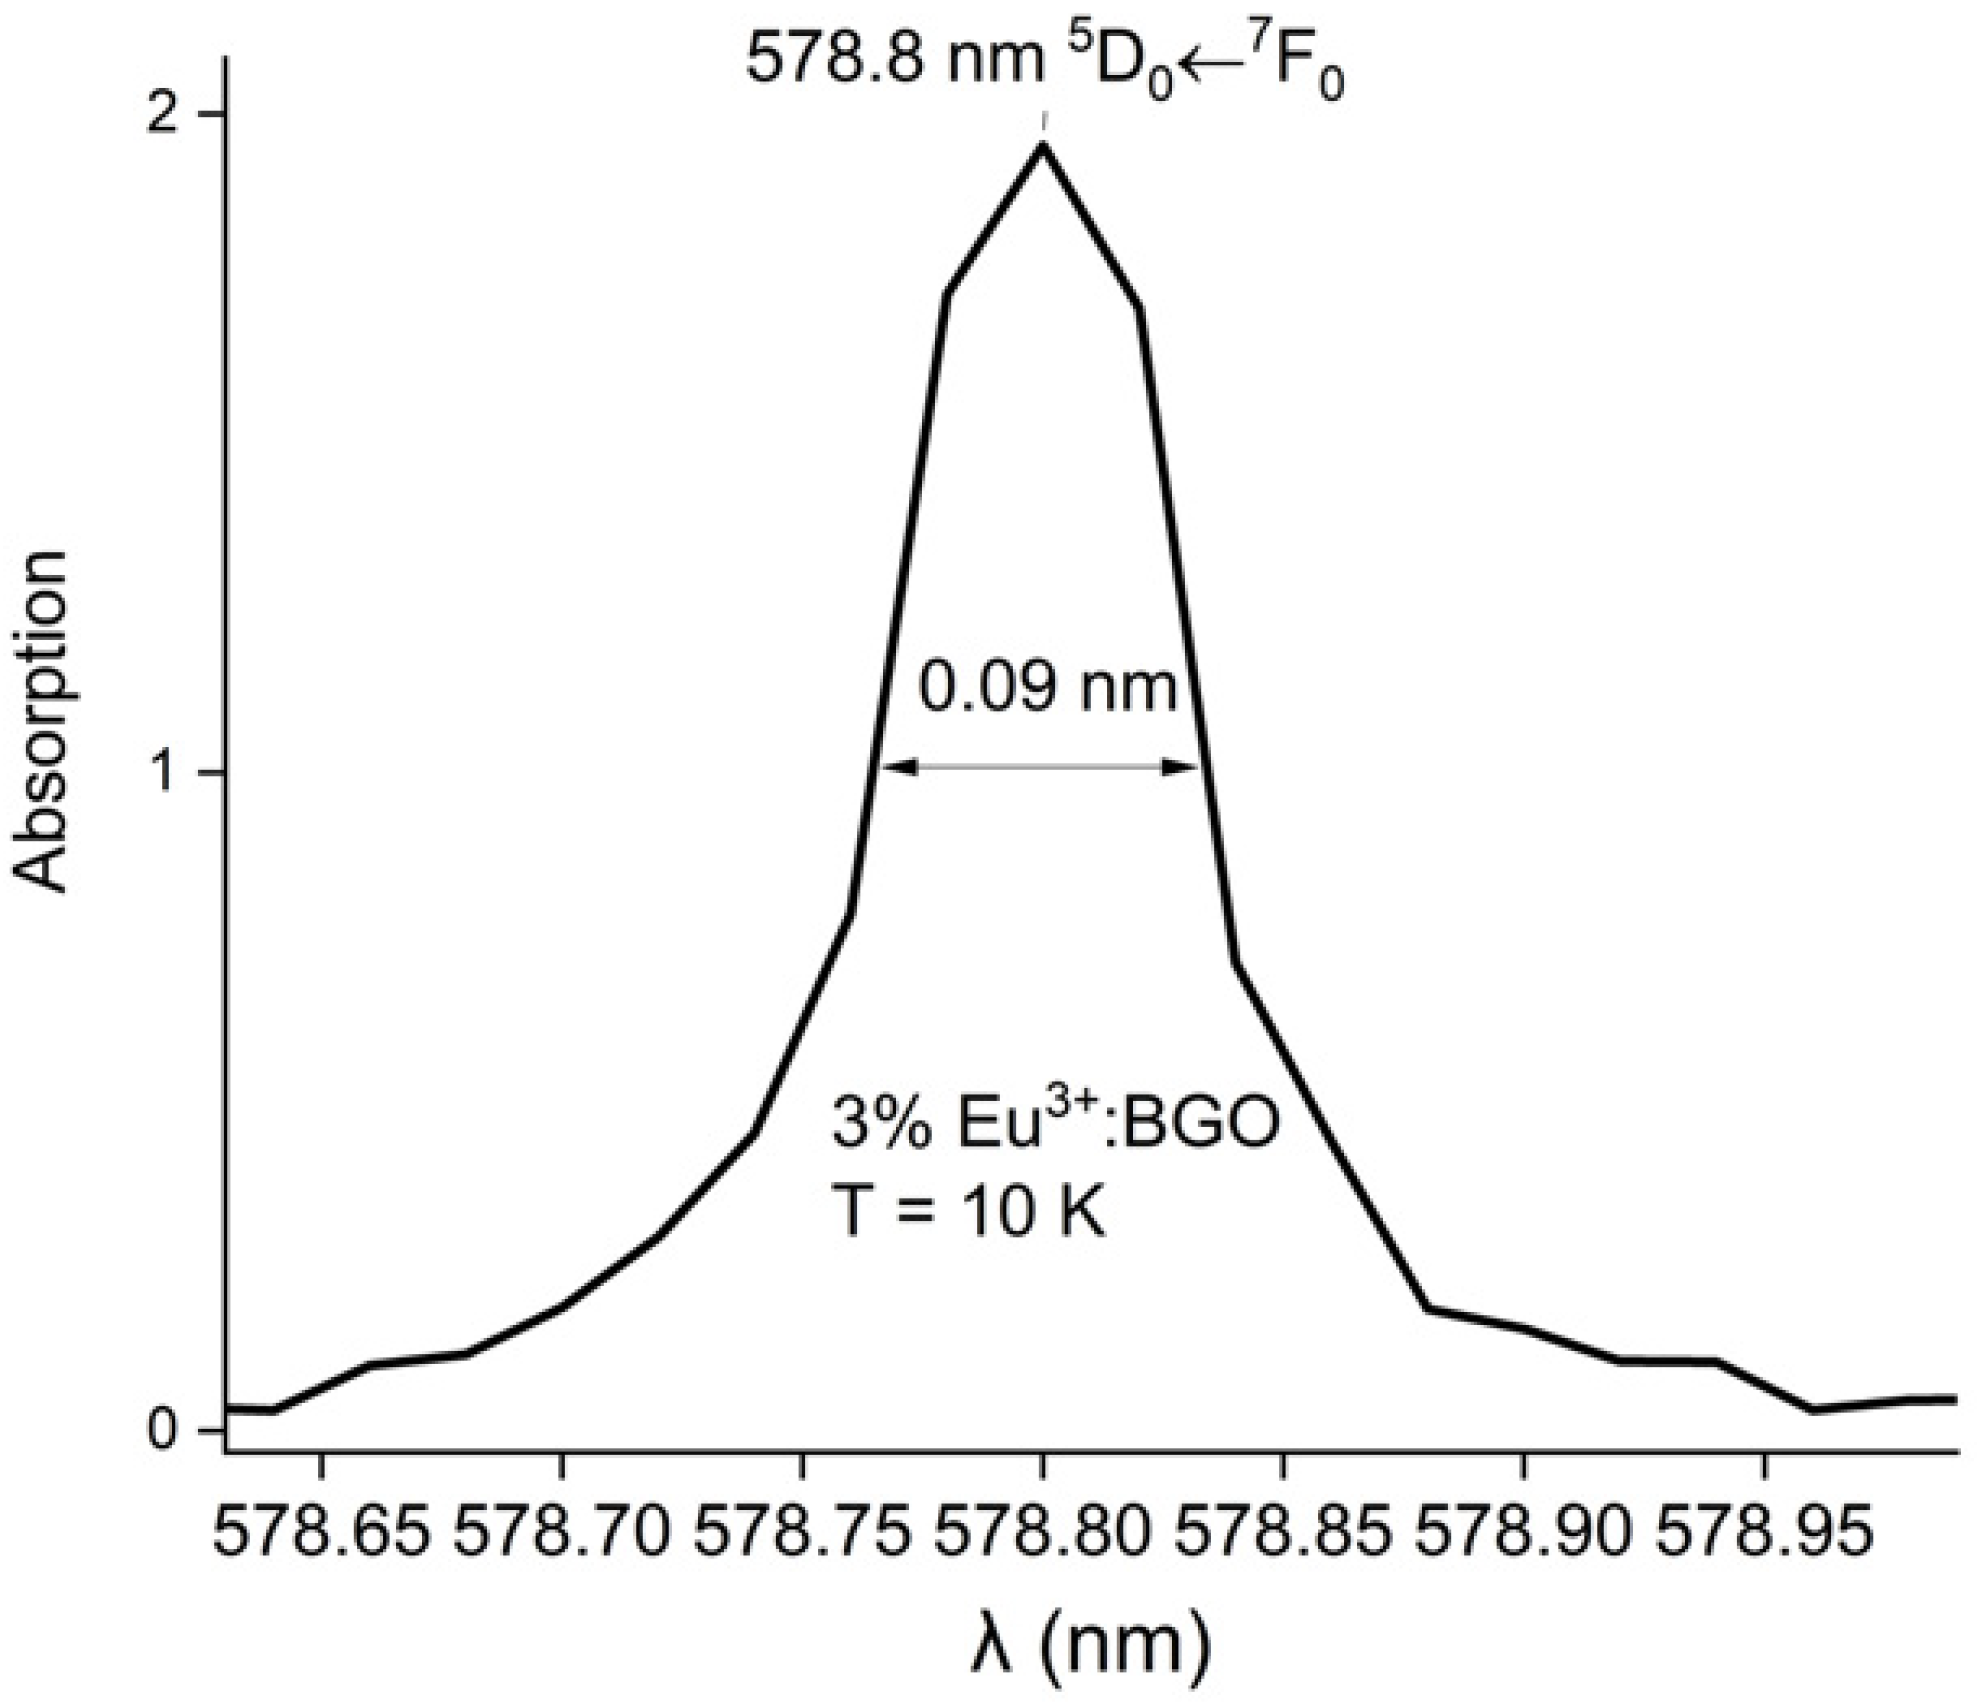
Absorption and emission spectra were recorded at room temperature (300 K) and at 10 K using the cryostat setup. The BGO crystal absorption spectrum taken in room temperature can be seen in Figure 3. A strong absorption edge can be seen in the UV-short wavelength VIS region. It is worthwhile to note that this absorption “shoulder” exists due to the incorrect occupation of BiGe centers (notation as used in [19]) within the crystal matrix, as indicated in literature [19]. The position of the 5D07F0 level of Eu3+ has been determined from the low temperature absorption spectrum to be 17277 cm−1 (578.8 nm) in BGO. Only single maximum of the 5D07F0 line has been observed, with line spectral width being equal to 0.09 nm, as seen in Figure 4.
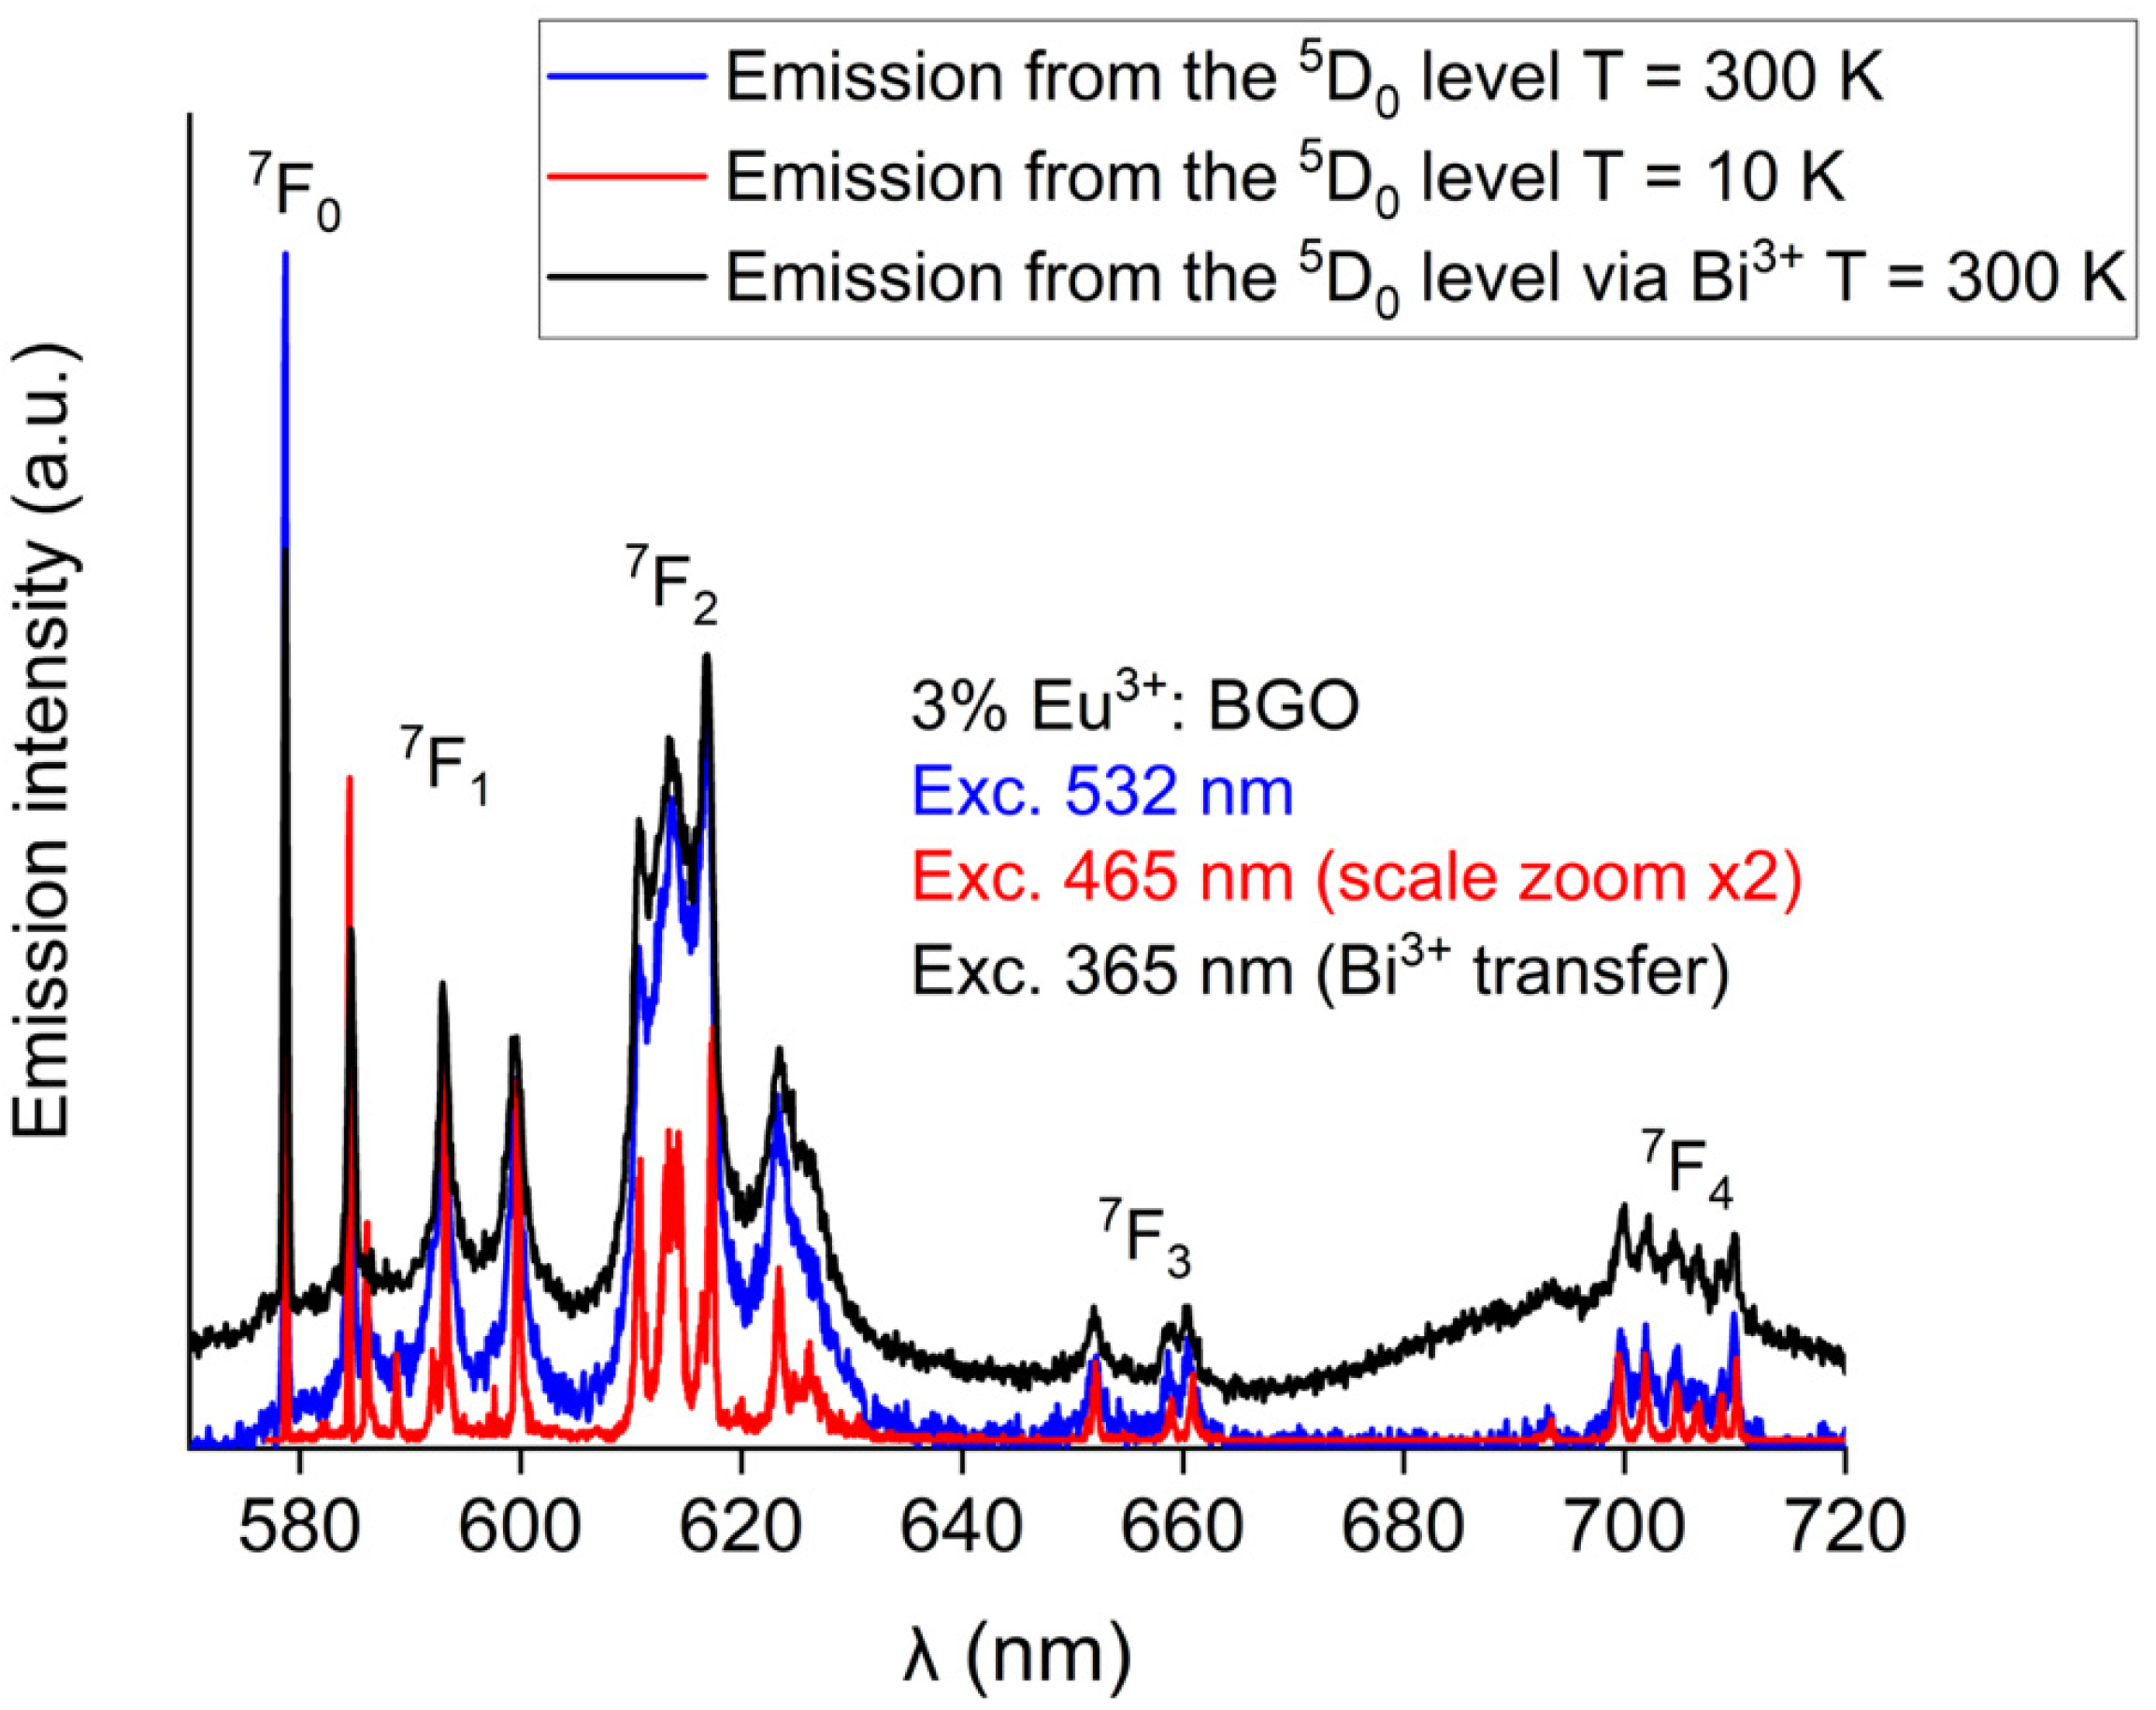
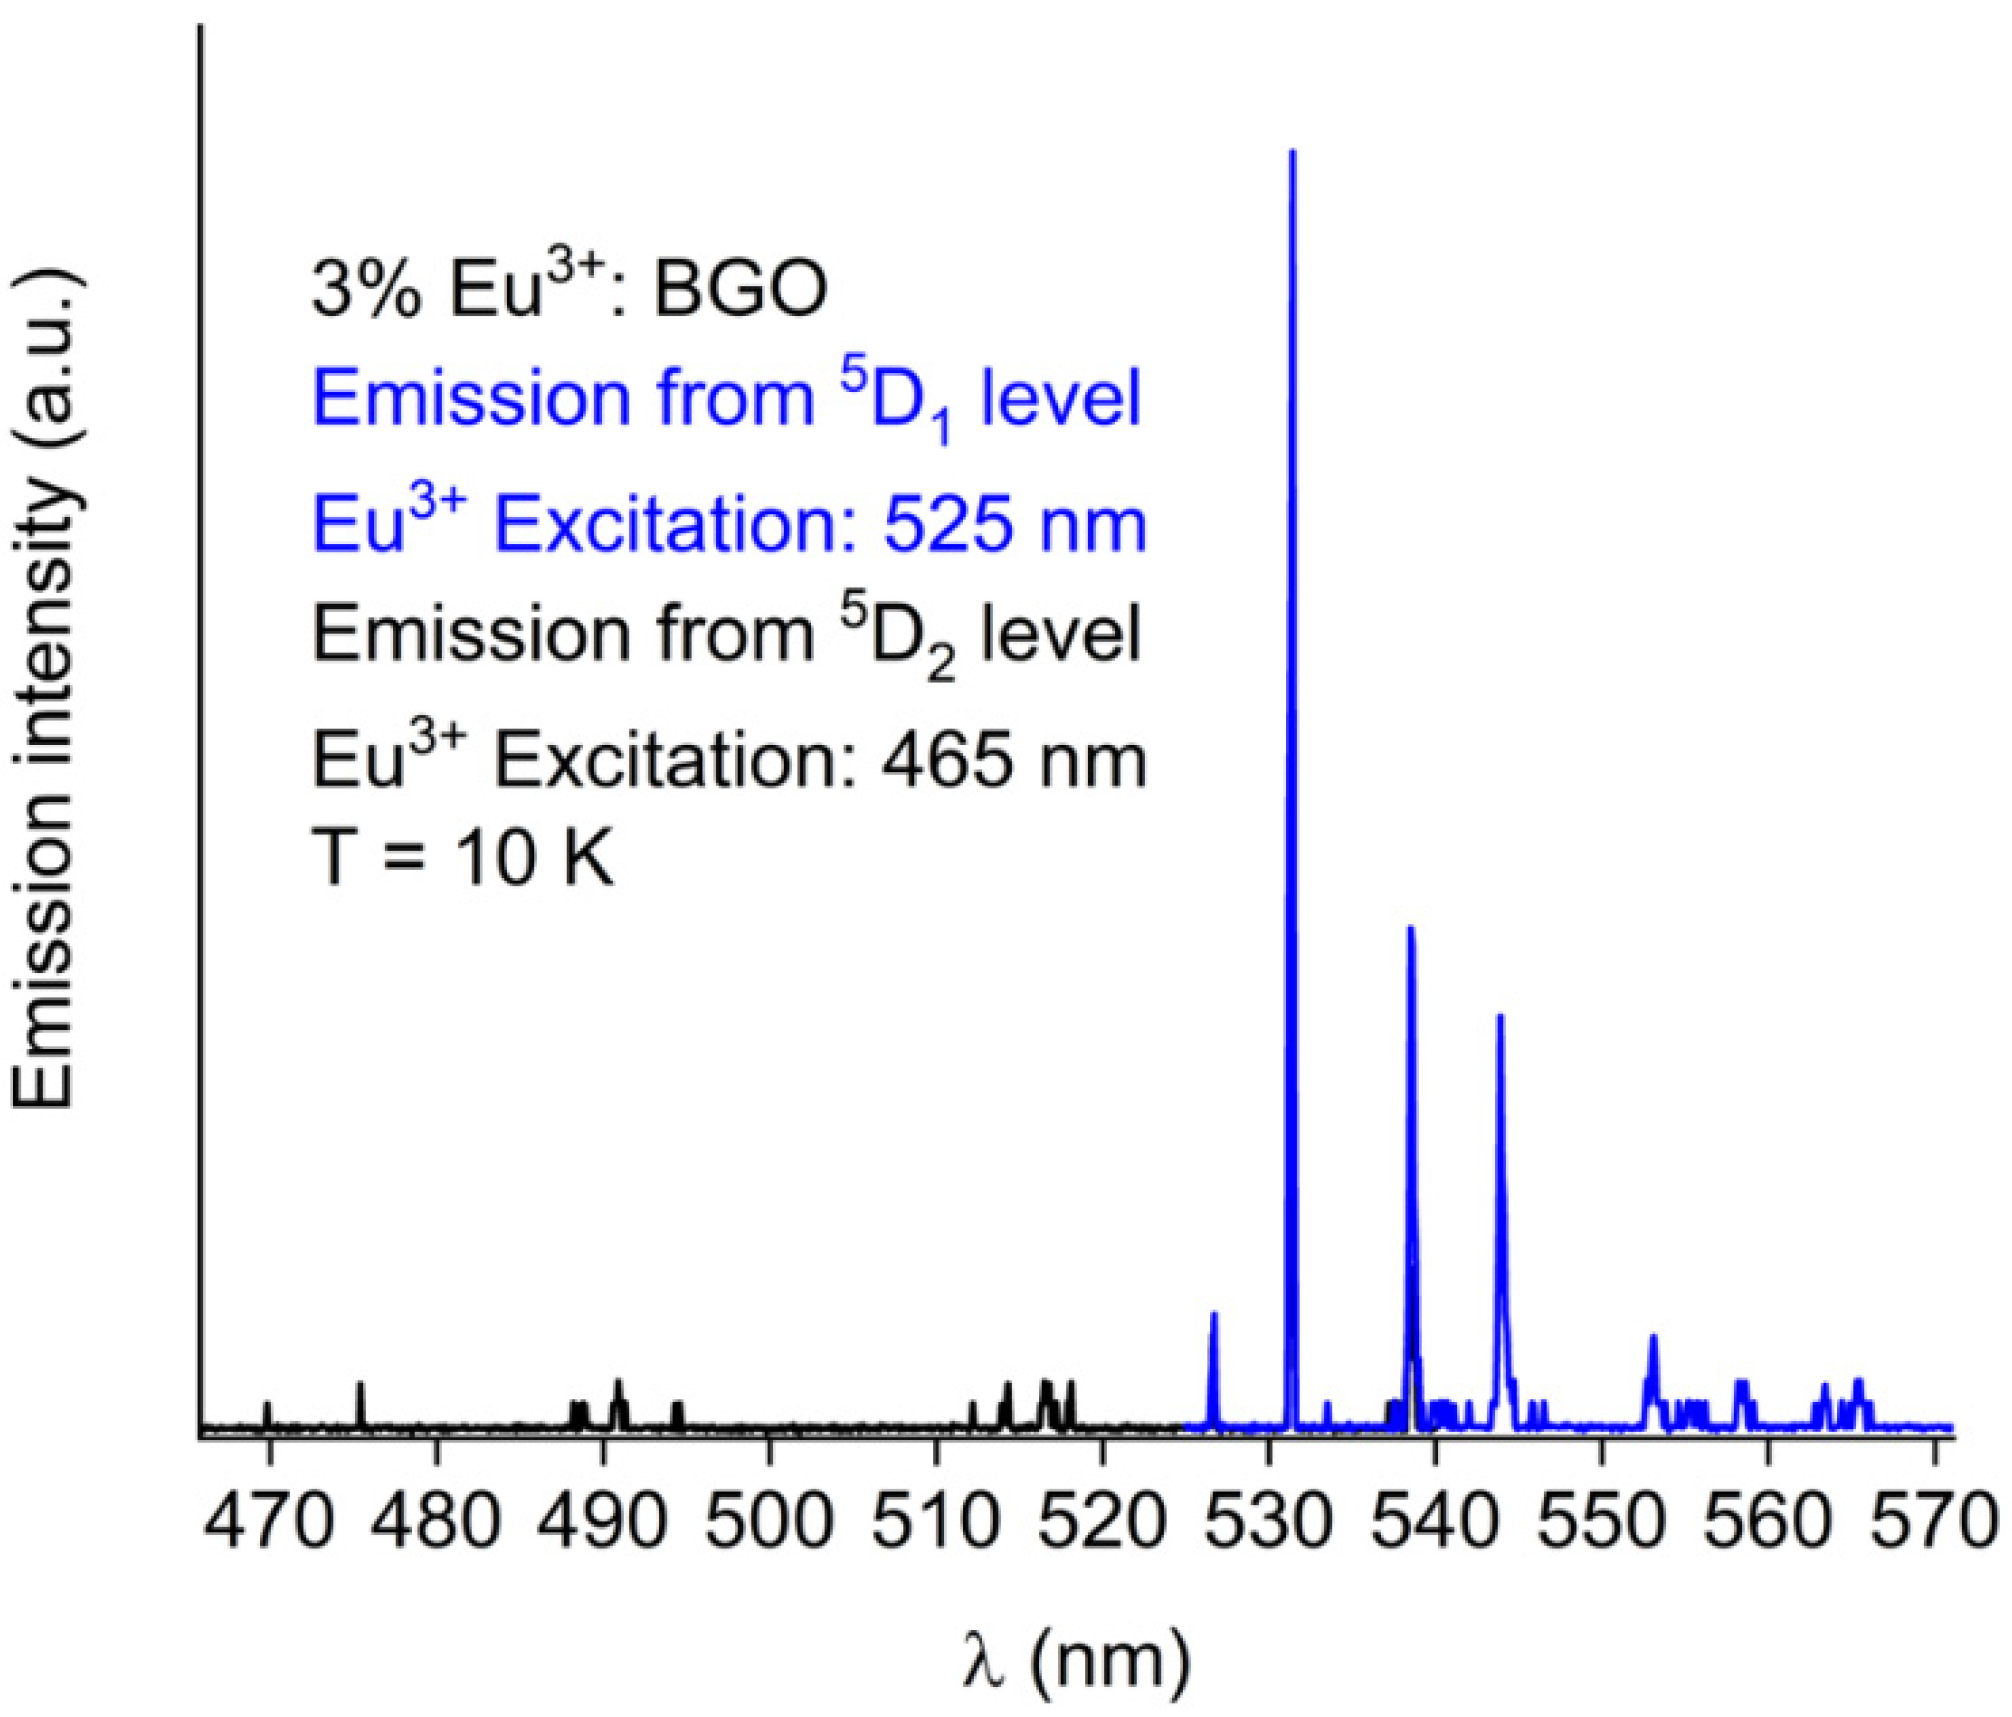
The emission spectra of the BGO samples were recorded at room temperature (300 K) and at 10 K. Emission spectrum of Eu3+ in BGO from the 5D0 level can be seen in Figure 5, where all transitions except rarely observed 5D07F5 and 5D07F6 are shown. Eu3+ luminescence in BGO occurs due to direct excitation of Eu3+, as well as via Bi3+ → Eu3+ energy transfer. In Figure 6 emission from higher lying states 5D1 and 5D2 can also be observed, although it is of much lower intensity when compared to the 5D0 emissions.
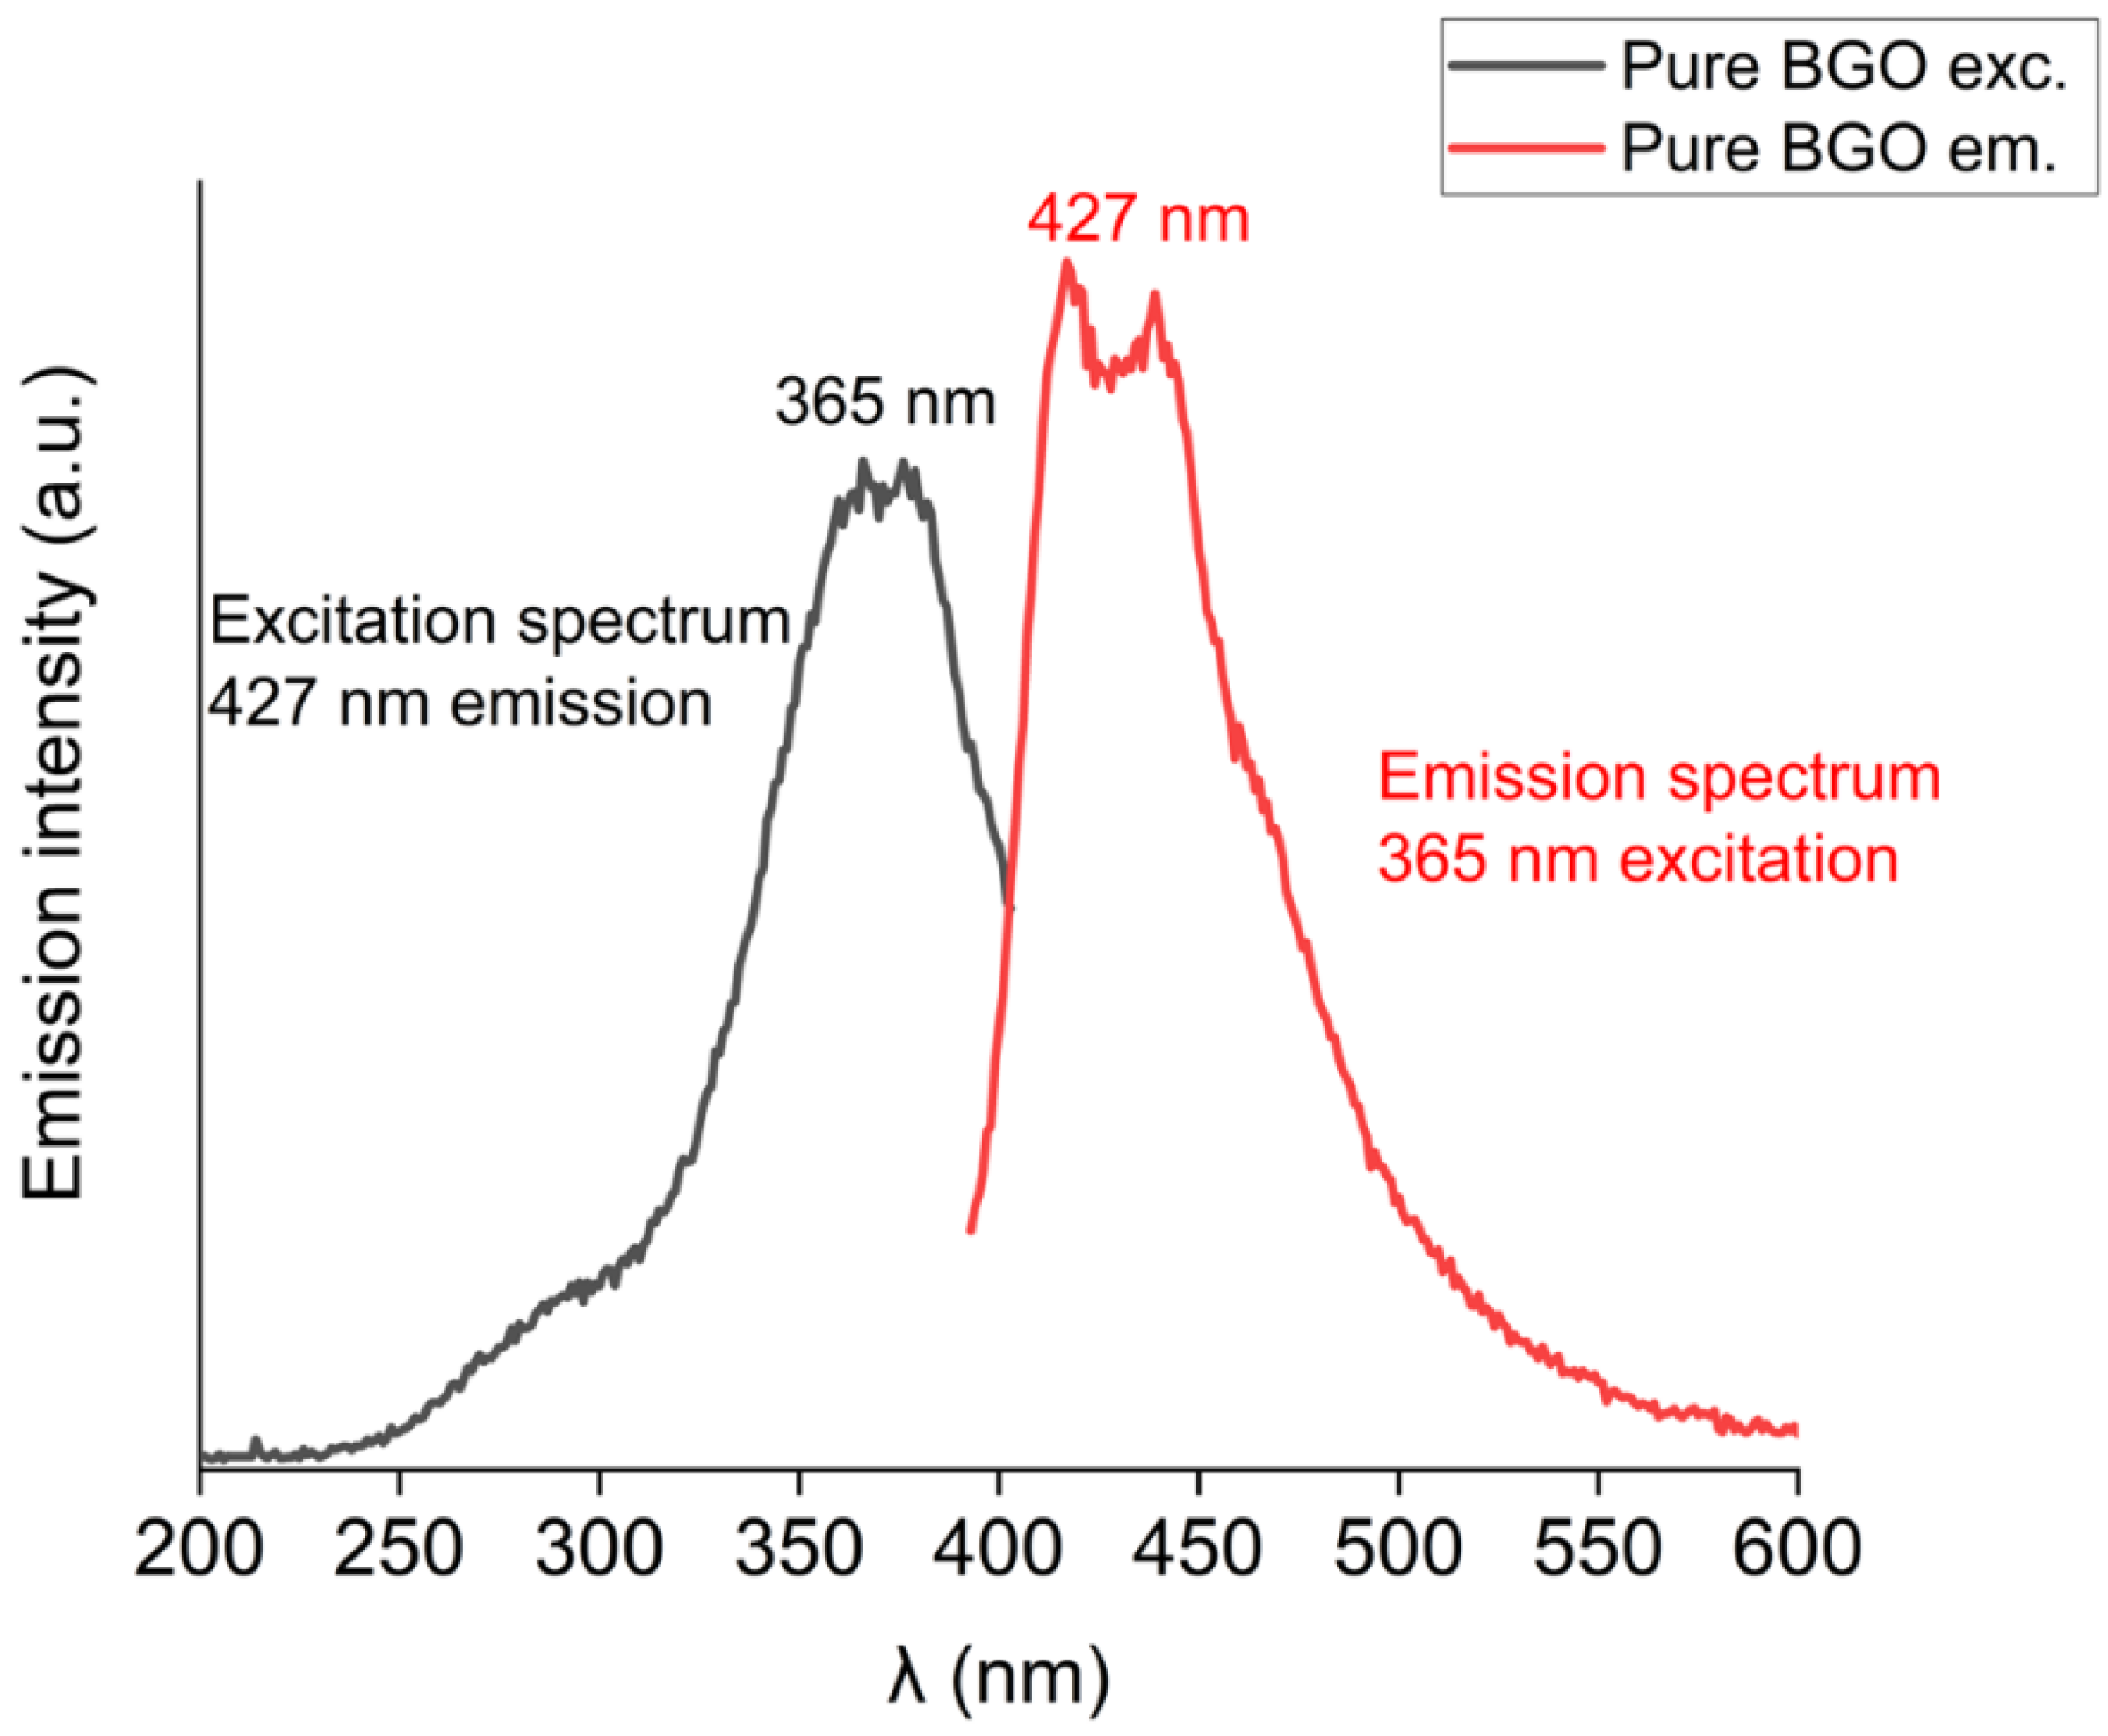
It is prudent to include the studies of interaction between the Bi3+ host ions and introduced Eu3+ dopant since the Bi3+ ion, which constitutes a core component of the BGO host lattice, is also optically active [20]. The Bi3+ within the host matrix, which is partially substituted by Eu3+ dopant, is heptacoordinated and possesses C1h site symmetry, which is confirmed by means of analysis of the Europium emission spectra [21]. The emission of Bi3+ ion is a broad-band type emission, which is based upon transition from the ground state 1S0 state to the 3P1 or 3P0 state (see Figure 1). Those transitions lay in the UV portion of the spectrum in which both pure as well as Eu3+-doped BGO exhibits strong absorption. It has been reported by G. Blasse and A. Bril [22] that the positions of the Bi3+ 1S03P1 band and the charge transfer (CT) band of Eu3+ permit the occurrence of successful energy transfer between Bi3+ and Eu3+ ions through UV excitation of Bi3+ [23]. Therefore, the Bi3+ ion can be utilized as an effective luminescence sensitizer for Eu3+ by means of non-radiative energy transfer, as further stipulated [22,23]. It is important to note that the efficiency of the transfer as well as excitation energy required for successful transfer strongly depend on the host matrix [20]. In order to evaluate the presence and efficiency of the Bi-Eu energy transfer in BGO Bi3+ excitation spectra were measured in all of the samples, including reference pure BGO sample. Bi3+ excitation band maximum lies at 365 nm, which is in full agreement with studies that were performed on pure samples by G. Blasse and C.W.M. Timmermans, as seen in Figure 7 [21]. The study also mentions that Bi3+ excitation within the BGO matrix is also possible by 355 nm light. This has also been successfully verified during luminescence emission measurements, although 355 nm excitation results with emission of lower efficiency, as compared to 365 nm excitation in room temperature (300 K).
The emission profile of Eu:BGO can be seen in Figure 8, as expressed in CIE 1976 color space.
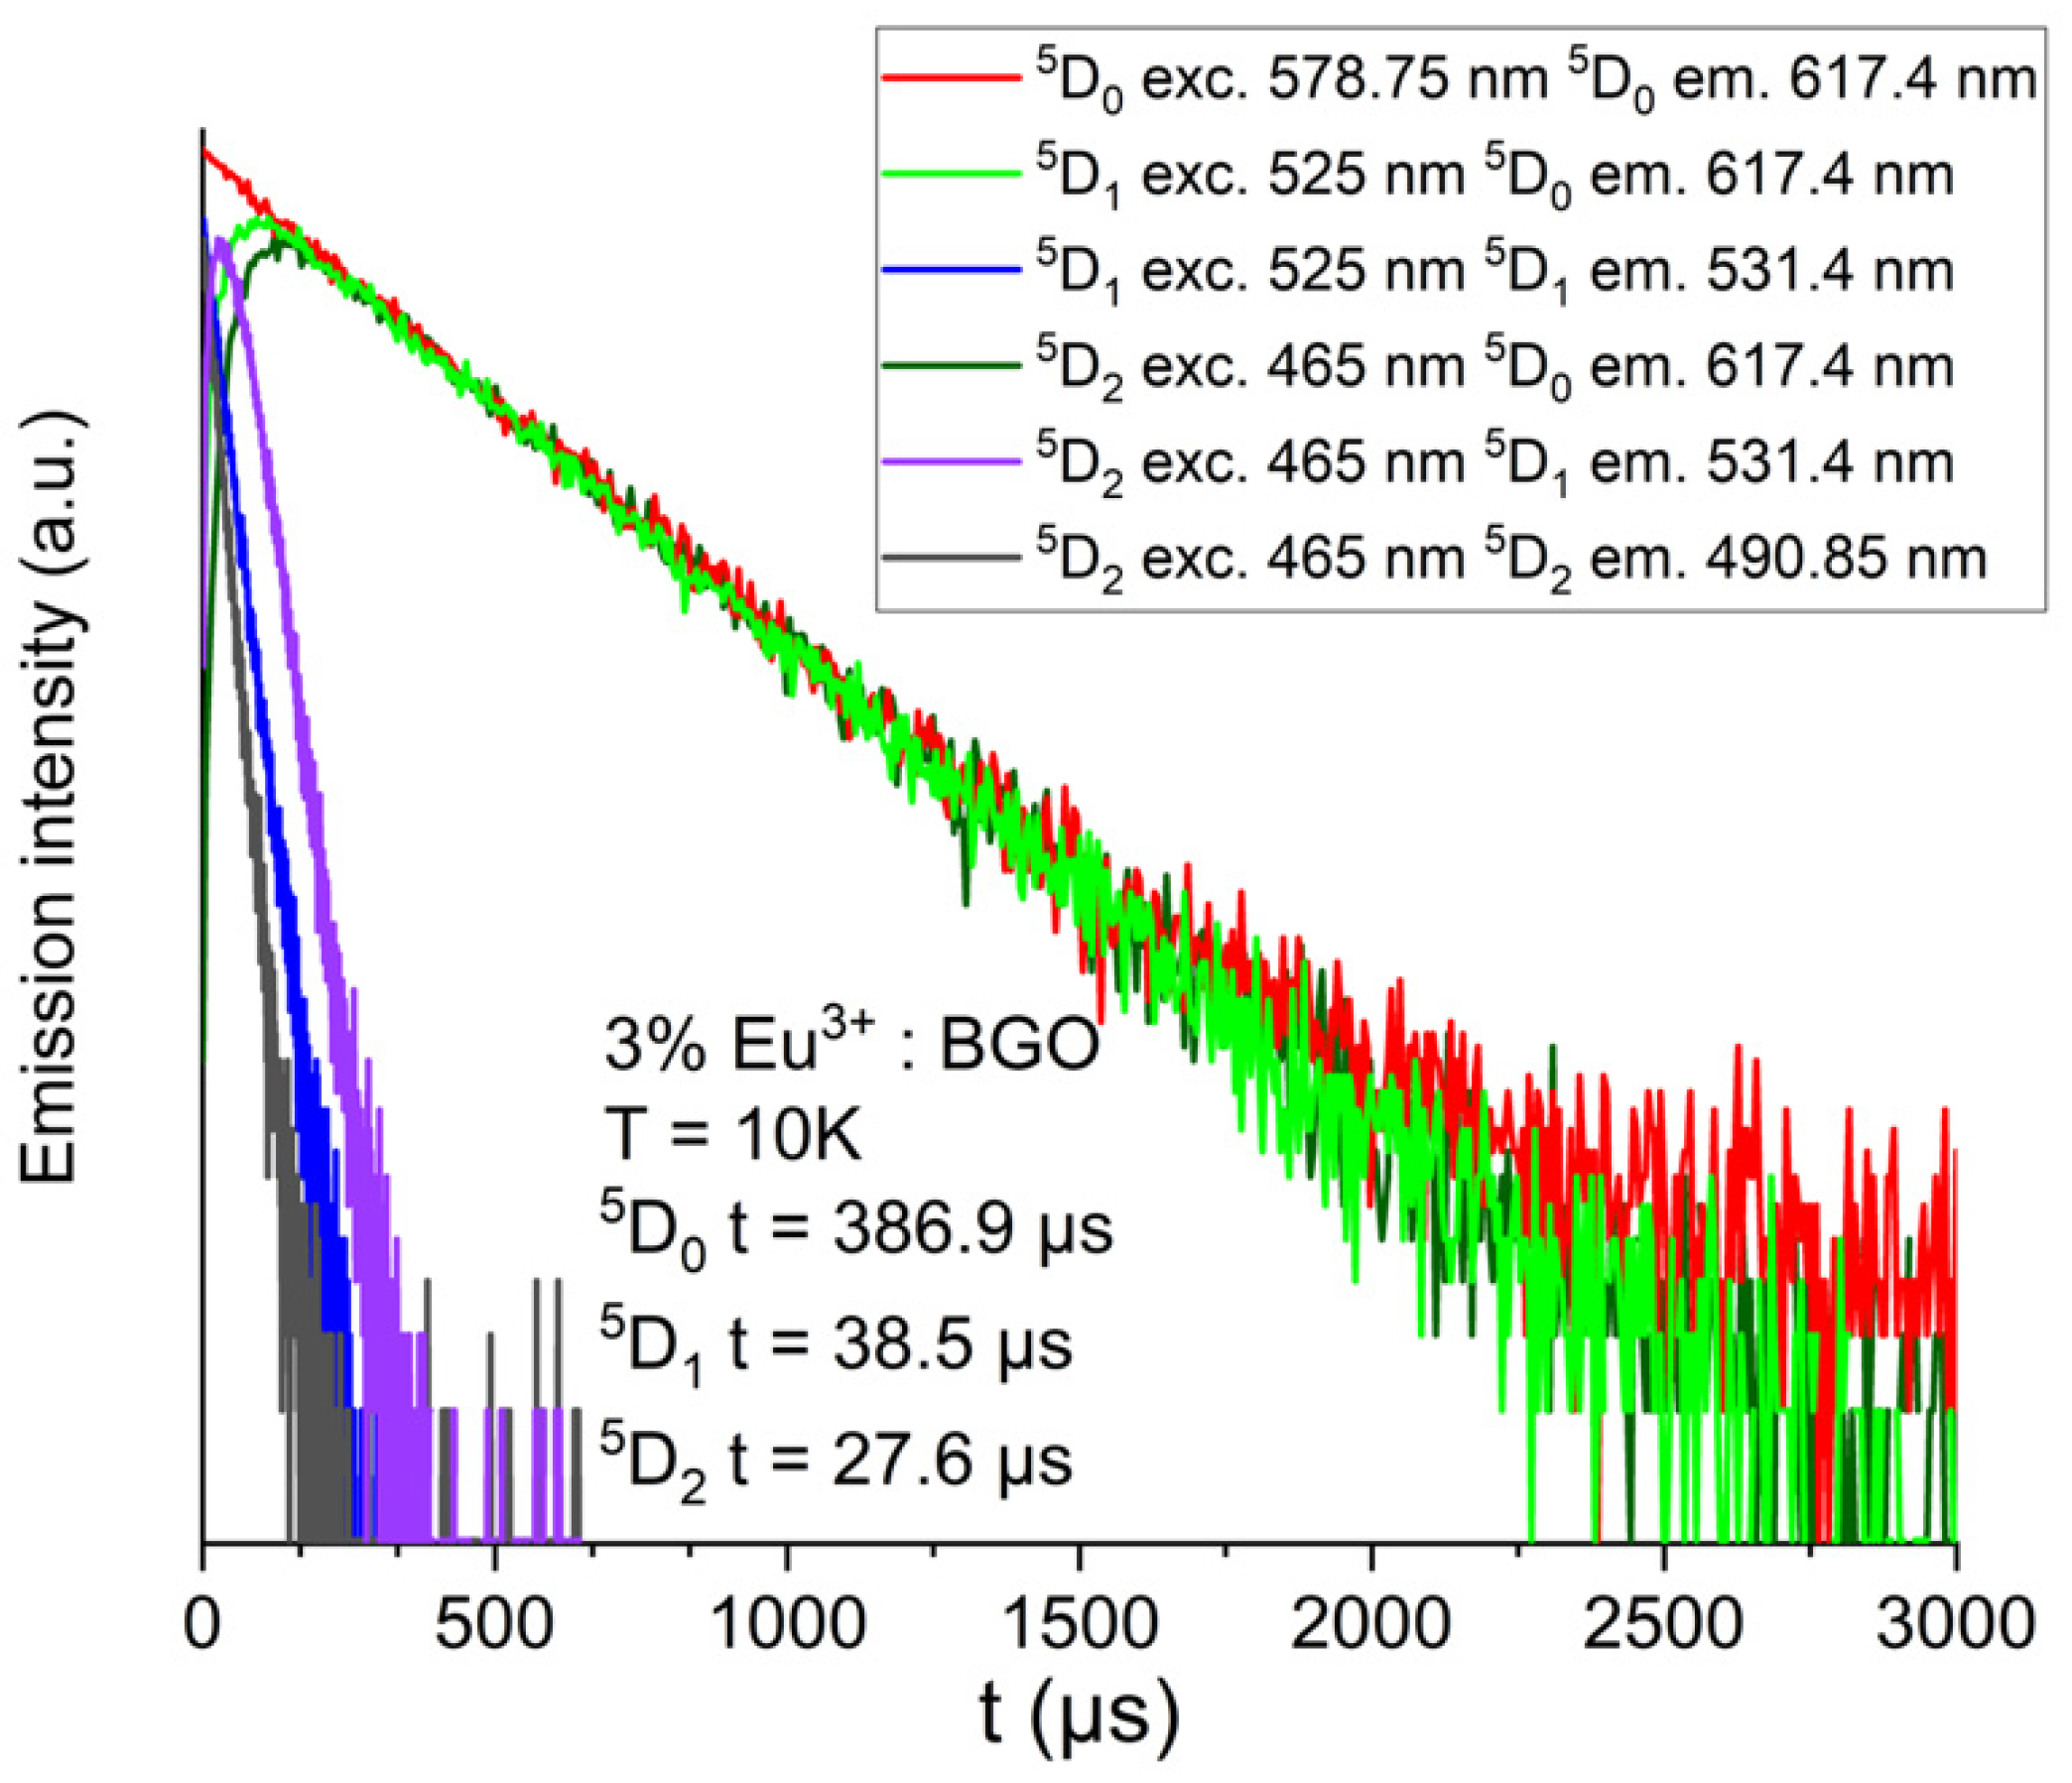
The measured Bismuth radiative decay times shorten substantially with the increase of the Europium concentration, which proves the efficiency of the observed energy transfer in T = 300 K (as shown in Figure 9). Furthermore, radiative decay measurements of the 5D0 level, when excited via 5D1 or 5D2 levels, show the clear presence of a rise time in the beginning, which indicates that luminescence from higher-lying 5D1 and 5D2 levels of Eu3+ is also additionally occurring (as shown in Figure 10). Additionally, the calculated theoretical radiative luminescence decay time is significantly longer than observed, which can be attributed to the presence of strong 5D07F0 line, the contribution of which is not taken into account by the classical Judd-Ofelt theory [16,24,25], as discussed further.
The Judd-Ofelt (J–O) theory [16,24,25] is a well-recognized method for the analysis and comparison of the spectroscopic properties of rare-earth (RE3+) ions in dielectric matrixes. For most RE3+ elements, calculation is solely based upon tabulated reduced matrix elements and integrated absorption cross section measurements. By applying the symbol convention that is based upon the formulas derived in [15], it is possible to describe dipole strength (expressed in Debye2), based upon absorption spectra integrated peak areas, as:
D exp = 1 108.9 C d X A ( T ) A ( v ˜ ) v ˜ d v ˜
where v ˜ is the mean wavenumber of the transition in cm−1, C is the mol dopant concentration, d is the optical path length, and X A ( T ) is the fractional thermal population at temperature T of level A from which the absorption process begins. Furthermore, the calculated dipole strength can be computed while using the following equation:
D calc = 10 36 2 J + 1 X E D e 2 λ = 2 , 4 , 6 Ω λ | J | | U ( λ ) | | J | 2
whereas 1036 is the D2 into esu x cm conversion factor, e2 is the elementary charge, 2J + 1 denotes the degeneracy of the ground state, and | J | | U ( λ ) | | J | 2 are the squared reduced matrix elements, which were tabulated and made available by the works of Carnall et al. [26], while the term X E D = ( n 2 + 2 ) 2 9 n accounts for the correction of the effect in the dielectric medium, and where n denotes its refractive index. As Judd-Ofelt calculations are often performed using the oscillator strength parameter, the dipole strength D and oscillator strength f can be converted using the following relation:
D = 2.124 10 6 f v ˜
It is important to remark that the Eu3+ ion has a unique property of having reduced matrix elements that are mostly equal to zero, with the exception of only non-zero values ║U22 for 5D07F2 transition and for ║U42 and║U62 elements for 5D07F4, and 5D07F6 transitions, respectively. Therefore, it is possible to derive the values of Judd-Ofelt Ωλ parameters for Eu3+ - doped hosts, based on the integrated areas of the emission spectra alone. Since the 5D07F1 magnetic-dipole transition is independent of the host environment, it can be used as a reference one for transitions with the 5D0 excited state as origin. Based upon the work of K. Binnemans [15], the Aref value for 5D07F1 transition can be calculated using the formula:
1 τ rad = A MD , 0 n 3 ( I tot I MD )
where n is the refractive index of the host and AMD,0 is the spontaneous emission probability for the 5D07F1 magnetic dipole transition in vacuo, which is equal to 14.65 s−1 [15]. Therefore, it is possible to calculate the Ωλ parameters from the ratio of the integrated intensity of the 5D07F2,4,6 transitions (referenced as I λ ( v ˜ ) d v ˜ in the following equation) to the ratio of the integrated intensity of the 5D07F1 magnetic dipole transition (indicated as I 1 ( v ˜ ) d v ˜ in the following equation) by applying the following equation [15]:
Ω λ = D M D v ˜ 1 3 e 2 v ˜ λ 3 | Ψ J | | U ( λ ) | | Ψ J | 2 9 n 3 n ( n 2 + 2 ) 2   I λ ( v ˜ ) d v ˜ I 1 ( v ˜ ) d v ˜
where v ˜ 1 is the averaged wavenumber of the 5D07F1 transition and v ˜ λ is the averaged wavenumber of the 5D07Fλ transition, where λ = 2,4,6. The averaged wavenumber can be calculated according to the formula:
v ˜ λ = v ˜ I ( v ˜ ) d v ˜ I ( v ˜ ) d v ˜
As derived and discussed by K. Binnemans [15], since the 5D07F6 transition is usually very rarely observed, it is often possible to calculate just the Ω2 and Ω4 parameters Given that for 5D07F1 magnetic-dipole transition the dipole strength can be expressed as DMD = 9.6 × 10⁻⁶ Debye2, and assuming that for other transitions DMD = 0, for transitions 5D07F2,4,6 DED is equal to the following:
D E D = e 2 λ = 2 , 4 , 6 Ω λ | Ψ J | | U ( λ ) | | Ψ J | 2
Furthermore, for transitions 5D07F0,3,5 both DED and DMD are assumed to be equal to zero [15]. Taking into account all of the above, it is now possible to calculate the radiation transition probabilities of all excited states while using the Judd-Ofelt parameters using the formula [15]:
A ( Ψ J , Ψ J ) = 64 π 4 v ˜ 3 3 h ( 2 J + 1 ) [ n ( n 2 + 2 ) 2 9 D ED + n 3 D MD ]
where v ˜ is the average wavenumber of the transition in cm−1, h is equal to the Planck constant and 2J + 1 denotes the degeneracy of the initial state. In addition, the radiative branching ratios βR( Ψ J , Ψ J )   from   level   J   to   J can now be calculated while using the A ( Ψ J , Ψ J ) values from the equation above, as [15]:
β R ( Ψ J , Ψ J ) = A ( Ψ J , Ψ J ) Ψ J A ( Ψ J , Ψ J )
By applying the standard least-squares method, for which the root mean square (RMS) deviation can be defined, as follows:
RMS = i ( D exp i D calc i ) 2 N 3  
where N equals the number of transitions used in the fitting procedure and 3 is the number of fitted parameters ( Ω 2 , Ω 4 , Ω 6 ) , it is now possible to iteratively fit the Ωλ parameters.
Furthermore, the asymmetry parameter (calculated from the room temperature emission spectrum) R is defined as the ratio between the integral intensities of the 5D07F2 and 5D07F1 transition bands, R = I(5D07F2)/I(5D07F1) may be considered as an indication of the Eu3+ ion symmetry. Specifically, the further from a centrosymmetric geometry luminescent center is located, the higher the value of the asymmetry parameter R [15,27]. As expected, the determined R parameter for Eu3+:BGO specimens increases for samples with higher concentration of Europium3+, as the Eu3+ ion somewhat disrupts lattice symmetry, which is due to the difference between the ionic radii of Bi3+ (0.96 Å) and Eu3+ (1.07 Å) ions, as indicated in Table 1.
Eu3+:BGO emission spectra were recorded at T = 300 K and 10 K, Judd-Ofelt parameters, asymmetric and branching ratios were calculated. Table 2 shows the spontaneous emission probabilities, fluorescence branching ratios and radiative lifetimes of Eu3+:BGO using the calculated parameters. The obtained theoretical radiative lifetime is significantly longer than the experimentally observed value, which indicates that all of the occurring processes are not taken into account by the Judd-Ofelt theory (such as the very strong presence of the 5D07F0 emission line). Comparison of Judd-Ofelt parameters between Eu3+:BGO and other Eu3+-doped hosts is shown in Table 3. The Judd-Ofelt parameter Ω2 can be generally used to represent the strength of the covalency and the site symmetry of Eu3+, as mentioned above [15,27,28]. The value of Ω2 in Eu:BGO is larger than the values reported for Eu3+:LaF3 and Eu3+:YAlO3 materials, and smaller than the values reported for the other listed materials. Similar observations have been reported in [28] for the Eu3+ doped scintillating crystal Bi4Ge3O12, also possessing cubic symmetry (although it has a different space group (43d) than Eu:BGO). This trend confirms that the values of, and relations between, the derived Ωλ parameters, are strongly host-dependent, and thus can be used as a general indicator of the host symmetry.
The presence of a strong 5D0 7F0 emission line, as observed in the emission spectra (shown in Figure 5), should not be disregarded (even though this ED transition is considered “forbidden” by classical Judd-Ofelt theory [24,25]), since the standard model effectively does not take into account the J−J mixing and the spin–orbit interaction [35]. In fact, the presence of a strong 5D0 7F0 emission line can be attributed to the vibronic coupling or via mixing of higher configurations into the 4f wavefunctions by the crystal-field effect, as noted by K.Binnemans, [15]. Indeed, there are numerous cases shown of Eu3+ doped hosts with low local site symmetries (Cs, Cn, Cnv), in which the 5D0 7F0 emission is very strong or even strongest of the entire spectrum [35] (as a notable example, the 5D0 7F0 emission line of strong intensity has also been observed in Eu3+: Bi4Ge3O12, as reported in [36]). Furthermore, the ratio of the integrated intensity of the 5D07F0 / 5D07F1 transitions is an important factor that represents the contribution due to the J − J mixing and the spin–orbit interaction, as noted in [35,37]. It can be expressed formally as RJJ = I(5D07F0)/I(5D07F1) and in case of 3% Eu:BGO equals 0.2962. Additionally, it is important to mention that, in some cases, the J–J mixing alone is insufficient to explain the intensity of the observed 5D0 7F0 emission [35,37,38]. The Wybourne–Downer mechanism [39] and breakdown of the closure approximation in the Judd-Ofelt theory must then also be taken into account [40]. Additionally, the presence of only one narrow line for the 5D07F0 transition of Eu3+ ion indicates that there is only one coordination environment of the Eu3+ ion, which is consistent with the structural data.

4. Conclusions

The spectroscopic properties of Eu3+ doped Bi12GeO20 (BGO) sillenite bulk crystals that were grown by the low-thermal-gradient Czochralski technique (LTG Cz) were investigated. The absorption spectra and the emission properties have been measured at room temperature (300 K) and at 10 K. Based upon the absorption measurements at 10 K, position of the 5D07F0 level of Eu3+ has been determined to be 17277 cm−1. Luminescence has been observed from the 5D0,1,2 levels of Eu3+, with emissions from the 5D0 level being the strongest one. Luminescence from the 5D0 level was observed both due to the direct Eu3+ ion excitation, as well as under UV excitation due to the energy transfer between Bi3+ and Eu3+ ions (see Figure 5). Luminescence from the higher-lying 5D1 and 5D2 levels of Eu3+ has also been confirmed by means of radiative decay measurements (see Figure 10). The Bi3+ → Eu3+ energy transfer mechanisms were investigated. The Ωλ parameters as well as radiative lifetimes were calculated based upon the Judd-Ofelt formalism. Branching ratios and electric dipole transition probabilities were also determined, based upon the obtained experimental results. The obtained values of the Ωλ parameters are equal to Ω2 = 3.12224 × 10⁻²⁰ cm2 and Ω4 = 0.77412 × 10⁻²⁰ cm2, respectively. (see Table 2). Comparison between Eu:BGO and other Eu3+ doped hosts has been made (see Table 3). Reasons for the strong presence of the theoretically forbidden 5D07F0 emission were also investigated and discussed.
The obtained results prove that the Eu:BGO crystals can be successfully utilized as a luminescent medium in the orange-red portion of the VIS region (see Figure 8). It is further worth noting that the excitation wavelengths for Eu:BGO are easily directly generated. This makes Eu:BGO an attractive alternative to similarly emitting materials, for which the generation of excitation wavelengths is difficult, thus making Eu:BGO a viable potential VIS laser material (in particular, the 532 nm and 355 nm excitation wavelengths are, respectively, the 2nd and 3rd harmonics of a widely available 1064 nm Nd:YAG laser, with sources of 365 nm wavelength also being widely available).

Author Contributions

Conceptualization, M.K. (M. Kowalczyk) and M.M.; Methodology, M.K. (M. Kowalczyk) and M.M.; Validation, M.K. (M. Kowalczyk), M.K. (M. Kaczkan), B.F. and M.M.; Investigation, M.K. (M. Kowalczyk), M.K. (M. Kaczkan) and B.F.; Resources, V.D.G., T.F.R. and V.N.S.; Writing—original draft preparation, M.K. (M. Kowalczyk); Writing—review and editing, M.K. (M. Kowalczyk), M.M. and V.D.G.; All authors have read and agreed to the published version of the manuscript.

Funding

This work was supported by the PROM project-International scholarship exchange of PhD candidates and academic staff (funded by NAWA – Polish National Agency for Academic Exchange).

Conflicts of Interest

The authors declare that they have no known competing financial interests.

Appendix A

Figure A1. Crystal cell structure of BGO.
Crystals 10 00285 g0a1
Figure A2. XRD spectrum of BGO.
Crystals 10 00285 g0a2

References

  1. Malinovskiy, V.K.; Gudaev, O.A.; Gusev, V.A.; Demenko, S.I. Photoinduced Phenomena in Sillenite Crystals; Nauka: Novosibirsk, Russia, 1990. [Google Scholar]
  2. Abrahams, S.C.; Jamieson, P.B.; Bernstein, J.L. Crystal Structure of Piezoelectric Bismuth Germanium Oxide Bi12GeO20. Chem. Phys. 1967, 44, 4034–4041. [Google Scholar] [CrossRef]
  3. Petricevic, S.J.; Mihailovic, P.; Radunovic, J. A miniature pockels cell with novel electrode geometry. Sensors 2009, 9, 5298–5307. [Google Scholar] [CrossRef] [PubMed] [Green Version]
  4. Bridoux, E.; Rouvaen, J.M.; Coussot, C.; Dieulesaint, E. Rayleigh-Wave Propagation on Bi12GeO20. Appl. Phys. Lett. 1971, 19, 523–524. [Google Scholar] [CrossRef]
  5. Wang, W.C.; Meng, K.S. Surface-wave correlation and time scaling in a structure of Bi12GeO20-Si-LiNbO3. Appl. Phys. Lett. 1975, 27, 375–377. [Google Scholar] [CrossRef]
  6. Huignard, J.P.; Micheron, F. High-sensitivity read-write volume holographic storage in BSO and BGO crystals. Appl. Phys. Lett. 1976, 29, 591–593. [Google Scholar] [CrossRef]
  7. Peltier, M.; Micheron, F. Volume hologram recording and charge transfer process in Bi12SiO20 and Bi12GeO20. J. Appl. Phys. 1977, 48, 3683–3690. [Google Scholar] [CrossRef]
  8. Douglas, G.G.; Zitter, R.N. Transport Processes of Photoinduced Carriers in Bismuth Germanium Oxide (Bi12GeO20). J. Appl. Phys. 1968, 39, 2133–2135. [Google Scholar] [CrossRef]
  9. Briat, B.; Borowiec, M.T.; Rjeily, H.B.; Ramaz, F.; Hamri, A.; Szymczak, H. Combined optical/mcd/odmr investigations of photochromism in doubly-doped Bi12 GeO20. Radiat. Eff. Defects Solids 2002, 157, 989–993. [Google Scholar] [CrossRef]
  10. Wood, A.W.; Hunt, C.A.; Martin, J.J. The low-temperature photochromic and photorefractive response of bismuth germanium oxide doped with molybdenum. J. Appl. Phys. 2007, 101, 1–7. [Google Scholar] [CrossRef]
  11. Stepanova, I.V.; Gorashchenko, N.G.; Subbotin, K.A.; Smirnov, V.A. Determination of the charge state of chromium in Cr:Bi12GeO20 single crystals by spectral luminescence methods. Opt. Spectrosc. English Transl. Opt. i Spektrosk. 2009, 107, 335–338. [Google Scholar] [CrossRef]
  12. Lu, J.; Dai, Y.; Zhu, Y.; Huang, B. Density functional characterization of pure and alkaline earth metal-doped Bi12GeO20, Bi12SiO20, and Bi12TiO20 photocatalysts. ChemCatChem 2011, 3, 378–385. [Google Scholar] [CrossRef]
  13. Marinova, V.; Lin, S.H.; Hsu, K.Y. Photorefractive Properties Enhancement of Doped Bismuth Sillenite Crystals. Opt. Mem. Neural Netw. Inf. Opt. 2011, 20, 7–22. [Google Scholar] [CrossRef]
  14. Marinova, V.; Liu, R.C.; Lin, S.H.; Hsu, K.Y. Real-time holography in ruthenium-doped bismuth sillenite crystals at 1064 nm. Opt. Lett. 2011, 36, 1981–1983. [Google Scholar] [CrossRef]
  15. Binnemans, K. Interpretation of europium(III) spectra. Coord. Chem. Rev. 2015, 295, 1–45. [Google Scholar] [CrossRef] [Green Version]
  16. Hehlen, M.P.; Brik, M.G.; Krämer, K.W. 50th anniversary of the Judd-Ofelt theory: An experimentalist’s view of the formalism and its application. J. Lumin. 2013, 136, 221–239. [Google Scholar] [CrossRef]
  17. Shlegel, V.N.; Borovlev, Y.A.; Grigoriev, D.N.; Grigorieva, V.D.; Danevich, F.A.; Ivannikova, N.V.; Postupaeva, A.G.; Vasiliev, Y.V. Recent progress in oxide scintillation crystals development by low-thermal gradient Czochralski technique for particle physics experiments. J. Instrum. 2017, 12. [Google Scholar] [CrossRef]
  18. Shlegel, V.N.; Pantsurkin, D.S. Growth of Bi12GeO20 and Bi12SiO20 crystals by the low-thermal gradient Czochralski technique. Crystallogr. Rep. 2011, 56, 339–344. [Google Scholar] [CrossRef]
  19. Oberschmid, R. Absorption Centers of Bi12GeO20 and Bi12SiO20 Crystals. Phys. Status Solidi 1985, 89, 263–270. [Google Scholar] [CrossRef]
  20. Boutinaud, P. Revisiting the spectroscopy of the Bi3+ ion in oxide compounds. Inorg. Chem. 2013, 52, 6028–6038. [Google Scholar] [CrossRef]
  21. Timmermans, C.W.M.; Blasse, G. The Luminescence of Some Oxidic Bismuth and Lead Compounds. J. Solid State Chem. 1984, 52, 222–232. [Google Scholar] [CrossRef]
  22. Blasse, G.; Bril, A. Study of energy transfer from Sb3+, Bi3+, Ce3+ to Sm3+, Eu3+, Tb3+, Dy3+. J. Chem. Phys. 1967, 47, 1920–1926. [Google Scholar] [CrossRef]
  23. Blasse, G. The ultraviolet absorption bands of Bi3+ and Eu3+ in oxides. J. Solid State Chem. 1972, 4, 52–54. [Google Scholar] [CrossRef] [Green Version]
  24. Ofelt, G.S. Intensities of Crystal Spectra of Rare-Earth Ions. J. Chem. Phys. 1962, 37, 511–520. [Google Scholar] [CrossRef]
  25. Judd, B.R. Optical absorption intensities of rare-earth ions. Phys. Rev. 1962, 127, 750–761. [Google Scholar] [CrossRef]
  26. Carnall, W.T.; Crosswhite, H.; Crosswhite, H.M. Energy level structure and transition probabilities in the spectra of the trivalent lanthanides in LaF3. Energy 1978. [Google Scholar]
  27. Kolesnikov, I.E.; Povolotskiy, A.V.; Mamonova, D.V.; Kolesnikov, E.Y.; Kurochkin, A.V.; Lähderanta, E.; Mikhailov, M.D. Asymmetry ratio as a parameter of Eu3+ local environment in phosphors. J. Rare Earths 2018, 36, 474–481. [Google Scholar] [CrossRef]
  28. Li, N.; Xue, Y.; Wang, D.; Liu, B.; Guo, C.; Song, Q.; Xu, X.; Liu, J.; Li, D.; Xu, J.; et al. Spectroscopic properties of Eu:Bi4Ge3O12 single crystal grown by the micro-pulling-down method. J. Lumin. 2019, 208, 208–212. [Google Scholar] [CrossRef]
  29. Loiko, P.A.; Dashkevich, V.I.; Bagaev, S.N.; Orlovich, V.A.; Mateos, X.; Serres, J.M.; Vilejshikova, E.V.; Yasukevich, A.S.; Yumashev, K.V.; Kuleshov, N.V.; et al. Judd-Ofelt analysis of spectroscopic properties of Eu3+:KLu(WO4)2 crystal. J. Lumin. 2015, 168, 102–108. [Google Scholar] [CrossRef]
  30. Loiko, P.A.; Dashkevich, V.I.; Bagaev, S.N.; Orlovich, V.A.; Yasukevich, A.S.; Yumashev, K.V.; Kuleshov, N.V.; Dunina, E.B.; Kornienko, A.A.; Vatnik, S.M.; et al. Spectroscopic and photoluminescence characterization of Eu3+-doped monoclinic KY(WO4)2 crystal. J. Lumin. 2014, 153, 221–226. [Google Scholar] [CrossRef]
  31. Tian, Y.; Chen, B.; Hua, R.; Yu, N.; Liu, B.; Sun, J.; Cheng, L.; Zhong, H.; Li, X.; Zhang, J.; et al. Self-assembled 3D flower-shaped NaY(WO4)2:Eu3+ microarchitectures: Microwave-assisted hydrothermal synthesis, growth mechanism and luminescent properties. CrystEngComm 2012, 14, 1760–1769. [Google Scholar] [CrossRef]
  32. Kaczkan, M.; Turczyński, S.; Malinowski, M. Spectroscopic properties and Judd-Ofelt analysis of Eu3+ in Y4Al2O9 crystals. J. Lumin. 2018, 196, 111–115. [Google Scholar] [CrossRef]
  33. Liu, Y.; Luo, W.; Li, R.; Liu, G.; Antonio, M.R.; Chen, X. Optical spectroscopy of Eu3+ doped ZnO nanocrystals. J. Phys. Chem. C 2008, 112, 686–694. [Google Scholar] [CrossRef]
  34. Liu, L.; Chen, X. Energy levels, fluorescence lifetime and Judd-Ofelt parameters of Eu3+ in Gd2O3 nanocrystals. Nanotechnology 2007, 18, 255704. [Google Scholar] [CrossRef]
  35. Chen, X.Y.; Liu, G.K. The standard and anomalous crystal-field spectra of Eu3+. J. Solid State Chem. 2005, 178, 419–428. [Google Scholar] [CrossRef]
  36. Chu, Y.; Zhang, Q.; Li, Y.; Liu, Z.; Xu, J.; Zeng, H.; Wang, H. Hydrothermal synthesis of Bi4Ge3O12: Eu3+ phosphors with high thermal stability and enhanced photoluminescence property. J. Alloys Compd. 2017, 693, 308–314. [Google Scholar] [CrossRef]
  37. Smentek, L.; Kȩdziorski, A. F ←→ f electric dipole transitions; old problems in a new light. J. Alloys Compd. 2009, 488, 586–590. [Google Scholar] [CrossRef]
  38. Souza, A.S.; Oliveira, Y.A.R.; Couto dos Santos, M.A. Enhanced approach to the Eu3+ ion 5D07F0 transition intensity. Opt. Mater. (Amst.) 2013, 35, 1633–1635. [Google Scholar] [CrossRef]
  39. Burdick, G.W.; Downer, M.C.; Sardar, D.K. A new contribution to spin-forbidden rare earth optical transition intensities: Analysis of all trivalent lanthanides. J. Chem. Phys. 1989, 91, 1511–1520. [Google Scholar] [CrossRef]
  40. Tanaka, M.; Nishimura, G.; Kushida, T. Contribution of J mixing to the 5D07F0 transition of Eu3+ ions in several host matrices. Phys. Rev. B 1994, 49, 16917–16925. [Google Scholar] [CrossRef]
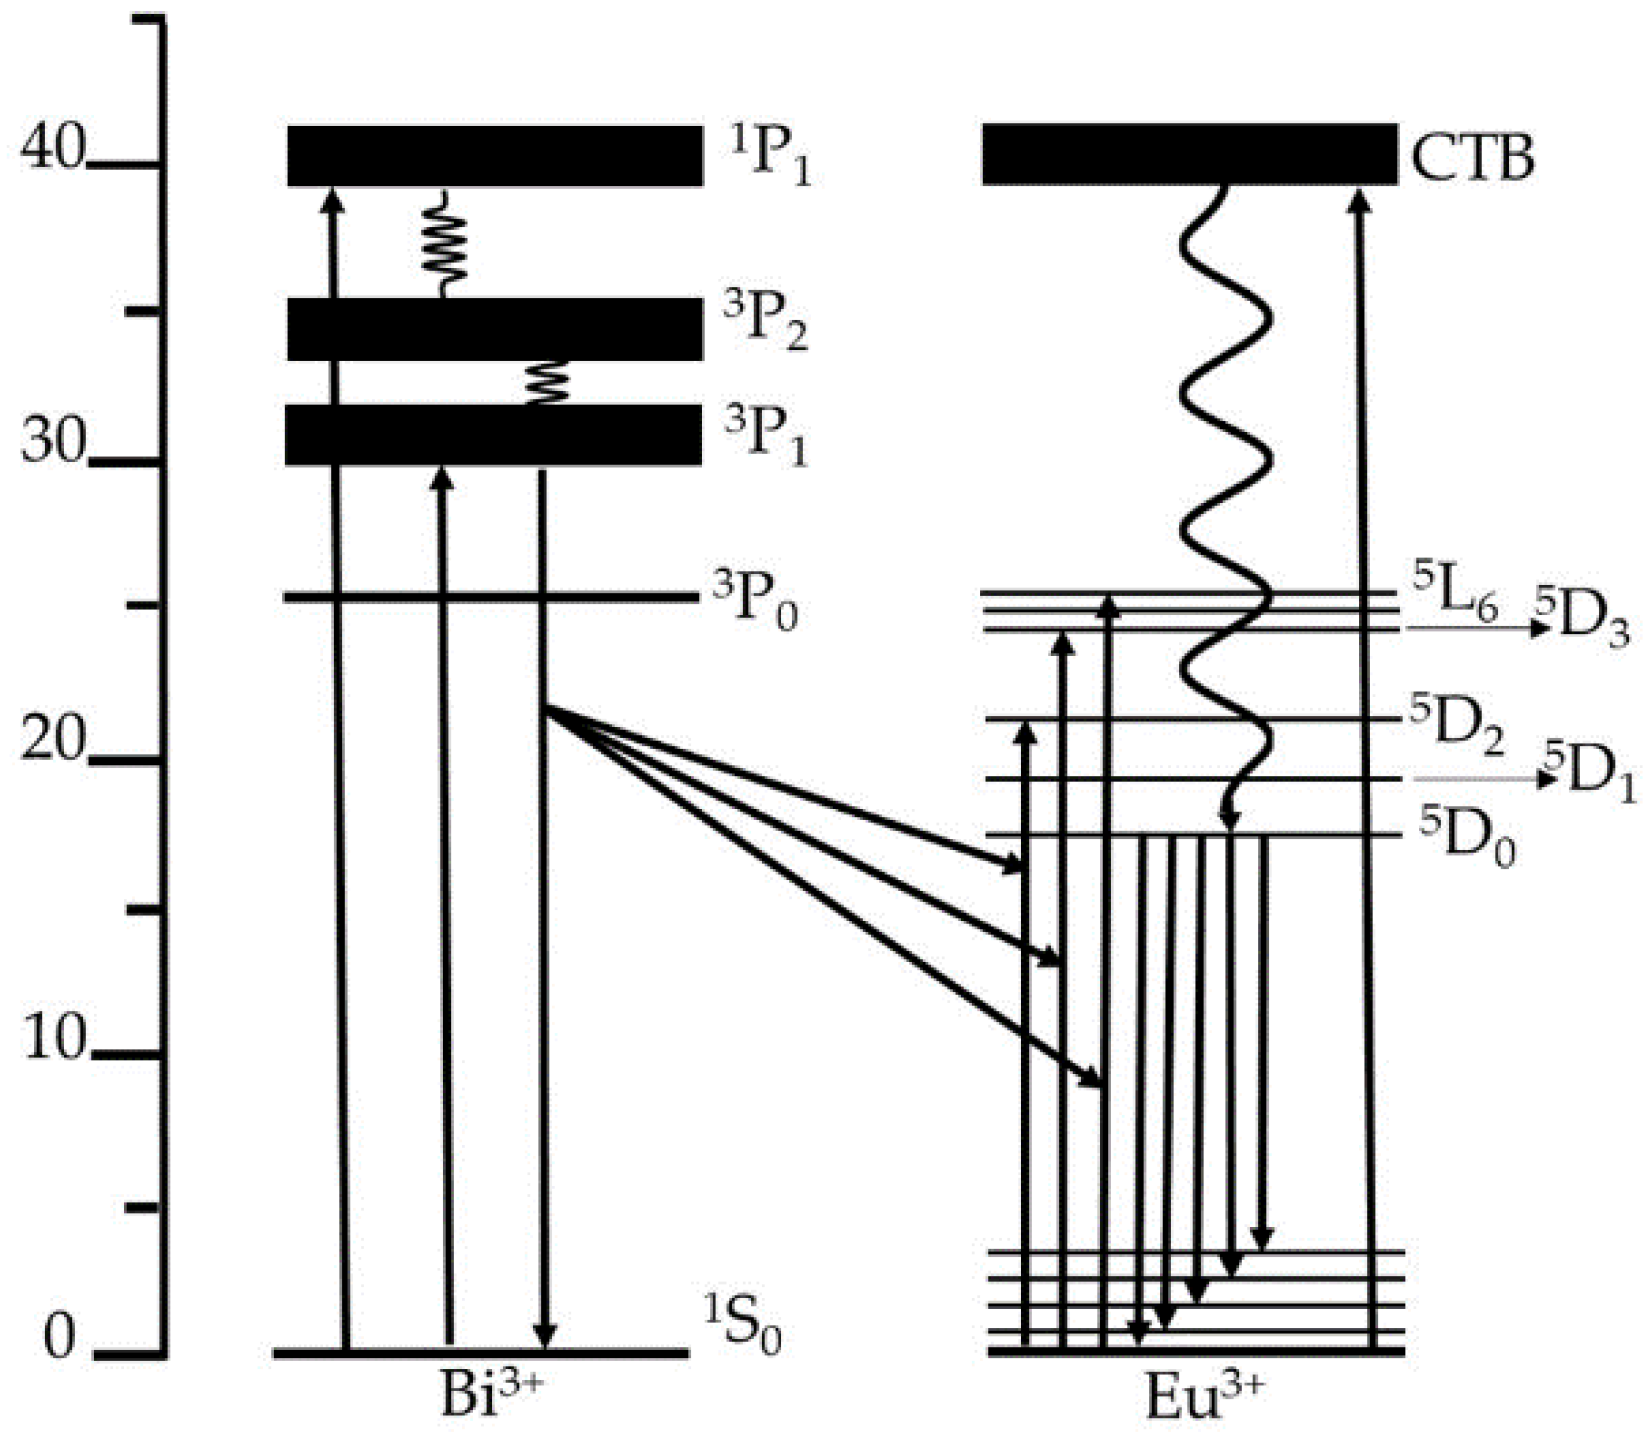
Figure 1. The partial energy diagram of Eu3+ and Bi3+ ions.
Crystals 10 00285 g001
Figure 2. Bi12GeO20 (BGO) crystal doped with 0.3 mol.% Eu3+.
Crystals 10 00285 g002
Figure 3. Absorption spectrum of BGO: 3% Eu3+ at T = 300 K.
Crystals 10 00285 g003
Figure 4. Low temperature (10 K) absorption spectrum where 5D07F0 line is shown.
Crystals 10 00285 g004
Figure 5. 5D0 level emission spectra of BGO: 3% Eu3+.
Crystals 10 00285 g005
Figure 6. 5D2 and 5D1 levels emission spectra of BGO: 3% Eu3+.
Crystals 10 00285 g006
Figure 7. The Bi3+ ion excitation and emission spectrum in BGO (T = 300 K).
Crystals 10 00285 g007
Figure 8. The emission profile of Eu:BGO as expressed in CIE 1976 color space.
Crystals 10 00285 g008
Figure 9. Bi3+ decay times relative to the Eu3+ concentration (measured at T = 300 K).
Crystals 10 00285 g009
Figure 10. BGO: 3% Eu3+ excitation decays originating from different levels at T = 10 K.
Crystals 10 00285 g010
Table 1. Comparison of asymmetry ratios in relation to doping concentration in different Eu3+:BGO samples.
Eu3+ Concentration (mol %)R Value
32.493
12.347
0.31.820
Table 2. The spontaneous emission probabilities, fluorescence branching ratios and asymmetry ratio of BGO: 3% Eu3+ calculated using the obtained Judd-Ofelt parameters.
Transitionλ (nm)Acalc(s−1)βcalc
5D07F057800
5D0→7F1584249.2580.2557
5D0→7F2614652.4590.6694
5D07F366000
5D07F470572.9550.0748
5D07F5---
5D07F6---
Σ 974.6721
Ω2 = 3.12224 × 10⁻²⁰ cm2
Ω4 = 0.77412 × 10⁻²⁰ cm2
τcalc = 1025.9 μs
Table 3. The comparison of Judd-Ofelt parameters in different Europium doped hosts.
CompoundΩ2 (10−20 cm2)Ω4 (10−20 cm2)Ω6 (10−20 cm2)Reference
Bi12GeO203.120.77-This work
Bi4Ge3O124.392.700.64[28]
KLu(WO4)220.765.237.96[29]
KY(WO4)236.7011.503.40[30]
NaY(WO4)28.611.120.47[31]
Y4Al2O95.652.622.63[32]
LaF31.191.160.39[33]
YAlO32.666.330.80[33]
ZnO9.598.110.25[33]
Y2O39.862.230.32[33]
Gd2O312.392.020.19[34]