Article

Crystal Chemistry and Luminescence Properties of Eu-Doped Polycrystalline Hydroxyapatite Synthesized by Chemical Precipitation at Room Temperature

1
Istituto di Cristallografia, IC-CNR, Via G. Amendola, 122/O, 70126 Bari, Italy
2
Dipartimento di Scienze della Terra e Geoambientali, Università di Bari, via E. Orabona 4, 70125 Bari, Italy
3
Istituto di Nanotecnologia, NANOTEC-CNR, Dipartimento di Chimica, Università di Bari, via E. Orabona 4, 70123 Bari, Italy
4
FIMIF, University Polytechnic of Tirana, 1000 Tirana, Albania
5
Dipartimento di Scienze, Università Roma Tre, Largo S. L. Murialdo 1, Rome 00146, Italy
6
Istituto di Cristallografia, IC-CNR, Via Salaria Km 29.300, 00016 Monterotondo (Rome), Italy
*
Author to whom correspondence should be addressed.
Crystals 2020, 10(4), 250; https://doi.org/10.3390/cryst10040250
Submission received: 13 March 2020 / Revised: 24 March 2020 / Accepted: 26 March 2020 / Published: 27 March 2020

Abstract

:
Europium-doped hydroxyapatite Ca10(PO4)6(OH)2 (3% mol) powders were synthesized by an optimized chemical precipitation method at 25 °C, followed by drying at 120 °C and calcination at 450 °C and 900 °C. The obtained nanosized crystallite samples were investigated by means of a combination of inductively coupled plasma (ICP) spectroscopy, powder X-ray diffraction (PXRD), Fourier Transform Infrared (FTIR), Raman and photoluminescence (PL) spectroscopies. The Rietveld refinement in the hexagonal P63/m space group showed europium ordered at the Ca2 site at high temperature (900 °C), and at the Ca1 site for lower temperatures (120 °C and 450 °C). FTIR and Raman spectra showed slight band shifts and minor modifications of the (PO4) bands with increasing annealing temperature. PL spectra and decay curves revealed significant luminescence emission for the phase obtained at 900 °C and highlighted the migration of Eu from the Ca1 to Ca2 site as a result of increasing calcinating temperature.

1. Introduction

Among calcium phosphate materials employed in biomedical applications [1], hydroxyapatites Ca10(PO4)6(OH)2 (HAp) are widely investigated owing to their biocompatibility, bioactivity and osteoconductivity, which is due to their analogy with the mineral components of natural bones [2]. HAp is well known to allow substitutions at both cationic and anionic sites of the structure [3]; this flexibility gives rise to many synthetic biomaterials, although its low resorption rate may be responsible, in some cases, for complications in its applications for bone repair [2]. For this reason, pure HAp is usually employed in bone grafts and fillers [4]. HAp, in which rare earth cations (RE) partially replace calcium ions show significant luminescent properties [5], resulting in a growing interest in apatite as a biomaterial compatible with living tissues [6], a property that has been recently studied for another class of compounds, i.e., β-tricalcium phosphate (TCP) optical materials doped with different RE cations, from La (Z = 57) to Lu (Z = 71) [7,8].
Rare earth-doped HAps are suitable as photoluminescent probes in biological imaging, because of their excellent biocompatibility and biodegradability. They show improved features in comparison with other optical probes, having been successfully applied in the fluorescence imaging of cells [9]. In this context, Eu-doped HAp has been revealed to be the most efficient luminescent material, due to the presence of Eu3+ ion which possesses non-degenerate ground (7F0) and emitting (5D0) states, giving rise to favorable transitions [10]; it is because of this feature that a large number of Eu-HAps employed as luminescent biomaterials have been produced. [11,12,13]. Notably, amorphous Eu-HAp, has been also investigated as a new kind of promising biomaterial with the double function of both luminescence and drug delivery medium [14].
Over the past decade, several methods for obtaining luminescent inorganic hydroxyapatite have been developed, including coprecipitation and sol–gel synthesis, which allow adjustment of the particles’ morphology, size, structure, and composition, in order to modulate their physical and chemical properties [15]. In this work, we describe the synthesis of nano-sized crystallites of Eu-doped HAp (3% mol of Eu), and propose an improved synthesis procedure, based on an optimized chemical-precipitation method at 25 °C, followed by drying (5 h at 120 °C) and calcination stages (first at 450 °C for 2 h, then at 900 °C for another 2 h), using the well-known procedures traditionally used for apatites [16,17,18]. The concentration used for Eu doping takes into consideration the suggestions of different authors [19,20], as well as the fact that when over-doping at higher values (e.g., 4–5%) quenching phenomena are observed, causing the breakdown of the emission [2,21], and therefore the utility for luminescent applications is lost. Resulting stoichiometries were confirmed by Inductively Coupled Plasma (ICP) analysis. The effect of the substitution of europium for calcium in the HAp structure was examined by combining Powder X-Ray Diffraction (PXRD) for structure solution and Rietveld refinement and Fourier Transform Infrared (FTIR) and Raman spectroscopies. Finally, the photoluminescence (PL) properties of Eu-doped materials were investigated.

2. Experimental

Europium-doped hydroxyapatite powders were prepared by the chemical-precipitation method at 25 °C and pH = 10 (Eutech Instruments, CyberScan pH1100 with XS Standard HA S7 pH electrode). All chemicals used were purchased from Sigma–Aldrich St Louis, Missouri, MO, USA, with purity higher than 99%. A mixture of Ca(NO3)2·4H2O (MW = 236 g/mol, 17% Ca), Eu(NO3)3·5H2O (MW = 132 g/mol, 23.46% P) and (NH4)2HPO4 (MW = 132 g/mol, 23.48% P) was employed as the starting material; NaOH was used for pH adjustment (semiconductor-grade pellets, purity > 99.99%).
Ultrapure water (conductivity of 0.055 µS/cm at 25 °C) obtained by a Millipore milliQ® Integral 3 Water Purification System) was used; (NH4)2HPO4 was dissolved to obtain 37 mL of solution 0.6 mol/L (0.0222 moles of P, pH 8.15(5)) into a three-neck round-bottomed flask made of Pyrex, and stirred at 400 rpm; meanwhile the pH of phosphorous-containing solution was adjusted at 10.00(5) with NaOH 2 mol/l and stirred. A solution of 50 mL of Ca(NO3)2 and Eu(NO3)3 (0.0359 moles of Ca + 0.0011 moles of Eu, providing a molar ratio Eu/(Ca + Eu) = 0.0299 ≅ 3%) was added drop by drop at 2.5 mL/min by peristaltic-pump and stirred constantly with pH adjusted at 10.00 ± 0.05 in order to minimize the formation of secondary phases and to prevent the aggregation of the particles during their formation [9]; after 20 min of reaction and precipitation, the solution was aged at 25 °C under atmospheric pressure to inhibit increase of the average size of the particles, and stirred at 400 rpm for 24 h (initial Ca + Eu/P = 1.67) [9]. The precipitates were centrifuged at 10,000 rpm for 5 min, washed and centrifuged five times with deionized water with 5% v·v−1 of ethanol using liquid–liquid ratio equal to one. Undoped HAp (sample HAp900) has been prepared for comparison with Eu-doped analogues by chemical-precipitation at 25 °C (pH = 10), and calcinated at 900 °C according to the following reaction [22]:
10Ca(NO3)2 + 6(NH4)2HPO4 + 20NaOH → Ca10(PO4)6(OH)2 + 20NaNO3 + 12NH3 + 18H2O
After adding of Eu(NO3)3·5H2O, doped HAp samples were dried at 120 °C for 5 h (sample Eu-HAp120), calcinated at 450 °C for 2h (sample Eu-HAp450) and 900 °C for 2 h (sample Eu-HAp900), in order to obtain different modes of crystallization. Their resulting crystal formulae are expressed as Ca10−xEux(PO4)6(OH)2−xOx so that the charge balance generated by the Eu3+ replacing Ca2+ is achieved.
The chemical composition of analyzed powders was obtained by dissolution in acid solution and analysis by Inductively Coupled Plasma-Optical Emission Spectrometry (ICP-OES, PerkinElmer oPTIMA 2000™ DV, Co. Ltd., Shelton, CT, USA) with spray chamber, cross-flow nebulizer and high-speed scanning CCD-based sequential ICP-OES system. The samples, after drying, were in the weight range of 130 ~ 170 mg, and were dissolved in a 5 mL of 65% (v·v−1) nitric acid and ultrapure water (100 mL). Aliquots of each of these solutions were diluted and brought to volume in a 100 mL volumetric flask containing the internal standard (1 mg·Kg−1 of yttrium) in a 3% (v·v−1) nitric acid. The calibration was checked using the external standard method with multi-element (Ca, P and Eu) solutions ranging from 0.01 to 50 mg·L−1 in a 3% (v·v−1) nitric acid aqueous solution with correlation coefficient R2 > 0.9999 and RSD < 5%. All samples were analyzed in triplicate. Table 1 reports results of ICP analysis.
Powder XRD data were collected at room temperature by using an automated Rigaku RINT2500 diffractometer (50 KV, 200 mA) equipped with the silicon strip Rigaku D/teX Ultra detector. An asymmetric Johansson Ge (111) crystal was used to select the monochromatic Cu Kα1 radiation (λ = 1.54056 Å). The main acquisition parameters are reported in Table 2. The angular range 8–100° (2θ) was scanned with a step size of 0.02° (2θ) and counting time of 4 s/step. Measurements were executed in transmission mode by introducing the sample within a glass capillary with a 0.3 mm internal diameter and mounted on the axis of the goniometer. A capillary spinner was used during measurements to reduce effects of preferred orientation of crystallites. The determination of the unit cell parameters, the identification of the space group, the structure solution, and the model refinement via the Rietveld method [23] were carried out by EXPO2013 software [24], a package able to automatically execute the full pathway of the powder solution process.
Powder FTIR spectra were collected on a Nicolet iS50 FTIR spectrometer equipped with a DTGS detector and a KBr beam splitter; nominal resolution was 4 cm−1 and 64 scans were averaged for both sample and background. The HAp samples were prepared as KBr disks, by mixing 1 mg of sample with 200 mg of KBr.
Micro-Raman spectra were acquired by means of a LabRAM HR Evolution spectrometer equipped with a binocular Olympus microscope, a He-Ne laser (632 nm), an Ultra-Low Frequency (ULF) filter, 600 and 1800 g/mm gratings, and a Peltier-cooled CCD detector. Spectra were collected on pressed powders of the HAp samples using a 100x objective, an exposure time of l20 s and averaging 3 repeated acquisitions. Spectra were calibrated using the 520.5 cm−1 line of a silicon wafer.
Photoluminescence analysis was achieved on a LabRAM HR Horiba–JobinYvon spectrometer with a 532 nm excitation laser source. Measurements were performed at room temperature and the luminescence signal was collected using an objective lens magnification of 50x.

3. Results and Discussion

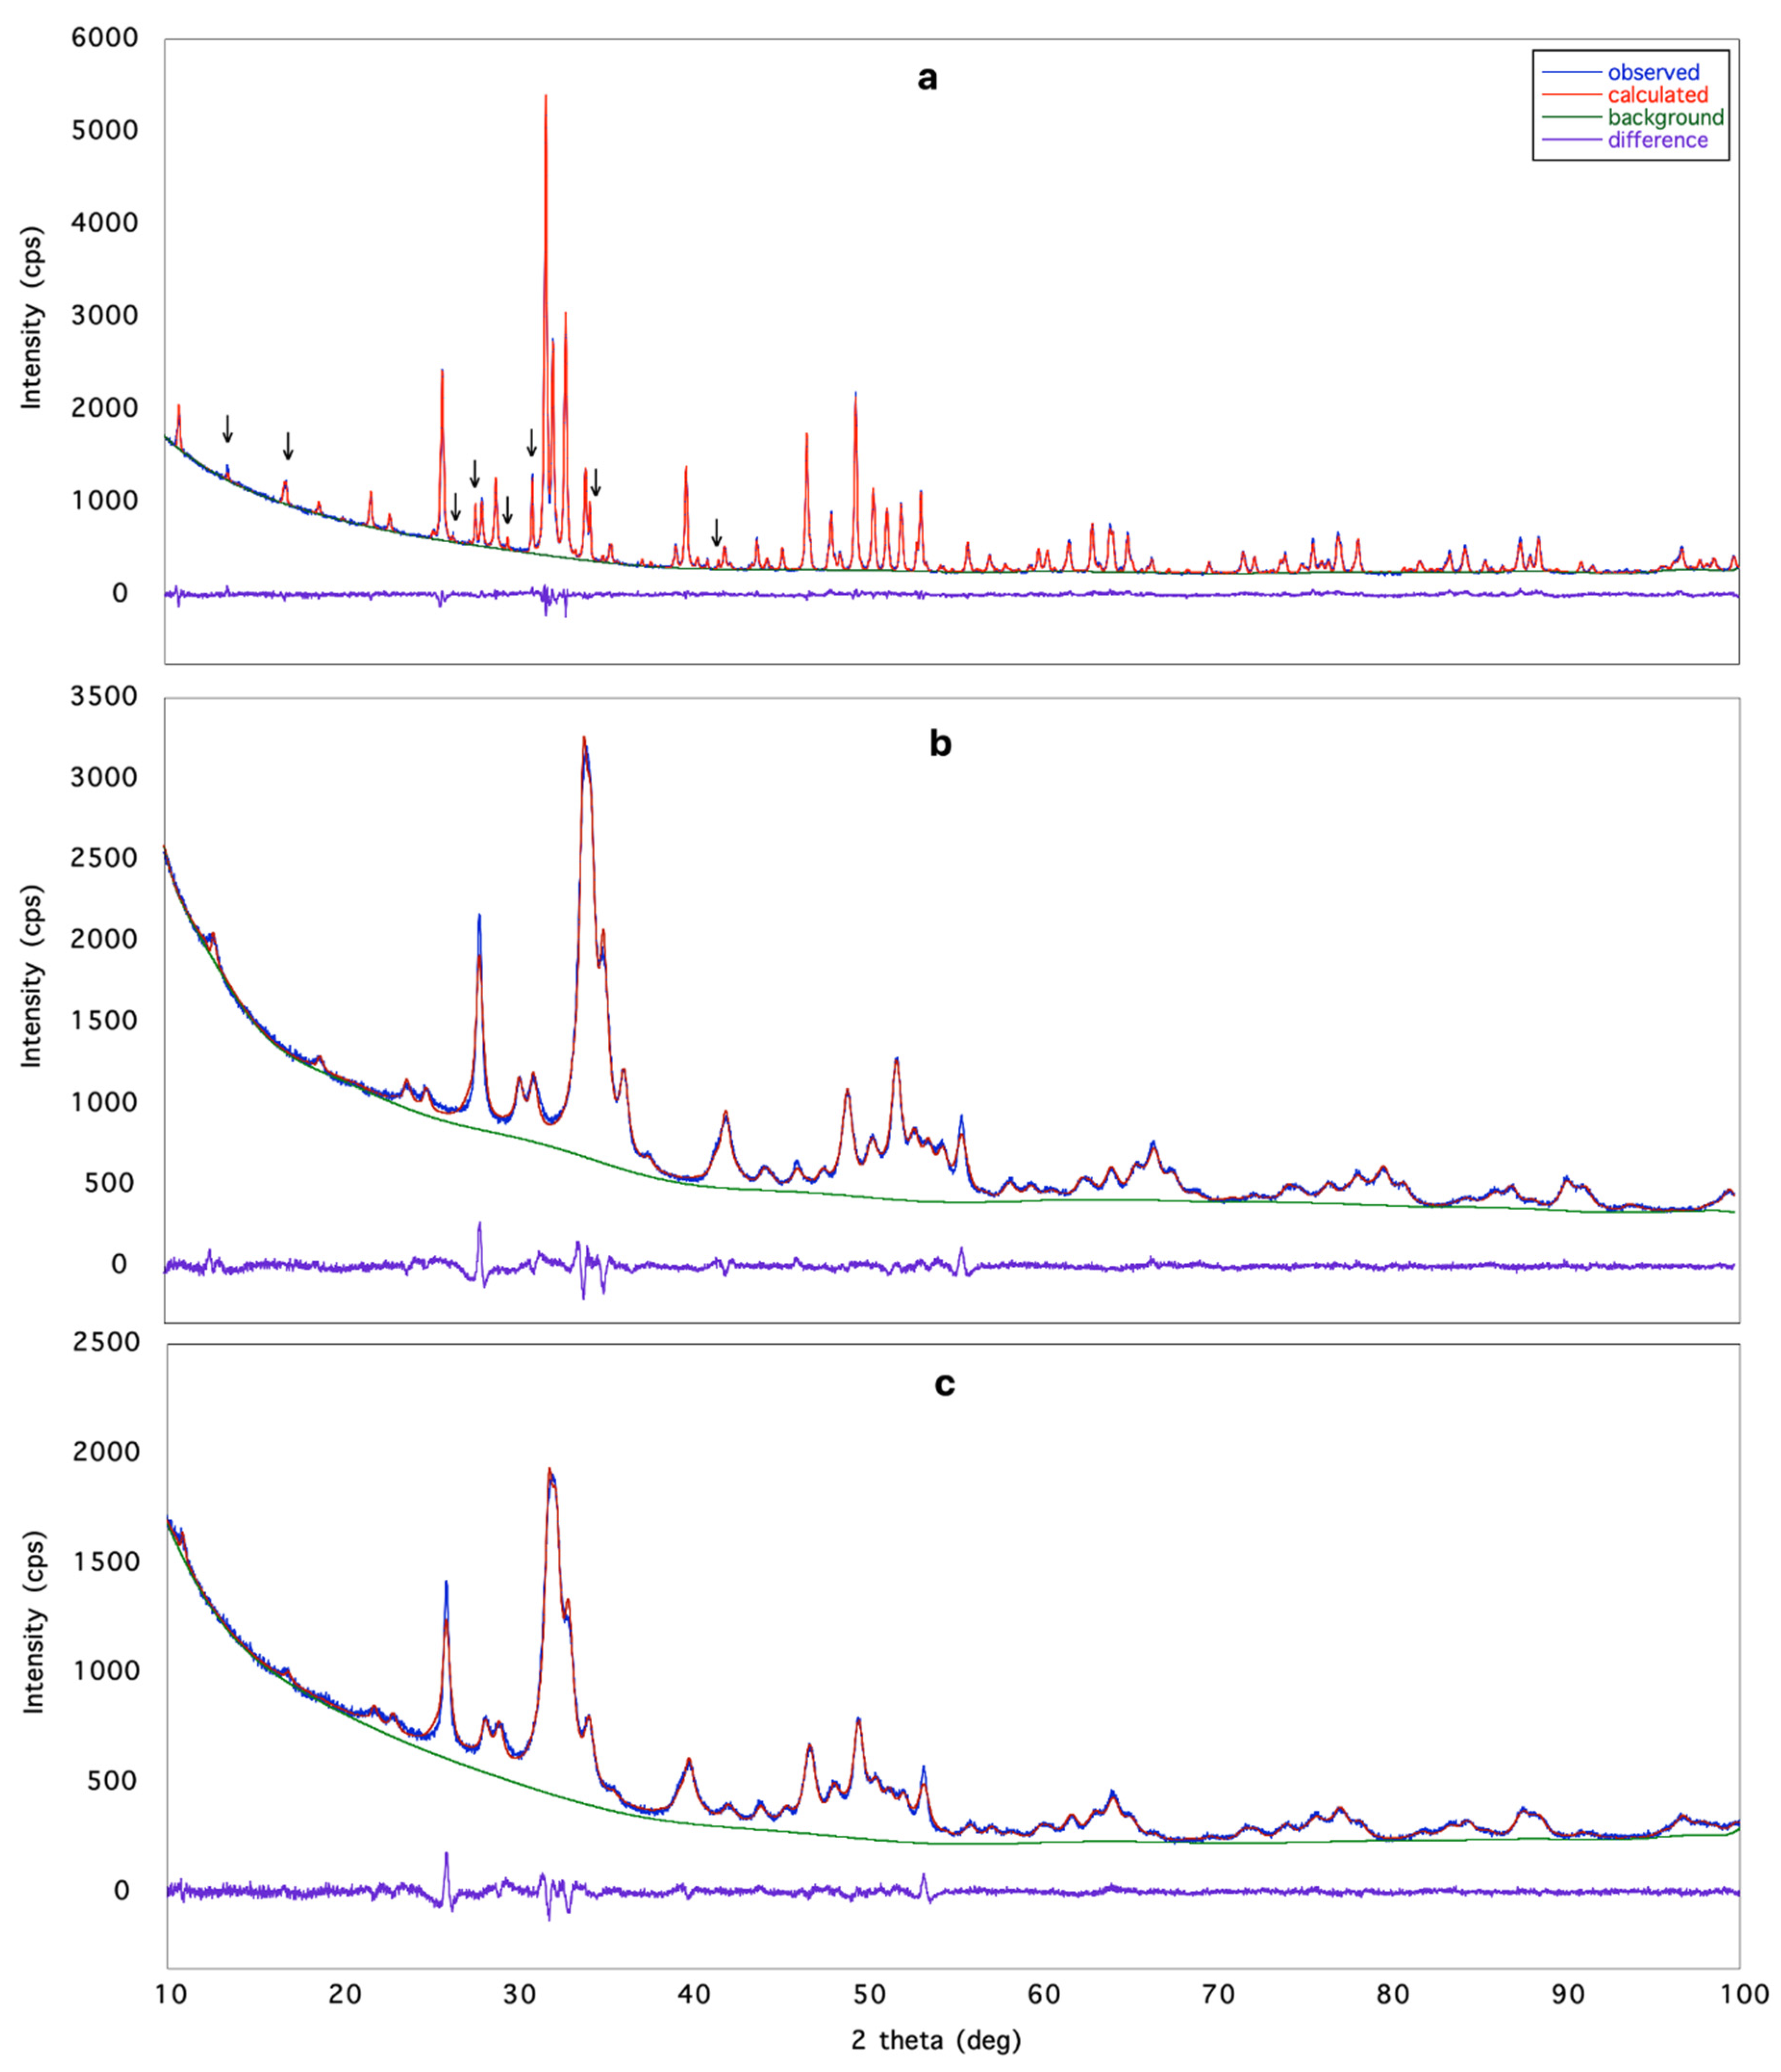
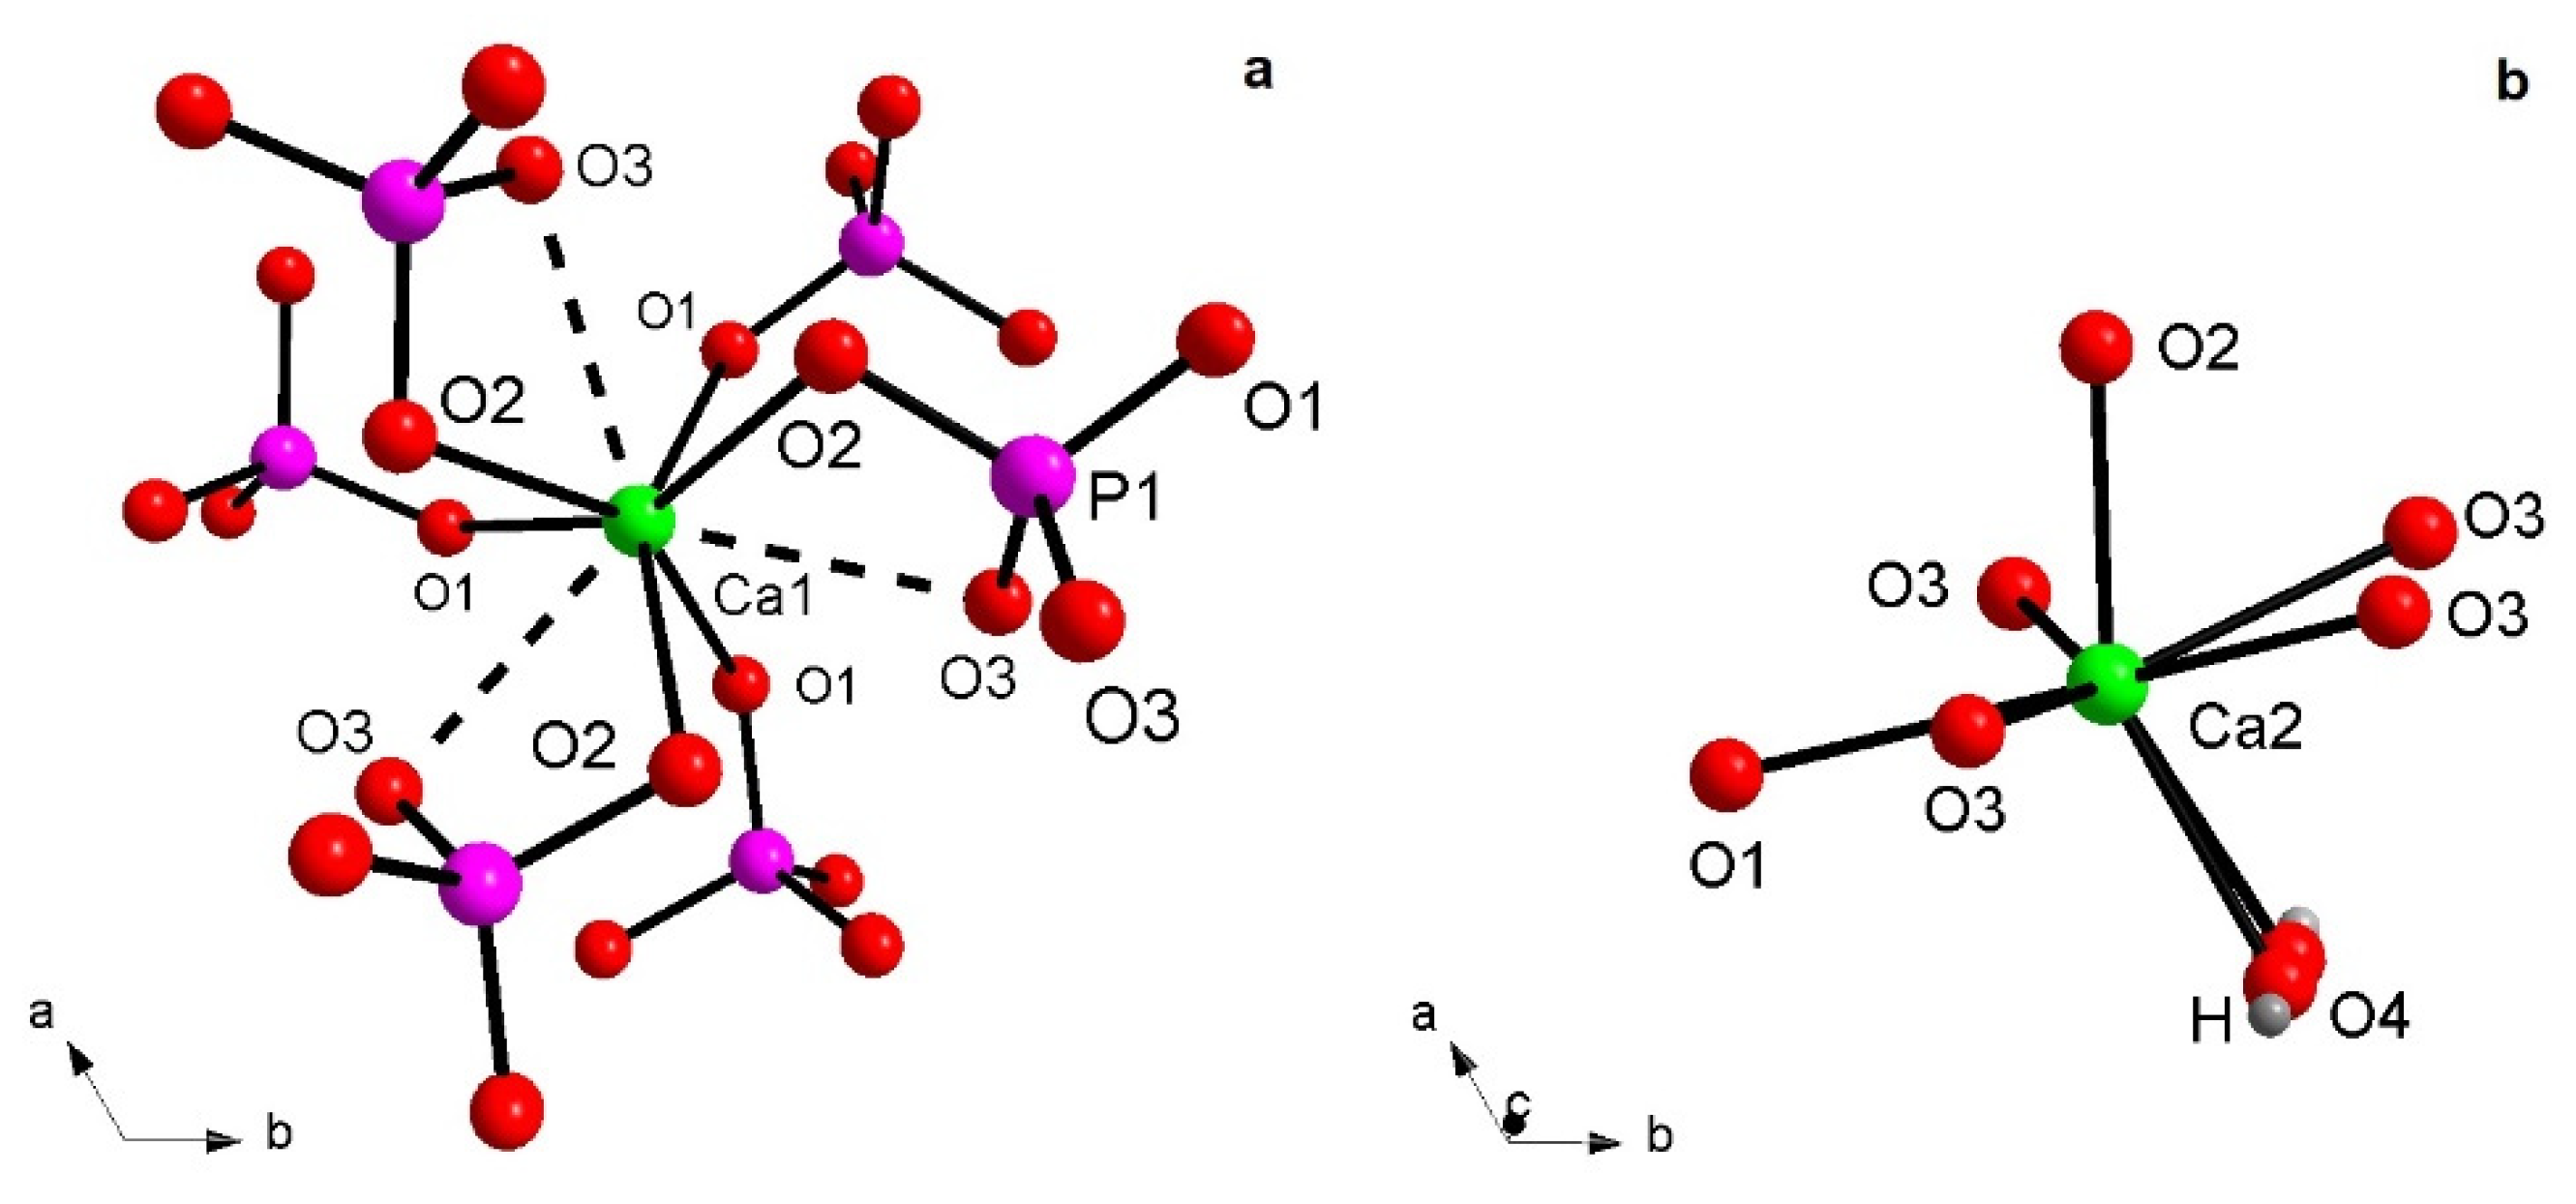
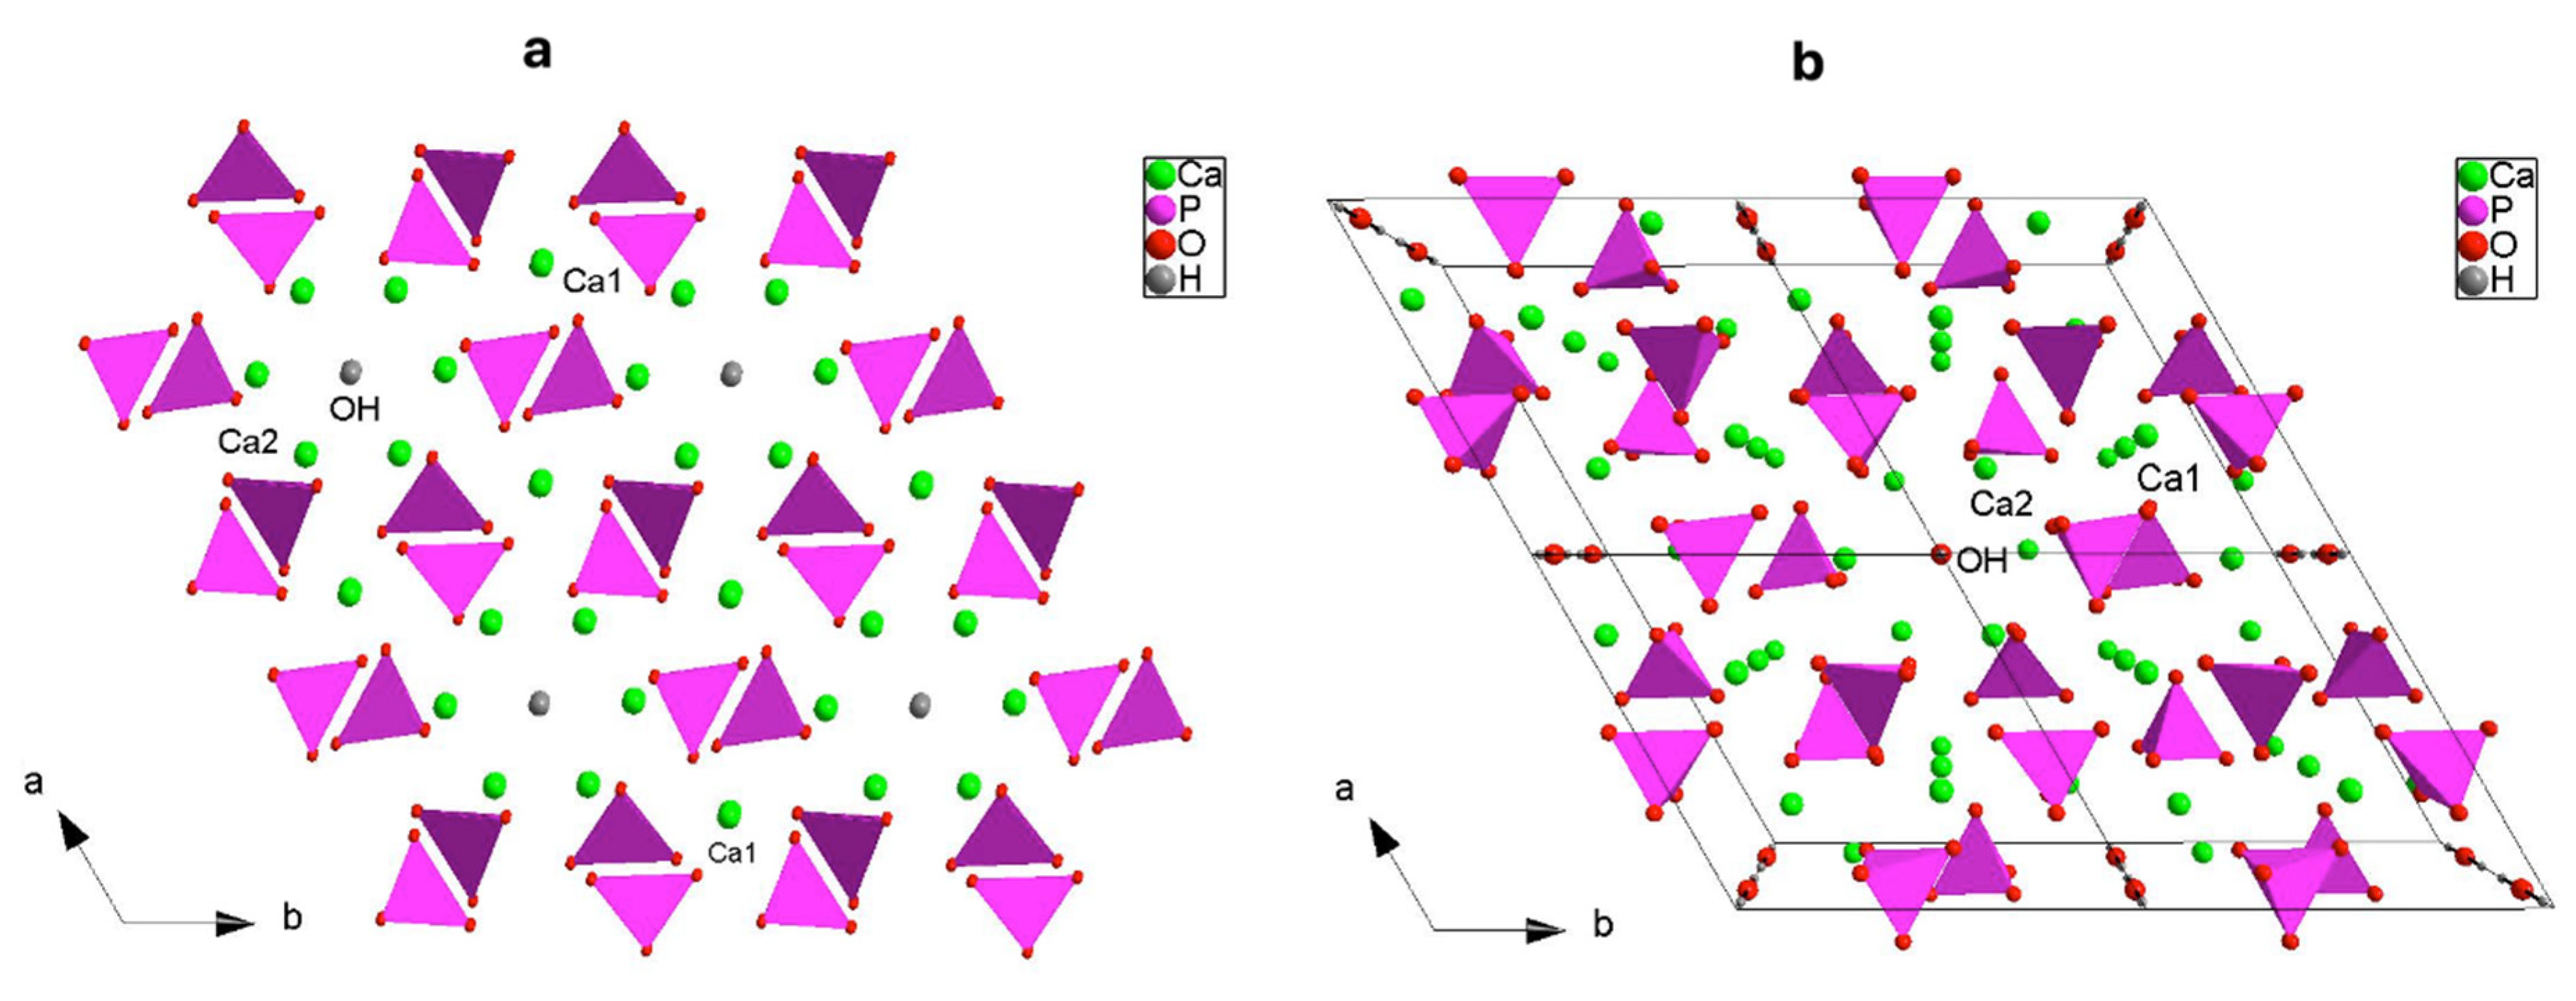
3.1. X-ray Structural Study

For each compound under investigation, crystal structure solution steps, from indexing to structure model refinement, were performed using the EXPO2013 software [24], a package able to automatically execute the full pathway of the powder solution process. The indexing of the powder diffraction patterns was obtained through the N-TREOR09 computer program [25] integrated in EXPO2013. Crystallite size (nm) was evaluated from the 2θ peak = 25.86° and calculated according to the Debye–Scherrer formula τ = Kλ/βcosθ. Crystallinity (%) was achieved according to [26]. Results are reported in Table 3.
The space group determination step, executed by using the powder pattern of Eu-HAp900 gave the most common hexagonal P63/m space group of apatite [27,28,29]. The possibility of the monoclinic (pseudo-hexagonal) P21/b space group, also reported in literature [30], was not considered for two reasons: (1) it is much less frequent; (2) XRPD is not able to distinguish between the two space groups P63/m and P21/b of apatite. The same result was obtained for HAp900, Eu-HAp120 and Eu-HAp450. A crystal structure solution was obtained via the ‘Direct Methods’ procedure in EXPO2013 for the sample with the highest crystallinity, Eu-HAp900, confirming the model reported in [27]. The model was refined by the Rietveld method, and different possible distributions of Eu on both calcium sites were tested. The crystal structures of the other three samples were refined based on the model obtained for Eu-HAp900. In particular, the low crystallinity of samples Eu-HAp120 and Eu-HAp450 did not allow solving of their crystal structure. For these samples, the refinement process using the Eu-HAp900 model was managed as for Eu-HAp900 and provided results confirming the expected trend. Detailed results are given in Table 4. The following working strategy was applied for avoiding refinement instability: in the sites shared by Ca and Eu, the position and the atomic displacement parameter of both occupants were constrained to be equal, and the sum of Ca and Eu occupancies was fixed to 1.00; no further restraint was used for OH occupancy in order to assure charge balance; a weak positive charge was observed in the doped phase. In the powder pattern of sample Eu-HAp900, some unindexed peaks were detected after the structure refinement of the HAp phase; these were assigned to the Ca3(PO4)2 (TCP) phase [31], which was included in the calculations but not refined; quantitative phase analysis carried out by EXPO2013 gave HAp 88.9% and TCP 11.1% in the sample. This result is in agreement with the finding of [32,33] who reported partial dissociation of HAp into TCP at about 900 °C, and with previous investigations on TCP [7,34]. Crystal structure refinements data are reported in Table 2, while in Figure 1 the agreement between the observed (blue line) and the calculated (red line) diffraction pattern is displayed together with the difference pattern plotted on the same scale (violet line) and background (green line) for sample Eu-HAp900 (a), Eu-HAp450 (b) and Eu-HAp120 (c). Arrowed peaks correspond to the TCP phase(a).
Structural sites of HAp are those known for hexagonal P63/m HAp, with Ca1, Ca2 and P1 occupying special positions, as well as O1, O2; O3 is the only atom in a general position, while an additional discussion is worthwhile for the OH group, which is on the 4e special position. The apatite group comprises three main species, fluoro-, chloro- and hydroxyapatite [28]; in fluoro-apatite the F atom is at special position 2a, corresponding to the intersection of 6 ¯ axis and mirror planes at z = ¼ and z = ¾. Each F anion is bound with three symmetry-related Ca2 cations, lying at the same z level for symmetry reasons. Considering the larger size of Cl and OH groups with respect to the F anion, a simple solid solution within the 2a site is unfeasible [3], because of the longer Ca–Cl and Ca–O bond distances. Therefore, Cl and OH anions occupy the split 4e sites above or below the mirror planes and show a disordered site distribution (Table 4). This arrangement causes a local deviation from the P63/m symmetry, with the loss of the mirror plane, because only one of the two mirror-related anion sites is occupied. However, because each mirror-related site is half occupied, the average P63/m symmetry is preserved [3]. Such behavior of the OH anion is also observed in our synthetic HAp phases, being the oxygen placed in the 4e site, disordered over and under the mirror plane; the Rietveld refinement allowed location of the hydroxyl proton, with a resulting O–H distances of 0.95 Å, in good agreement with [35].
All HAp samples refined here show Ca atoms engaged in complex coordination; Ca1 is involved in a CaO6 metaprism (a solid figure intermediate between an octahedron and trigonal prism, Figure 2a), because of the ternary axes which generate two groups of three bonds each related by symmetry, i.e., Ca1–O1 with distances ranging from 2.403(4) Å (HAp900) up to 2.444(5) Å (Eu-HAp120 and Eu-HAp450) and Ca1–O2 with distances ranging from 2.399(7) (Eu-HAp120) up to 2.460(4) (Eu-HAp900). It is worth noting a third group of three interactions Ca1…O3, slightly outside the bonding sphere of Ca, with distances >2.80 Å; actually, in many apatites the Ca1 polyhedron is described as nine-coordinated [28,36,37]. Ca2 shows a CaO6(OH) geometry (Figure 2b), resembling a distorted CaO7 pentagonal bipyramid with an equatorial plane occupied by O1 atom and two couples of symmetry-related O3 atoms, and vertices occupied by O2 atom and OH group (corresponding to O4 atom). Thus, the main structural modifications in hydroxyapatites, with respect to F- and Cl-apatites, are due to the anion substitution connected to Ca2 atom. The shorter bond distance of the Ca2-polyhedron is usually represented by Ca2–OH, from 2.343(2) Å (Eu-HAp900) up to 2.365 Å (Eu-HAp120), whereas the longest one is represented by Ca2–O1, ranging from 2.576(9) Å (Eu-HA450) up to 2.701(5) Å (Eu-HAp900) (Table 5). We note that the Ca2–O distances tend to decrease with increasing annealing temperature in the Eu-doped phase. In all the cases, all Ca–O distances are in good agreement with those observed in HAp [36,37] or generally in calcium phosphates [7,8,34]. The P–O distances within the P tetrahedron range from 1.495(7) Å to 1.587(12) Å (both in Eu-HAp450, Table 5) are in good agreement with similar P–O bond distances as found in powder X-ray structures from the Inorganic Crystal Structure Database [38].
A careful analysis of cation site occupancy factors (s.o.f.) shows that Eu3+ ions occupy, in the doped samples, the Ca1 positions for the lower-temperature annealed samples Eu-HAp120 (s.o.f.: Ca0.96Eu0.04) and Eu-HAp450 (s.o.f.: Ca0.97Eu0.03). This is in agreement with [39], although different from the sample annealed at high-T (Eu-HAp900), where Eu occupies Ca2 (s.o.f.: Ca0.98Eu0.02), which is found to be true for most Eu-doped HAps [13,29]. As observed above, the shortening of Ca2–O distances (Table 5) for increasing annealing temperature, may induce the migration of europium from the Ca1 to the Ca2 site, as observed in many HAp structures found in the Inorganic Crystal Structure Database [38]. An important observation is that, considering that the (OH) groups occupy one of the vertices of the Ca2O7 pentagonal bipyramid, the coupled (OH) → O2− and Ca22+ → Eu3+ substitution tends to increase the energy of the (CaEu)–OH bond, thus balancing the increasing positive charge in a minimum volume [36]. The bond valence analysis [40] based on the refined structural data, performed by EXPO2013, indicates a weak decrease of the bond-valence sum at Ca1 for increasing temperature of annealing, i.e., 2.03 valence units (v.u.) for Eu-HAp120, 2.03 v.u. for Eu-HAp450 and 2.01 v.u. for Eu-HAp900. Meanwhile for Ca2, the bond-valence sum increases with increasing annealing temperature, i.e., 2.08 v.u. for Eu-HAp120, 2.18 v.u. for Eu-HAp450, and 2.28 v.u. for Eu-HAp900, in accordance with the migration of Eu3+ from Ca1 to Ca2, a feature already observed by [41].
To describe the hexagonal P63/m HAp structure, we can better write the crystal formula as [Ca(1)4Ca(2)6](PO4)6(OH)2, which underlines the two cationic sites [42]; a close inspection, indeed, suggests that HAp shows a zeolitic character where the framework consists of columns of face-sharing Ca1O6 metaprisms corner-connected to six different PO4 tetrahedra down [001] making up [Ca(1)4(PO4)6]10− anionic moieties (Figure 2a); this network results in one-dimensional hexagonal tunnels occupied by [Ca(2)6(OH)2]10+ counter-ions (Figure 3a,b). The strong Ca1…O3 interactions discussed above (Figure 2, Table 5), further stabilize the structure (Figure 3b).

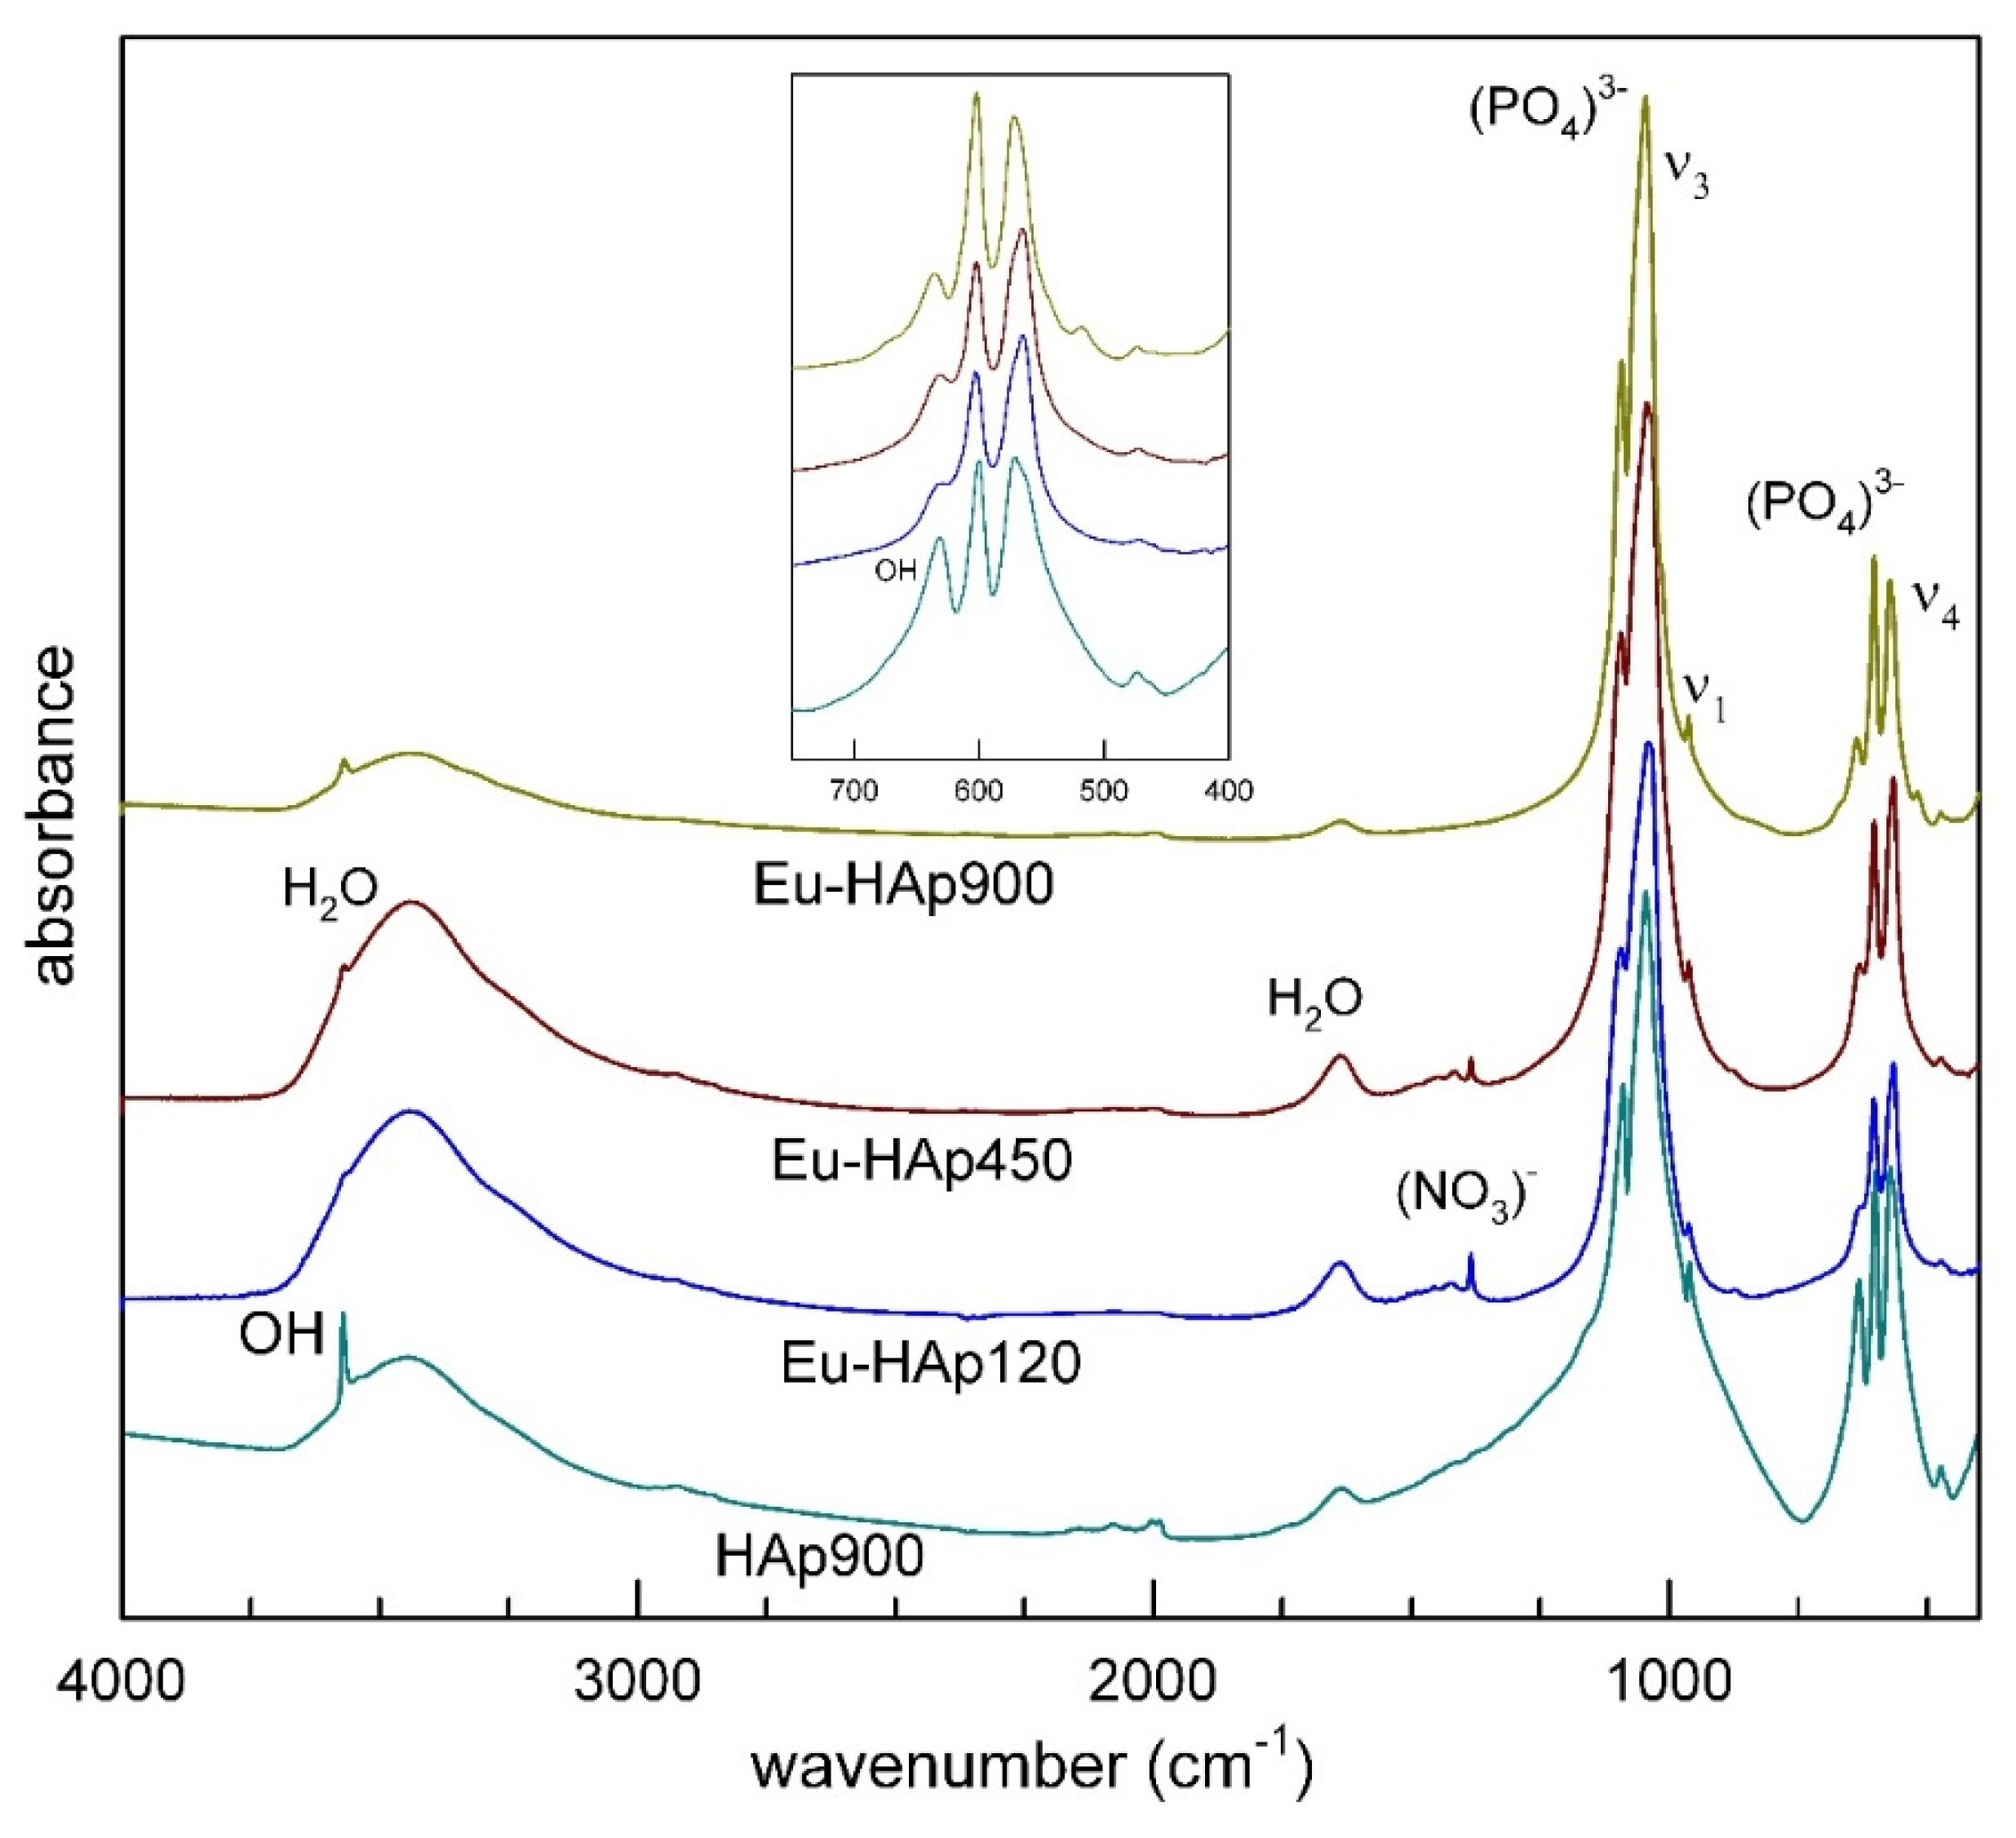
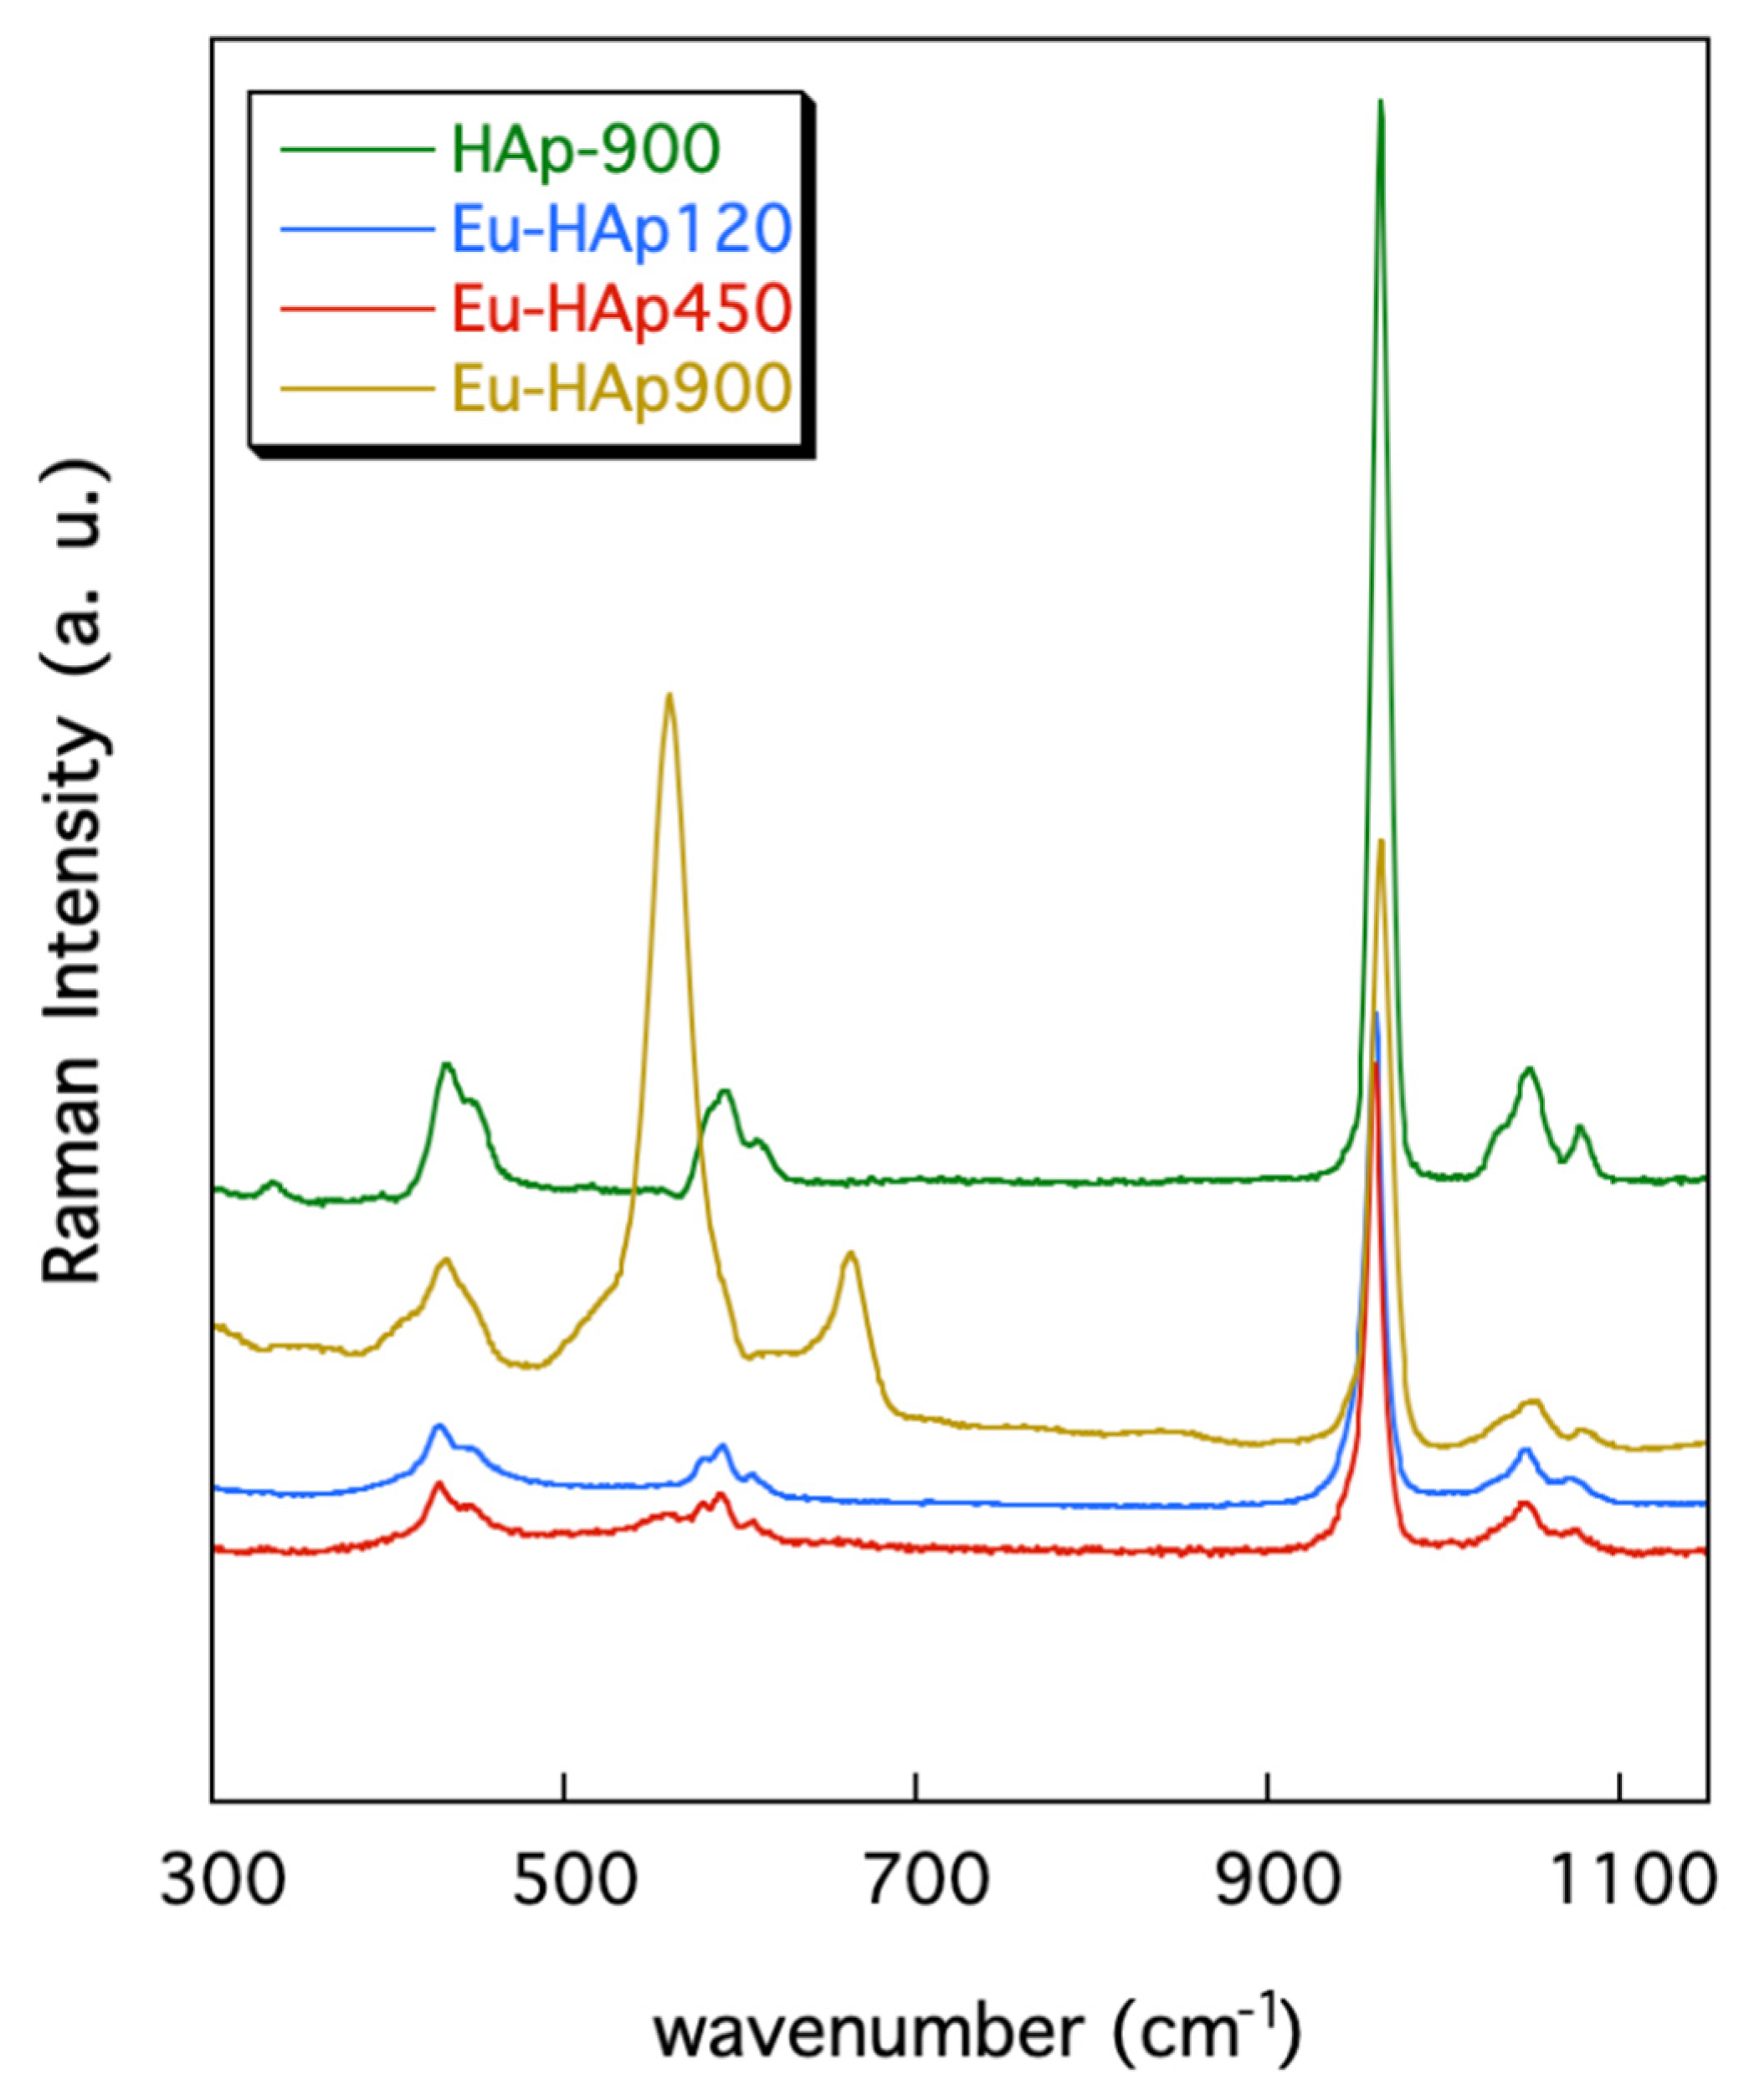
3.2. FTIR and Raman Spectroscopy

There is a vast and exhaustive literature on the interpretation of the vibrational (FTIR and Raman) spectra of HAps (see [43,44,45,46] among others). Phosphorous compounds typically show a strong molecular character with respect to their vibrational properties, therefore both FTIR and Raman spectra are dominated by internal PO43− modes. Analysis of K3PO4 in aqueous solutions [46] shows that the free phosphate ion has four modes of vibration: the symmetric stretching ν1(A1) at 980 cm−1, the symmetric bending ν2(E) at 420 cm−1, the antisymmetric stretching ν3(F2) at 1082 cm−1, and the antisymmetric bending ν4(F2) at 567 cm−1. In accordance with selection rules, the triply degenerate antisymmetric stretching and bending modes (F2) are both Raman and infrared active, whereas the non-degenerate symmetric stretching (A1) and the doubly degenerate symmetric bending (E) are Raman active only. In solid materials (crystalline or amorphous) band splitting, shift and removal of degeneracies are typically observed due to crystal-field effects. The powder FTIR absorption spectra of Eu-HAp samples, collected in the 400–4000 cm−1 range are shown in Figure 4; measured band positions (wavenumbers, cm−1) are listed in Table 6. The spectrum of undoped HAp, also given for comparison in Figure 4, shows an intense doublet at 1091–1039 cm−1 assigned to the asymmetric stretching (ν3) while the weak peak at 962 cm−1 can be assigned to the symmetric stretching mode of the [PO4]3− group [44]. Two medium intense and very sharp peaks at 602 and 564 cm−1 can be related to the triple degenerate antisymmetric bending mode of the [PO4]3− group [47]. The sharpness of such bands, according to [48], is a reliable indicator of a well-crystallized HAp, in agreement with the result of crystallinity from XRD data for sample Eu-HAp900 (see Table 3). Notably, the spectrum of undoped HAp shows a well-resolved sharp peak at 3570 cm−1, due to the stretching mode of the (OH) group [44]. This peak is superimposed to a broad absorption due to H2O (moisture) adsorbed on the KBr disk [49]; the bending mode of this moisture is also visible as a broad component at 1600 cm−1. Analysis of deuterated samples [50] shows that the relatively sharp peak at 663 cm−1 is due to the O–H libration (see inset in Figure 4).
The X-ray structure refinement data described above show that the entry of Eu into the HAp structure does not modify the phosphate framework (Table 5), therefore no significant changes in the P-O modes are observed, except slight shifts in peak positions (Table 6). One interesting observation is that in Eu-doped HAp both the O–H stretching and bending modes have reduced intensity with respect to Eu-free HAp, in agreement with the charge balanced (OH) → O2− and Ca22+ → Eu3+ substitution responsible for the entry of Eu in the apatite structure.
A final point to be noted is the appearance, in sample Eu-HAp900, of a weak peak at 518 cm−1 that can be assigned to the Eu3+-O2− bonding, in agreement with those found for La- [37] and Gd- doped HAp [36], both of which are obtained at high annealing temperatures. In the present HAp samples, no evidence of carbonate groups usually found at 1410 cm−1 [47], was detected.
The sharp peak at 1384 cm−1 can be attributed to a trace amount of (NO3) from nitrate reactants [44]; this peak disappears at 900° (for both Eu-doped and undoped).
Figure 5 shows the Raman spectra collected in the 300–1150 cm−1 range for the Eu-HAp annealed phases and for the undoped Hap900 sample; band positions (wavenumbers, cm−1) and band assignments are summarized in Table 7.
The spectra are almost identical to that of HAp given in [43,48] showing the characteristic bands related to the modes of vibration of the [PO4]3− groups. In detail, the bands centered at ~432 and ~447 cm−1 are assigned to the ν2 PO4 vibrations and those from 580 to 608 cm−1 are associated to the (PO4)3− bending vibration (Table 7). The strong band at 963 cm−1 is due to the symmetric stretching mode of the [PO4]3− groups whereas the scatterings between 1032 and 1086 cm−1 are ascribed to the [PO4]3− asymmetric stretching vibrations (Table 7).
However, the (PO4)3− vibration bands seem slightly smoothed and less intense in the Eu-doped hydroxyapatites with respect to those of the undoped sample. This feature was previously found for other Eu-doped hydroxyapatites and was explained as the effect of the Eu incorporation into the sample [12,51].
Additional bands are present in the Raman spectra collected for sample Eu-HAP900, annealed at high T. In particular, this sample exhibits a band centered at 664 cm−1, which may be associated to vibrational modes of the [PO4]3− groups bonded to the Eu ions, as also previously reported in the literature [12]. Finally, the bands at 409 and ~560 cm−1 in the spectra of the Eu-HAp900 and Eu-HAp450 samples may be related to vibrational modes of the phosphate ions in TCP. This assignment is supported by the XRD results (see above) and is in keeping with previous Raman investigations on TCP [43].

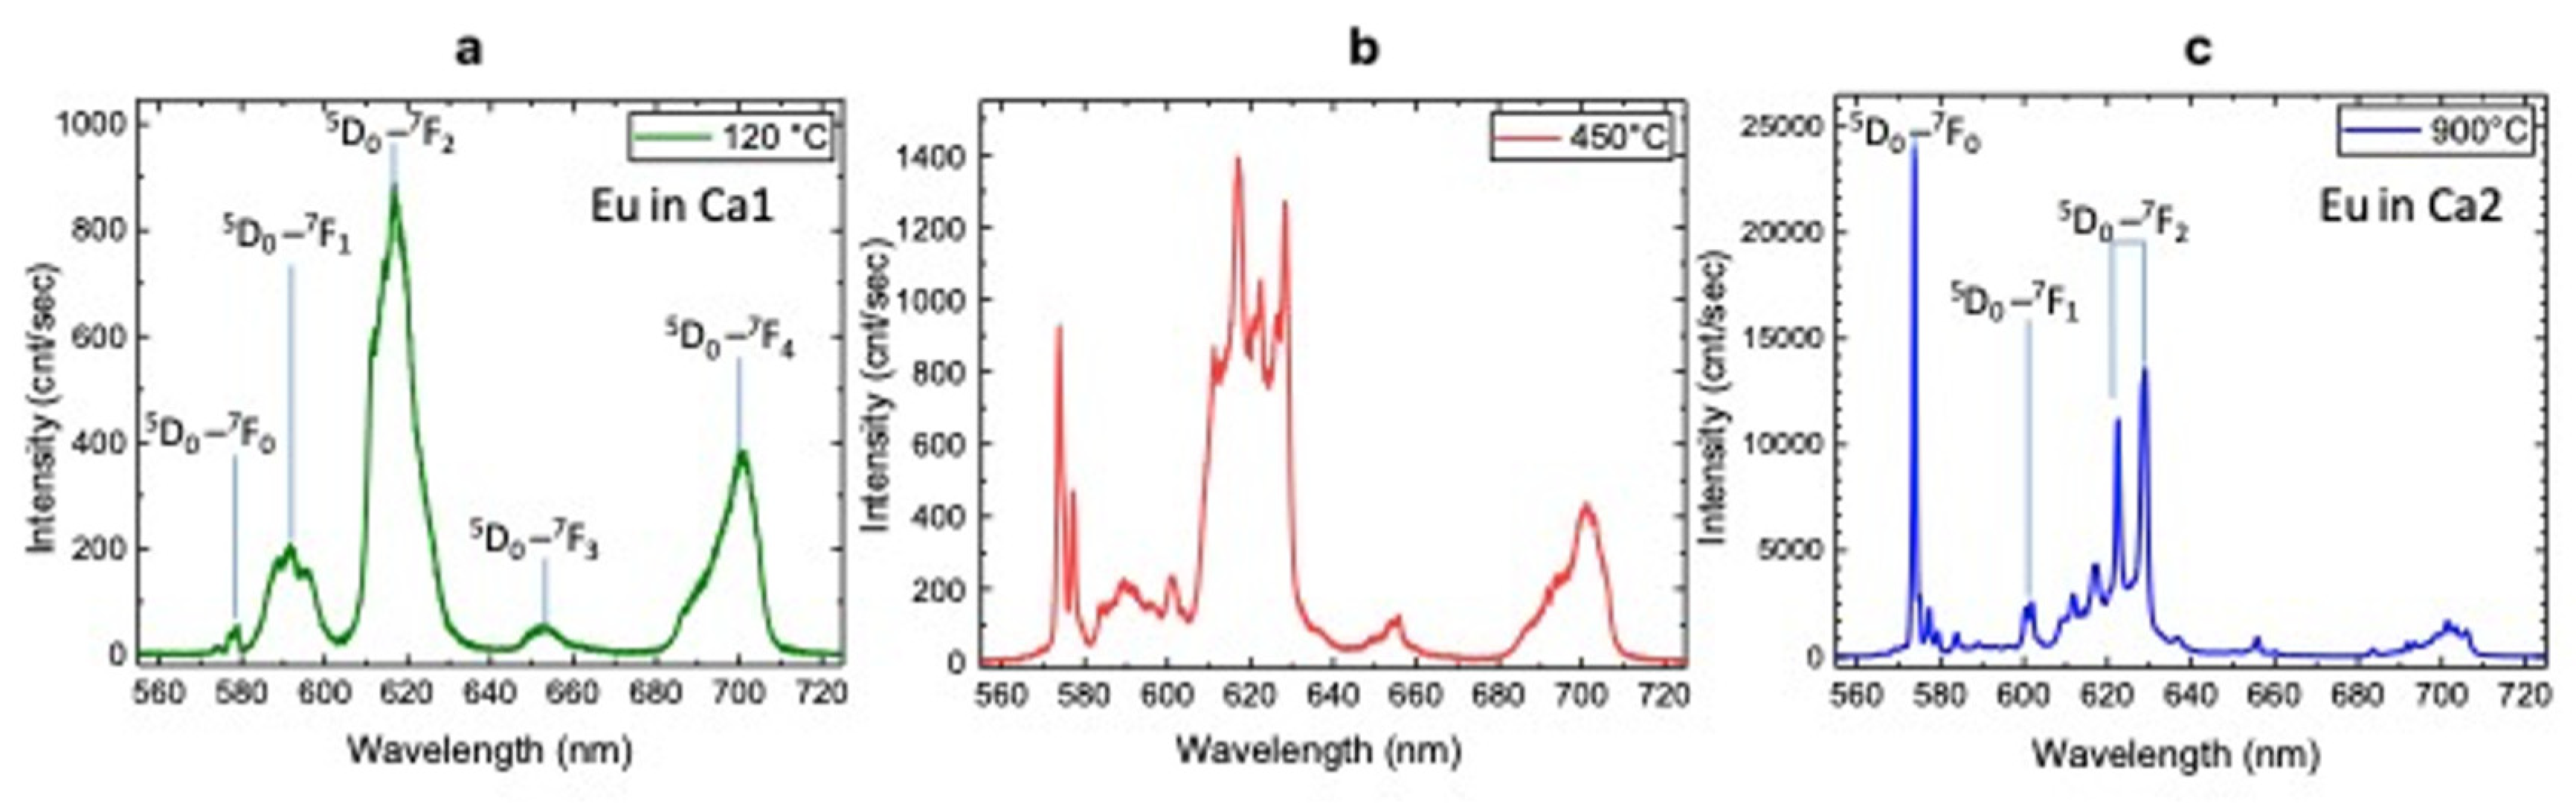
3.3. Luminescence Spectroscopy

A photoluminescence (PL) spectroscopy study of all HAp samples under investigation was performed by laser excitation at 532 nm at room temperature. The luminescence emission spectra of Eu-doped HAp powders after thermal treatment at 120 °C, 450 °C, 900 °C as given in Figure 6a–c, respectively.
Eu-doped HAp shows typical emissions due to 5D07Fj (j = 0 ÷ 4) transitions (Table 8) and, depending on annealing temperature, can be related to europium occupying the two different Ca sites, i.e., Ca1 and Ca2 [21].
The emissions from Eu at Ca1 are mainly observed for sample at 120 °C (Figure 6a) and at 450 °C (Figure 6b), while the sample annealed at 900 °C shows typical transition of Eu at Ca2 site (Figure 6c), in agreement with [13].
In particular, according to [52], our results show the most intense and sharp emission bands for the sample annealed at 900 °C. Photoluminescence of europium ions (Er3+) have been widely used as spectral probe in the crystallographic investigation of activation centers [52,53]. Among all emission transitions, the 5D07F0 transition is significant in that it indicates the presence of multiple cationic sites present in the host nanocrystal structure. Moreover, the transitions 5D07F1, i.e., the magnetic dipole transition (MD), and 5D07F2, i.e., the electric dipole transitions (ED), strongly change depending on the chemical surroundings and on the centrosymmetric character of the crystal structure. Specifically, the emissions of the 5D07F0, transition at 573 nm of Ca2-Eu3+ is more than 10 times higher than the emission at 592 of Ca1-Eu3+, indicating the almost-complete substitution for this element at the Ca2 sites of the HAp host matrix. The magnetic dipole transition (5D07F1) at 602 nm is not affected by the symmetry and structure, thus its emission can be an internal reference intensity for the ED-transitions to provide symmetry and structure modifications [52]. Here, we consider the change of the integrated intensity ratios R1 = (5D07F0)/(5D07F1) and R2=(5D07F2)/(5D07F1) evaluated at 120 °C and 900 °C. Interestingly, the estimated magnitude of the ratio R1 is more than three orders higher for the 900 °C sample (R1 << 0.01) than for the 120 °C sample (R1 >> 10). Hence, this phenomenon is the consequence of the fact that Eu3+ occupies the “new” cationic site Ca2 of the HAp host matrix. At the same time, the large R2 ratio at 120 °C (R2 ≈ 4) and higher than 10 at 900 °C implies a non-centrosymmetric surrounding of the europium ion that is substantially independent from temperature. In the HAp900 sample, some transitions typical of Eu-doped β-TCP phase (587–600 nm and 610–620 nm) are also present [20]. This behavior can be explained by a thermal energy that at the same time promotes the process of crystallization and diffusion of the europium ions within the apatite structure and substitution of the Eu3+ ions in Ca2 sites, in agreement with the results of Rietveld refinement of Eu occupancies (see Table 8); over 900 °C this migration is achieved.

4. Conclusions

In this work, undoped and Eu-doped (mol 3%) hydroxyapatite powders were synthesized by using the chemical-precipitation technique. Some precautions were observed: the temperature was kept low at 25 °C so as to inhibit the increasing of the average size of the particles; pH was kept constantly high (10 ± 0.05) in order to minimize the formation of secondary phases and to prevent the aggregation of the particles during their formation. The multi-methodological characterization achieved through XRD and PL techniques showed that the Eu entered in Ca1 site in the doped samples dried (120 °C) and calcinated (450 °C) at low temperature: these samples showed low crystallinity (3% and 7%, respectively), good luminescence and very low crystallite size (around 25 nm). On the contrary, the Eu-doped sample calcinated at 900 °C showed very high crystallinity (87%), with a crystallite size of 148 nm, while PL spectroscopy suggested that this sample presents the highest and narrowest emission bands. Specifically, the PL emissions peak at 573 nm, corresponding to the 5D07F0 of the Eu3+ transition in the Ca2 site, was more than 10 times more intense than the emission peak at 592 of Eu3+ in the Ca1 site, indicating the complete migration of Eu3+ ions into the Ca2 sites of the Hap framework. FTIR and Raman spectra showed slight band shifts with the increasing annealing temperature of the samples. All results show that HAp phases obtained at 120 °C and 450 °C, displaying low crystallinity, could be employed as luminescent drug carriers, while HAp phases annealed at 900°, displaying good crystallinity, can be suitable biomaterials for biological system imaging.

Author Contributions

F.B., F.C. and D.S. conceived and coordinated the study. F.B., B.D., D.K., and D.S. contributed to the synthesis of the hydroxyapatite; A.A., N.C., and F.C. contributed to the PXRD data collections and Rietveld refinements; G.D.V. contributed with FTIR spectroscopy; E.M. and M.L. contributed with Raman spectroscopy; G.B. and A.S. contributed with PL spectroscopy. All authors reviewed the results, wrote the paper, All authors have read and agreed to the published version of the manuscript.

Funding

This research was funded by Bilateral Scientific Cooperation Project 2018–2019 between CNR (Consiglio Nazionale delle Ricerche) and MoES (Ministry of Education and Sport of the Republic of Albania), grant number P0000189.

Acknowledgments

The micro-Raman spectrometer was funded by Potenziamento Strutturale PONa3_00369 “Laboratorio per lo Sviluppo Integrato delle Scienze e delle Tecnologie dei Materiali Avanzati e per dispositivi innovativi (SISTEMA)”. GDV was financially supported by MIUR-Italy Dipartimenti di Eccellenza, Articolo 1, Commi 314–337 Legge 232/2016.

Conflicts of Interest

The authors declare no conflict of interest. The funding sponsors had no role in the design of the study; in the collection, analyses, or interpretation of data; in the writing of the manuscript, and in the decision to publish the results.

References

  1. Dorozhkin, S.V. Calcium Orthophosphates: Occurrence, Properties and Major Applications. Bioceram. Dev. Appl. 2014, 4, 2. [Google Scholar] [CrossRef]
  2. Prichodko, A.; Enrichi, F.; Stankeviciute, Z.; Benedetti, A.; Grigoraviciute-Puroniene, I.; Kareiva, A. Study of Eu3+ and Tm3+ substitution effects in sol–gel fabricated calcium hydroxyapatite. J. Sol-Gel Sci. Technol. 2017, 81, 261–267. [Google Scholar] [CrossRef]
  3. Hughes, J.M.; Rakovan, J. The Crystal Structure of Apatite, Ca5 (PO4)3 (F, OH, Cl). Rev. Mineral. Geochem. 2002, 48, 1–12. [Google Scholar] [CrossRef]
  4. Dorozhkin, S.V. Calcium orthophosphate bioceramics. Ceram. Int. 2015, 41, 13913–13966. [Google Scholar] [CrossRef]
  5. Ignjatović, N.L.; Mančić, L.; Vuković, M.; Stojanović, Z.; Nikolić, M.G.; Škapin, S.; Jovanović, S.; Veselinović, L.; Uskoković, V.; Lazić, S.; et al. Rare-earth (Gd3+,Yb3+/Tm3+, Eu3+) co-doped hydroxyapatite as magnetic, up-conversion and down-conversion materials for multimodal imaging. Sci. Rep. 2019, 9, 16305. [Google Scholar] [CrossRef] [PubMed]
  6. Suchanek, W.; Yoshimura, M. Processing and properties of hydroxyapatite-based biomaterials for use as hard tissue replacement implants. J. Mater. Res. 1998, 13, 94–117. [Google Scholar] [CrossRef]
  7. El Khouri, A.; Elaatmani, M.; Della Ventura, G.; Sodo, A.; Rizzi, R.; Rossi, M.; Capitelli, F. Synthesis, structure refinement and vibrational spectroscopy of new rare-earth tricalcium phosphates Ca9RE(PO4)7 (RE = La, Pr, Nd, Eu, Gd, Dy, Tm, Yb). Ceram. Int. 2017, 43, 15645–15653. [Google Scholar] [CrossRef]
  8. Capitelli, F.; Rossi, M.; ElKhouri, A.; Elaatmani, M.; Corriero, N.; Sodo, A.; Della Ventura, G. Synthesis, structural model and vibrational spectroscopy of lutetium tricalcium phosphate Ca9Lu(PO4)7. J. Rare Earths 2018, 36, 1162–1168. [Google Scholar] [CrossRef]
  9. Neacsu, I.A.; Stoica, A.E.; Vasile, B.S.; Andronescu, E. Luminescent Hydroxyapatite Doped with Rare Earth Elements for Biomedical Applications. Nanomaterials 2019, 9, 239. [Google Scholar] [CrossRef] [Green Version]
  10. Albin, M.; Horrocks, W.D. Europium (III) luminescence excitation spectroscopy. Quantitive correlation between the total charge on the ligands and the 7F05D0 transition frequency in europium (III) complexes. Inorg. Chem. 1985, 24, 895–900. [Google Scholar] [CrossRef]
  11. Wiglusz, R.J.; Bednarkiewicz, A.; Strek, W. Synthesis and optical properties of Eu3+ ion doped nanocrystalline hydroxya patites embedded in PMMA matrix. J. Rare Earths 2011, 29, 1111–1116. [Google Scholar] [CrossRef]
  12. Zavala-Sanchez, L.A.; Hirata, G.A.; Novitskaya, E.; Karandikar, K.; Herrera, M.; Graeve, O.A. Distribution of Eu2+ and Eu3+ Ions in Hydroxyapatite: A Cathodoluminescence and Raman Study. ACS Biomater. Sci. Eng. 2015, 1, 1306–1313. [Google Scholar] [CrossRef]
  13. Garcia Dominguez, G.; Garrido Hernandez, A.; Ceron Montes, O.; Morales Ramirez, A.J.; Diaz De La Torre, S. Structural and luminescent properties of europium-doped and undoped hydroxyapatite powders sintered by spark plasma. Ceram. Silik. 2019, 100–109. [Google Scholar] [CrossRef] [Green Version]
  14. Chen, F.; Zhu, Y.-J.; Zhang, K.-H.; Wu, J.; Wang, K.-W.; Tang, Q.-L.; Mo, X.-M. Europium-doped amorphous calcium phosphate porous nanospheres: Preparation and application as luminescent drug carriers. Nanoscale Res. Lett. 2011, 6, 67. [Google Scholar] [CrossRef] [PubMed] [Green Version]
  15. Dembski, S.; Rupp, S.; Milde, M.; Gellermann, C.; Dyrba, M.; Schweizer, S.; Batentschuk, M.; Osvet, A.; Winnacker, A. Synthesis and optical properties of luminescent core–shell structured silicate and phosphate nanoparticles. Opt. Mater. 2011, 33, 1106–1110. [Google Scholar] [CrossRef]
  16. Mobasherpour, I.; Heshajin, M.S.; Kazemzadeh, A.; Zakeri, M. Synthesis of nanocrystalline hydroxyapatite by using precipitation method. J. Alloys Compd. 2007, 430, 330–333. [Google Scholar] [CrossRef]
  17. Wang, P.; Li, C.; Gong, H.; Jiang, X.; Wang, H.; Li, K. Effects of synthesis conditions on the morphology of hydroxyapatite nanoparticles produced by wet chemical process. Powder Technol. 2010, 203, 315–321. [Google Scholar] [CrossRef]
  18. Sadat-Shojai, M.; Khorasani, M.-T.; Dinpanah-Khoshdargi, E.; Jamshidi, A. Synthesis methods for nanosized hydroxyapatite with diverse structures. Acta Biomater. 2013, 9, 7591–7621. [Google Scholar] [CrossRef]
  19. Ciobanu, C.S.; Iconaru, S.L.; Massuyeau, F.; Constantin, L.V.; Costescu, A.; Predoi, D. Synthesis, Structure, and Luminescent Properties of Europium-Doped Hydroxyapatite Nanocrystalline Powders. J. Nanomater. 2012, 2012, 942801. [Google Scholar] [CrossRef] [Green Version]
  20. Silva, F.R.O.; Lima, N.B.; Guilhen, S.N.; Courrol, L.C.; Bressiani, A.H.A. Evaluation of europium-doped HA/β-TCP ratio fluorescence in biphasic calcium phosphate nanocomposites controlled by the pH value during the synthesis. J. Lumin. 2016, 180, 177–182. [Google Scholar] [CrossRef]
  21. Nikolaev, A.; Kolesnikov, I.; Frank-Kamenetskaya, O.; Kuz’mina, M. Europium concentration effect on characteristics and luminescent properties of hydroxyapatite nanocrystalline powders. J. Mol. Struct. 2017, 1149, 323–331. [Google Scholar] [CrossRef]
  22. Jarcho, M.; Bolen, C.H.; Thomas, M.B.; Bobick, J.; Kay, J.F.; Doremus, R.H. Hydroxylapatite synthesis and characterization in dense polycrystalline form. J. Mater. Sci. 1976, 11, 2027–2035. [Google Scholar] [CrossRef]
  23. Rietveld, H.M. A profile refinement method for nuclear and magnetic structures. J. Appl. Crystallogr. 1969, 2, 65–71. [Google Scholar] [CrossRef]
  24. Altomare, A.; Cuocci, C.; Giacovazzo, C.; Moliterni, A.; Rizzi, R.; Corriero, N.; Falcicchio, A. EXPO2013: A kit of tools for phasing crystal structures from powder data. J. Appl. Crystallogr. 2013, 46, 1231–1235. [Google Scholar] [CrossRef]
  25. Altomare, A.; Campi, G.; Cuocci, C.; Eriksson, L.; Giacovazzo, C.; Moliterni, A.; Rizzi, R.; Werner, P.-E. Advances in powder diffraction pattern indexing: N-TREOR09. J. Appl. Crystallogr. 2009, 42, 768–775. [Google Scholar] [CrossRef]
  26. Landi, E.; Tampieri, A.; Celotti, G.; Sprio, S. Densification behaviour and mechanisms of synthetic hydroxyapatites. J. Eur. Ceram. Soc. 2000, 20, 2377–2387. [Google Scholar] [CrossRef]
  27. Wilson, R.M.; Elliott, J.C.; Dowker, S.E.P. Rietveld refinement of the crystallographic structure of human dental enamel apatites. Am. Mineral. 1999, 84, 1406–1414. [Google Scholar] [CrossRef]
  28. Rossi, M.; Ghiara, M.R.; Chita, G.; Capitelli, F. Crystal-chemical and structural characterization of fluorapatites in ejecta from Somma-Vesuvius volcanic complex. Am. Mineral. 2011, 96, 1828–1837. [Google Scholar] [CrossRef]
  29. Pogosova, M.A.; Eliseev, A.A.; Kazin, P.E.; Azarmi, F. Synthesis, structure, luminescence, and color features of the Eu- and Cu-doped calcium apatite. Dye. Pigment. 2017, 141, 209–216. [Google Scholar] [CrossRef]
  30. Aquilano, D.; Bruno, M.; Rubbo, M.; Massaro, F.R.; Pastero, L. Low Symmetry Polymorph of Hydroxyapatite. Theoretical Equilibrium Morphology of the Monoclinic Ca5(OH)(PO4)3. Cryst. Growth Des. 2014, 14, 2846–2852. [Google Scholar] [CrossRef] [Green Version]
  31. Yashima, M.; Sakai, A.; Kamiyama, T.; Hoshikawa, A. Crystal structure analysis of β-tricalcium phosphate Ca3 (PO4)2 by neutron powder diffraction. J. Solid State Chem. 2003, 175, 272–277. [Google Scholar] [CrossRef]
  32. Kong, L.B.; Ma, J.; Boey, F. Nanosized hydroxyapatite powders derived from coprecipitation process. J. Mater. Sci. 2002, 37, 1131–1134. [Google Scholar] [CrossRef]
  33. Skorokhod, V.V.; Solonin, S.M.; Dubok, V.A.; Kolomiets, L.L.; Permyakova, T.V.; Shinkaruk, A.V.; Solonin, S.M.; Dubok, V.A.; Kolomiets, L.L.; Permyakova, T.V.; et al. Decomposition activation of hydroxyapatite in contact with β-tricalcium phosphate. Powder Metall. Met. Ceram. 2010, 49, 324–329. [Google Scholar] [CrossRef]
  34. Altomare, A.; Rizzi, R.; Rossi, M.; El Khouri, A.; Elaatmani, M.; Paterlini, V.; Della Ventura, G.; Capitelli, F. New Ca2.90 (Me2+)0.10(PO4)2 β-tricalcium Phosphates with Me2+ = Mn, Ni, Cu: Synthesis, Crystal-Chemistry, and Luminescence Properties. Crystals 2019, 9, 288. [Google Scholar] [CrossRef] [Green Version]
  35. Chiari, G.; Ferraris, G. The water molecule in crystalline hydrates studied by neutron diffraction. Acta Crystallogr. B Struct. Crystallogr. Cryst. Chem. 1982, 38, 2331–2341. [Google Scholar] [CrossRef]
  36. Get’man, E.I.; Loboda, S.N.; Tkachenko, T.V.; Yablochkova, N.V.; Chebyshev, K.A. Isomorphous substitution of samarium and gadolinium for calcium in hydroxyapatite structure. Russ. J. Inorg. Chem. 2010, 55, 333–338. [Google Scholar] [CrossRef]
  37. Kazin, P.E.; Pogosova, M.A.; Trusov, L.A.; Kolesnik, I.V.; Magdysyuk, O.V.; Dinnebier, R.E. Crystal structure details of La- and Bi-substituted hydroxyapatites: Evidence for LaO+ and BiO+ with a very short metal–oxygen bond. J. Solid State Chem. 2016, 237, 349–357. [Google Scholar] [CrossRef]
  38. Inorganic Crystal Structure Database (ICSD), Version 2018-2; Fachinformationszentrum: Karlsruhe, Germany, 2018.
  39. Fleet, M.E.; Liu, X.; Pan, Y. Site Preference of Rare Earth Elements in Hydroxyapatite [Ca10(PO4)6(OH)2]. J. Solid State Chem. 2000, 149, 391–398. [Google Scholar] [CrossRef]
  40. Brown, I.D.; Altermatt, D. Bond-valence parameters obtained from a systematic analysis of the Inorganic Crystal Structure Database. Acta Crystallogr. B Struct. Sci. 1985, 41, 244–247. [Google Scholar] [CrossRef] [Green Version]
  41. Graeve, O.A.; Kanakala, R.; Madadi, A.; Williams, B.C.; Glass, K.C. Luminescence variations in hydroxyapatites doped with Eu2+ and Eu3+ ions. Biomaterials 2010, 31, 4259–4267. [Google Scholar] [CrossRef]
  42. Low, H.R.; Phonthammachai, N.; Maignan, A.; Stewart, G.A.; Bastow, T.J.; Ma, L.L.; White, T.J. The Crystal Chemistry of Ferric Oxyhydroxyapatite. Inorg. Chem. 2008, 47, 11774–11782. [Google Scholar] [CrossRef]
  43. de Aza, P.N.; Guitián, F.; Santos, C.; de Aza, S.; Cuscó, R.; Artús, L. Vibrational Properties of Calcium Phosphate Compounds. 2. Comparison between Hydroxyapatite and β-Tricalcium Phosphate. Chem. Mater. 1997, 9, 916–922. [Google Scholar] [CrossRef]
  44. Koutsopoulos, S. Synthesis and characterization of hydroxyapatite crystals: A review study on the analytical methods. J. Biomed. Mater. Res. 2002, 62, 600–612. [Google Scholar] [CrossRef] [PubMed]
  45. El Khouri, A.; Zegzouti, A.; Elaatmani, M.; Capitelli, F. Bismuth-substituted hydroxyapatite ceramics synthesis: Morphological, structural, vibrational and dielectric properties. Inorg. Chem. Commun. 2019, 110, 107568. [Google Scholar] [CrossRef]
  46. Jastrzębski, W.; Sitarz, M.; Rokita, M.; Bułat, K. Infrared spectroscopy of different phosphates structures. Spectrochim. Acta Part A Mol. Biomol. Spectrosc. 2011, 79, 722–727. [Google Scholar] [CrossRef] [PubMed]
  47. Iconaru, S.-L.; Motelica-Heino, M.; Predoi, D. Study on Europium-Doped Hydroxyapatite Nanoparticles by Fourier Transform Infrared Spectroscopy and Their Antimicrobial Properties. J. Spectrosc. 2013, 2013, 284285. [Google Scholar] [CrossRef] [Green Version]
  48. Markovic, M.; Fowler, B.O.; Tung, M.S. Preparation and comprehensive characterization of a calcium hydroxyapatite reference material. J. Res. Natl. Inst. Stand. Technol. 2004, 109, 553. [Google Scholar] [CrossRef]
  49. Predoi, D.; Barsan, M.; Andronescu, E.; Vatasescu-Baltan, R.A.; Costache, M. Hydroxyapatite-iron oxide bioceramic prepared using nano-size powders. J. Optoelectron. Adv. Mater. 2007, 9, 3609–3613. [Google Scholar]
  50. Fowler, B.O. Infrared studies of apatites. I. Vibrational assignments for calcium, strontium, and barium hydroxyapatites utilizing isotopic substitution. Inorg. Chem. 1974, 13, 194–207. [Google Scholar] [CrossRef]
  51. Andronescu, E.; Predoi, D.; Neacsu, I.A.; Paduraru, A.V.; Musuc, A.M.; Trusca, R.; Oprea, O.; Tanasa, E.; Vasile, O.R.; Nicoara, A.I.; et al. Photoluminescent Hydroxylapatite: Eu3+ Doping Effect on Biological Behaviour. Nanomaterials 2019, 9, 1187. [Google Scholar] [CrossRef] [Green Version]
  52. Silva, F.R.O.; de Lima, N.B.; Bressiani, A.H.A.; Courrol, L.C.; Gomes, L. Synthesis, characterization and luminescence properties of Eu3+-doped hydroxyapatite nanocrystal and the thermal treatment effects. Opt. Mater. 2015, 47, 135–142. [Google Scholar] [CrossRef]
  53. Jagannathan, R.; Kottaisamy, M. Eu3+ luminescence: A spectral probe in M5 (PO4)3 X apatites (M = Ca or Sr; X = F, Cl, Bror OH). J. Phys. Condens. Matter 1995, 7, 8453–8466. [Google Scholar] [CrossRef]
Figure 1. Rietveld plot of: (a) Eu-HAp900, (b) Eu-HAp450 and (c) Eu-HAp120 phases. Observed diffraction profile: blue line; calculated profile: red line; difference profile: violet line; background: green line. Arrowed peaks correspond to the TCP phase [31].
Crystals 10 00250 g001
Figure 2. Detail of Ca1 (a) and Ca2 (b) coordination environments.
Crystals 10 00250 g002
Figure 3. Representation, down c, of the three-dimensional framework of HAp: (a) detail of the hexagonal tunnel, and (b) clinographic view of the supercell 2 × 2 (b).
Crystals 10 00250 g003
Figure 4. FTIR spectra of Eu-doped HAp samples in comparison with undoped HAp.
Crystals 10 00250 g004
Figure 5. Raman spectra of Eu-doped HAp samples in comparison with undoped HAp.
Crystals 10 00250 g005
Figure 6. PL spectra of Eu-doped HAp samples after thermal treatments at 120 °C (a), 450 °C (b) and 900 °C (c).
Crystals 10 00250 g006
Table 1. Contents (wt%) and molar ratios of Ca, Eu and P for the synthesized hydroxyapatites (HAps), obtained by ICP-OES.
SampleCa (wt%)P (wt%)Eu (wt%)(Ca + Eu)/PEu/(Ca + Eu)
HAp90037.8517.840.001.660.00
Eu-HAp12032.8415.743.701.660.03
Eu-HAp45033.8417.153.681.570.03
Eu-HAp90036.2218.754.031.540.03
Table 2. Acquisition and structure refinement parameters for HAp samples. FMLS: Full-Matrix-Least-Square.
Crystal FormulaHAp900Eu-HAp120Eu-HAp450Eu-HAp900
Refined formula
Formula weight
Ca10(PO4)6(OH)2
1004.61
Ca9.76Eu0.16(PO4)6(OH)2
1023.40
Ca9.82Eu0.08(PO4)6(OH)2
1020.48
Ca9.92Eu0.08(PO4)6(OH)2
1019.71
Colorcolorlesscolorlesscolorlesscolorless
Temperature (K)293293293293
Wavelength (Å)1.540561.540561.540561.54056
2θ range; step (°)8–100, 0.028-100, 0.028–97, 0.028–100, 0.02
System, space groupHex., P63/mHex., P63/mHex., P63/mHex., P63/m
a = b (Å)9.4145(4)9.4108(13)9.3952(11)9.4147(4)
c (Å)6.8758(5)6.868(2)6.8652(17)6.8760(5)
V3)527.77(5)526.75(19)524.80(16)527.81(5)
Z; Densitycalc. (Mg·m−3)1, 3.1611, 3.2261, 3.2291, 3.208
Refinement methodFMLSFMLSFMLSFMLS
Bragg refl., parameters615, 57205, 57191, 58615, 59
Rp; Rwp; Rexp (%)2.55, 3.61; 4.332.03, 2.78 4.30 1.97, 2.71, 3.572.17, 3.00, 4.33
Table 3. Crystallite size (nm) and crystallinity (%) for HAp samples.
ParameterHAp900Eu-HAp120Eu-HAp450Eu-HAp900
Crystallite Size (nm)562526148
Crystallinity (%)813787
Table 4. Structural sites in Ca10(PO4)6(OH, F, Cl)2 apatite [28].
AtomSitexyz
Ca14f2/31/3z
Ca26hxy¼
P16hxy¼
O16hxy¼
O26hxyz
O312ixy¼
OH4e00z
F2a00¼
Cl4e00z
Table 5. Bond distances (Å), and bond valence parameters for HAp samples. Bond valence sums (in bold) are calculated taking into account 9 bvp values for Ca1, 7 bvp values for Ca2, and 4 bvp values for P1.
BondHAp900bvpEu-HAp120bvpEu-HAp450bvpEu-HAp900bvp
3x Ca1-O12.403(4)0.312.444(5)0.282.444(5)0.282.405(4)0.31
3x Ca1-O22.432(5)0.292.399(7)0.312.401(6)0.312.460(4)0.26
3x Ca1…O32.812(4)0.102.835(6)0.102.851(6)0.092.817(3)0.10
2.08 2.03 2.03 2.01
Ca2-O22.384(5)0.322.385(8)0.322.381(7)0.332.364(4)0.34
2x Ca2-O32.317(3)0.392.379(4)0.332.368(4)0.342.321(3)0.39
2x Ca2-O32.517(5)0.232.519(7)0.232.515(7)0.232.517(4)0.23
Ca2-O4H2.358(2)0.352.365(3)0.342.347(3)0.362.343(2)0.36
Ca2-O12.684(7)0.142.576(10)0.192.576(9)0.192.701(5)0.14
2.25 2.08 2.18 2.28
P1-O11.564(5)1.5121.519(7)1.2921.495(7)1.391.537(4)1.24
P1-O21.558(8)1.1701.575(12)1.1211.587(12)1.091.549(6)1.20
2x P1-O31.557(3)1.1761.511(5)1.3321.527(5)1.271.556(3)1.18
4.67 5.02 5.02 4.80
O4-H10.950.950.950.950.950.950.950.95
Table 6. Measured absorption in the FTIR spectra and relative assignments for HAp samples. Vw = very weak, w = weak, sh = shoulder.
HApEu-HAp120Eu-HAp450Eu-HAp900Assignment
35713570 vw3570 w3570 wνs(OH)
1637163716371637δ(H2O)
1089109310931091
1046104010401046ν3(PO4)3−
---1015 sh
962960960962ν1(PO4)3−
632631631634δ(OH)
601602602602
570565565572ν4(PO4)3−
---518Eu3+- O2−
473473473473ν2(PO4)3−
Table 7. Raman spectra and relative assignments for HAp samples.
HApEu-HAp120Eu-HAp450Eu-HAp900Assignment HAp Assignment TCP
---409-ν 2(PO4)3−
434430430433ν 2(PO4)3−-
447448447447
--559560-ν 4(PO4)3−
580579578592ν 4(PO4)3−-
591590588
610608607
---664Eu3+-O2−-
964961961964ν 1(PO4)3−-
1032103010341032ν 3(PO4)3−-
1049104710471051
107910741074-
1082--1080
1086---
Table 8. Photoluminescence (PL) transitions of Eu3+ in Ca1 and Ca2 sites after thermal treatment at 120, 450 and 900 °C.
Luminescence Centerλlum (nm)Electron TransitionT (°C)Characteristics of Peaks
Eu3+
Ca1 site
579(5D07F0)120weak
592(5D07F1)strong, broad
618(5D07F2)strong, broad
653(5D07F3)broad
700(5D07F4)strong, broad
Eu3+
Ca1 site
579(5D07F0)450strong, narrow
592(5D07F1)strong, broad
618(5D07F2)strong, narrow
653(5D07F3)weak, broad
700(5D07F4)strong, broad
Eu3+
Ca2 site
574(5D07F0)450strong, narrow
602(5D07F1)weak, narrow
622(5D07F2)weak, narrow
629(5D07F3)strong, narrow
Eu3+
Ca2 site
574(5D07F0)900very strong, narrow
602(5D07F1)weak, narrow
622, 629(5D07F2)couple: strong, narrow

