Article

Bicontinuous Cubic and Hexagonal Columnar Liquid Crystalline Ion-Conductors at Room Temperature in Ion-Doped Dendritic Amphiphiles

1
Department of Chemistry, Dankook University, 119, Dandae-ro, Chungnam 448-701, Korea
2
Department of Chemistry, Chosun University, Gwangju 61452, Korea
*
Author to whom correspondence should be addressed.
These authors equally contributed to this work.
Crystals 2020, 10(3), 193; https://doi.org/10.3390/cryst10030193
Submission received: 8 February 2020 / Revised: 5 March 2020 / Accepted: 10 March 2020 / Published: 11 March 2020
(This article belongs to the Special Issue Liquid-Crystalline Ion Conductors)

Abstract

:
A bicontinuous cubic (Cubbi) liquid crystalline (LC) phase consisting of three dimensional (3D) conducting networks is a promising structural platform for ion-conductors. For practical applications using this fascinating LC structure, it is necessary to suppress crystallization at room temperature (RT). Herein, we report the Cubbi structure at RT and the morphology–dependent conduction behavior in ionic samples of a non-crystallizable dendritic amphiphile. In the molecular design, branched alkyl chains were used as an ionophobic part instead of crystallizable linear alkyl chains. Two ionic samples with Cubbi and hexagonal columnar (Colhex) LC phases at RT were prepared by adding different amounts of lithium salt to the amphiphile. Impedance analysis demonstrated that the Cubbi phase contributed to the faster ion-conduction to a larger extent than the Colhex phase due to the 3D ionic networks of the Cubbi phase. In addition, the temperature–dependent impedance and electric modulus data provided information regarding the phase transition from microphase-separated phase to molecularly mixed liquid phase.

1. Introduction

Liquid crystalline (LC) compounds composed of ionophilic and ionophobic blocks can serve as a promising platform for organic solvent-free electrolyte materials. This is attributed to the unique physical properties of LC materials as they exhibit segmental mobility at the molecular level and segregation at the supramolecular level [1,2]. Ordered LC structures are not fluidic, imparting sufficient mechanical strength for easy handling, which is a prerequisite condition for many material applications. In addition, LC materials can realize the flexibility of ionophilic coils to achieve comparable properties to the liquid (Liq) phase, which supports high ionic conductivity.
To enhance the ion-conducting performance of LC electrolytes, engineering of structural features are important. To date, diverse LC morphologies have been used as electrolytes, including micellar cubic [3], columnar [4,5,6,7,8], lamellar (Lam) [9,10,11,12,13,14,15,16], and bicontinuous cubic (Cubbi) [17,18,19,20,21,22,23,24] structures. Among these LC morphologies, 1D columnar and 2D Lam structures with ionophilic cylinders and layers, respectively, must be macroscopically aligned to achieve better ionic transportation [4,5,6,8]. In contrast, the Cubbi LC morphology consisting of 3D ionophilic networks showed enhanced ionic conductivities without macroscopic orientation [17,19,21]. Despite the structural merit of the Cubbi phase, it is difficult to obtain at room temperature (RT) or lower. In particular, crystallization between aromatic groups prevents the Cubbi phase from being obtained at RT. Considering its practical use, the complete suppression of crystallization would be ideal [25].
To this end, a dendritic amphiphilic compound (AB2) was designed, as presented in Figure 1. In this molecular design, branched alkyl peripheries, i.e., 2,6-dimethyloctyl chains, were introduced as the ionophobic part, as the bulky methyl groups may suppress crystallization. For the ionophilic part, tri (ethylene oxide) (TEO) coils were used, as it is too short to crystallize. Using the synthesized amphiphile, two electrolyte materials, 1 and 2, with [Li+]/[ethylene oxide, EO] = 0.2 and 0.3, respectively, were prepared. Consequently, no crystalline phase was observed in either electrolyte material. Depending on the lithium concentration, the electrolyte materials exhibited hexagonal columnar (Colhex) and Cubbi phases at RT, while Lam and disordered columnar (Coldis) phases were observed upon heating. As expected, the Cubbi phase enhanced ionic conduction properties compared to the 1D columnar phase. These morphological and conduction properties were characterized via X-ray diffraction (XRD) and impedance spectroscopy. This paper also describes the utility of impedance analysis for the characterization of phase transformation and ionic conduction. Herein, the details regarding the above-mentioned issues are addressed.

2. Materials and Methods

2.1. General Methods

The 1H- and 13C-NMR experiments were performed using a Bruker AM 400 spectrometer. The purities of the compounds were determined via thin-layer chromatography (TLC; Merck, silica gel 60). Differential scanning calorimetry (DSC) measurements were performed using TA Instruments Q2000 thermal analysis equipment at a rate of 10 °C/min. Indium (melting temperature = 429 K and ΔH = 28.45 J/g) was used as a calibration standard. The XRD measurements were carried out in transmission mode with synchrotron radiation at the UNIST-PAL 6D beamline of the Pohang Accelerator Laboratory (PAL), Korea. The samples were placed in a sample holder with polyimide films on both sides. The XRD data were plotted against q = 4π sin θ/λ. Microanalyses were performed using a Perkin Elmer 240 elemental analyzer at the Organic Chemistry Research Center, Sogang University, Korea. A Nikon eclipse LV100 optical polarized microscope equipped with a Linkam TMS 94 heating system was used to characterize phase transitions and analyze optical textures. Dielectric relaxation spectroscopy (DRS) measurements were performed using a Solartron Impedance Analyzer (SI 1260). The sample was measured in an indium tin oxide (ITO) liquid crystal (LC) cell with a thickness of 5 μm (Linkam, United Kingdom). The LC cell was placed on the homemade heating block, which was connected to a Test & Probe Hot Chuck Controller. The DRS measurements were performed between 30 and 120 °C. From the measured capacitance and loss tangent (tanδ), ε’ (dielectric constant) and ε’’ (dielectric loss) were obtained using the following equations: ε’ = C/C0 and tanδ = ε’’/ε’. Impedance experiments were performed using a Solartron Impedance Analyzer. An in-plane cell with a gap of 14 µm between the ITO electrodes was used. The cell constant was determined to be 0.0943 cm−1 by calibration with a standard solution of KCl (0.0035 M).

2.2. Synthesis

The synthesis of the dendritic amphiphilic molecule (AB2) is described in Scheme 1. 5-(Azidomethyl)-1,2,3-tris(2-(2-(2-methoxyethoxy)ethoxy)ethoxy)benzene and 5-azido-1,2,3-tris((3,7-dimethyloctyl)oxy)benzene were prepared using similar synthetic procedures as those described previously [26,27].

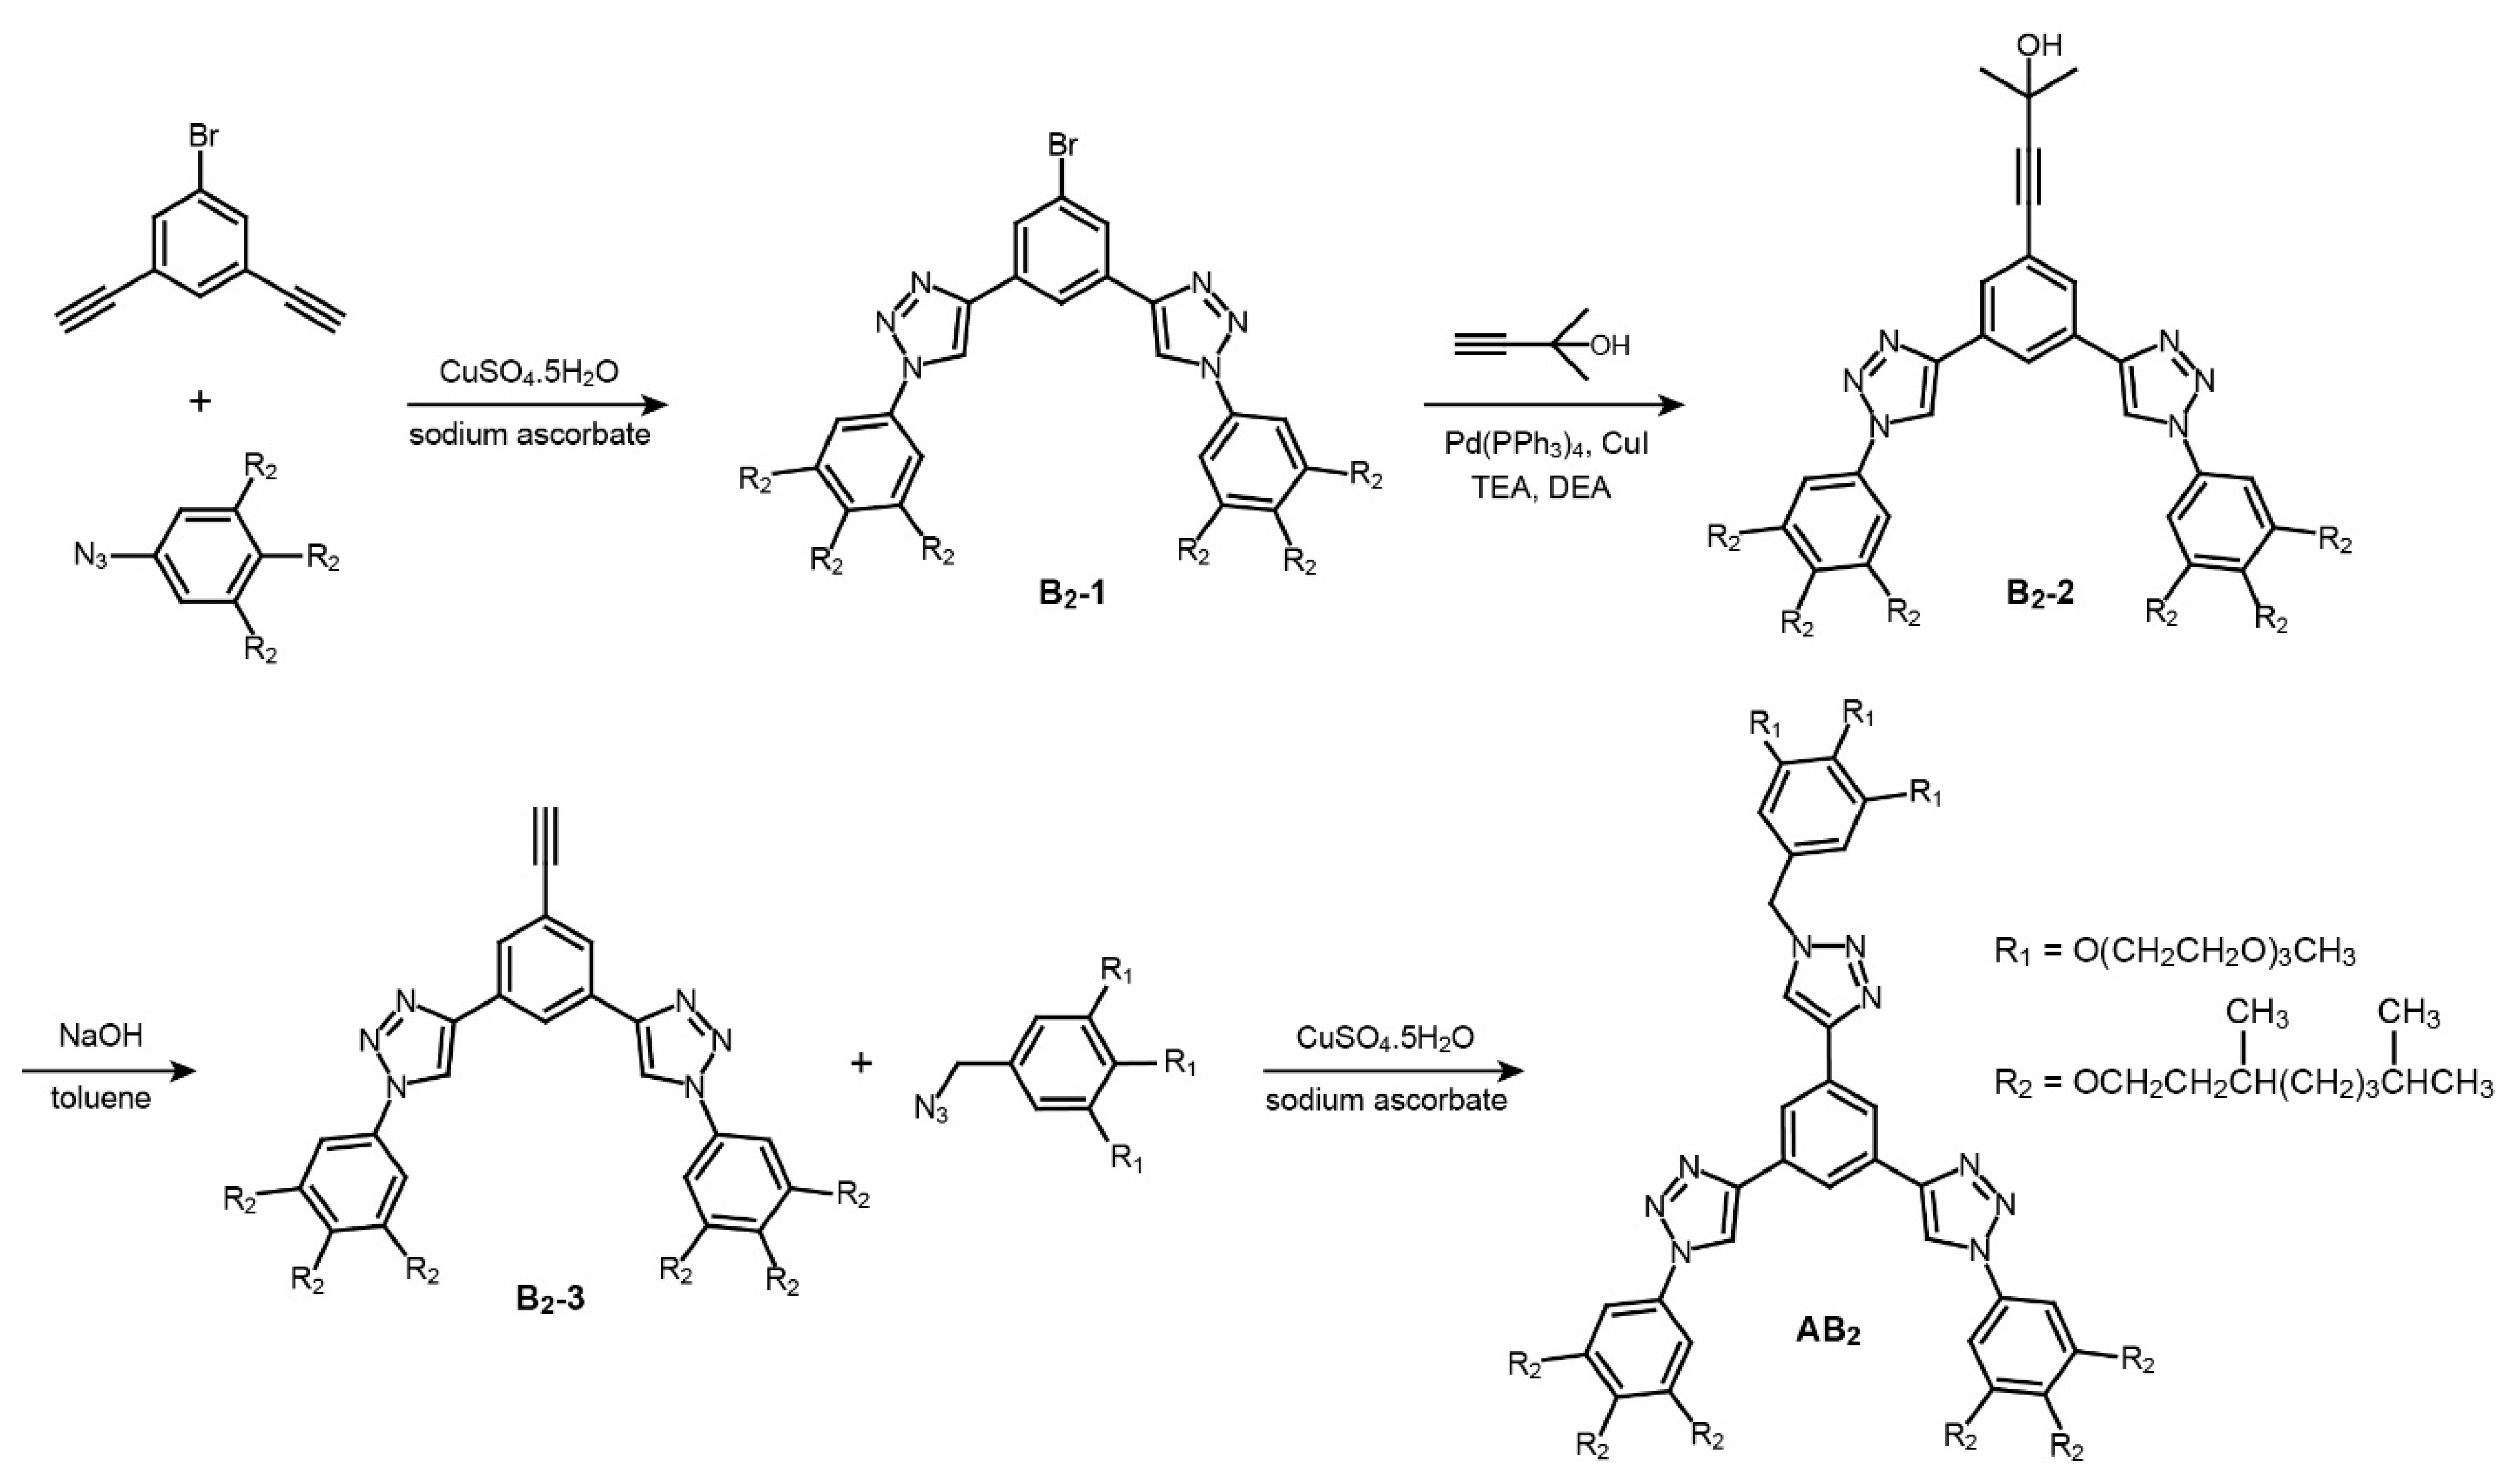
2.2.1. Synthesis of 4,4’-(5-Bromo-1,3-Phenylene) Bis (1-(3,4,5-Tris ((3,7-Dimethyloctyl) Oxy) Phenyl) -1H-1,2,3-Triazole) (B2-1)

1-Bromo-3,5-diethynylbenzene (1.68 g, 8 mmol), 5-azido-1,2,3-tris((3,7-dimethyloctyl)oxy)benzene (10.6 g, 18 mmol), sodium ascorbate (6.14 g, 24.6 mmol), and CuSO4·5H2O (9.75 g, 49 mmol) were dissolved in a 50 mL tetrahydrofuran (THF) and 20 mL deionized water mixture. The reaction mixture was stirred for 24 h at 60 °C and the solvent was subsequently removed using a rotary evaporator. The resulting mixture was extracted using chloroform and brine three times, and subsequently dried over MgSO4. After removing residual chloroform using a rotary evaporator, the resulting mixture was purified via silica gel column chromatography (silica gel) using methylene chloride (MC) to MC:ethyl acetate (EA) = 10:1 solvent mixture as the eluent, yielding 8.03 g (72%) of a yellowish solid as the product. 1H NMR (CDCl3, δ, ppm): 8.42 (s, 1H, Ar-H), 8.29 (s, 2H, Ar-H), 8.07 (d, J = 1.4 Hz, 2H, Ar-H), 6.99 (s, 4H, Ar-H), 4.31–3.88 (m, 12H, Ar-O-CH2-), 2.00–0.95 (m, 78H, -CH2(CH3)CH(CH2)3CH(CH3)2), 0.88 (m, 36H, -CH2(CH3)CH(CH2)3CH(CH3)2).

2.2.2. Synthesis of 4-(3,5-Bis(1-(3,4,5-Tris((3,7-Dimethyloctyl) Oxy) Phenyl)-1H-1,2,3-Triazol-4-yl) Phenyl) -2-Methylbut-3-Yn-2-ol (B2-2)

Compound B2-1 (6.6 g, 4.8 mmol), butynol (4.02 g, 48 mmol), Pd(PPh3)4 (0.22 g), and CuI (0.07 g) were dissolved in a mixture of 20 mL dry triethylamine (TEA), 5 mL diethylamine (DEA), and 5 mL pyridine. The mixture was heated to reflux for two days with stirring under a N2 atmosphere. After cooling to RT, the solvent was removed using a rotary evaporator. The mixture was then extracted using MC and diluted HCl three times. The MC layer was washed with deionized water several times and dried over MgSO4. The solvent was removed using a rotary evaporator and the crude product was subsequently purified via sequential silica gel column chromatography using hexane (HX):EA=5:1 to HX:EA= 3:1 eluents, yielding 4.7 g (70.7%) of the product. 1H NMR (CDCl3, δ, ppm): 8.37 (s, 1H, Ar-H), 8.21 (s, 2H, Ar-H), 7.89 (s, 2H, Ar-H), 6.99 (s, 4H, Ar-H), 4.08–3.93 (m, 12H, Ar-O-CH2-), 1.87–0.89 (m, 84H, -CH2(CH3)CH(CH2)3CH(CH3)2 and C(CH3)2OH), 0.80 (m, 36H, -CH2(CH3)CH(CH2)3CH(CH3)2).

2.2.3. Synthesis of 4,4’-(5-Ethynyl-1,3-Phenylene) bis (1-(3,4,5-Tris ((3,7-Dimethyloctyl) Oxy) Phenyl) -1H-1,2,3-Triazole) (B2-3)

Compound B2-2 (4.5 g, 3.3 mmol) and NaOH (1.3 g, 33 mmol) were first dissolved in 30 mL of toluene. The mixture was heated to reflux for 12 h and subsequently cooled to RT. The solvent was removed using a rotary evaporator and the mixture was extracted with MC and deionized water three times. The MC layer was then dried over MgSO4 and the residual solvent was removed using a rotary evaporator. The crude product was then purified via silica gel column chromatography using HX:EA = 5:1 as the eluent, yielding 2.93 g of the product (67.0%). 1H NMR (CDCl3, δ, ppm): 8.41 (s, 1H, Ar-H), 8.21 (s, 2H, Ar-H), 7.97 (s, 2H, Ar-H), 6.92 (s, 4H, Ar-H), 4.07–3.92 (m, 12H, Ar-O-CH2-), 3.10 (s, 1H, C≡CH), 1.86–0.89 (m, 78H, -CH2(CH3)CH(CH2)3CH(CH3)2), 0.80 (m, 36H, -CH2(CH3)CH(CH2)3CH(CH3)2).

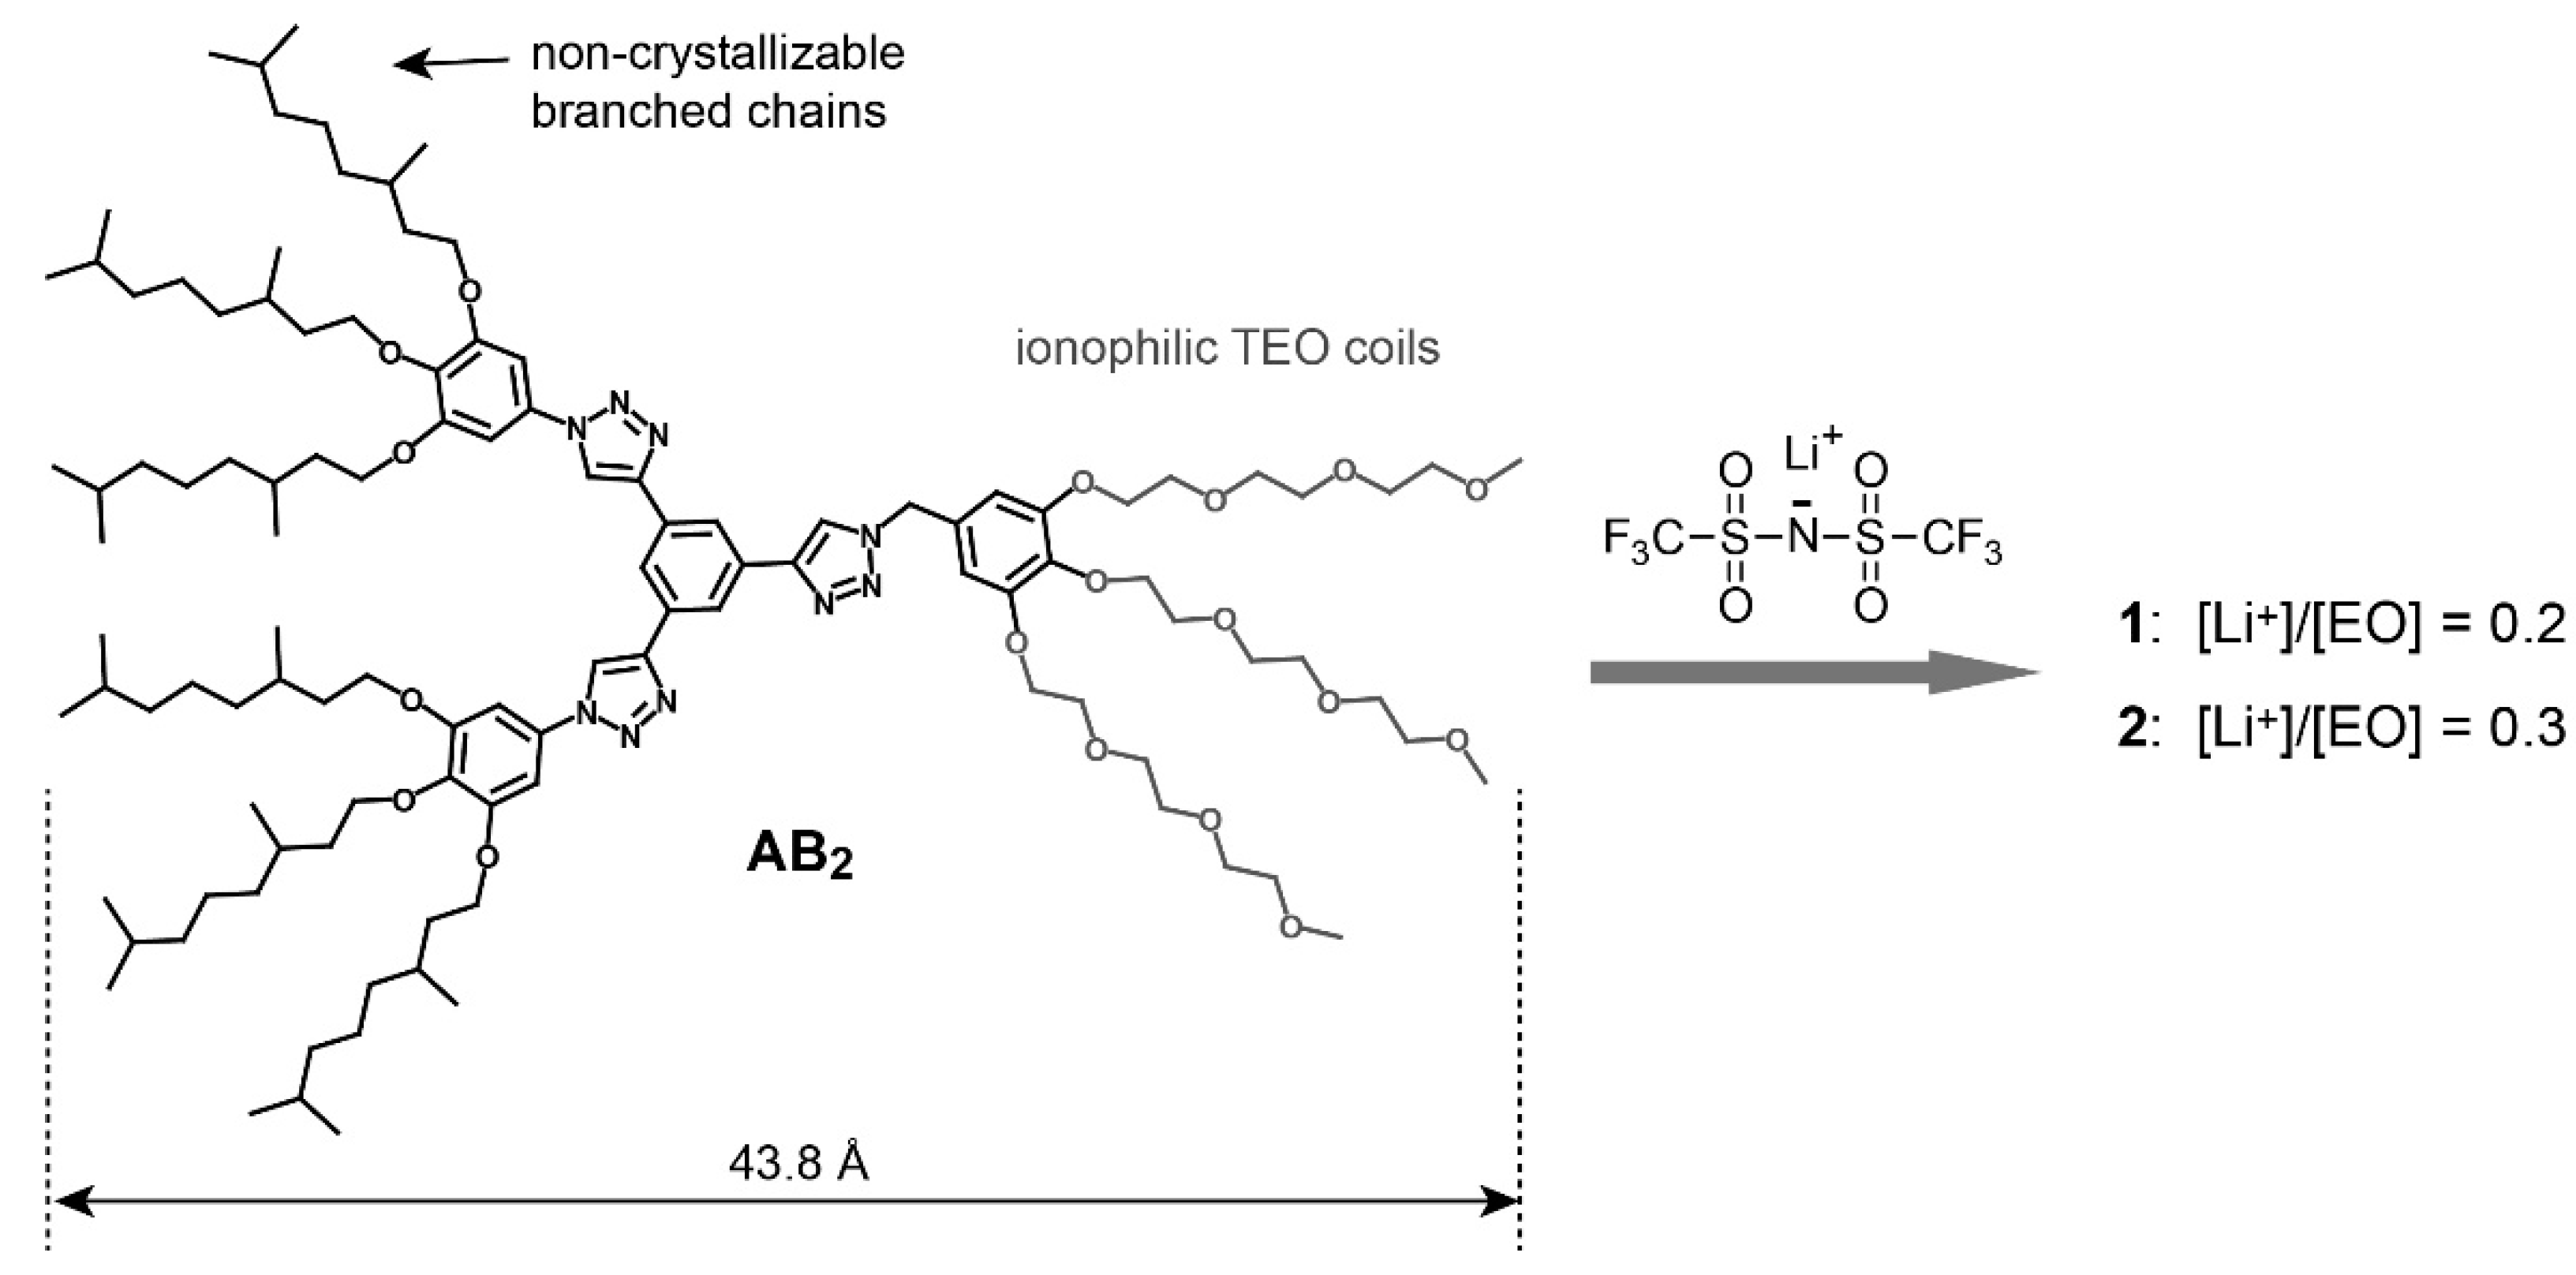
2.2.4. Synthesis of 4,4’-(5-(1-(3,4,5-Tris(2-(2-(2-Methoxyethoxy) Ethoxy) Ethoxy) Benzyl)-1H- 1,2,3-Triazol-4-yl)-1,3-Phenylene) bis (1-(3,4,5-Tris((3,7-Dimethyloctyl) Oxy) Phenyl)-1H-1,2,3-Triazole) (AB2)

Compound B2-3 (2.80 g, 2.1 mmol), 5-(azidomethyl)-1,2,3-tris(2-(2-(2-methoxyethoxy)ethoxy)ethoxy) benzene (1.09 g, 1.76 mmol), sodium ascorbate (1.4 g, 7 mmol), and CuSO4·5H2O (0.88 g, 3.52 mmol) were dissolved in a mixture of 30 mL THF and 10 mL deionized water. The reaction mixture was stirred for 24 h at 60 °C. The solvent was then removed using a rotary evaporator. The resulting mixture was extracted using chloroform and deionized water three times, and then dried over MgSO4. After removing chloroform using a rotary evaporator, the resulting mixture was purified via sequential silica gel column chromatography (silica gel) from MC to EA to EA:methanol = 20:1 solvent mixture as eluents, yielding 1.95 g (57.0%) of the product. 1H NMR (500 MHz, CDCl3, δ, ppm): 8.41 (s, 1H, Ar-H), 8.35 (s, 2H, Ar-H), 8.32 (s, 3H, Ar-H), 6.94 (s, 4H, Ar-H), 6.54 (s, 2H, Ar-H), 5.43 (s, 2H, benzyl-H), 4.14–3.92 (m, 18H, Ar-OCH2CH2O and Ar-O-CH2-), 3.81–3.41 (m, 30H, Ar-OCH2CH2(OCH2CH2)2OCH3), 3.28 (s, 9H, -(OCH2CH2)2OCH3), 1.92–0.90 (m, 78H, -CH2(CH3)CH(CH2)3CH(CH3)2), 0.81 (m, 36H, -CH2(CH3)CH(CH2)3CH(CH3)2). 13C NMR (125 MHz, CDCl3, δ, ppm): 152.93, 152.20, 146.41, 137.18, 131.41, 130.67, 124.88, 121.39, 118.16, 117.67, 107.14, 99.01, 98.20, 70.90–66.77 (OCH2), 57.97 (OCH3), 56.32 (N-CH2-Ph), 38.36, 38.25, 36.50, 36.32, 35.28, 28.82, 28.68, 26.98, 23.72, 21.69, 21.61, 21.59, 18.63, 18.59. Anal. Calcd for C112H185N9O18: C, 69.14; H, 9.58; N, 6.48; O, 14.80. Found: C, 68.71; H, 9.62; N, 6.37.

2.2.5. Preparation of the Ionic Samples

The ionic samples were prepared by mixing 0.2 g of amphiphile (AB2) with an appropriate volume of lithium bis(trifluoromethane)sulfonimide (LiTFSI) solution (0.035 M in dry THF), followed by the slow evaporation of the solvent under reduced pressure at RT. The samples were subsequently dried in a vacuum oven at 80 °C for 24 h until a constant mass was reached.

3. Results

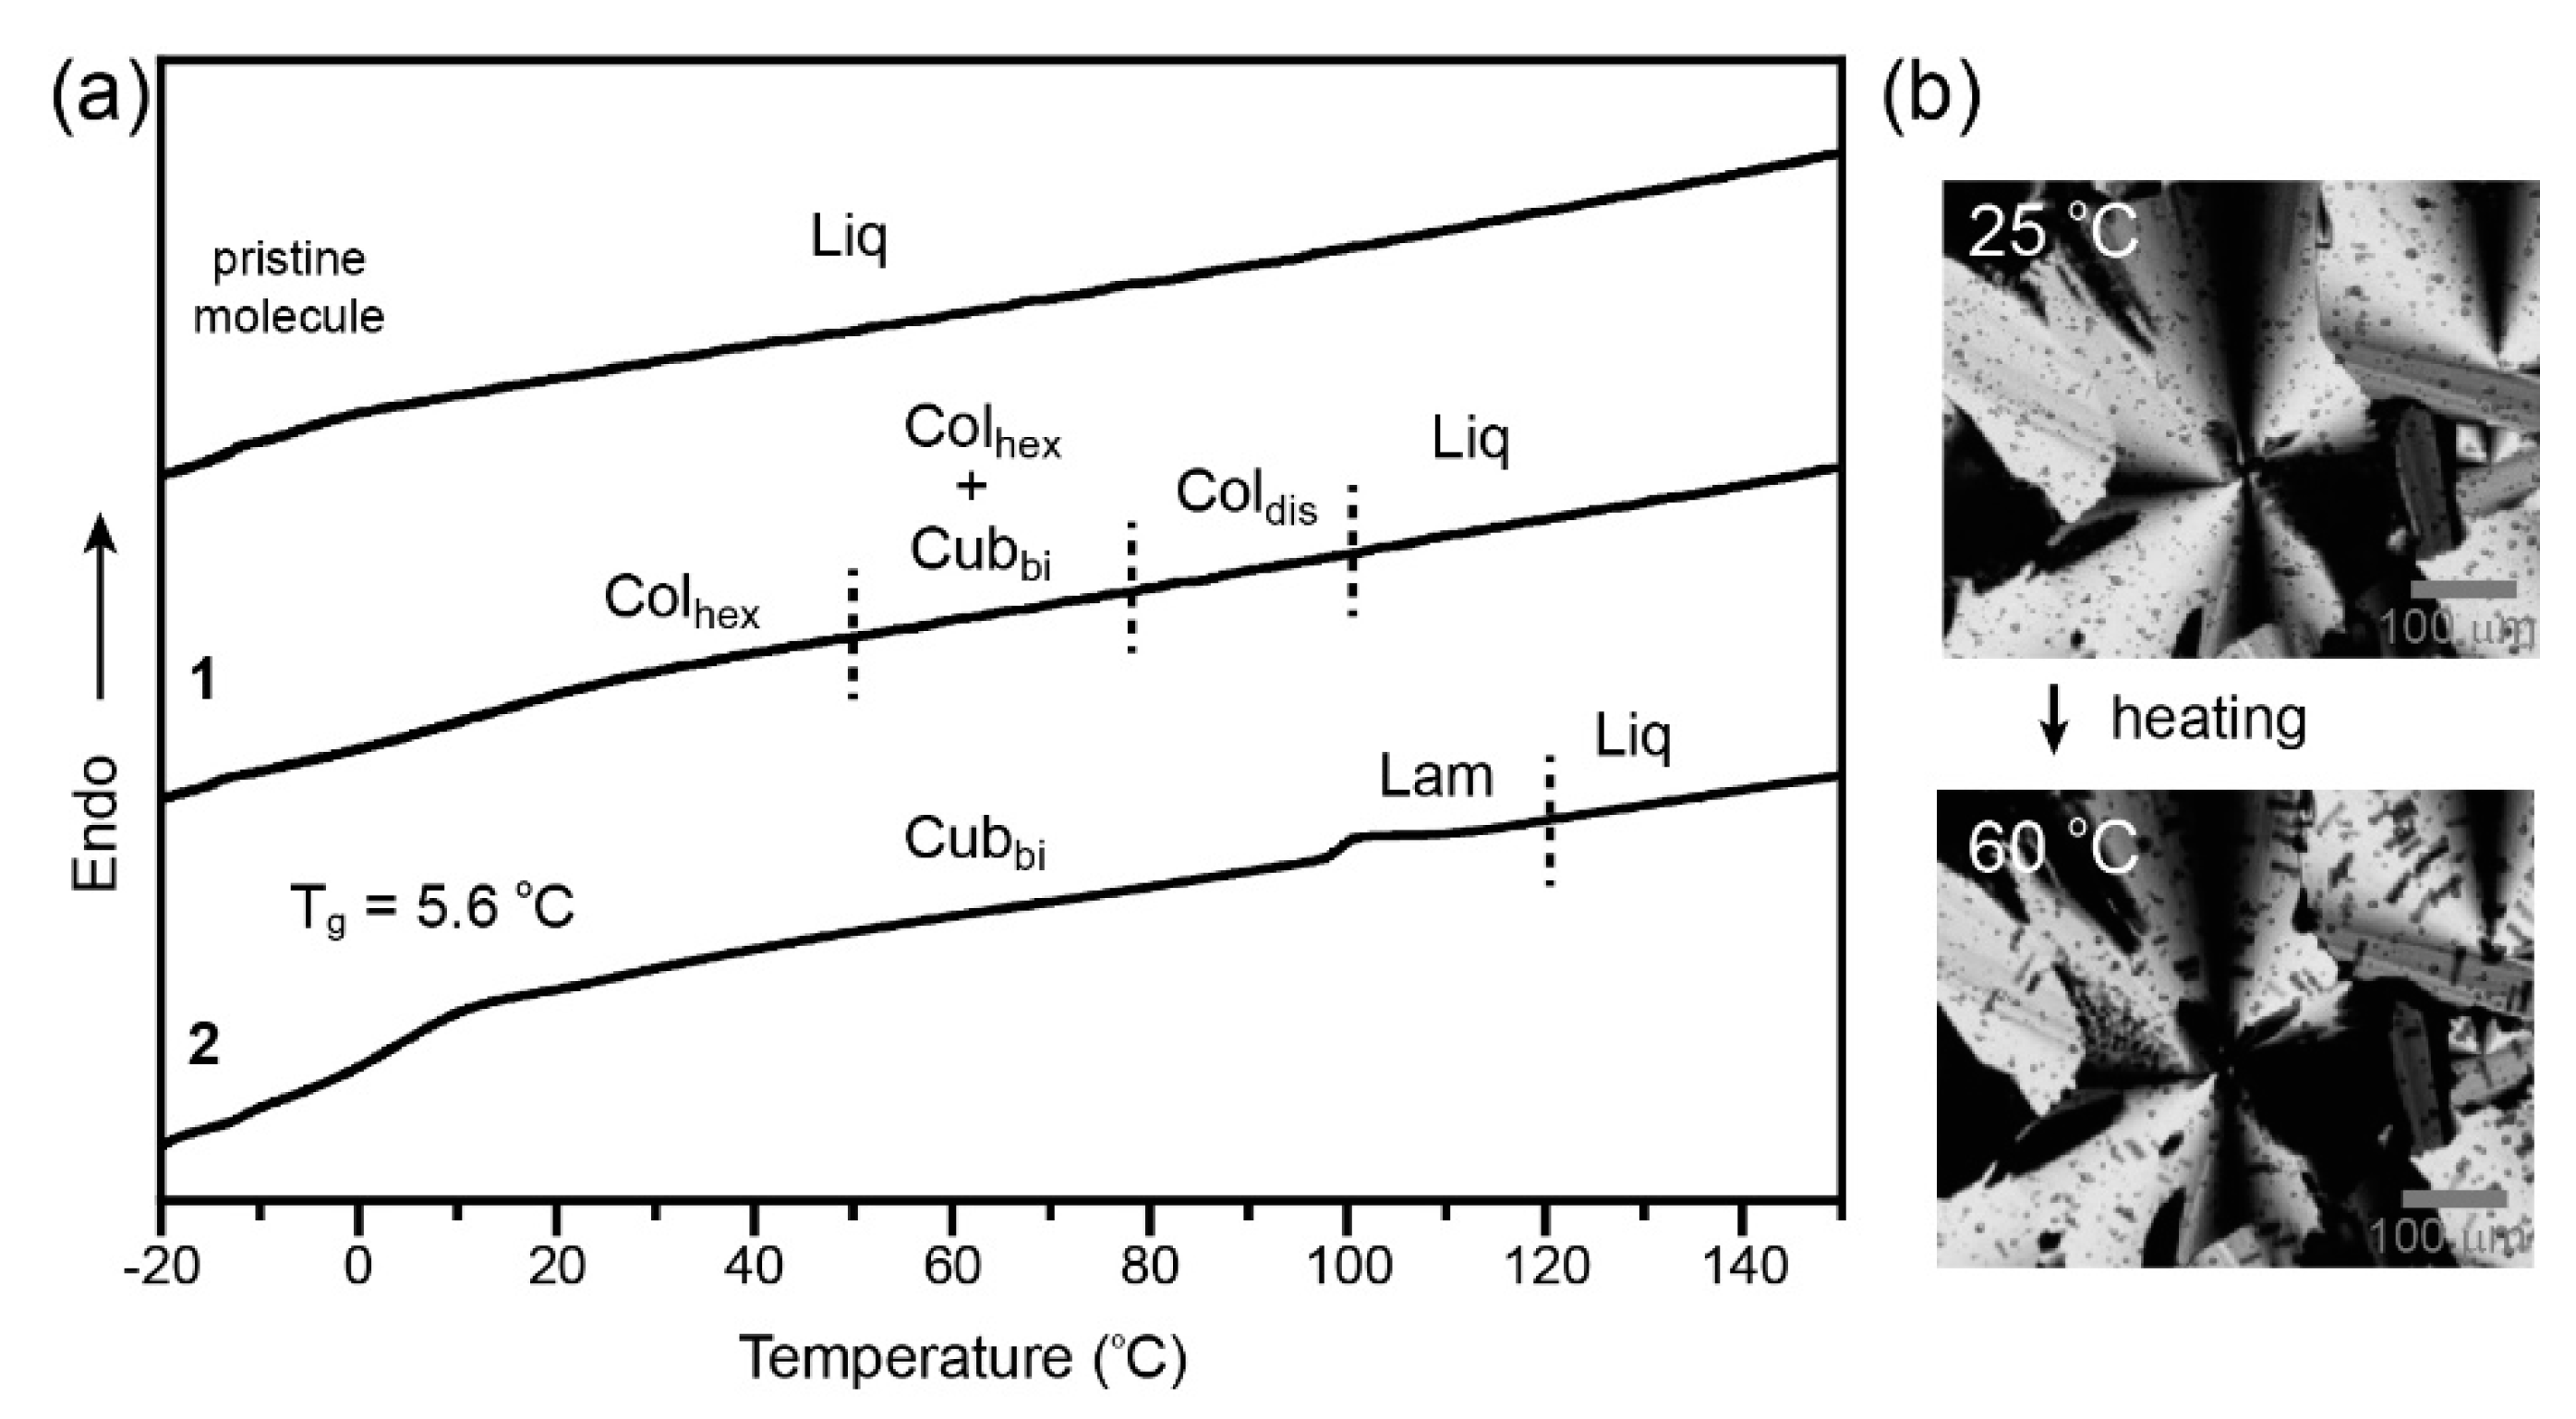
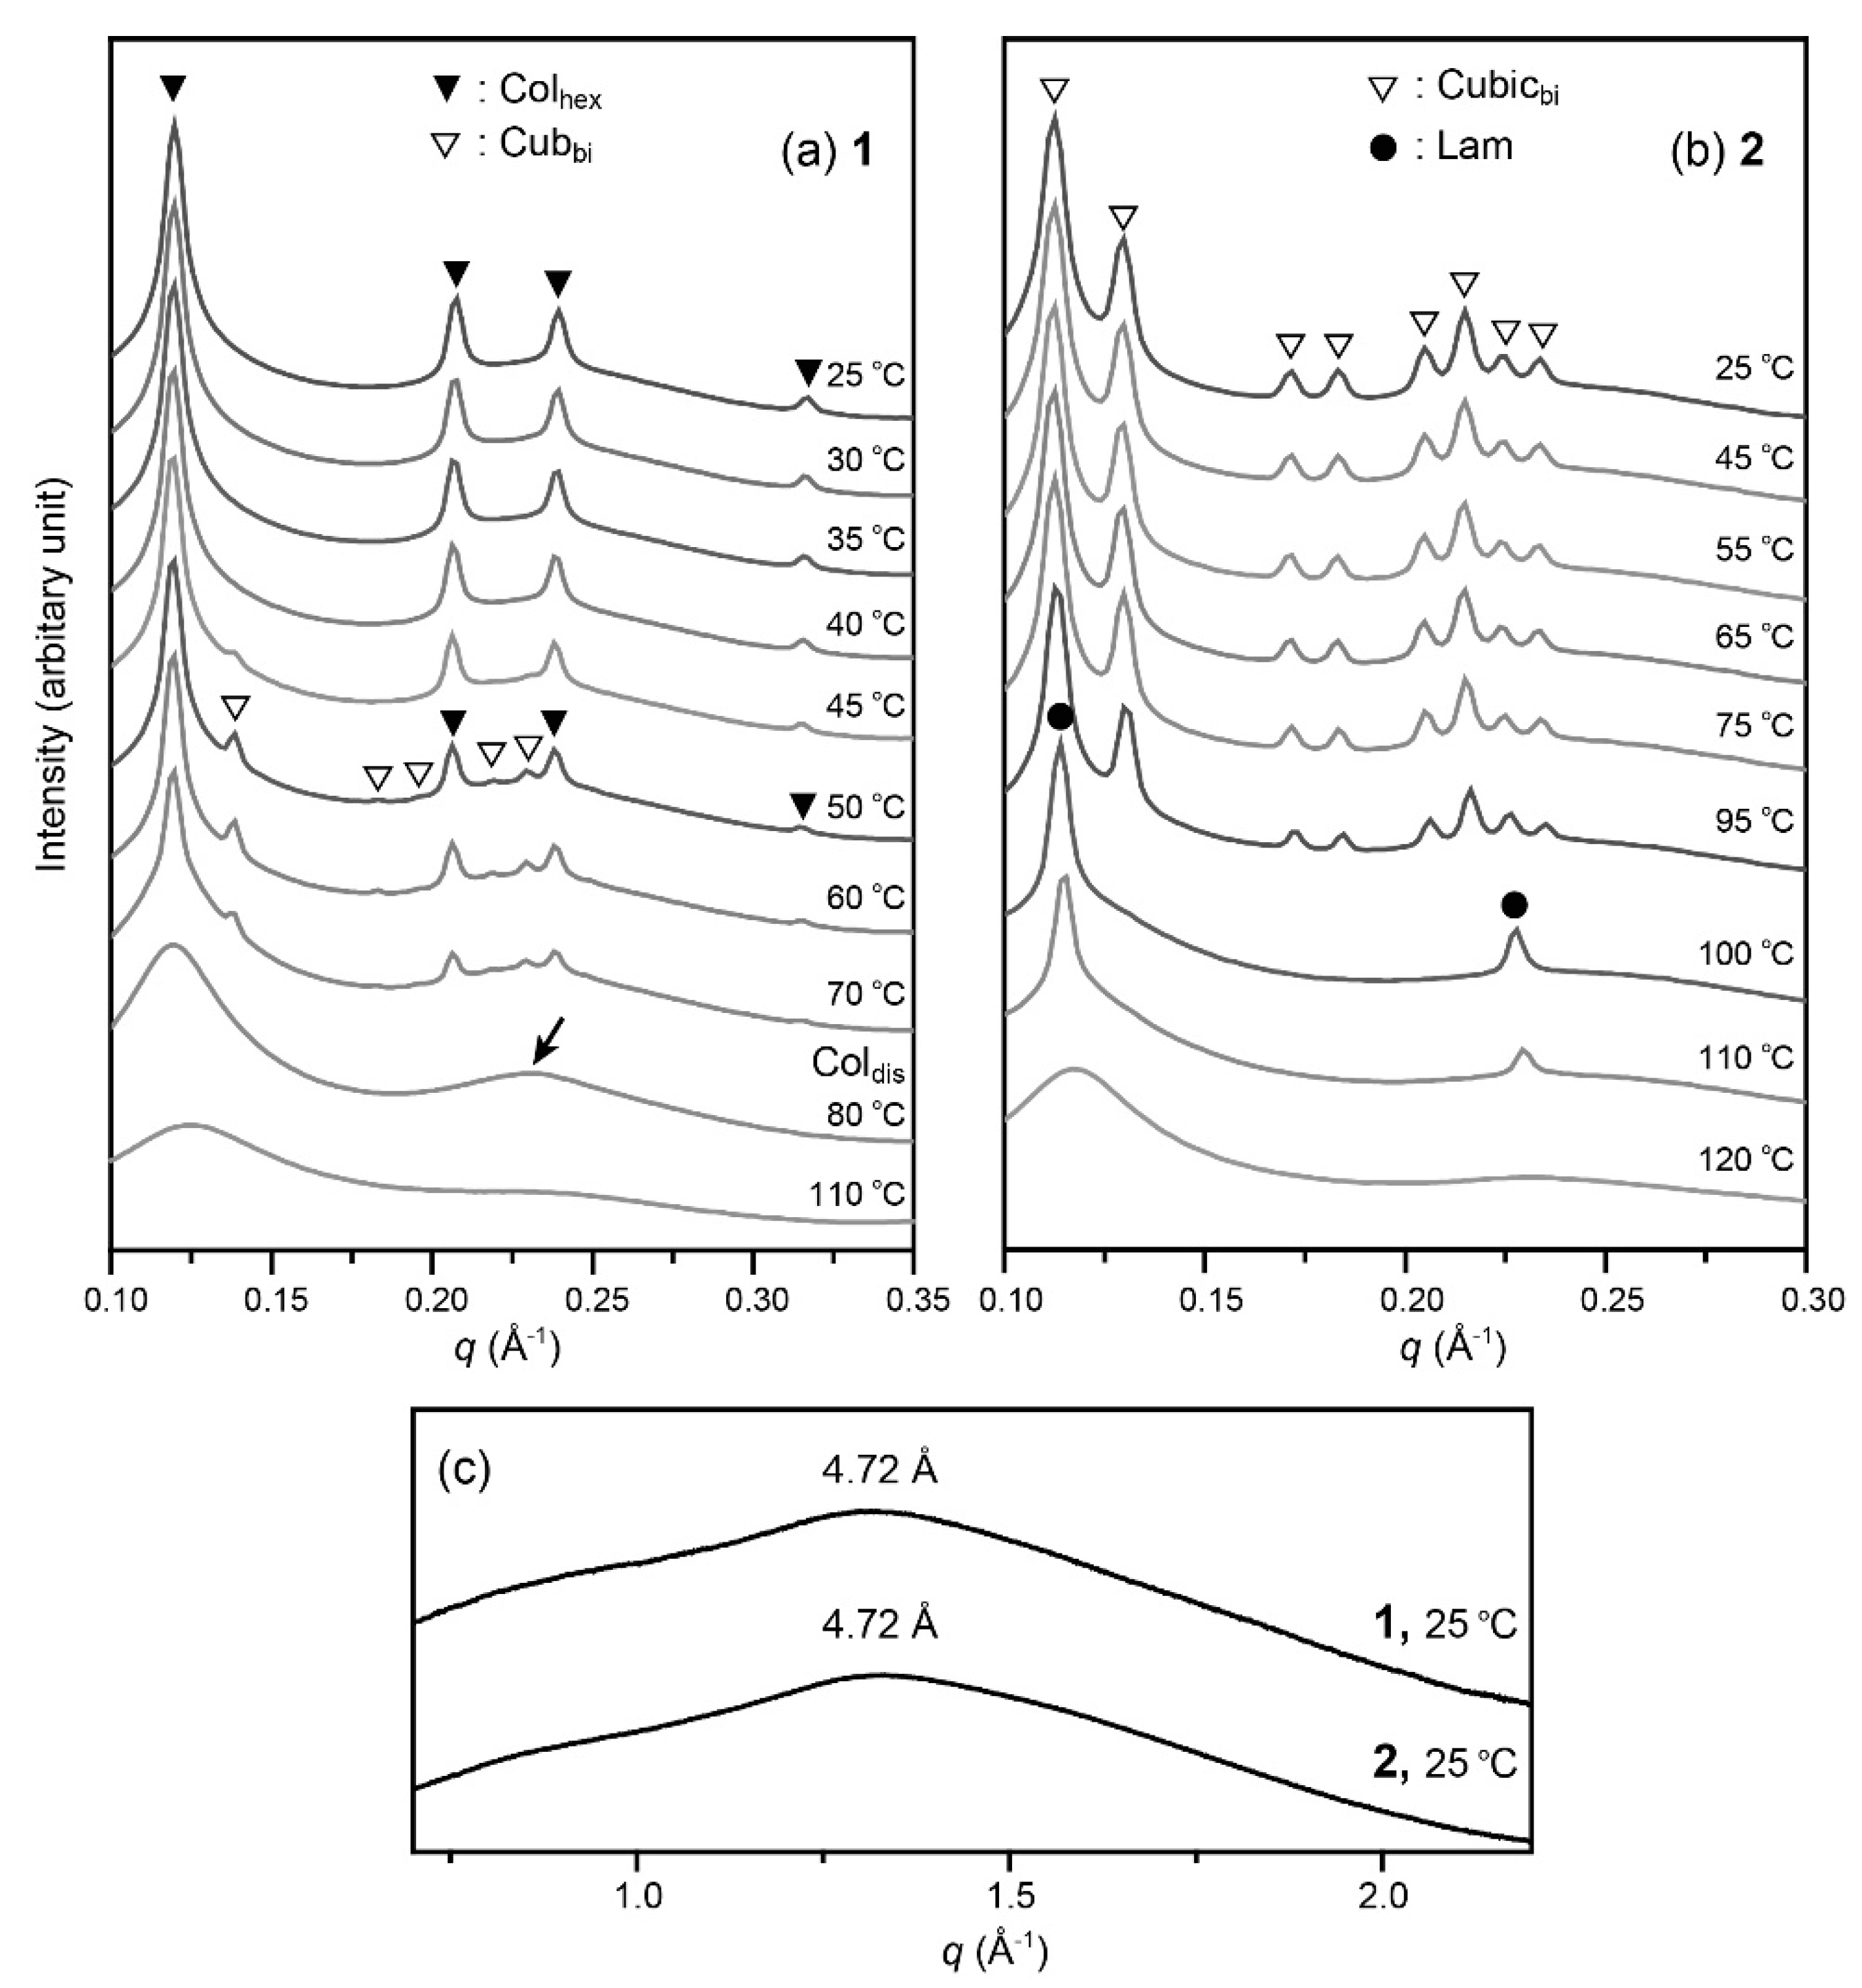
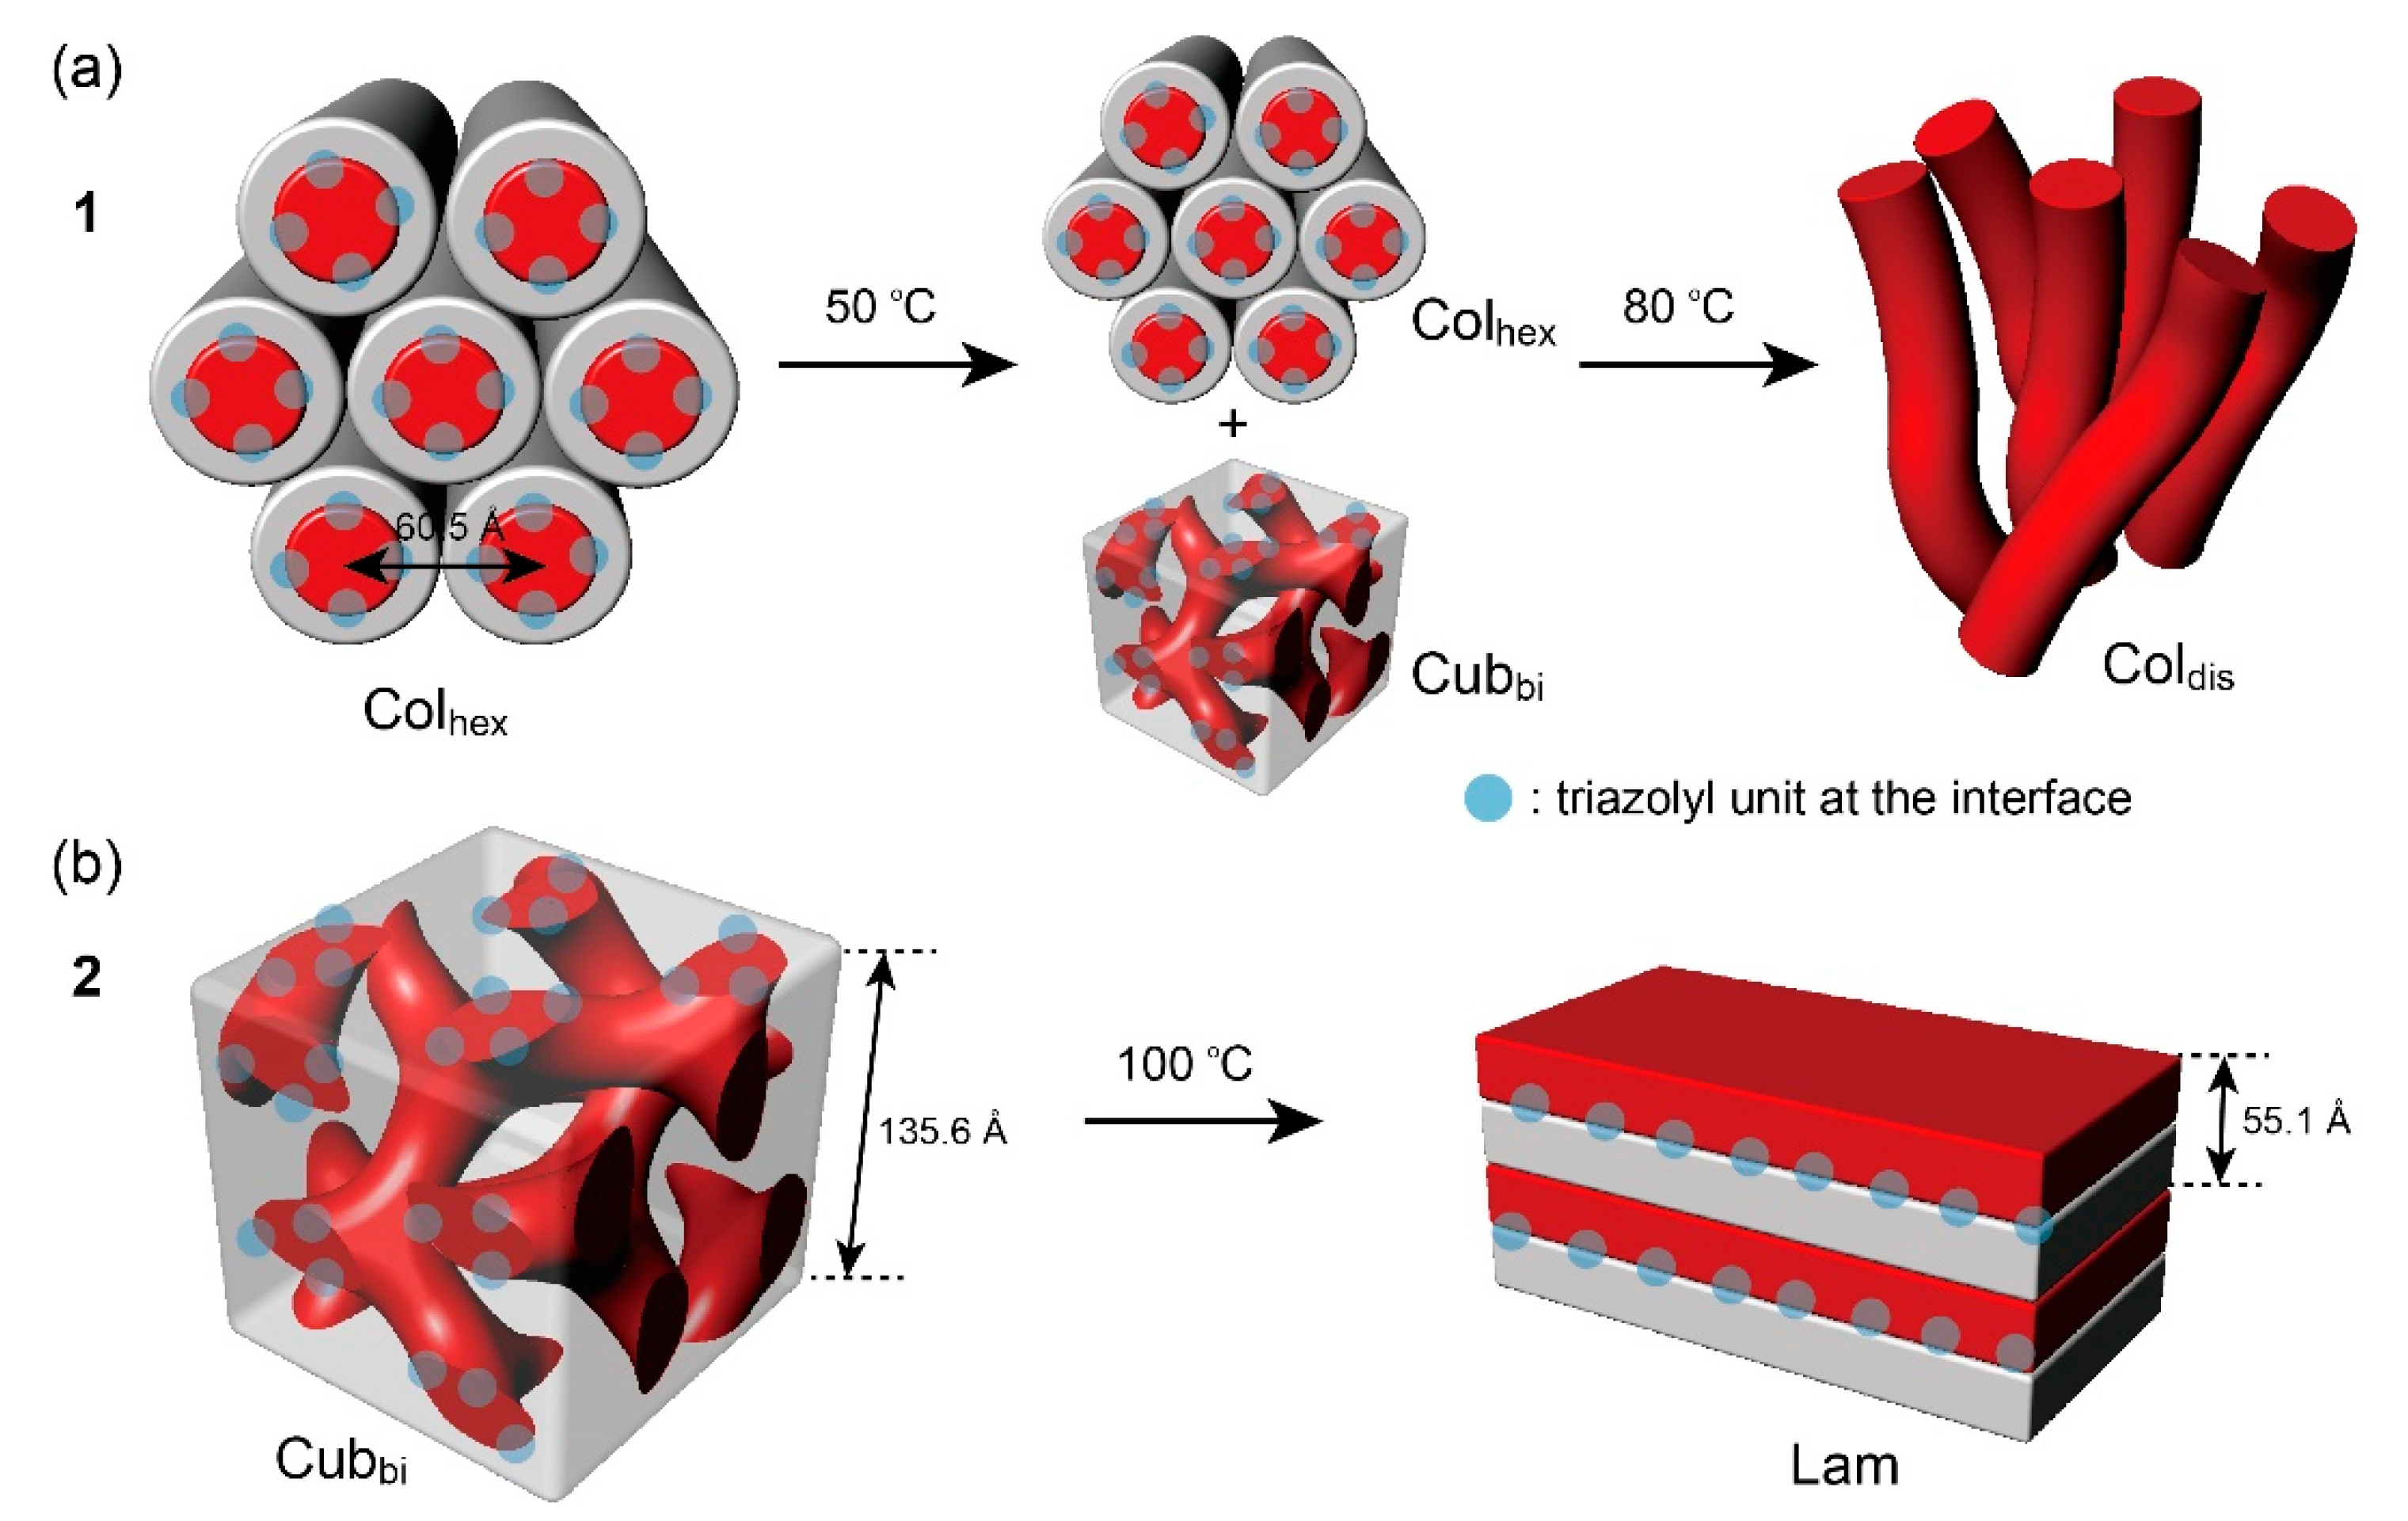
3.1. Thermotropic Properties

The dendritic amphiphile (AB2) exhibited no LC phase, only a viscous Liq phase. In the DSC thermogram of AB2, no melting transition was observed (Figure 2a), in marked contrast to previous crystallizable compounds based on linear alkyl chains [18,28,29]. Therefore, the use of the non-crystallizable alkyl peripheries is an efficient approach to prevent crystallization.
Unlike AB2, its ionic samples exhibited thermodynamically stable LC phases at RT (Figure 2a). For ionic sample 1 with [Li+]/[EO] = 0.2, no distinct transition was observed in the DSC thermogram, likely because the transitional enthalpy changes were quite small. Instead, the LC formation and phase transition properties were assigned using polarized optical microscopy (POM). The POM image of 1 showed a fan-like texture at RT (Figure 2b), suggesting the formation of a Colhex LC phase [30]. This LC morphology was further characterized using small and wide-angle X-ray diffraction (SAXRD and WAXRD) measurements. The SAXRD spectrum of 1 at RT exhibited four reflections which could be indexed to the (100), (110), (200), and (210) planes of the 2D hexagonal lattice (Figure 3a). In the WAXRD data, a halo was observed at q = 1.33 Å−1 (Figure 3c). Based on the POM and XRD results, the LC phase of 1 at RT was determined to be a Colhex phase. From the primary reflection, the intercolumnar distance (a) was estimated to be 60.5 Å (Figure 4a). Considering that the fully stretched molecular length is 43.8 Å (Figure 1), the intercolumnar distance of the Colhex is significantly large, indicating bilayered packing in the columnar slice. In this packing structure, the columnar core was composed of ionophilic oligo(ethylene oxide) coils and lithium salts, while the matrix was occupied by ionophobic alkyl chains. Therefore, unfavorable contact areas between immiscible segments were minimized. The number (N) of molecules in a columnar slice of the Colhex phase of 1 was determined using the relation, N = (√3a2hNAρ)/2M, where a, h, M, NA, and ρ are the intercolumnar distance, columnar stratum, molecular weight, Avogadro’s number and density (1.07 g/cm3), respectively. The density was obtained using the densities of the molecule [31,32] and LiTFSI of 1.0 and 1.33 g/cm3, respectively. The columnar stratum was obtained from the d-spacing (4.72 Å) of the halo reflection obtained from the WAXRD data (Figure 3c). Consequently, the calculated N value of the Colhex phase of 1 was approximately four.
Upon heating 1, small dark domains grew in a fan-like texture, as shown in the POM image (Figure 2b). In the SAXRD data at 50 °C, additional reflections appeared with the 2D hexagonal pattern. These reflections fitted well to the indexed (220), (321), (420), and (332) planes of a Cubbi with Ia3d symmetry (Figure 2a). Considering the molecular composition, the major matrix and minor 3D cylindrical networks of the Cubbi phase consisted of ionophobic alkyl chains and ionophilic TEO plus lithium salts, respectively (Figure 4). Based on the obtained SAXRD data, the two LC phases coexisted at 50–70 °C. Upon further heating to > 80 °C, the POM image became optically isotropic over the entire area. Although the primary reflection broadened, the second reflection was still observed (Figure 3a). This indicates a microphase-separated columnar structure (Coldis) with reduced long-range order [33,34]. The second reflection disappeared at 110 °C, indicating a molecularly mixed Liq state.
In contrast, ionic sample 2 with [Li+]/[EO] = 0.3 exhibited no birefringence at RT from the POM observation. In the SAXRD data, eight sharp reflections were observed (Figure 3b) with a broad halo in the WAXRD data (Figure 3c). The reflections were indexed as the lattice planes of the Cubbi phase. From the d-spacing of the (211) reflection, the best fit value for the cubic lattice parameter (a) was estimated to be 135.6 Å [35]. Upon heating, the XRD pattern at 100 °C exhibited two reflections with a q-spacing ratio of 1:2, suggestive of a phase transition to a Lam phase. The periodic lamellar thickness was estimated to be 55.1 Å. The structural transformation might be attributed to the larger lateral expansion of the flexible TEO coils during heating [35].

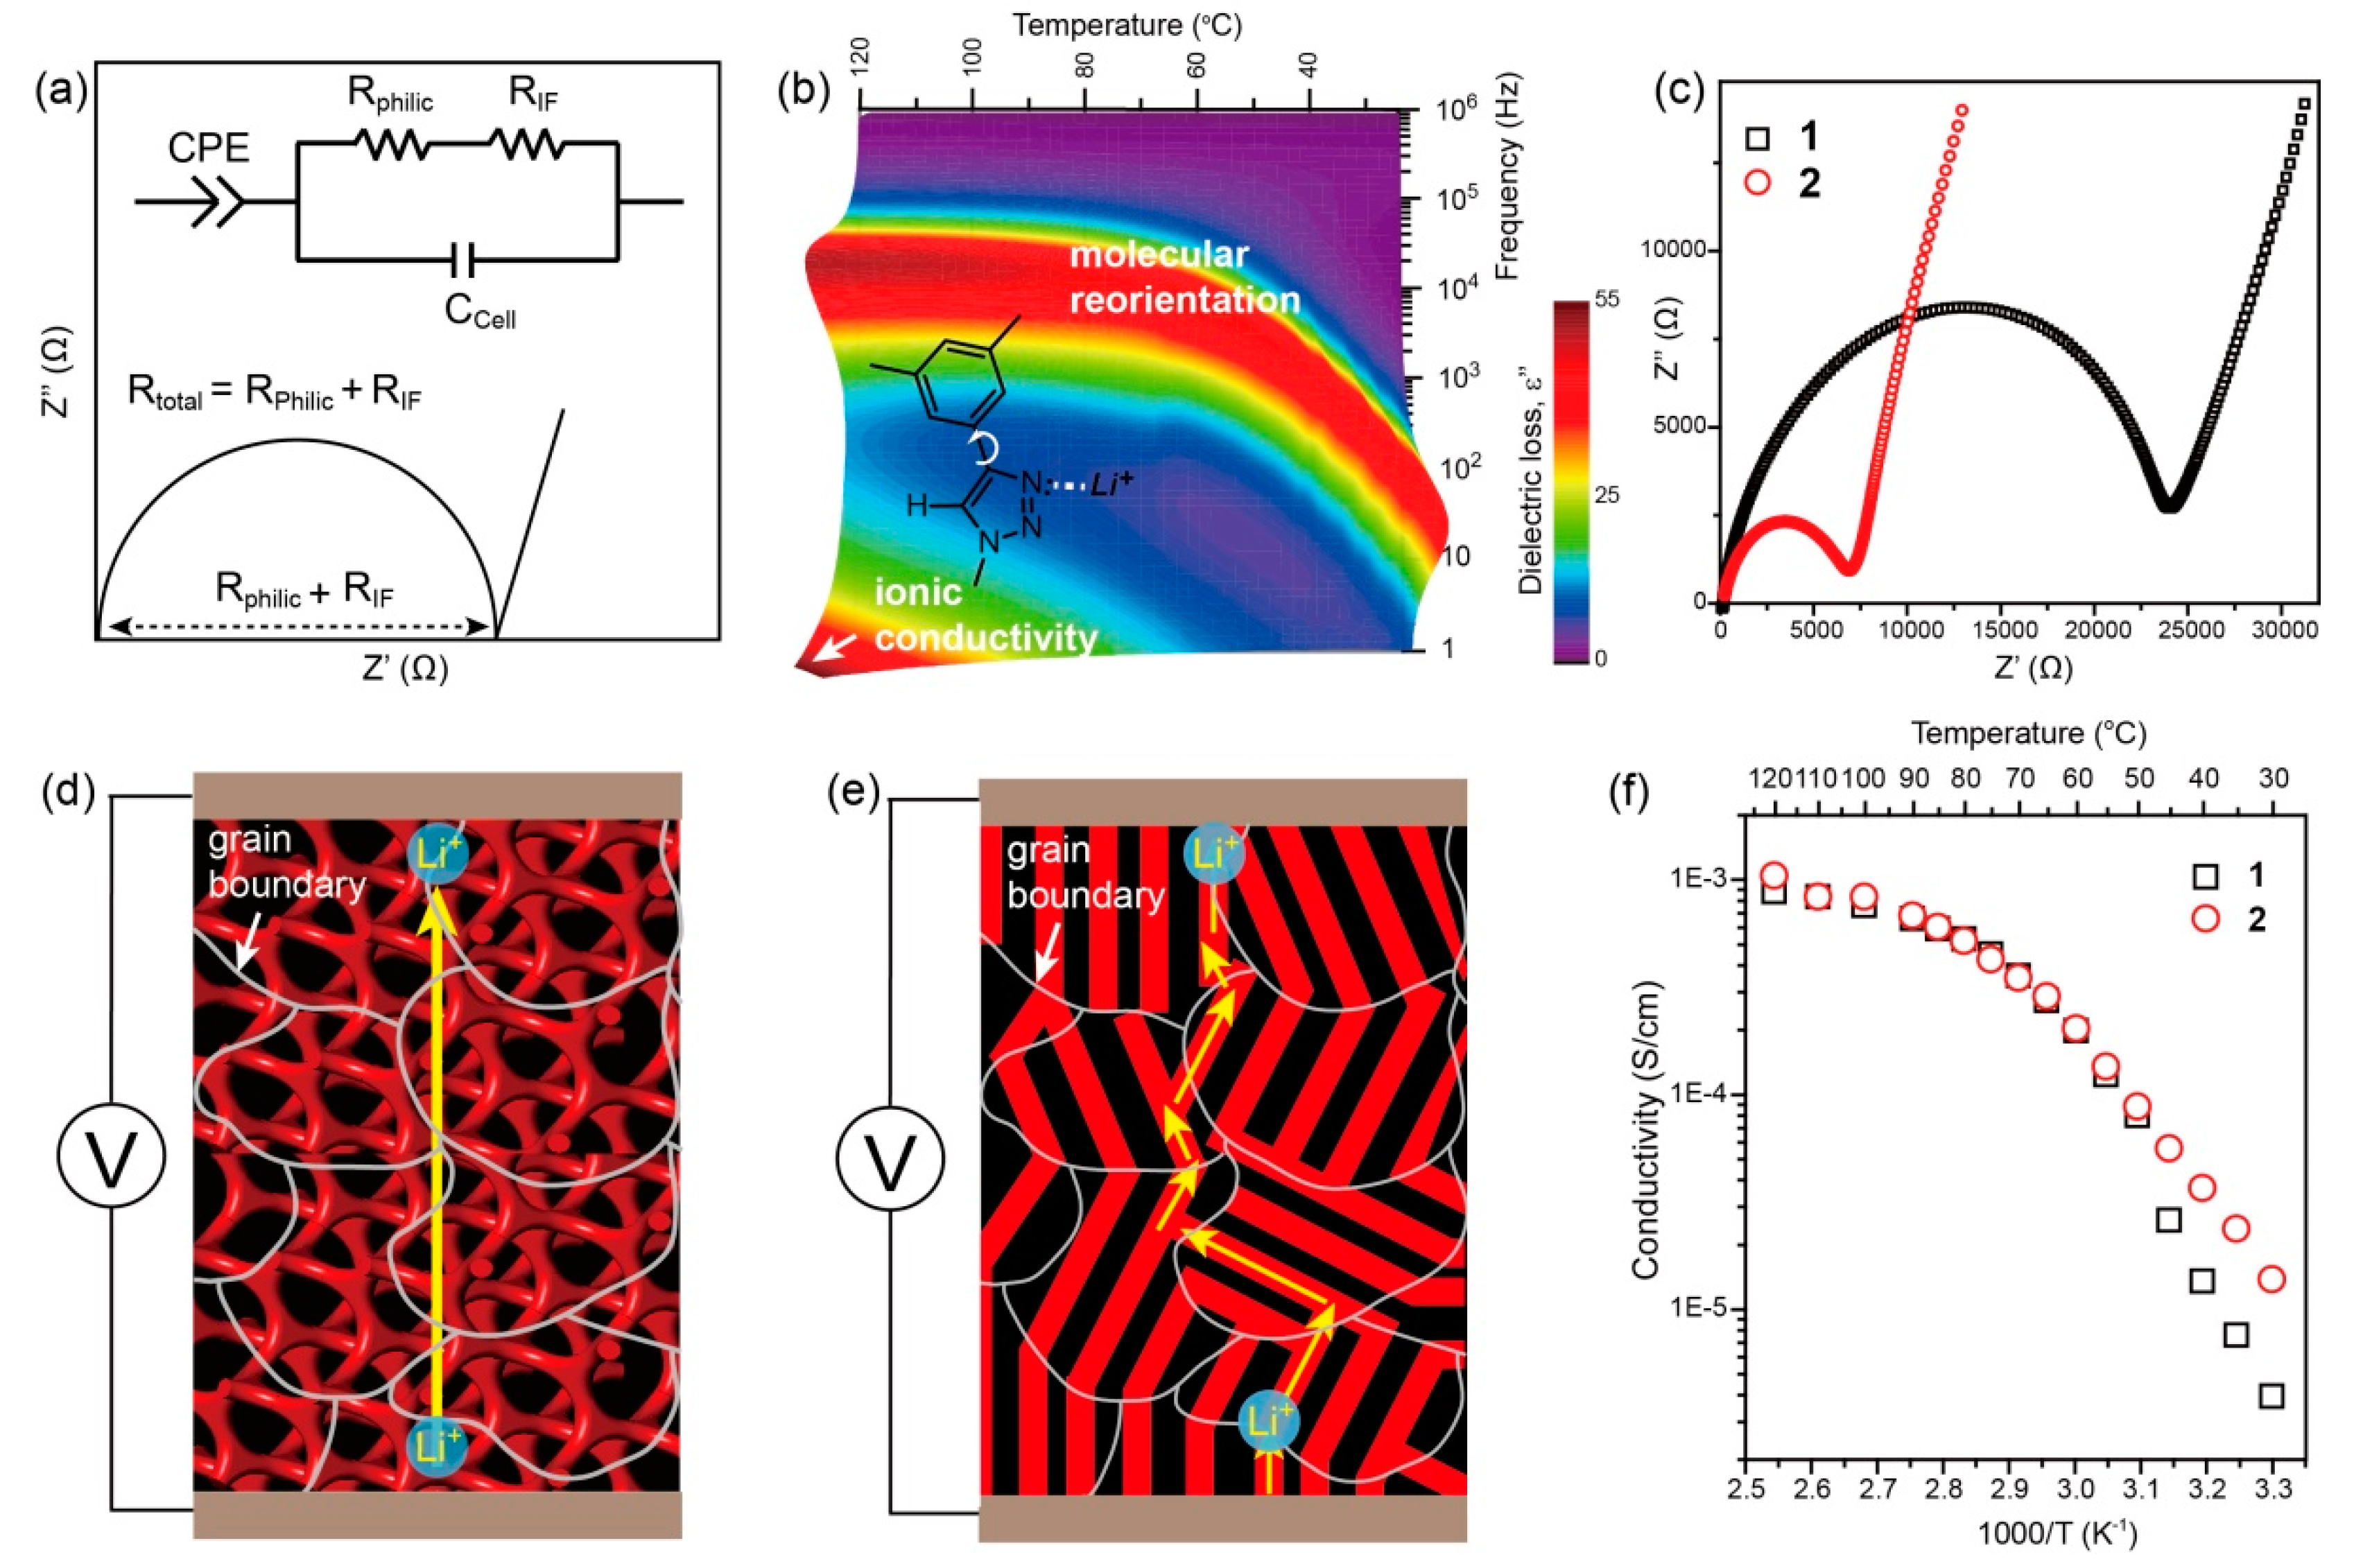
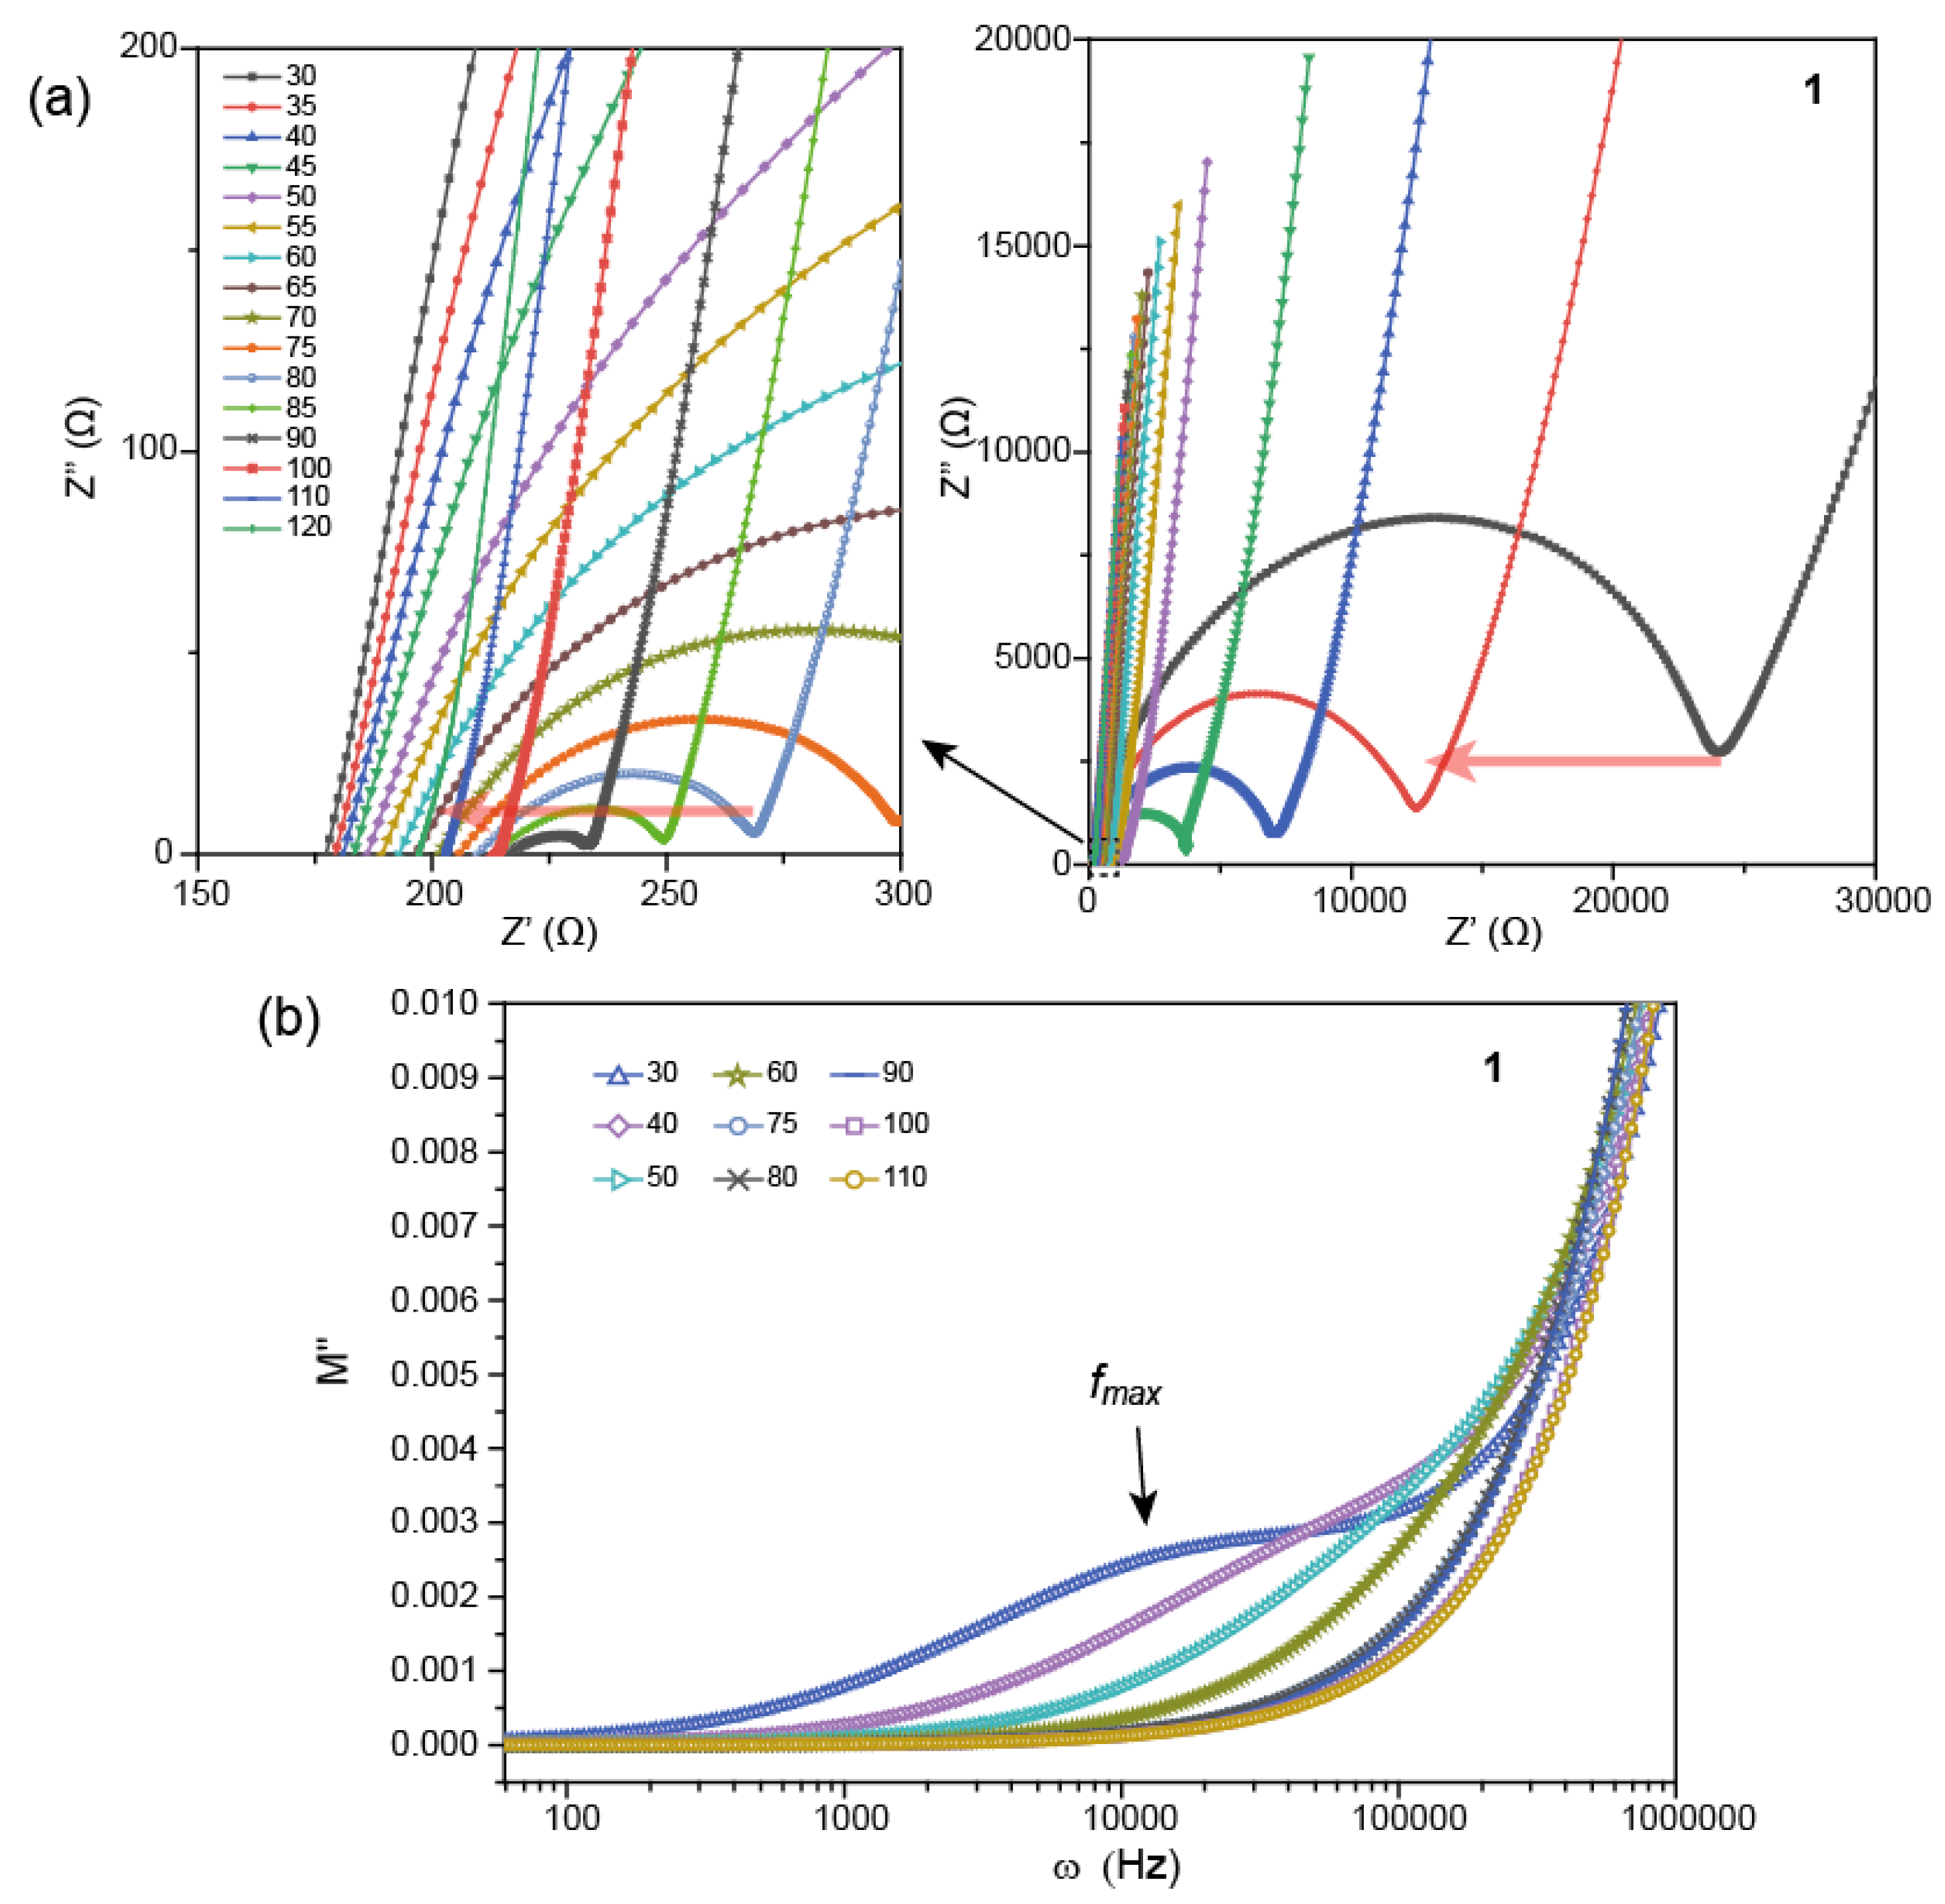
3.2. Ion-Conducting Properties Using Impedance Analysis

To examine the ionic conducting properties of 1 and 2, their impedance properties were investigated using an AC impedance analyzer. Nyquist plots were obtained over a frequency range of 50 Hz to 1 MHz at various temperatures. The Z’ and Z’’ values correspond to real and imaginary impedance components, respectively. Figure 5a shows the shape of Nyquist plots in the LC states. The Nyquist plots exhibited a semicircular shape in the high frequency region and a vertical line in the low frequency region. The vertical line indicated the formation of an electric double layer (EDL) at the electrode/electrolyte interface, which is a phase constant element (CPE). The total resistance (Rtotal) consisted of the resistance (Rphilic) in the ionophilic TEO part and the resistance (RIF) arising from the interfacial 1,2,3-triazolyl groups between the ionophilic and ionophobic parts. Because 1,2,3-triazolyl unit is well-known to coordinate lithium ion (Figure 5b) [27,36], it is also able to involve the ionic transport. The molecular dynamics of 1,2,3-triazolyl and TEO parts were examined using DRS. In the DRS spectrum, only a relaxation mode was observed over a frequency range of 10–10000 Hz [Figure 5b]. This mode corresponded to the molecular reorientational mode of triazolyl unit [27]. On the other hand, the dynamic motions of ionophilic TEOs were too rapid to be observed in the experimental frequency range. Therefore, the ionic motions associated with slower triazolyl group at the interface were retarded, causing the semicircular signal in the impedance spectrum.
As the ionic pathway becomes more complicated, the RIF may be more significant, because lithium ions encounter the interfacial area more frequently. Considering these components, the equivalent circuit of the LC phases consisted of a parallel RC element and CPE (Figure 5a). Therefore, the ionic transportation of the non-aligned samples should be dependent on the morphological features. Indeed, morphology–dependent ionic conduction behavior was identified in the Nyquist plots of samples 1 and 2 at 30 °C (Figure 5c). The Rtotal of 1 consisting of 1D conducting cylinders was 3.48 times higher than that of 2 consisting of 3D conducting networks. Under applied E-field perpendicular to electrodes, the 3D ion-conducting networks in the Cubbi phase led to a shortcut parallel to the E-field direction, minimizing the interaction with interfacial triazolyl groups (Figure 5d). In contrast, for the columnar sample, 1D ion-conducting cylinders were not parallel to the E-field direction, causing longer ionic pathways (Figure 5e). In the situation, ionic movement was inevitably hindered at the interface. Using the following equation: σ = 1/Rbulk × cell constant (0.0943 cm−1), the direct current (DC) conductivities (σ) of 1 and 2 at 30 °C were calculated to be 3.92 × 10⁻⁶ and 1.37 × 10⁻⁵ Scm−1, respectively.
Moreover, the conductivities of 1 and 2 were examined as a function of temperature (Figure 5f). At the lower temperatures (30–45 °C), the conductivity of 2 was noticeably higher than that of 1. However, the conductivities became more similar at approximately 50 °C. According to the above-mentioned structural analysis, the Cubbi structure of 1 initially formed at > 50 °C. Although the Cubbi phase was mixed with Colhex in 1, the resulting conductivity data suggest that 3D continuous channels connected 1D cylinders, forming a comparable ionic pathway of the mixed phases to that in the homogeneous Cubbi phase of 2.
In addition to the conductivity data, impedance study of the ionic LC samples is useful for understanding the nature of the ion-conducting phase and assigning structural transformation with increasing temperature. Figure 6a shows the Nyquist plots of 1 at various temperatures. With increasing temperature, the Rtotal decreased. These temperature dependent changes indicated that the ionophilic TEOs were gradually mixed with the ionophobic segments, causing the interfaces to become less distinct at higher temperatures, allowing ions to penetrate the ionophobic region. Notably, in Liq phase where the semicircle disappeared, which indicated no interface effect.
It should be noted that a semicircular shape in the Nyquist plot of 1 remained even in the optically isotropic temperature range of 80–100 °C (Figure 6a). Thus, the microphase-separated domains which lacked long-range packing order were still maintained [27,38,39]. This impedance result was consistent with the X-ray data of the Coldis phase. The semicircle signal disappeared upon Liq phase formation where no second reflection was observed in the XRD data (refer to the XRD pattern at 110 °C in Figure 3a). The Coldis-to-Liq phase transition was difficult to assign using the conventional POM technique, because both phases are optically isotropic. Thus, impedance analysis is a useful alternative for phase transition assignment in LC materials. As above-mentioned, morphology affects ionic conduction over long distances. To clarify ionic conductions over short (higher frequency) and long (lower frequency) distances, electric modulus parameters were examined: M* = M’ + jM’’ = jωε0Z*, where ω, ε0, and Z* are the angular frequency, vacuum dielectric constant, and impedance, respectively. M’’ (electric loss modulus) reflects the energy loss under the E-field, providing information regarding the individual components of the ionic conduction mechanism because the absorption peak in M’’ indicates the relaxations of ions in the electrolytes [40,41,42]. In the M’’ spectra of 1 at 30 °C, two relaxation modes were observed as a peak and a shoulder in the low and high frequency regions, respectively (Figure 6b). The flat region at M’’ = 0 in the low frequency range reflects the EDL. Because the absorption peak at low frequencies represents ion movement over long distances, it was attributed to the interface effect. This peak shifted to higher frequencies with increasing temperature and became diffuse. Nevertheless, it is clear that the onset frequency of increased M’’ shifted to a higher frequency. Finally, the M’’ spectra at 100 and 110 oC became identical. This indicates the deterioration of the interface effect. Consequently, electric modulus analysis confirmed the Coldis-to-Liq transition temperature.

4. Conclusions

In summary, a dendritic amphiphile consisting of branched alkyl peripheries and TEO coils was designed and synthesized. Because of the branched chains, non-crystallizable electrolyte materials were prepared. Electrolyte 1 with [Li+]/[EO] = 0.2 exhibited a Colhex phase at RT, while electrolyte 2 with [Li+]/[EO] = 0.3 exhibited a Cubbi phase at RT. The RT conductivity of the Cubbi in 2 was approximately three times higher than that of the Colhex in 1. The temperature–dependent conductivity of 1 and 2 demonstrated that the 3D connectivity of the Cubbi predominantly contributed to the enhanced ionic transportation. In addition to the determination of the conductivity, the impedance analyses including the Nyquist plot and electric loss modulus were used to characterize the phase transitions.

Author Contributions

Conceptualization, B.-K.C.; methodology, B.-K.C.; synthesis of compounds and characterization, T.H.D., H.-J.K. and M.L.N.; writing—original draft preparation, B.-K.C., T.H.D. and H.-J.K.; writing—review and editing, B.-K.C., T.H.D. and M.L.N. All authors have read and agreed to the published version of the manuscript.

Funding

This research received no external funding.

Acknowledgments

We would like to acknowledge the Pohang Accelerator Laboratory (UNIST-PAL beamline 6D), Korea.

Conflicts of Interest

The authors declare no conflict of interest.

References

  1. Kato, T. Self-Assembly of Phase-Segregated Liquid Crystal Structures. Science 2002, 295, 2414–2418. [Google Scholar] [CrossRef] [PubMed]
  2. Hamley, I.W. Nanotechnology with Soft Materials. Angew. Chem. Int. Ed. 2003, 42, 1692–1712. [Google Scholar] [CrossRef] [PubMed]
  3. Song, J.; Cho, B.-K. Non-Tortuous Ionic Transport in Robust Micellar Liquid Crystalline Phases with Cubic Symmetry. Chem. Commun. 2012, 48, 6821–6823. [Google Scholar] [CrossRef] [PubMed]
  4. Yoshio, M.; Mukai, T.; Ohno, H.; Kato, T. One-Dimensional Ion Transport in Self-Organized Columnar Ionic Liquids. J. Am. Chem. Soc. 2004, 126, 994–995. [Google Scholar] [CrossRef]
  5. Yoshio, M.; Kagata, T.; Hoshino, K.; Mukai, T.; Ohno, H.; Kato, T. One-Dimensional Ion-Conductive Polymer Films:  Alignment and Fixation of Ionic Channels Formed by Self-Organization of Polymerizable Columnar Liquid Crystals. J. Am. Chem. Soc. 2006, 128, 5570–5577. [Google Scholar] [CrossRef]
  6. Shimura, H.; Yoshio, M.; Hoshino, K.; Mukai, T.; Ohno, H.; Kato, T. Noncovalent Approach to One-Dimensional Ion Conductors:  Enhancement of Ionic Conductivities in Nanostructured Columnar Liquid Crystals. J. Am. Chem. Soc. 2008, 130, 1759–1765. [Google Scholar] [CrossRef]
  7. Soberats, B.; Yoshio, M.; Ichikawa, T.; Zeng, X.; Ohno, H.; Ungar, G.; Kato, T. Ionic Switch Induced by a Rectangular–Hexagonal Phase Transition in Benzenammonium Columnar Liquid Crystals. J. Am. Chem. Soc. 2015, 137, 13212–13215. [Google Scholar] [CrossRef]
  8. Shimura, H.; Yoshio, M.; Hamasaki, A.; Mukai, T.; Ohno, H.; Kato, T. Electric-Field-Responsive Lithium-Ion Conductors of Propylenecarbonate-Based Columnar Liquid Crystals. Adv. Mater. 2009, 21, 1591–1594. [Google Scholar] [CrossRef]
  9. Yoshio, M.; Mukai, T.; Kanie, K.; Yoshizawa, M.; Ohno, H.; Kato, T. Layered Ionic Liquids: Anisotropic Ion Conduction in New Self-Organized Liquid-Crystalline Materials. Adv. Mater. 2002, 14, 351–354. [Google Scholar] [CrossRef]
  10. Ohtake, T.; Ogasawara, M.; Ito-Akita, K.; Nishina, N.; Ujiie, S.; Ohno, H.; Kato, T. Liquid-Crystalline Complexes of Mesogenic Dimers Containing Oxyethylene Moieties with LiCF3SO3:  Self-Organized Ion Conductive Materials. Chem. Mater. 2000, 12, 782–789. [Google Scholar] [CrossRef]
  11. Eisele, A.; Kyriakos, K.; Bhandary, R.; Schönhoff, M.; Papadakis, C.M.; Rieger, B. Structure and Ionic Conductivity of Liquid Crystals Having Propylene Carbonate Units. J. Mater. Chem. A 2015, 3, 2942–2953. [Google Scholar] [CrossRef]
  12. Lee, J.H.; Han, K.S.; Lee, J.S.; Lee, A.S.; Park, S.K.; Hong, S.Y.; Lee, J.-C.; Mueller, K.T.; Hong, S.M.; Koo, C.M. Facilitated Ion Transport in Smectic Ordered Ionic Liquid Crystals. Adv. Mater. 2016, 28, 9301–9307. [Google Scholar] [CrossRef] [PubMed]
  13. Soberats, B.; Uchida, E.; Yoshio, M.; Kagimoto, J.; Ohno, H.; Kato, T. Macroscopic Photocontrol of Ion-Transporting Pathways of a Nanostructured Imidazolium-Based Photoresponsive Liquid Crystal. J. Am. Chem. Soc. 2014, 136, 9552–9555. [Google Scholar] [CrossRef] [PubMed]
  14. Sakuda, J.; Hosono, E.; Yoshio, M.; Ichikawa, T.; Matsumoto, T.; Ohno, H.; Zhou, H.; Kato, T. Liquid-Crystalline Electrolytes for Lithium-Ion Batteries: Ordered Assemblies of a Mesogen-Containing Carbonate and a Lithium Salt. Adv. Funct. Mater. 2014, 25, 1206–1212. [Google Scholar] [CrossRef]
  15. Kouwer, P.H.J.; Swager, T.M. Synthesis and Mesomorphic Properties of Rigid-Core Ionic Liquid Crystals. J. Am. Chem. Soc. 2007, 129, 14042–14052. [Google Scholar] [CrossRef] [PubMed]
  16. Concellón, A.; Liang, T.; Schenning, A.P.H.J.; Serrano, J.L.; Romero, P.; Marcos, M. Proton-Conductive Materials Formed by Coumarin Photocrosslinked Ionic Liquid Crystal Dendrimers. J. Mater. Chem. C 2018, 6, 1000–1007. [Google Scholar] [CrossRef] [Green Version]
  17. Kerr, R.L.; Miller, S.A.; Shoemaker, R.K.; Elliott, B.J.; Gin, D.L. New Type of Li Ion Conductor with 3D Interconnected Nanopores via Polymerization of a Liquid Organic Electrolyte-Filled Lyotropic Liquid-Crystal Assembly. J. Am. Chem. Soc. 2009, 131, 15972–15973. [Google Scholar] [CrossRef]
  18. Choi, J.-W.; Cho, B.-K. Degree of Chain Branching-Dependent Assemblies and Conducting Behavior in Ionic Liquid Crystalline Janus Dendrimers. Soft Matter 2011, 7, 4045–4049. [Google Scholar] [CrossRef]
  19. Ichikawa, T.; Yoshio, M.; Hamasaki, A.; Taguchi, S.; Liu, F.; Zeng, X.; Ungar, G.; Ohno, H.; Kato, T. Induction of Thermotropic Bicontinuous Cubic Phases in Liquid-Crystalline Ammonium and Phosphonium Salts. J. Am. Chem. Soc. 2012, 134, 2634–2643. [Google Scholar] [CrossRef]
  20. Kobayashi, T.; Ichikawa, T.; Kato, T.; Ohno, H. Development of Glassy Bicontinuous Cubic Liquid Crystals for Solid Proton-Conductive Materials. Adv. Mater. 2017, 29, 1604429. [Google Scholar] [CrossRef]
  21. Ichikawa, T.; Kato, T.; Ohno, H. 3D Continuous Water Nanosheet as a Gyroid Minimal Surface Formed by Bicontinuous Cubic Liquid-Crystalline Zwitterions. J. Am. Chem. Soc. 2012, 134, 11354–11357. [Google Scholar] [CrossRef] [PubMed]
  22. Ichikawa, T.; Sasaki, Y.; Kobayashi, T.; Oshiro, H.; Ono, A.; Ohno, H. Design of Ionic Liquid Crystals Forming Normal-Type Bicontinuous Cubic Phases with a 3D Continuous Ion Conductive Pathway. Crystals 2019, 9, 309. [Google Scholar] [CrossRef] [Green Version]
  23. Ichikawa, T.; Yoshio, M.; Hamasaki, A.; Mukai, T.; Ohno, H.; Kato, T. Self-Organization of Room-Temperature Ionic Liquids Exhibiting Liquid-Crystalline Bicontinuous Cubic Phases: Formation of Nano-Ion Channel Networks. J. Am. Chem. Soc. 2007, 129, 10662–10663. [Google Scholar] [CrossRef] [PubMed]
  24. Ichikawa, T.; Yoshio, M.; Hamasaki, A.; Kagimoto, J.; Ohno, H.; Kato, T. 3D Interconnected Ionic Nano-Channels Formed in Polymer Films: Self-Organization and Polymerization of Thermotropic Bicontinuous Cubic Liquid Crystals. J. Am. Chem. Soc. 2011, 133, 2163–2169. [Google Scholar] [CrossRef]
  25. Onuma, T.; Hosono, E.; Takenouchi, M.; Sakuda, J.; Kajiyama, S.; Yoshio, M.; Kato, T. Noncovalent Approach to Liquid-Crystalline Ion Conductors: High-Rate Performances and Room-Temperature Operation for Li-Ion Batteries. ACS Omega 2018, 3, 159–166. [Google Scholar] [CrossRef]
  26. Nguyen, M.L.; Kim, H.-J.; Cho, B.-K. Ionic effects on the self-assembly, molecular dynamics and conduction properties of a 1,2,3-triazole-based amphiphile. J. Mater. Chem. C 2018, 6, 9802–9810. [Google Scholar] [CrossRef]
  27. Kim, J.; Cho, S.; Cho, B.-K. An unusual stacking transformation in liquid-crystalline columnar assemblies of clicked molecular propellers with tunable light emissions. Chem. Eur. J. 2014, 20, 12734–12739. [Google Scholar] [CrossRef]
  28. Choi, J.-W.; Cho, B.-K. Mesomorphic and Conducting Properties of Dendritic-Linear Copolymers via Ion-Doped Additives. J. Polym. Sci. Part A Polym. Chem. 2011, 49, 2468–2473. [Google Scholar] [CrossRef]
  29. Choi, J.-W.; Ryu, M.-H.; Lee, E.; Cho, B.-K. Ion-Induced Bicontinuous Cubic and Columnar Liquid-Crystalline Assemblies of Discotic Block Codendrimers. Chem. Eur. J. 2010, 16, 9006–9009. [Google Scholar] [CrossRef]
  30. Kölbel, M.; Beyersdorff, T.; Tschierske, C.; Diele, S.; Kain, J. Thermotropic and Lyotropic Liquid Crystalline Phases of Rigid Aromatic Amphiphiles. Chem. Eur. J. 2000, 6, 3821–3837. [Google Scholar] [CrossRef]
  31. Beltrán, E.; Serrano, J.L.; Sierra, T.; Giménez, R. Functional Star-Shaped Tris(triazolyl)triazines: Columnar Liquid Crystal, Fluorescent, Solvatofluorochromic and Electrochemical Properties. J. Mater. Chem. 2012, 22, 7797–7805. [Google Scholar] [CrossRef]
  32. Beltrán, E.; Serrano, J.L.; Sierra, T.; Giménez, R. Tris(triazolyl)triazine via Click-Chemistry: A C3 Electron-Deficient Core with Liquid Crystalline and Luminescent Properties. Org. Lett. 2010, 12, 1404–1407. [Google Scholar] [CrossRef] [PubMed] [Green Version]
  33. Sakamoto, N.; Hashimoto, T. Order−Order and Order−Disorder Transitions in a Polystyrene-block-Polyisoprene-block-Polystyrene Copolymer. Macromolecules 1997, 30, 1621–1632. [Google Scholar] [CrossRef]
  34. Nguyen, M.L.; Shin, T.J.; Kim, H.-J.; Cho, B.-K. Oriented Columnar Films of a Polar 1,2,3-Triazole-Based Liquid Crystal Prepared by Applying an Electric Field. J. Mater. Chem. C 2017, 5, 8256–8265. [Google Scholar] [CrossRef]
  35. Chung, Y.-W.; Lee, J.-K.; Zin, W.-C.; Cho, B.-K. Self-Assembling Behavior of Amphiphilic Dendron Coils in the Bulk Crystalline and Liquid Crystalline States. J. Am. Chem. Soc. 2008, 130, 7139–7147. [Google Scholar] [CrossRef]
  36. Kirsch, C.; Pulst, M.; Samiullah, M.H.; Ruda, P.; Hasan, N.; Kressler, J. 1,2,3-Triazole mediated Li+-ion conductivity in poly(ethylene oxide) based electrolytes. Solid State Ionics 2017, 309, 163–169. [Google Scholar] [CrossRef]
  37. Massarotti, A.; Aprile, S.; Mercalli, V.; Grosso, E.D.; Grosa, G.; Sorba, G.; Tron, G.C. Are 1,4- and 1,5-Disubstituted 1,2,3-Triazoles Good Pharmacophoric Groups? ChemMedChem 2014, 9, 2497–2508. [Google Scholar] [CrossRef]
  38. Dias, F.B.; Batty, S.V.; Voss, J.P.; Ungar, G.; Wright, P.V. Ionic Conductivity of a Novel Smectic Polymer Electrolyte. Solid State Ion. 1996, 85, 43–49. [Google Scholar] [CrossRef]
  39. Liu, J.; Zheng, Y.; Liao, Y.-P.; Zeng, X.; Ungar, G.; Wright, P.V. Organisation in Two Series of Low-Dimensional Polymer Electrolytes with High Ambient Lithium Salt Conductivity. Faraday Discuss. 2005, 128, 363–378. [Google Scholar] [CrossRef]
  40. Sangeetha, R.S.D.; Arasu, P.T.; Hirankumar, G.; Bella, R.S.D. Analysis of Dielectric, Modulus, Electrochemical Stability of PVP-ABSA Polymer Electrolyte Systems. Int. J. Chem. Sci. 2016, 14, 477–481. [Google Scholar]
  41. Pradhan, D.K.; Choudhary, R.N.P.; Samantaray, B.K. Studies of Dielectric Relaxation and AC Conductivity Behavior of Plasticized Polymer Nanocomposite Electrolytes. Int. J. Electrochem. Sci. 2008, 3, 597–608. [Google Scholar]
  42. Starkweather, H.W.; Avakian, P. Conductivity and the Electric Modulus in Polymers. J. Polym. Sci. Part B Polym. Phys. 1992, 30, 637–641. [Google Scholar] [CrossRef]
Figure 1. Molecular structure of the amphiphile AB2 and its corresponding ionic samples prepared by LiTFSI doping. In this molecular design, the non-crystallizable branched alkyl chains were connected to the aromatic core to suppress crystallization. EO indicates the ethylene oxide unit.
Crystals 10 00193 g001
Scheme 1. Synthetic route of the amphiphile AB2.
Crystals 10 00193 sch001
Figure 2. (a) DSC thermograms of the amphiphile AB2 and its ionic samples upon heating at a scanning rate of 10 °C/min. (b) POM images of ionic sample 1 upon heating. The dark domains in the fan-like background correspond to the Cubbi phase. Colhex, hexagonal columnar; Cubbi, bicontinuous cubic; Coldis, disordered columnar; Lam, lamellar; Liq, Liquid phase.
Crystals 10 00193 g002
Figure 3. SAXRD data of (a) 1 and (b) 2 at various temperatures. (c) WAXRD data of 1 and 2 at RT. In (a), the arrow in the Coldis phase indicates the second reflection.
Crystals 10 00193 g003
Figure 4. Schematic representations of the liquid crystalline (LC) self-assemblies of (a) 1 and (b) 2. Red and grey indicate the ionophilic and ionophobic parts, respectively.
Crystals 10 00193 g004
Figure 5. (a) Schematic representation of the Nyquist plot in the LC state. (b) DRS spectrum of 1, and the interaction mode between 1,2,3-triazoyl unit and lithium ion. According to a recent publication [37], the N3 nitrogen atom has a higher propensity to interact with lithium ion dominantly. (c) Nyquist plots of 1 and 2 at 30 °C. Schematic figures of the ionic conduction pathways in (d) the Cubbi and (e) the Colhex phases. (f) Ionic conductivities of 1 and 2 as a function of temperature.
Crystals 10 00193 g005
Figure 6. (a) Nyquist plots and (b) electric loss modulus of 1 as a function of temperature. In the left panel of (a), the “off-set” of Z’ value at 30–90 °C is related to the indium tin oxide (ITO) electrode.
Crystals 10 00193 g006

