Article

Near Atomic Row Matching in the Interface Analyzed in Both Direct and Reciprocal Space

School of Materials Science and Engineering, University of Science and Technology Beijing, Beijing 100083, China
Crystals 2020, 10(3), 192; https://doi.org/10.3390/cryst10030192
Submission received: 6 February 2020 / Revised: 20 February 2020 / Accepted: 9 March 2020 / Published: 11 March 2020
(This article belongs to the Special Issue Crystallography of Structural Phase Transformations)

Abstract

:
Reproducible crystallographic features between new phase and matrix are often observed during phase transformation, including orientation relationship, interfacial orientation, morphology, and so on. The geometrical matching in the interface is the key to understanding the preferred transformation crystallography. Recently, a new geometrical method emphasizing the atomic row matching in the interface, the so-called near row matching method, has been proposed to predict the preferred orientations between two arbitrary crystals. In this work, this method originally expressed in direct space was further extended to the reciprocal space. These two methods were implemented in our free software PTClab (version 1.19). It is found that these two expressions are nearly equivalent. As the near row matching in reciprocal space could be directly measured by the diffraction patterns with transmission electron microscopy (TEM), the condition of atomic row matching would be easily identified in reciprocal space during TEM work, and could be applied to rationalize the experimental observations. Several examples in bothsmall and large misfit alloy systems are shown to apply the near tow matching method in both direct and reciprocal space. Furthermore, the row matching method is compared with other models, and there are some crucial aspects that need extra attention when being applied to prediction.

1. Introduction

Phase transformation is one of the important processes to strengthen metallic materials. Therefore, understanding the mechanism of phase transformation is indispensible for controlling the microstructures [1]. During the phase transformation, specific crystallographic relationships often form between new phase and matrix in order to form the interface with low interfacial energy, and thus lower the energy barrier of phase transformation. The crystallographic relationships include reproducible orientation relationships (ORs) between new phase and matrix, specific interfacial orientations (IOs), and so on [2,3]. To lower the interfacial energy, a special interfacial structure will form therein, thus the interfacial structure is the key to understanding the formation mechanism of these crystallographic features [4,5].
Various models based on geometrical matching in the interface have been proposed for diffusional phase transformations [2,6,7,8], such as the structural ledge model [9,10], invariant line model [11,12,13,14], O-line model [15,16] based on the O-lattice theory [17,18], near coincidence sites method/good matching site method [19,20,21], edge-to-edge matching method [3,22,23], topological model [24], and so on. Most of these methods have been implemented in our free software for calculating transformation crystallography, named PTCLab [25]. Despite these advances in rationalizing crystallographic features [26], general methods capable of predicting transformation crystallography in both a small and large misfit system are still limited, except for the coincidence of the reciprocal lattice points (CRLP) method [27,28], edge-to-edge (E2E) matching method, and so on.
In the CRLP method, the predicted OR has the largest intersection volume between the reciprocal lattice points in three-dimensions, that is, maximizing the coincidence of reciprocal lattice points with the same sizes. Recently, Gautm and Howe [28] have extended this method with the intersection of real diffraction intensities, where the chemical effect would be taken into account by using real diffraction intensities. In the E2E matching method, a pair of (nearly) close-packed directions from two lattices with good matching is set to be parallel, and then a pair of (nearly) close-packed lattice planes containing this good matching direction with similar interplanar spacing is searched, and the initial OR is determined according to the parallelism of these crystal directions and planes. Finally, refinement of the ORs is carried out according to the E2E matching at the interface. Recently, Zhang et al. [29] proposed a new rigid method to predict ORs and IOs, and this method is named the near row matching method (NRM). The near row matching of atomic or lattice rows in the interface is preserved in their method. Accordingly, various ORs could be predicted in addition to the IO as the plane containing the matching rows. This method is similar to the E2E model at first glance, as both methods are based on the row matching in the interface. The difference between these two methods has not been explored. In addition, exact atomic row matching in direct space is found, which also implies a row matching of reciprocal points [30], and the difference between the NRM and CRLP method is unknown. Moreover, in the E2E method, owing to similar interplanar spacing of crystal planes, near coincidence of reciprocal vectors is also retained at its predicted OR. Therefore, these prediction methods share some commonalities from a rough comparison in reciprocal space, and the differences between these prediction methods still need to be investigated further, which is crucial to practical applications. Besides, the crystallographic features are often determined by the diffraction method and the matching condition of reciprocal points is quite easy to identify during experimental operation. Therefore, the NRM method expressed in the reciprocal space is also worth exploring.
In this work, the physical basis of geometric matching is illustrated, and then the NRM in direct space will be systematically extended to the reciprocal space, that is, the row matching of reciprocal lattices (diffraction patterns). Next, the application of the NRM methods will be shown in both direct and reciprocal space. Furthermore, the NRM method for predicting crystallographic features will be shown. Finally, the differences between present NRM methods and other methods capable of prediction will be shown.

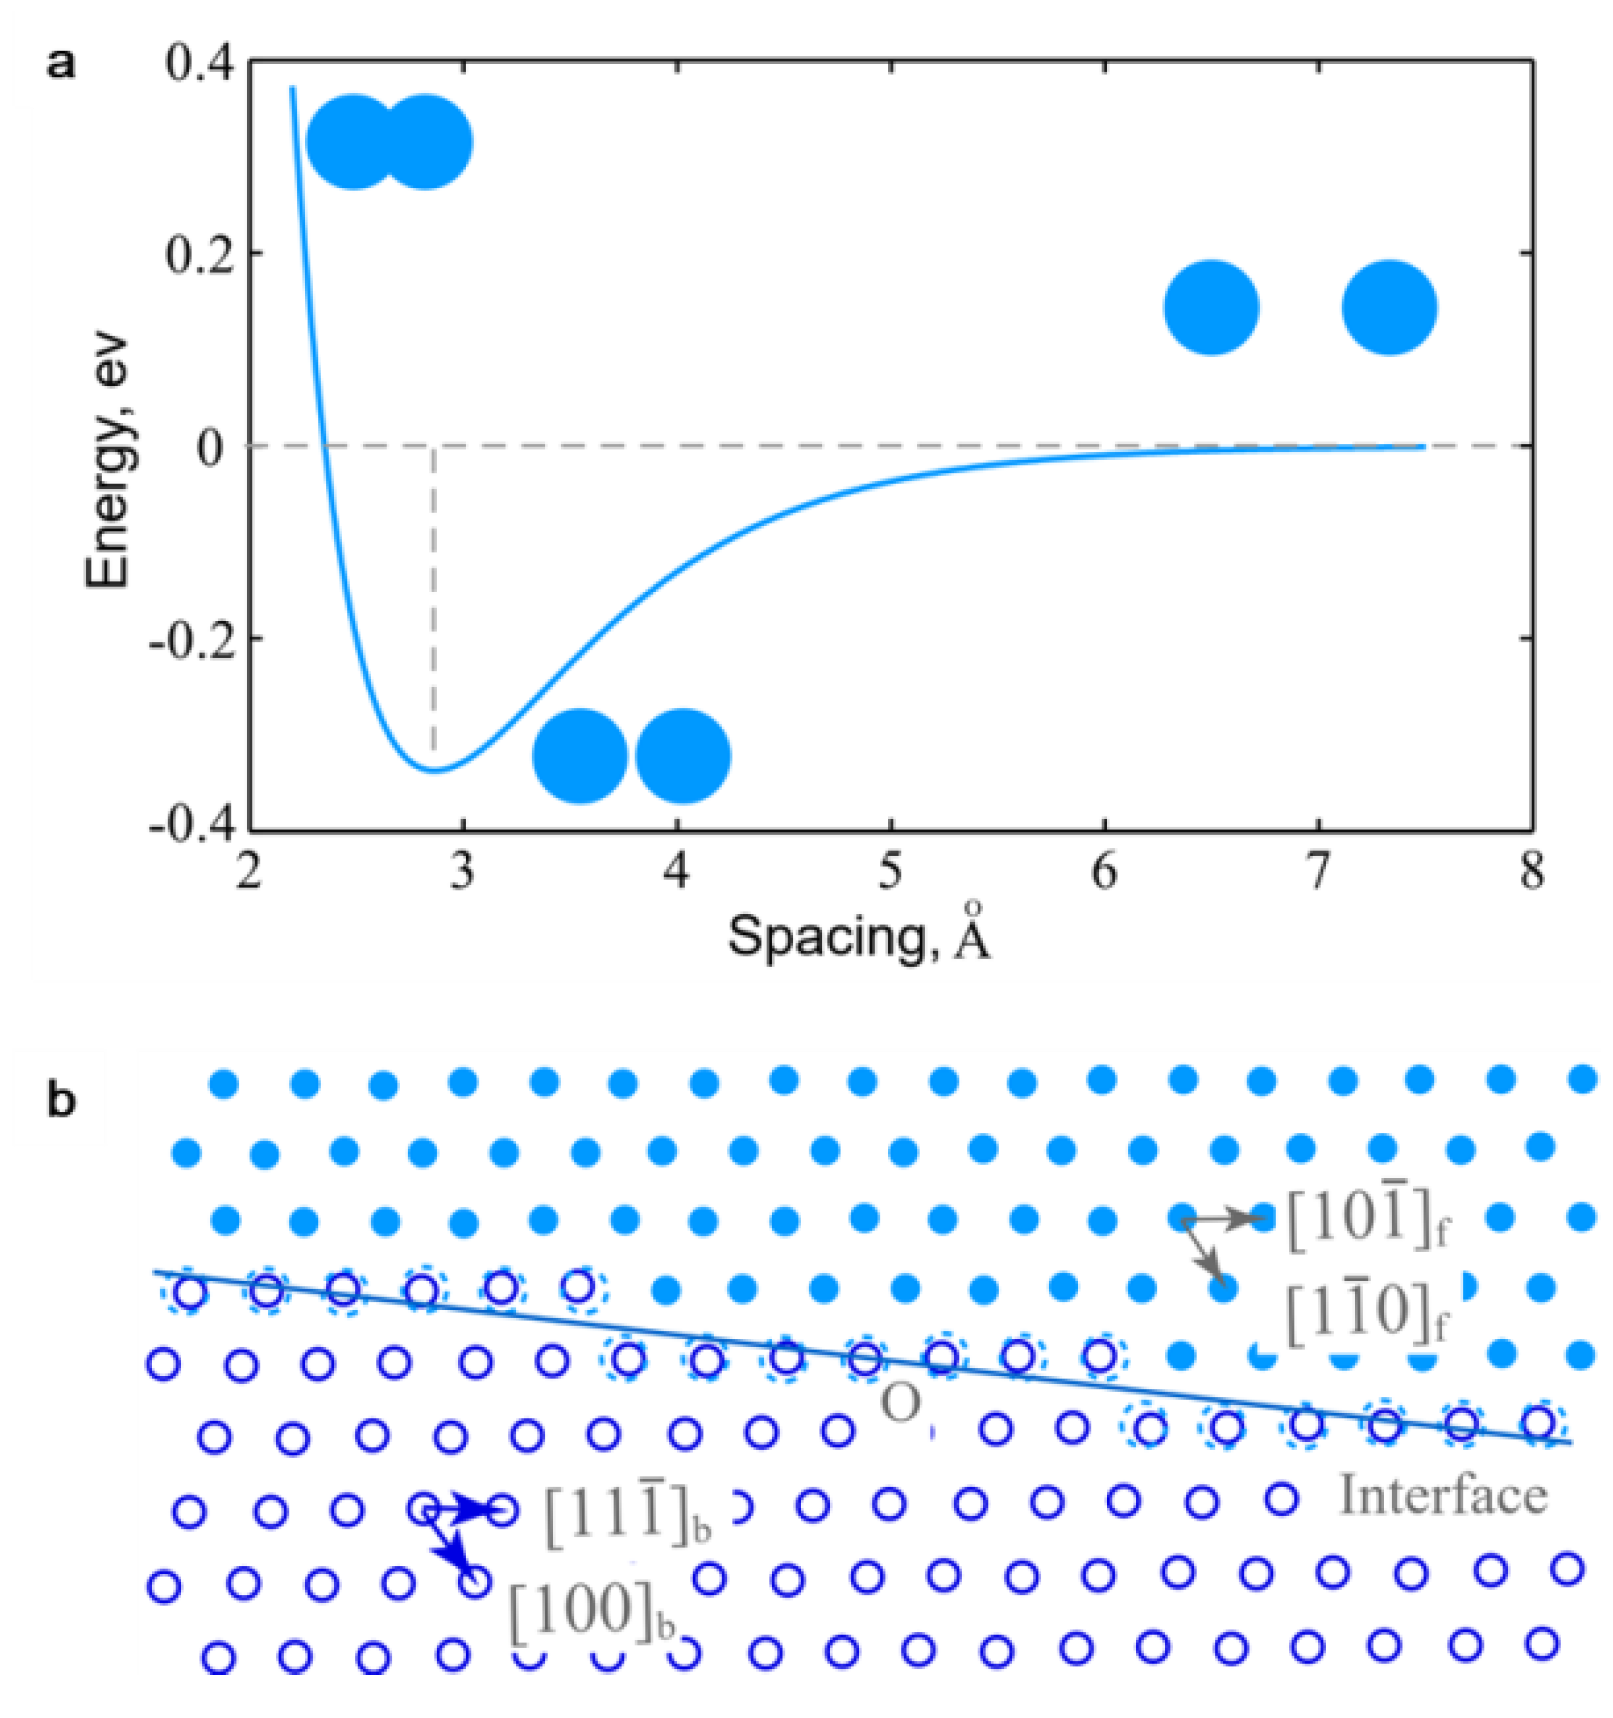
2. Interfacial Structure and Energy

Good matching in the interface is generally recognized and applied to rationalize the observed crystallographic features [2,3]. This could be qualitatively explained by the interaction between atoms [5]. Figure 1a shows a typical curve of total energy varied with the interspacing between two atoms. When two atoms stay far from each other, the interaction energy is 0 (reference state). They increasingly attract to one another and the total energy gradually decreases. When the atoms get close enough, the total energy increases very rapidly owing to an overall repulsion. The lowest energy state corresponds to an equivalent interaction distance. Figure 1b shows an interface between two 2D dissimilar crystals, and the atoms at the interface nearly locate at the equivalent positions for both lattices, the so-called coherent interface; thus, the interfacial energy is nearly zero when only the first nearest neighbor interaction between atoms is considered. Therefore, atomic matching is important for the interface to reach a low energy state. However, a coherent interfaces are few between dissimilar crystals, that is, it is rare to form an exact coincidence site lattice at the interface [17]. Nevertheless, near coincidence sites (NCSs) are applied in a general way [19], and an NCS is the lattice point where the misfit is smaller than a given value. An NCS is also called a good matching site (GMS, will be used hereafter). The preferred interface corresponding to low interfacial energy should have a considerable fraction of GMS clusters, which forms coherent patches after relaxation. There are dislocations between coherent patches.
Energetic studies show that exact atomic row matching in the interface would correspond to a local minimum in interfacial energy [31,32,33], where a pair of atomic rows are parallel and have equal spacing, that is, atomic row-to-row matching. In this circumstance, the atomic planes containing these atomic rows will match edge-to-edge in the interface. Figure 1a may correspond to the atomic row matching with atomic rows normal to the paper. This condition was firstly applied in martensitic crystallography by Frank [34], and later developed by Kelly and Zhang for precipitation crystallography [22,35]. However, exact row-to-row matching requires special lattice parameters [22]. Moreover, the index of IO for the interface containing atomic rows would be rational, but the IOs in typical metallic materials are irrational in nature, i.e., the index cannot be expressed in low integers [2]. Although exact atomic row matching is rare, near atomic row matching can be reached somehow, such as the interface in Figure 2a indicated by red rectangle. In Figure 2a, the atomic rows are perpendicular to the paper, and the view direction is along the atomic row direction. Therefore, the NRM method is proposed [29], which allows a small misfit between parallel atomic rows. Thus, GMS clusters can be found along the atomic row and between rows.

3. Near Row Matching Method

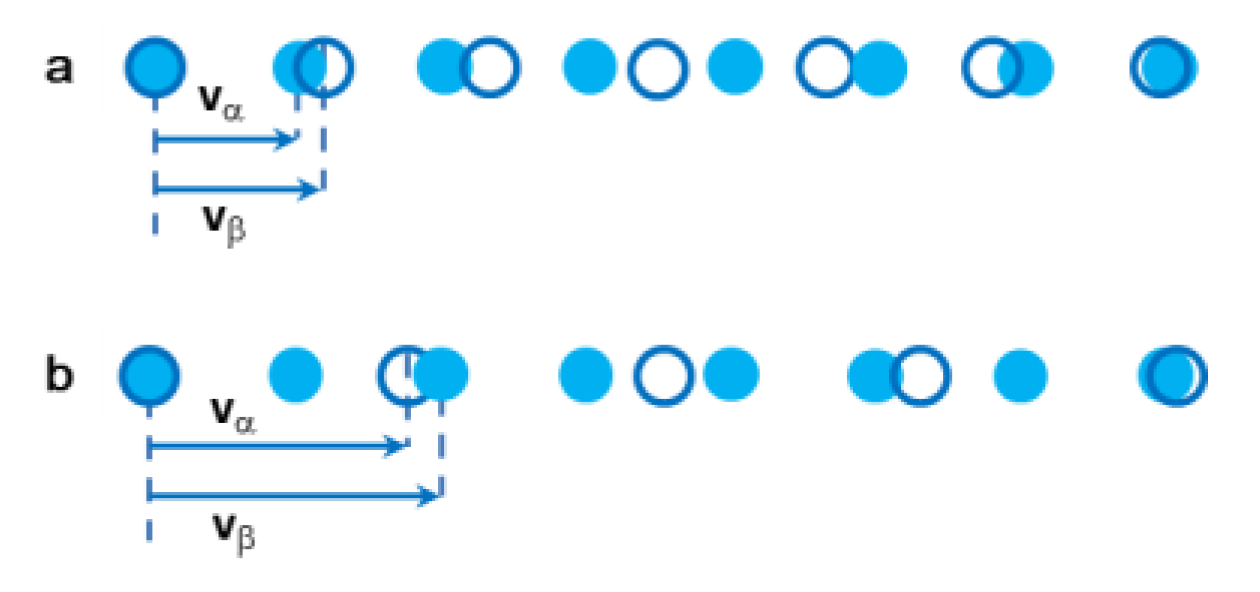
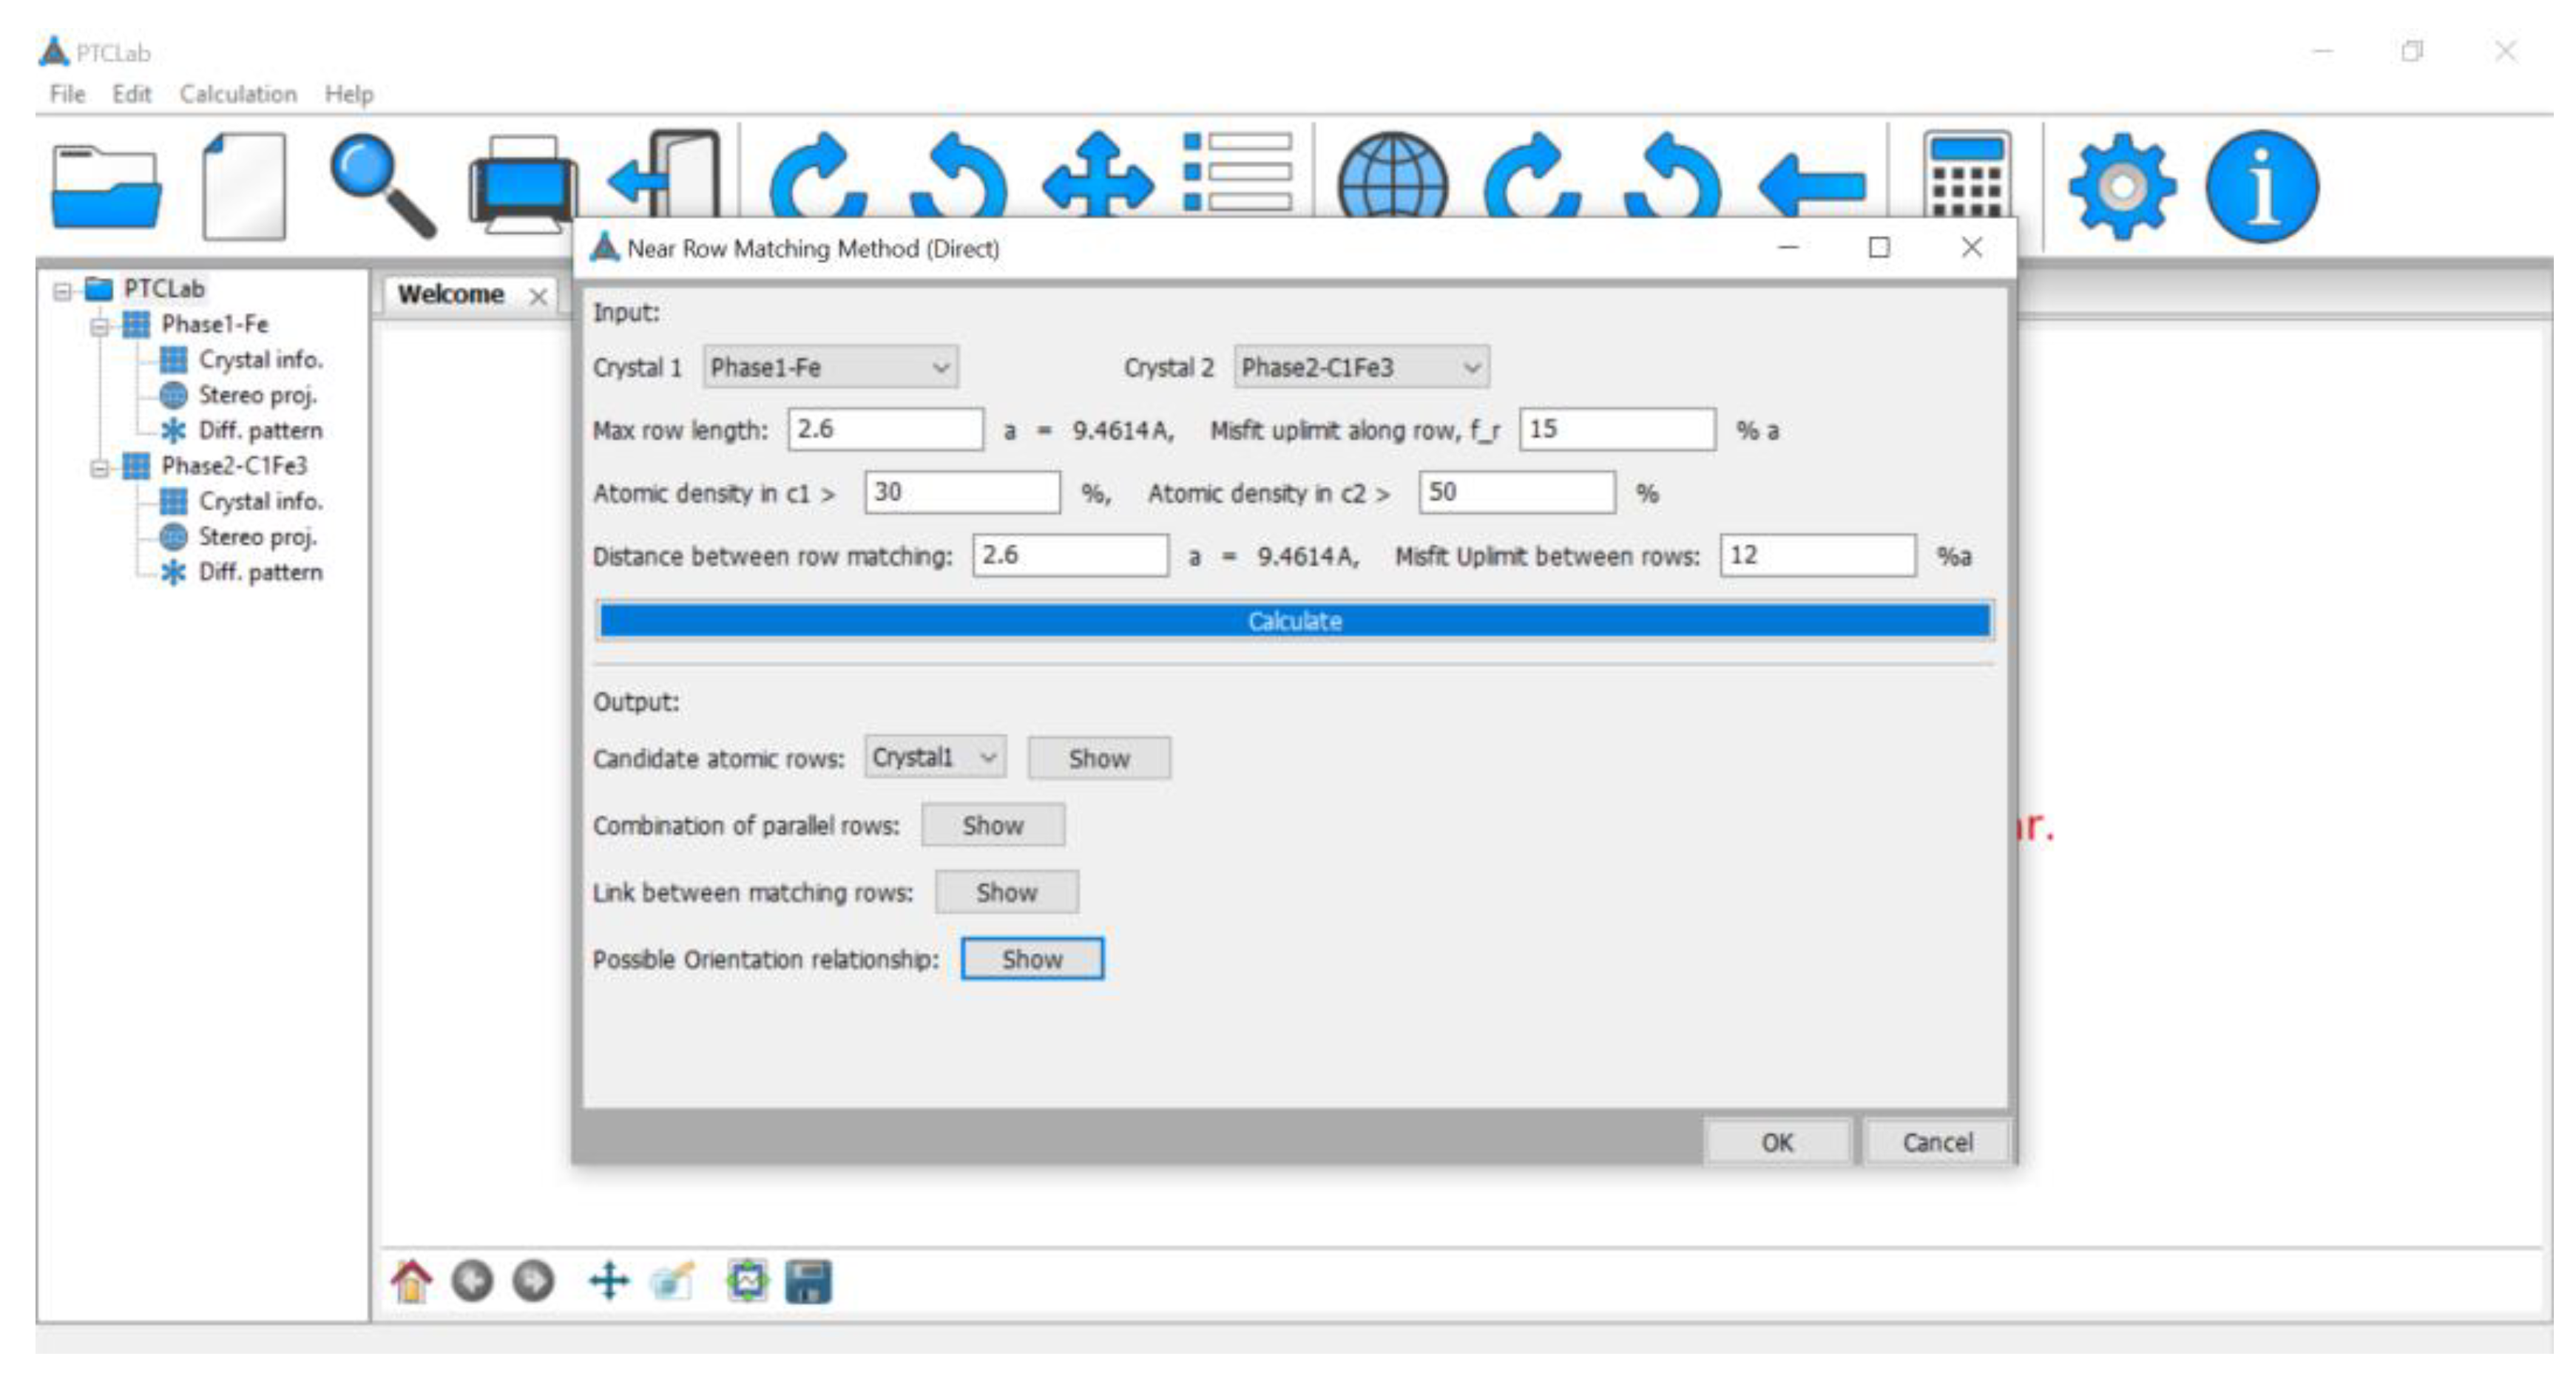
3.1. Near Row Matching Method in Direct Space

Taking Figure 2b as an example, three steps are proposed to calculate the crystallography in the NRM method [29].
(1) The first step is to find a pair of parallel rational atomic rows vα1//vβ1 in the interface, where vα1 and vβ1 are closely related from α and β lattices, respectively. The misfit between the atomic rows is smaller than a criterion δ (up to 25%b, b is the length of the shortest translation vector in smaller lattice among α and β), so the vα1 and vβ1 define a GMS.
Δ v = v β 1 v α 1 | Δ v | < δ
In addition, the length of atomic rows should not be too large to reach the dense GMSs for the sake of lower interfacial energy. The recommended upper limit length for the atomic row is the length of (near) close packed direction from the larger lattice for the first trial.
(2) The second step is to find a pair of vectors vα2 and vβ2 from α and β lattices, respectively, which would determine the misfit between the atomic rows. The row misfit indicated by arrows in Figure 2b is defined by
Δ r r = r β r α ,
where the atomic row spacing rα and rβ are
r α   =   | v α 2 × v α 1 | | v α 1 |
r β   =   | v β 2 × v β 1 | | v β 1 |
Δr = 0 in Equation (2a) corresponds to exact atomic row to row matching, and the atomic misfit is only along the row direction. The distribution of GMSs along vα1//vβ1 will repeated at other atomic rows owing to the periodic nature of the crystal lattices. The smaller the row misfit |Δr|, the better the atomic row matching achieved. In order to reach dense GMSs, vα2 and vβ2 are also not too large and are limited within a length range similar to the selection of vα1 and vβ1. Thus, a pair of vectors vα2 and vβ2 could be found with the row misfit smaller than a criterion δ or the values specified by users.
(3) The final step is to determine the OR and IO. The OR is defined by
v α 1 / / v β 1 g α 1 / / g β 1
where
g α 1 / / v α 2 × v α 1 g β 1 / / v β 2 × v β 1
and the preferred interface containing the atomic rows is defined by
g α 1 / / g β 1
Using these three steps, various ORs and IOs can be predicted. The equivalent results are excluded finally. It should be noted that the orientation of the interface is predicted naturally in this model despite the alloy systems. Sometimes, finding vα and vβ in the complex structures may be difficult, but we will apply the crystal lattice instead for such cases. This is because the GMS cluster is defined by selecting matching lattices vectors vα and vβ, and the GMS clusters will repeat owing to the periodicity of the lattice structures. When actual atoms are taken into consideration, the same periodicity will hold. The selection of δ requires a little effort and a suitable δ would help to define a GMS cluster in the system.
It is noted that the closely related vectors vα1 and vβ1 to define a GMS may have correspondence such as that shown in Figure 3. Figure 3a shows a one-to-one correspondence typical for a small misfit system; this correspondence is also called the primary preferred state by Bollmann [18]. For a large misfit system, the correspondence may be one-to-x or even x-to-y correspondence, as shown in Figure 3b, where x(y) means a multiple of basic translational vectors. This correspondence is called the secondary preferred state [18]. Misfit displacement, as shown in Equation (1), is often used to identify GMSs, and originated from the structural ledge model [9,10]. In real interface, the GMSs will be relaxed to form coherent patches, and the constrained strain is related to the misfit strain. According to the misfit defined by Equation (1), the misfit strain is defined as
ε = (vβ1vα1)/|vα1|
The misfit strain between atomic rows could be defined as
ε r   =   r β r α r α
The preference between various predicted ORs could be compared with this misfit strain. The interface with low energy prefers dense GMSs and a small misfit strain. The local area density of GMS around the origin depends on both the length of the matching row vα1//vβ1 and the row spacing, that is, 1 | v α 2 × v α 1 | or 1 | v β 2 × v β 1 | . On the basis of Equation (3b), the area density of GMS is in proportion to the inverse of the length of g vectors gα1 or gβ1.

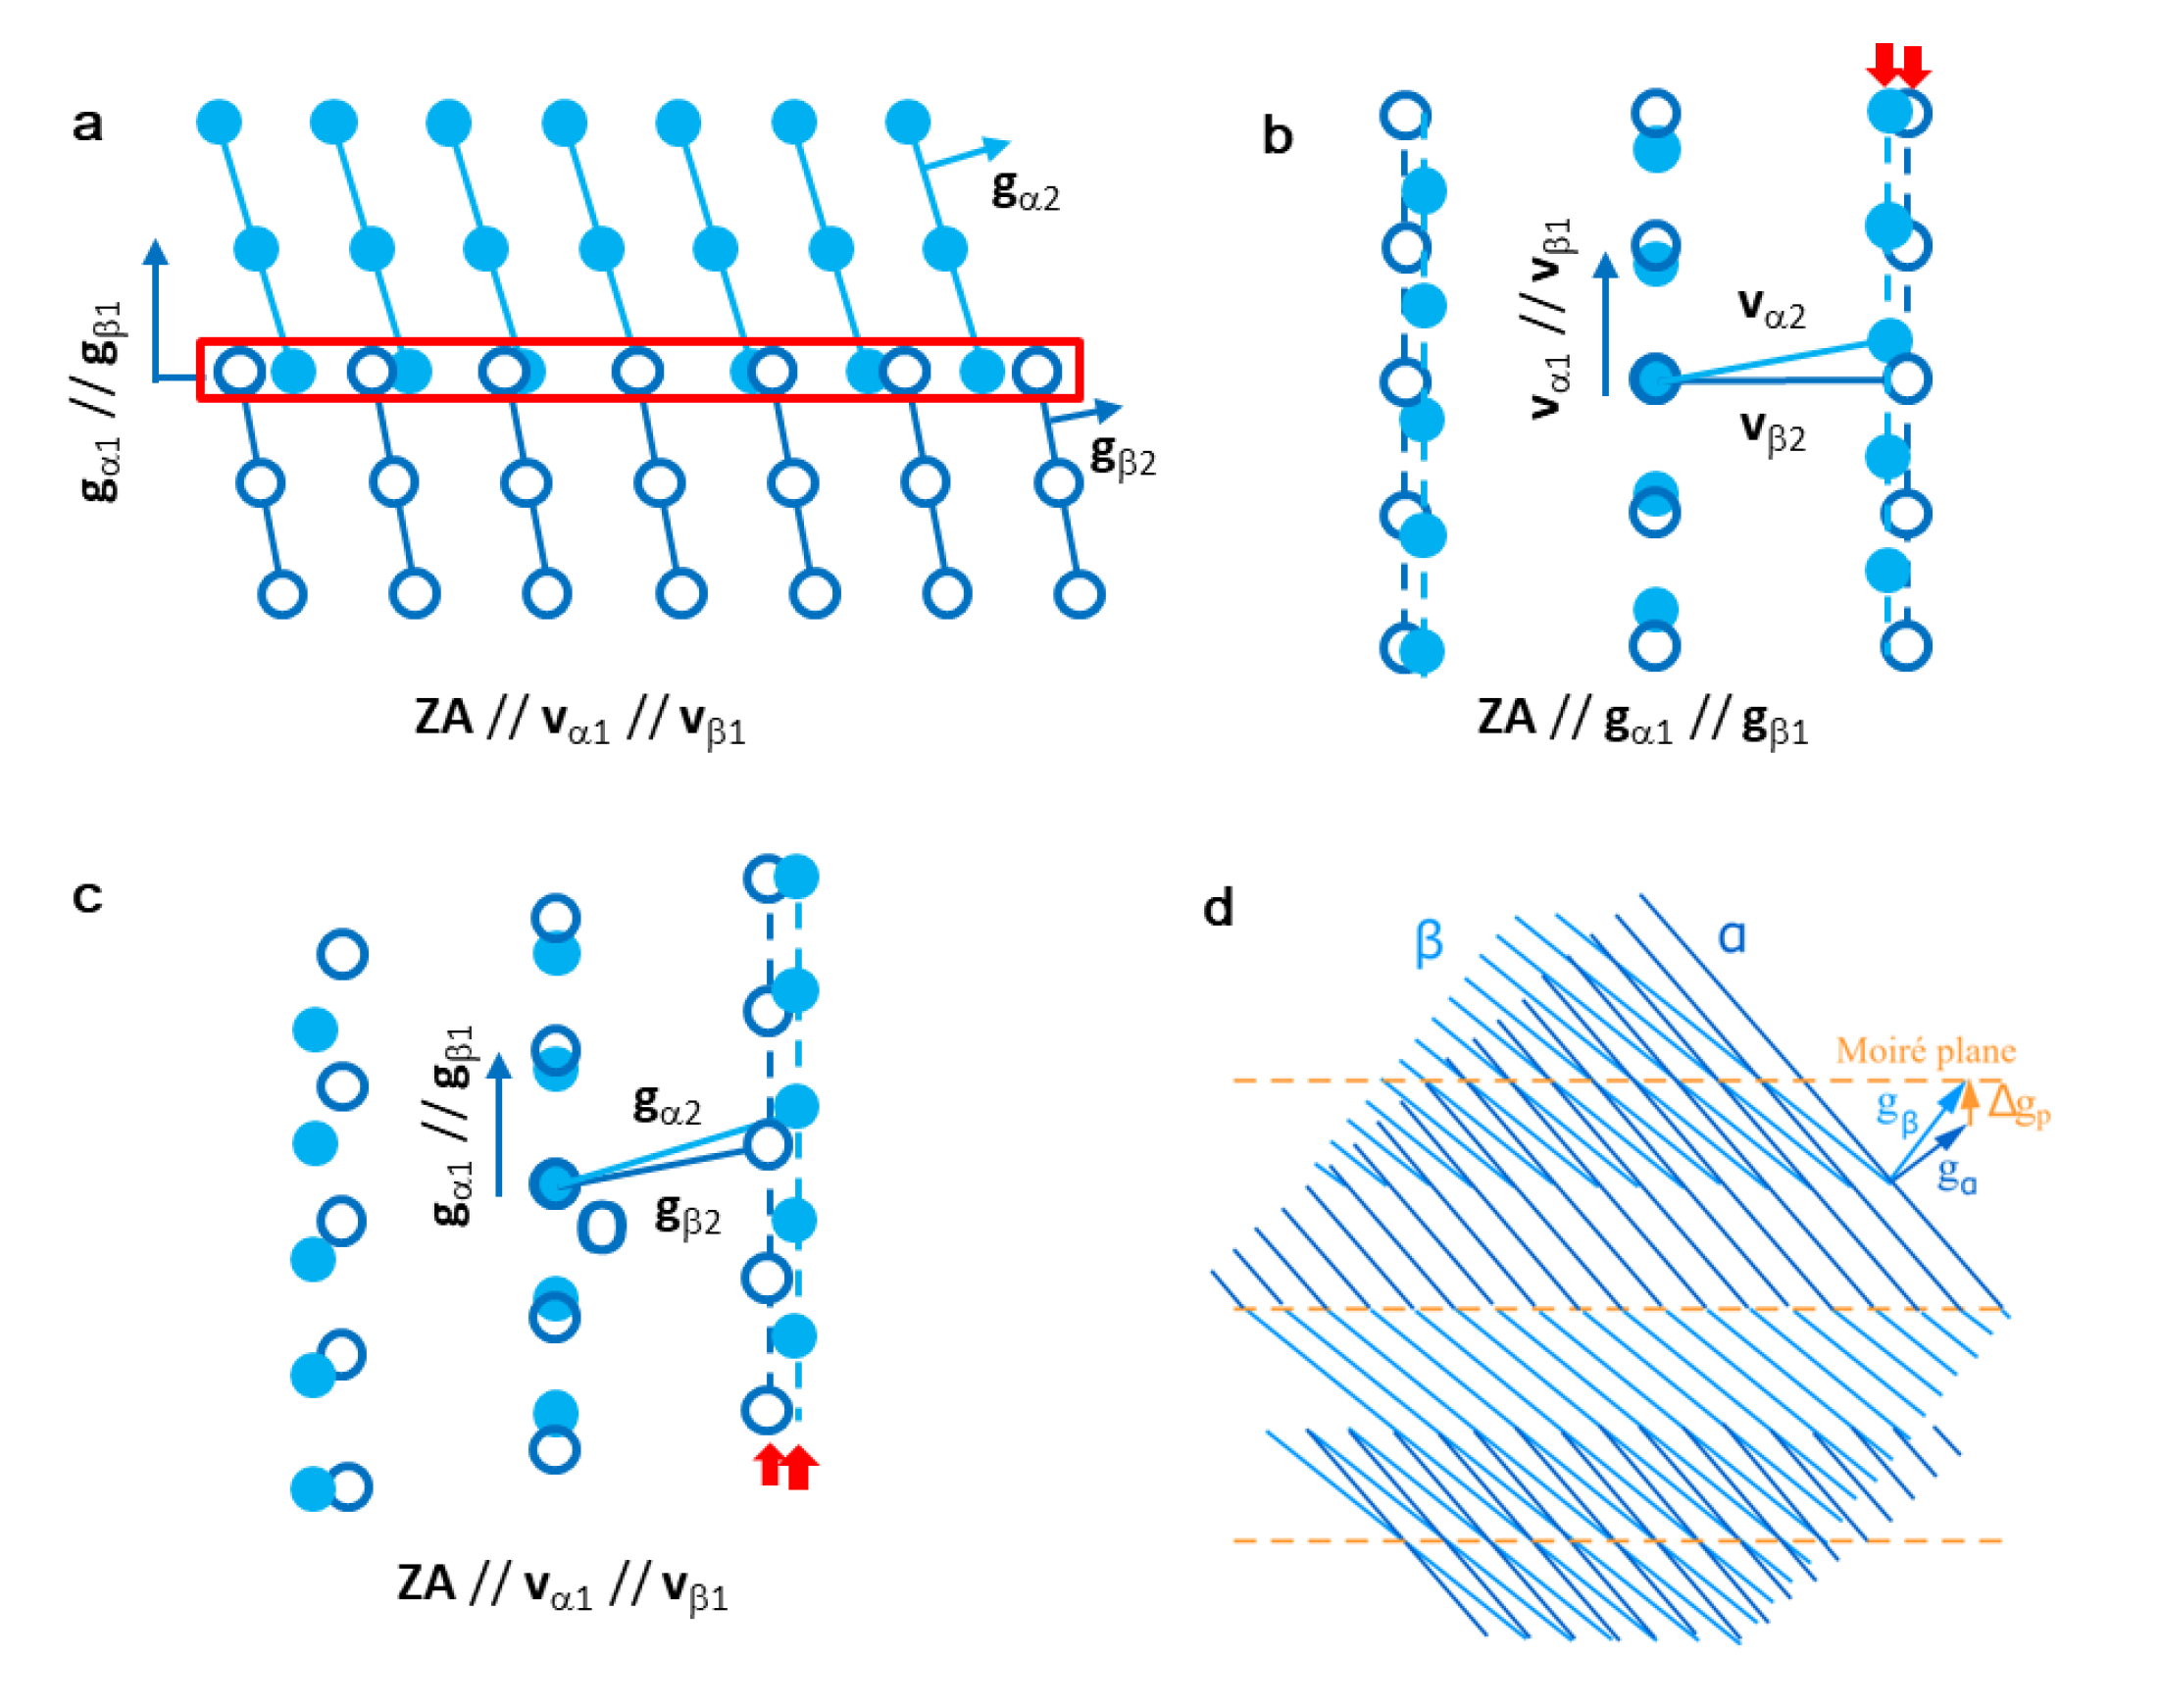
3.2. Extension to Reciprocal Space

As mentioned early, the transformation crystallography is often determined by transmission electron microscopy (TEM) diffraction patterns, and thus it is useful to extend the NRM method to reciprocal space. On the basis of Figure 2a,b, the corresponding diffraction pattern along the zone axis of vα1//vβ1 is shown in Figure 2c. gα1//gβ1 is normal to the interface in Figure 2a,b, while gα2 and gβ2 are another pair of g vectors that specified a pair of planes containing the atomic row vα1//vβ1. On the basis of Equation (2b), the lengths of gα1 and gβ1 are equal to | v α 2 × v α 1 | and | v β 2 × v β 1 | , respectively. As the misfit along the atomic row and the misfit between the parallel rows are small, | v α 2 × v α 1 | and | v β 2 × v β 1 | are closely related each other, that is, gα1 and gβ1 are closely related. Similar to Equation (2), the misfit between the diffraction pattern rows along gα1//gβ1 is
Δ r g = | g α 2 × g α 1 | | g α 1 |     | g β 2 × g β 1 | | g β 1 |
According to Equation (3c), the interface normal is parallel to gα1//gβ1, and thus the term | g α 2 × g α 1 | | g α 1 | in Equation (6) could be interpreted as the inverse of intersection spacing of planes gα2 on the interface g α 1 | g α 1 | . Similarly, the term | g β 2 × g β 1 | | g β 1 | in Equation (6) could be interpreted as the inverse of intersection spacing of planes gβ2 on the interface g 1 | g 1 | . It is noted that the intersection spacing on the interface is actually the row spacing, and their difference is the misfit between rows. Therefore, Equation (6) can be written as
Δ r g   =   1 r α     1 r β = r β     r α r α r β
where the atomic spacing is
r α = | g α 1 | | g α 2 × g α 1 | r β = | g β 1 | | g β 2 × g β 1 |
Equation (7) sets up the relationship between the row misfit in the diffraction pattern and the row misfit in direct space. Compared with the atomic row matching in Equation (2a), the row misfit in reciprocal space is also proportional to the term r β     r α . When r β = r α , Δ r r = Δ r g = 0 , row matching is simultaneously sustained in both direct and reciprocal space. In this case, the difference of related g vectors at the zone axis vα1//vβ1 is parallel to each other and parallel to the row of the reciprocal lattice vectors, gα1//gβ1.
In general, the misfit strain in the reciprocal space is
Δ ε g   =   1 r α     1 r β 1 r β = r β     r α r α
The misfit strain in both direct and reciprocal space is nearly the same. Therefore, similar to the NRM method in direct space, the near row atomic matching could also be extended in reciprocal space.
On the basis of the near row matching of reciprocal lattices, the OR and IO could also be predicted. Similar to the NRM method in direct space, there are also three steps for the NRM method in reciprocal space. (1) The first step is to find small misfit g vectors as the row direction with criterion δ and set them to be parallel to each other, that is, gα1//gβ1. (2) The second step is to find another pair of g vectors with small row misfit Δ r g with Equation (6). In the first two steps, the g vectors are typically smaller than 1 Å−1. In a small misfit system, (near) closely packed planes are considered, while (near) closely packed planes in a large lattice are commonly considered in a large misfit system. (3) The final step is to determine the OR and IO. The OR is defined by
vα1//vβ1
gα1//gβ1
where
v α 1 / / g α 2 × g α 1 v β 1 / / g β 2 × g β 1
The interface is defined by the direction of the matching rows in reciprocal space, that is,
gα1//gβ1
It is expected that the NRM method in both direct and reciprocal space would predict the same results. However, the NRM method in reciprocal space is particularly useful to rationalize the experimental data, as many crystallographic data are determined by diffraction patterns. Next, we will show some examples for row matching in both a small and large misfit system, which shows how NRM method in reciprocal space can be used to rationalize experimental observations, and then apply the NRM method to predict the transformation crystallography.

4. Application Examples

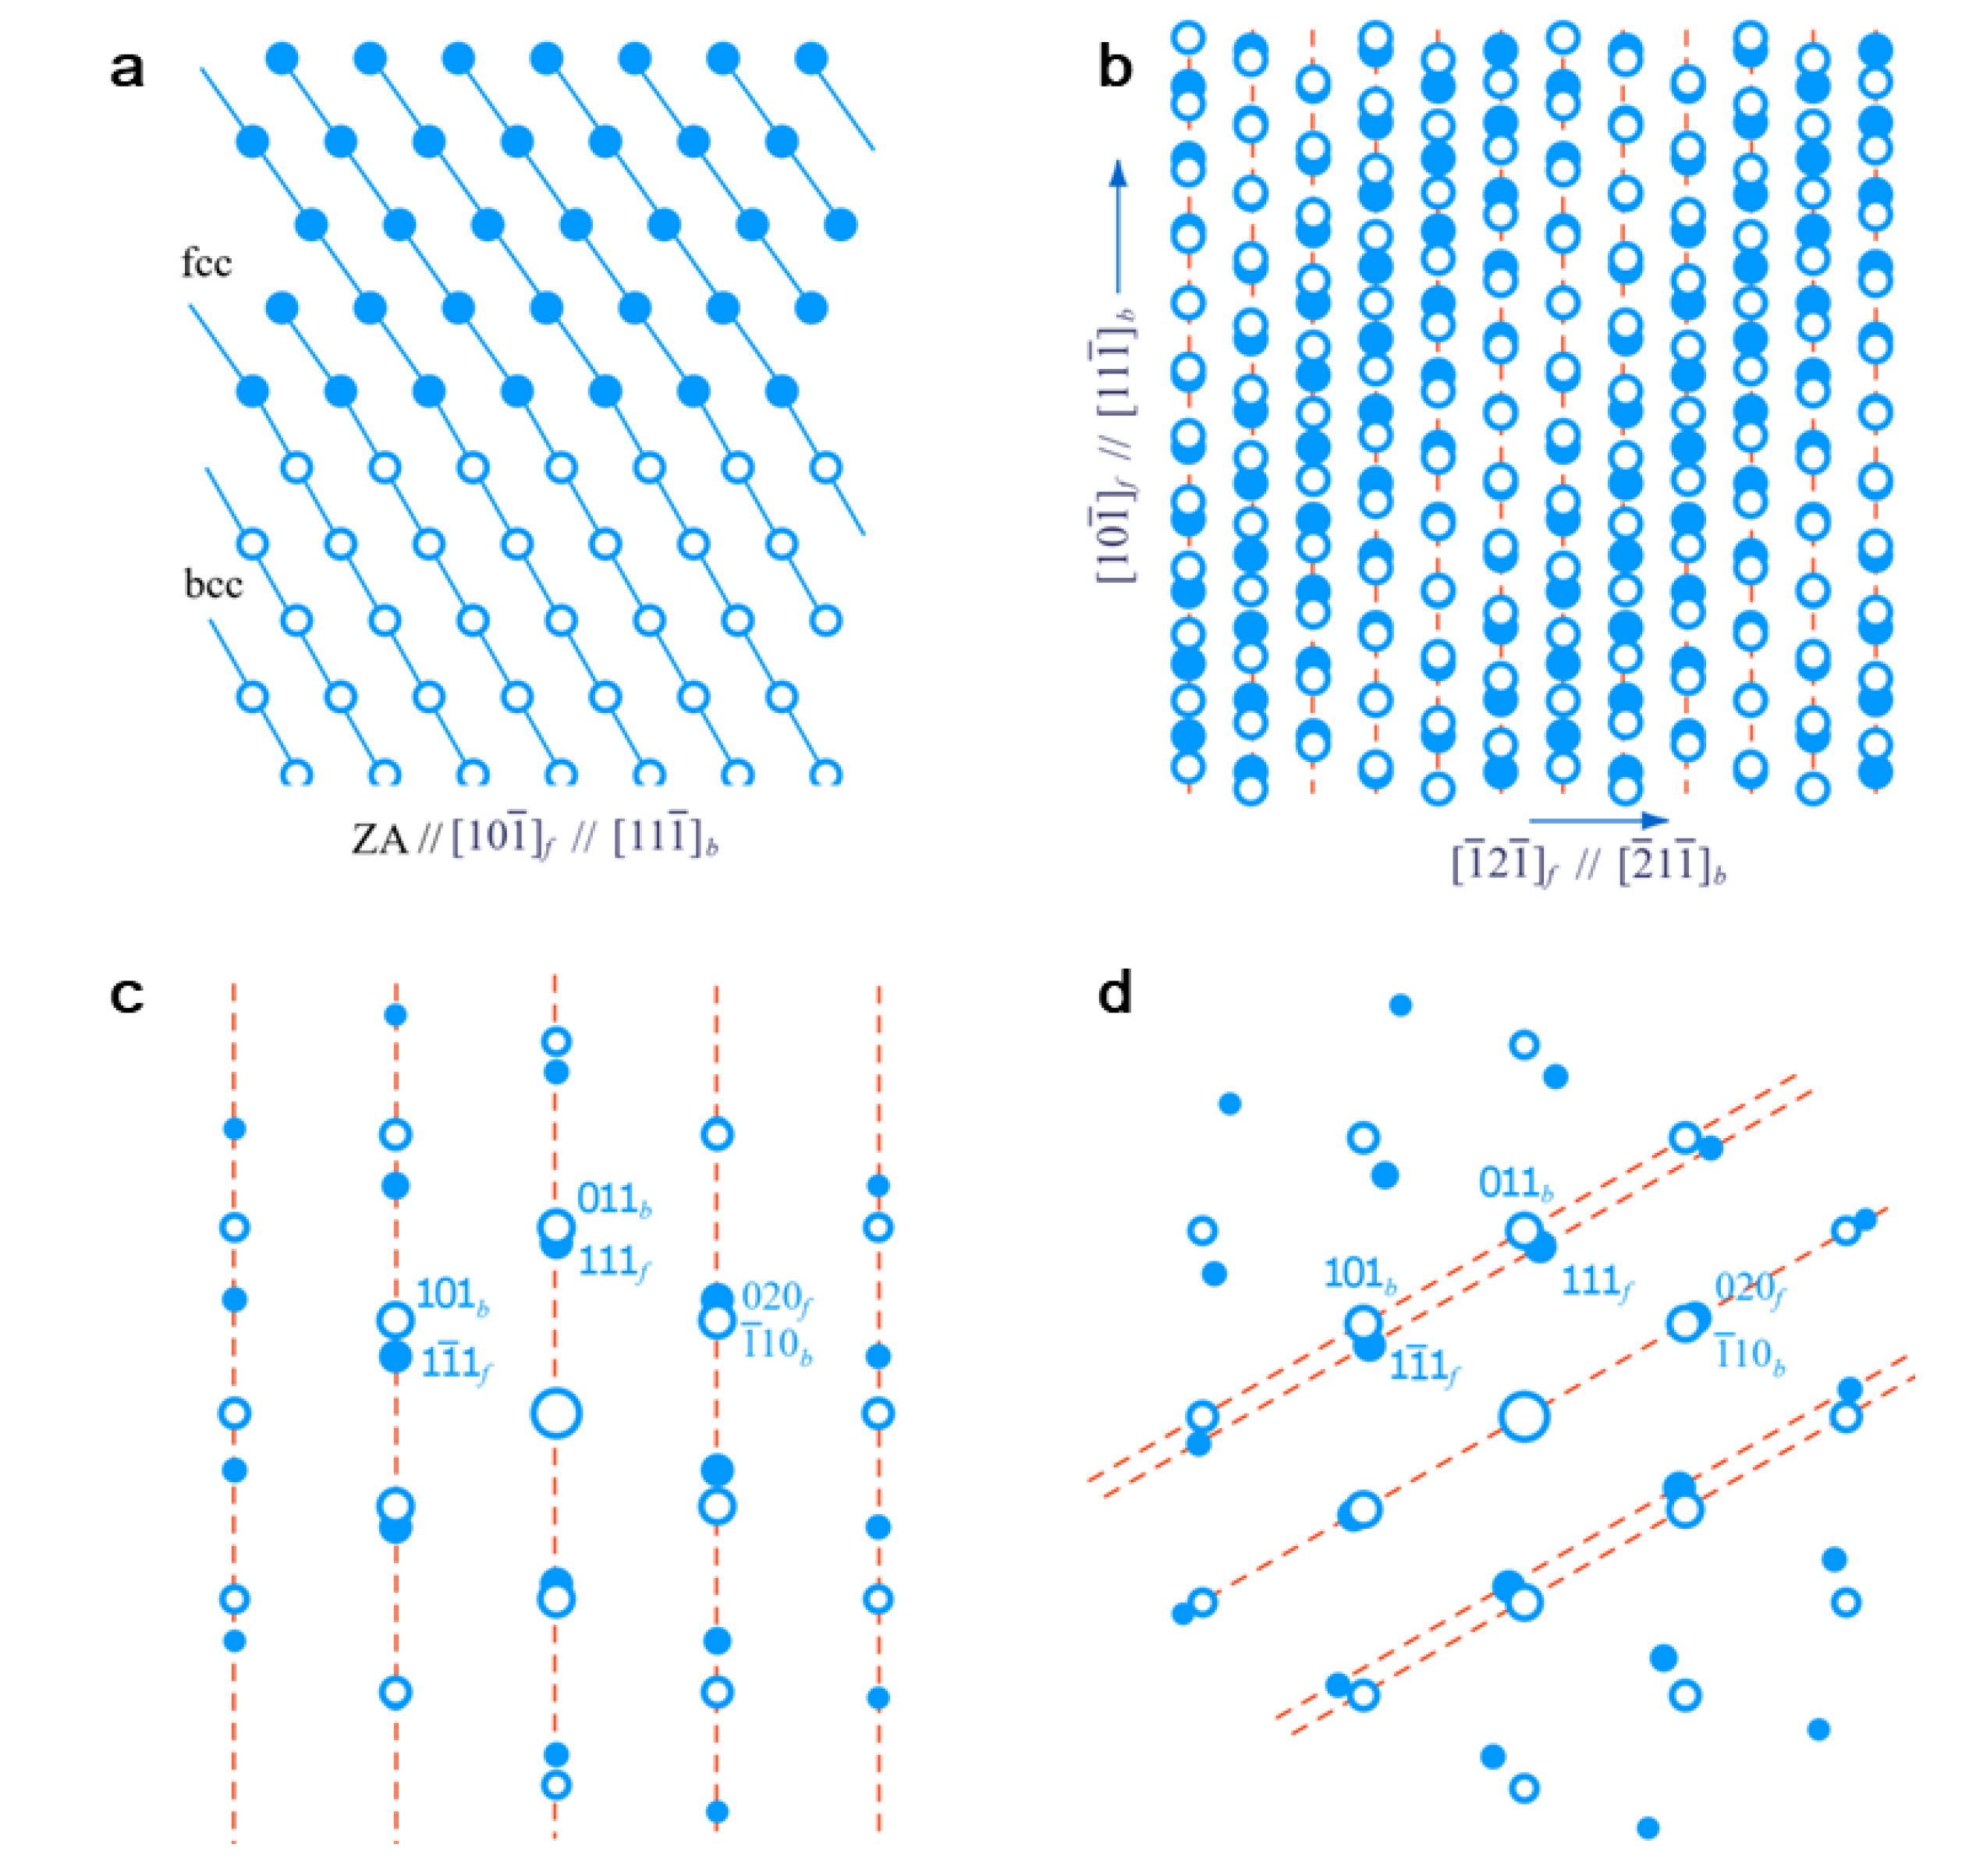
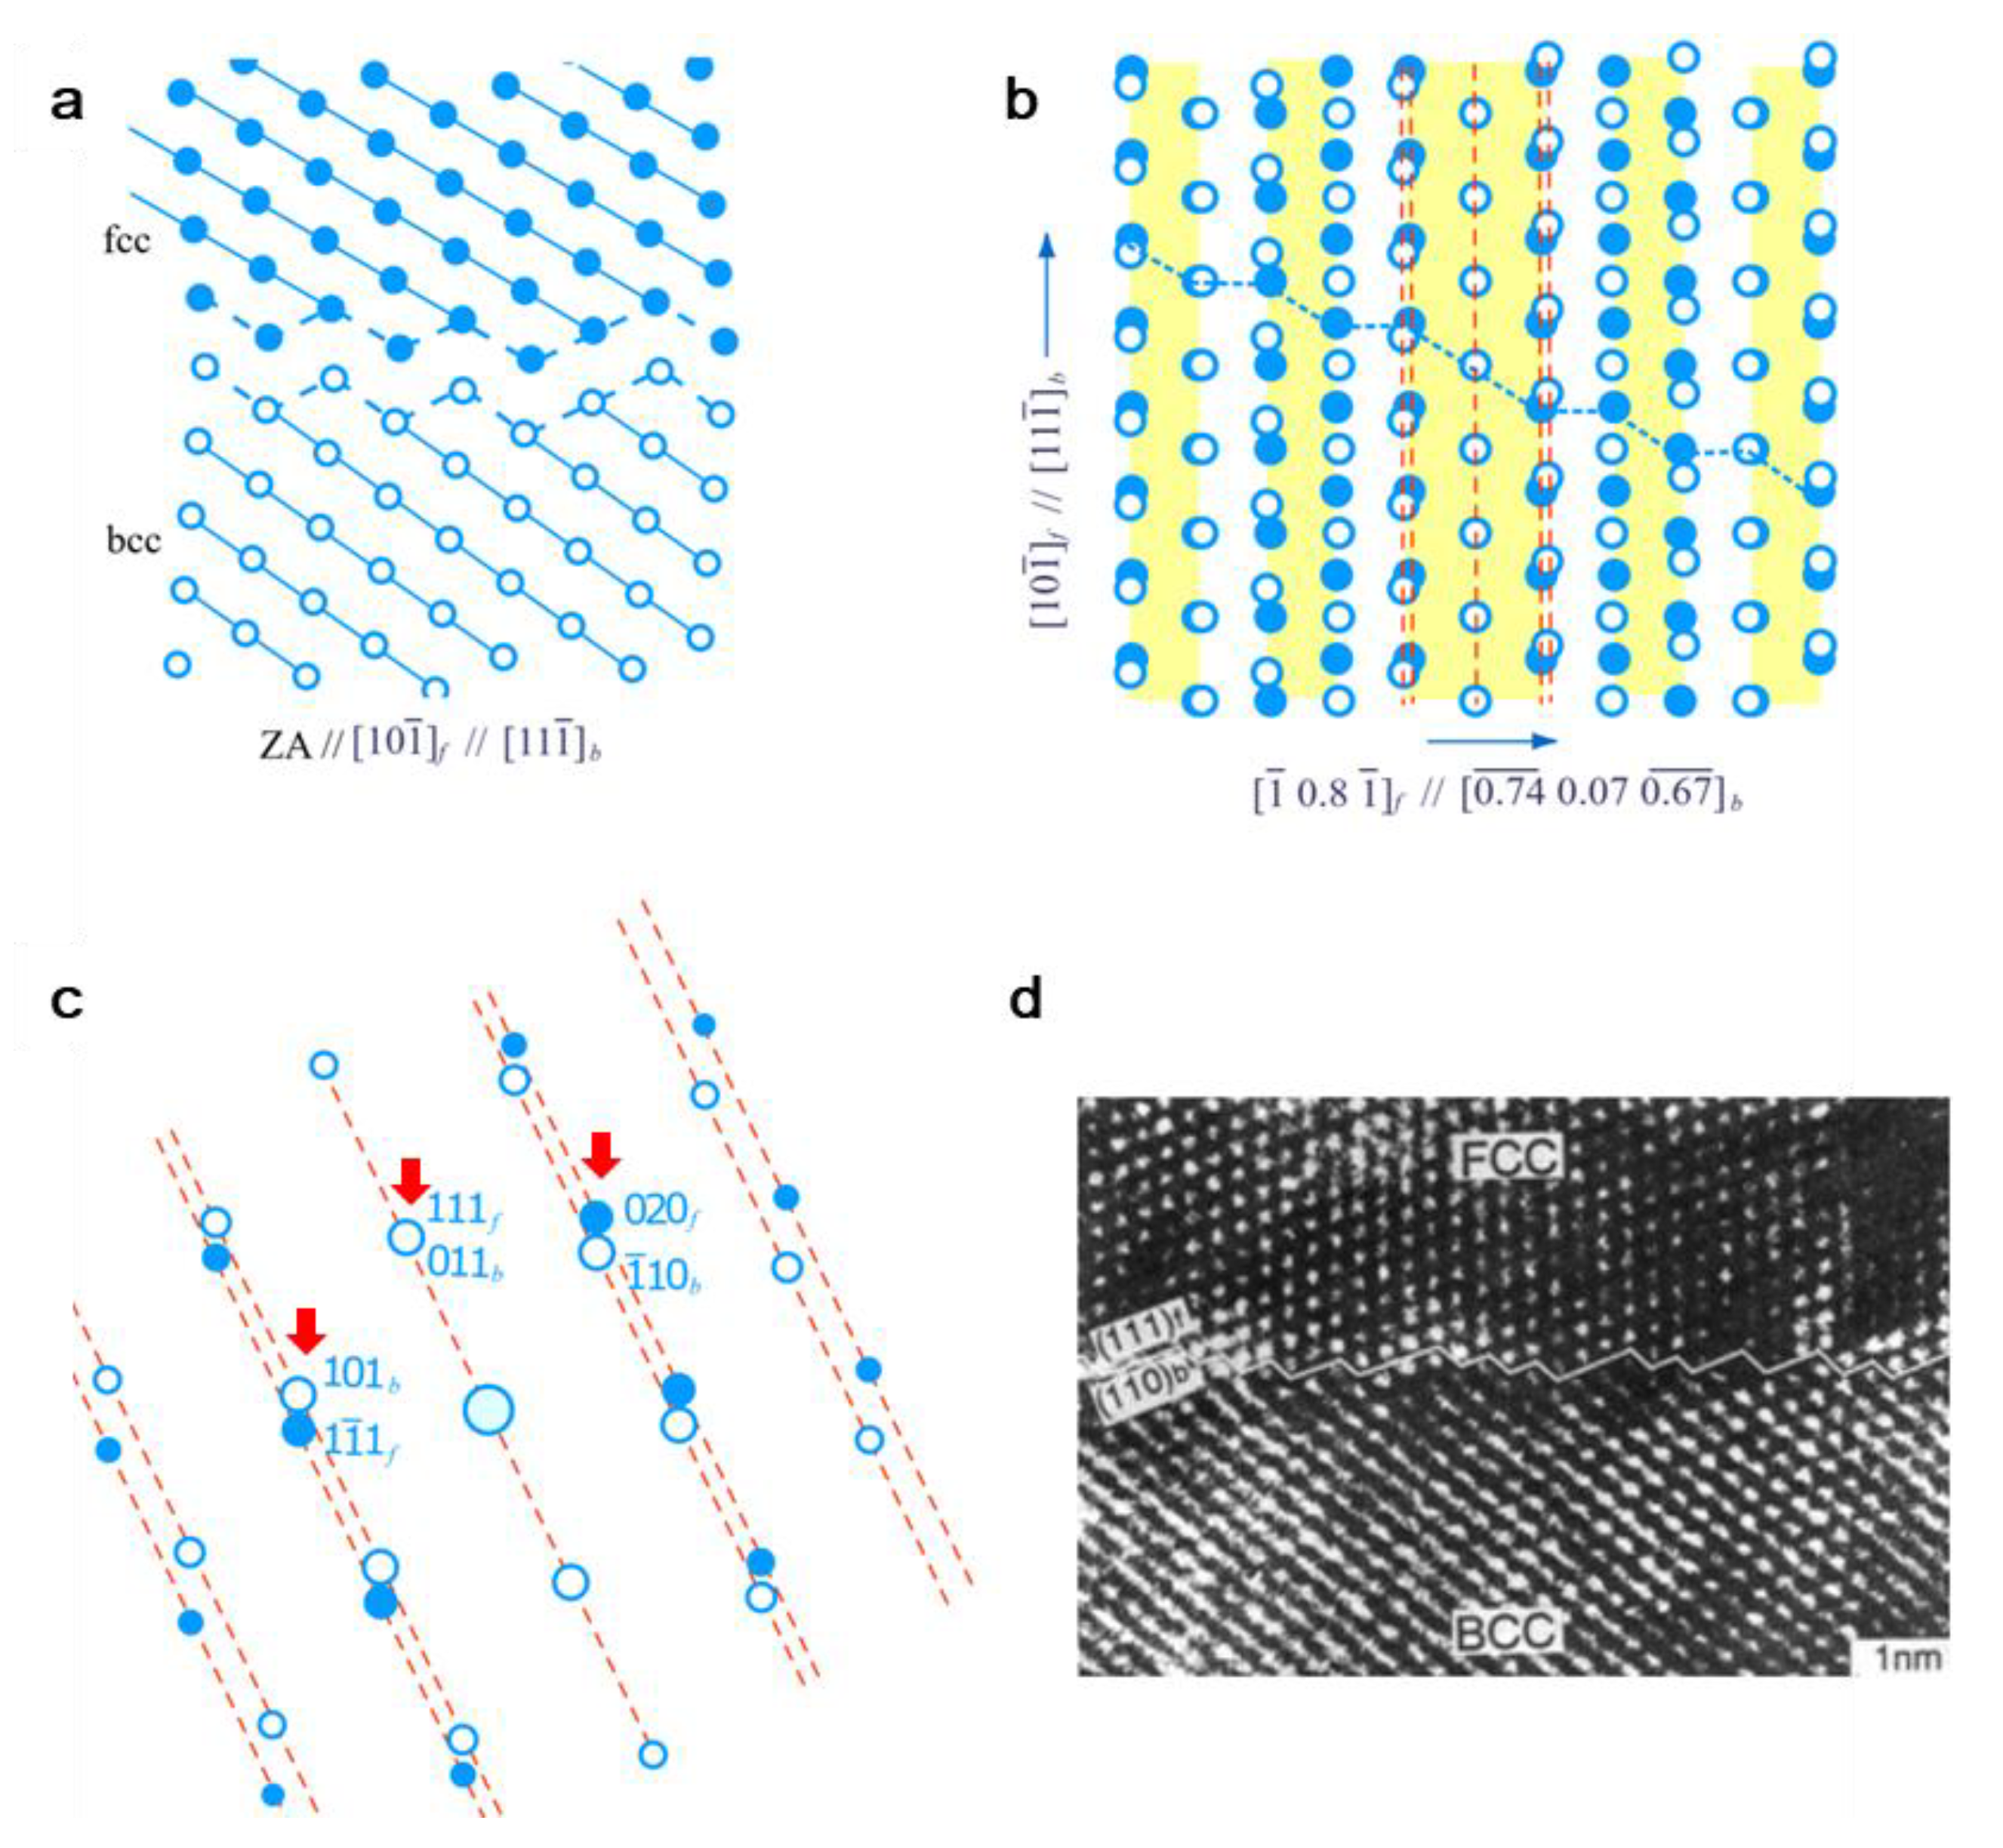
4.1. Face Centered Cubic/Body Centered Cubic (Fcc/Bcc) System with Special Lattice Parameters

Firstly, we will show some typical row matching in an fcc/bcc system with small misfit. More examples could be found in the Supplementary Materials. Figure 4 shows exact atomic row matching in an fcc/bcc system with the lattice parameter ratio λ = af/ab = 4/3, where af (ab) is the lattice parameter of fcc (bcc) lattice. Figure 4a is viewed along the [10−1]f//[11−1]b direction; the OR studied in this case is K–S OR, that is, (111)f//(011)b, and [10−1]f//[11−1]b; and the interface is also parallel to (111)f//(011)b. The plane contains these atomic rows [10−1]f//[11−1]b matched edge-to-edge at the interface, as shown in Figure 4a. Figure 4b shows the superimposed atoms in the interfacial layer, and the atomic rows from both lattices are superimposed with each other along [10−1]f//[11−1]b; thus, the misfit in the interface is along the parallel atomic rows. The GSM clusters are inclined to the row direction [10−1]f//[11−1]b. Figure 4c shows the simulated diffraction pattern of Figure 4a, and the reciprocal lattices are aligned at reciprocal rows parallel to the normal of (111)f//(011)b. As pointed out in Section 4, atomic row matching in direct space will imply row matching in reciprocal space. In addition, the difference of closely related g vectors,
Δg = gαgβ,
is parallel to each other and normal to the interface. There are multiple Δgs that are parallel to each other. As defined in Figure 2d, the planes defined by gα and gβ match edge-to-edge in the interface. It is noted that there is no superimposition of reciprocal lattices within the simulated range in Figure 4c. When the OR deviates from K–S OR around [10−1]f//[11−1]b to that in Figure 4d, there is only near row matching instead of exact row matching. Compared with near row matching, exact row matching is more preferred.
Figure 5 shows the near atomic row matching in an fcc/bcc system with the lattice parameter ratio λ = af/ab = 6 2 = 1.2247 . Figure 5a is viewed along the [10−1]f//[11−1]b direction; the OR studied here is also K–S OR, that is, (111)f//(011)b and [10−1]f//[11−1]b; and the interface is parallel to an irrational orientation (1 2.4 1)f. Owing to the irrational nature of the interface, this interface contains a stepped structure with a terrace plane parallel to (111)f//(011)b. The atomic planes contain the atomic rows [10−1]f//[11−1]b matched edge-to-edge at the interface, as shown in Figure 5a. Figure 5b shows the superimposed atoms in the stepped interfacial layer, and the atomic rows from both lattices are nearly superimposed with each other along [10−1]f//[11−1]b. The misfit in the interface is along the parallel atomic rows. The GSMs clusters are parallel to the row direction [10−1]f//[11−1]b. Figure 5c shows the simulated diffraction pattern of Figure 5a, and reciprocal lattices are near row matching parallel to the normal of (111)f//(011)b, as indicated by the dashed line. The diffraction spots (111)f and (011)b coincide with each other. The Δgs indicated by arrows in Figure 5c are normal to the stepped interface, and correlated planes match edge-to-edge in the interface. In the terrace planes of (111)f//(011)b, as indicated by green colors in Figure 5b, near atomic matching is periodically sustained owing to the misfit compensation by the stepped structure, which is first proposed in the structural ledge model [8,9,10]. Unlike the cases in Figure 4, this example shows the row matching could also be in a stepped interface, corresponding to a solution in a continuous model [36]. An example of a stepped interface observed in an Ni-Cr alloy is shown in Figure 5d [37], which is similar to the stepped structure in Figure 5a. In this practical case, NRM in the reciprocal space, as shown in Figure 5c, could be applied to rationalize the observations in (d). Compared with the NRM method in direct lattice, it is far more straight forward.
In summary, the row matching changes with the lattice parameters and the crystallography varies correspondingly. Exact row matching in direct space corresponds to exact row matching of reciprocal lattice, as discussed in Section 3 by Equations (2a) and (7a). The interface with row matching can be a planar interface or a stepped interface.

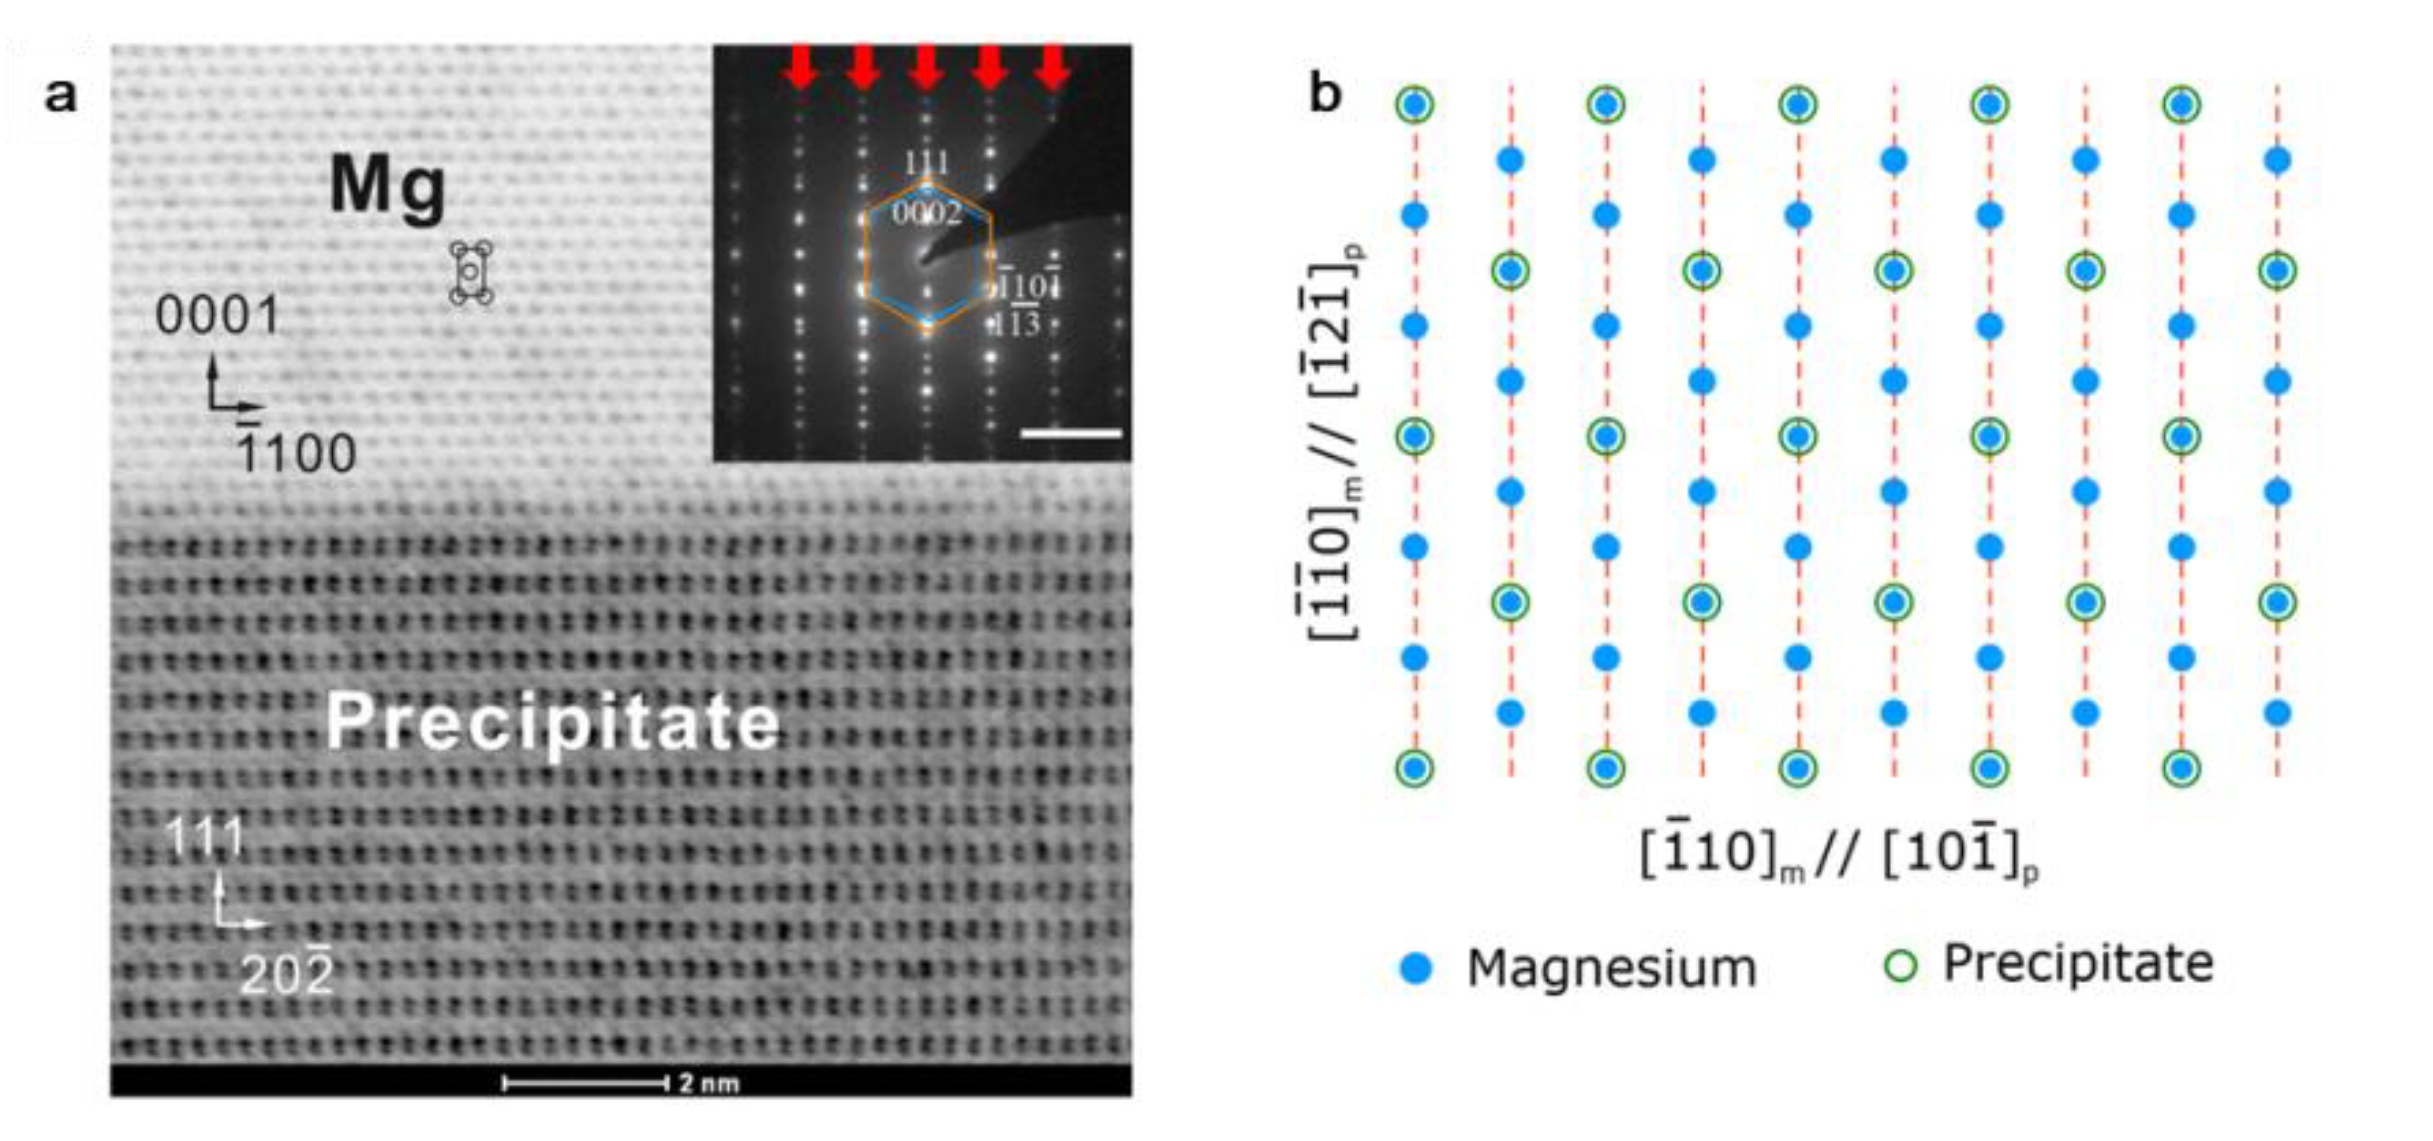
4.2. Mg/Al2Gd System

Figure 6 shows the case for Al2Gd precipitated from the Mg matrix [38]. Al2Gd is a Laves phase and has an fcc structure. In Figure 6a, the TEM image of the interface with atomic resolution is shown, and the inset shows the diffraction pattern. According to the diffraction pattern, the OR is determined as (0002)Mg//(111)Al2Gd and [−1−120]Mg//[−12−1]Al2Gd, and the interface is parallel to (0002)Mg//(111)Al2Gd. It is noted that the reciprocal points in the diffraction pattern are in row matching manner, parallel to the normal of (0002)Mg//(111)Al2Gd planes, as indicated by red arrows. The atomic matching in the interface is shown in Figure 6b. As there is no one-to-one lattice correspondence in this pattern, this is a large misfit system. The atomic row matching in Figure 6b is parallel to [−1−120]Mg//[−12−1]Al2Gd, and the lattices from two lattices nearly form a coincidence site lattice, thus the interface has low interfacial energy. Therefore, the transformation crystallography for Mg/Al2Gd system could be rationalized by the NRM method in both direct and reciprocal space. Again, the row matching condition is quite easy to be identified in the reciprocal space. Practical examples showing in Figure 5 and Figure 6 indicate NRM in reciprocal space is particularly convenient in applications to rationalize the example data. Other example of row matching in a large misfit system can also be found in an Mg-Sn alloy [29,30].

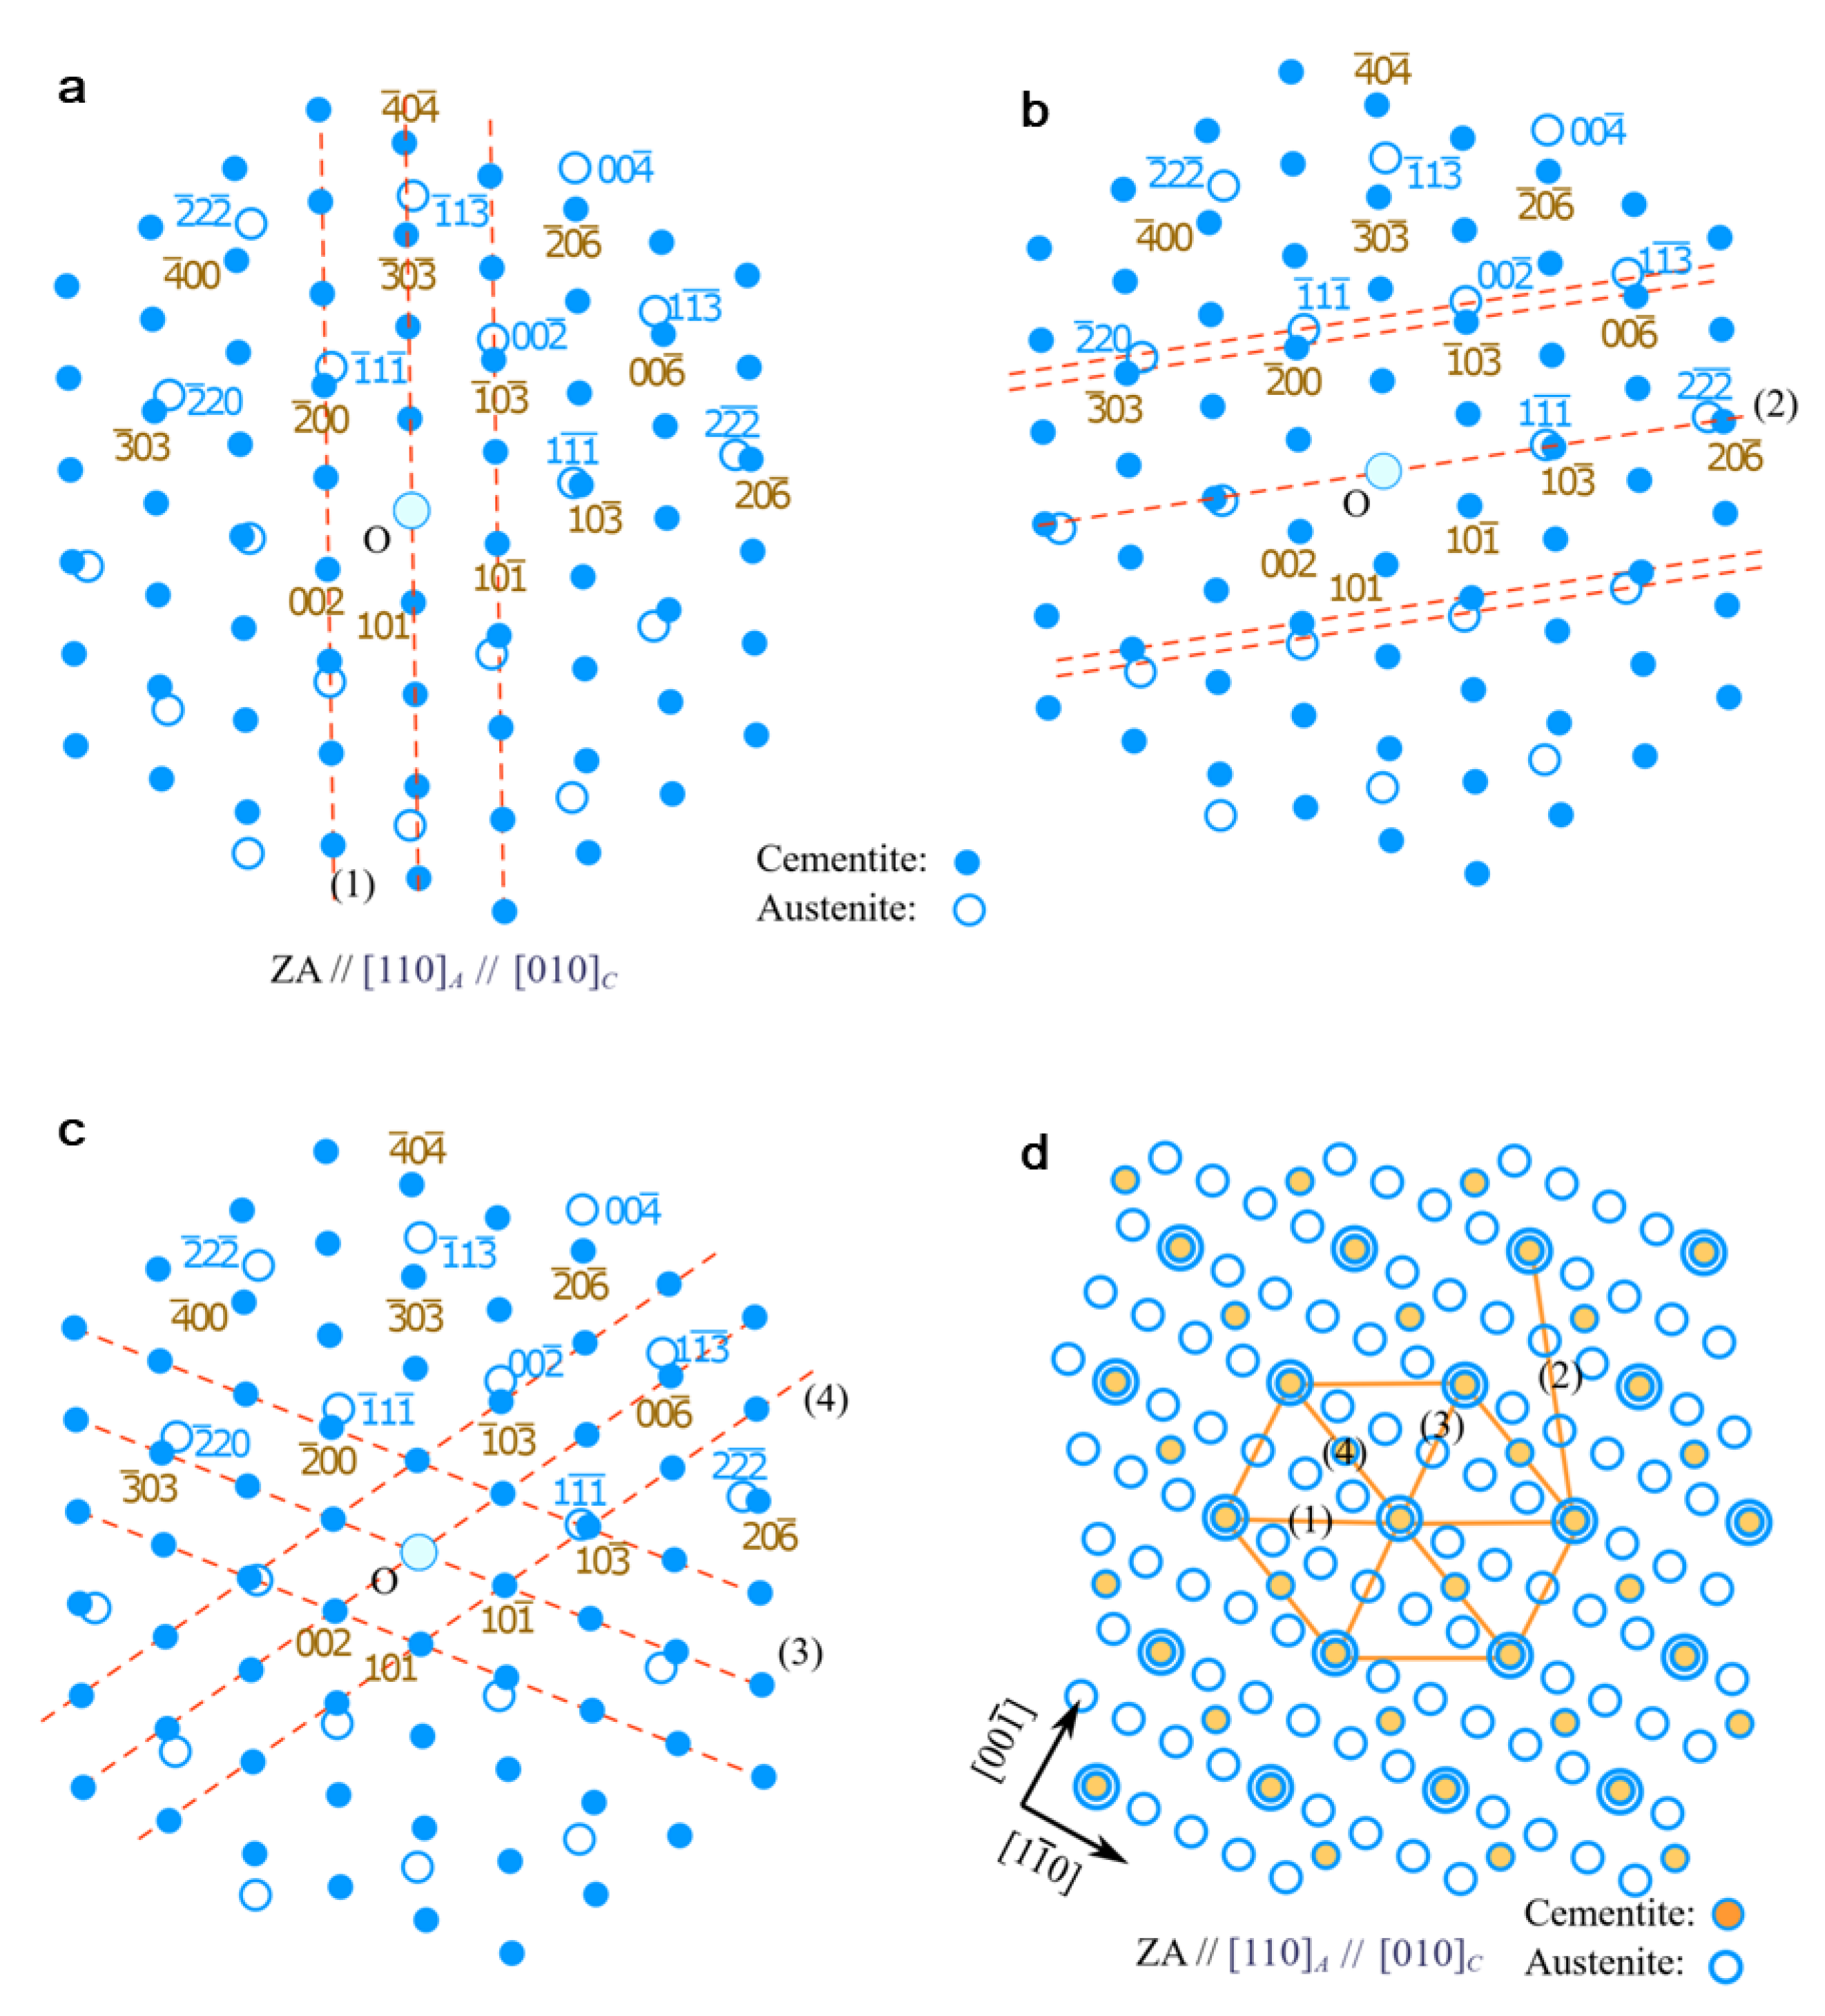
4.3. Prediction of Transformation Crystallography with the NRM Method

Near row matching in both direct and reciprocal space is implemented in our free software PTCLab for calculating transformation crystallography [25]. The user interface for the NRM method is shown in Figure 7. The inputs include the crystal structures, the misfit criterion along the row direction and between rows, the range of considered vectors, and so on. A larger criterion or range would result in an increasing number of predictions. The preference among different results may be judged by the misfit strains or energetic calculations.
Next, two examples will be shown in both a small and large misfit system. Firstly, an fcc/bcc system with a lattice parameter of af = 0.3639 nm and ab = 0.2898 nm is considered. The parallel atomic row vα1//vβ1 within the distance of 2af is shown in Table 1 with the misfit smaller than 15%|a|. The matching rows are mostly in the closely packed or near closely packed directions. After considering the row misfit, the predicted ORs and IOs are shown in Table 2, which covers the commonly observed ORs in an fcc/bcc system, such as the K–S OR and N–W OR. Among these ORs, the K–S OR has the smallest misfit. This simple example shows the possibility to predict the crystallographic features with present methods.
Another example is to predict the crystallography in an austenite/cementite system with a large misfit [39]. A previous experiment shows that the most preferred OR in this system is Pitsch OR,
[ 1   0   0 ] C / / [ 5   5 ¯   4 ] A [ 0   1   0 ] C / / [ 1   1   0 ] A [ 0   0   1 ] C / / [ 2 ¯   2   5 ] A
where the subscripts C and A are cementite and austenite, respectively. The interface is close to the ( 4   0   5 ) C / ( 1   1 ¯   4 ) A plane and the terrace plane of this stepped interface is ( 1   0   1 ) C / ( 1   1 ¯   3 ) A [40]. The smallest misfit along the row direction is [011]A/[010]C and is about 1.6%aA. The calculated results with the atomic row parallel to [011]A/[010]C are shown in Table 3. The predicted the OR in last row of Table 3 is close to the Pitsch OR, with
[ 0   1   0 ] C / / [ 1   1   0 ] A [ 1   0   0 ] C   ^   [ 5   5 ¯   4 ] A    1.4 °
The deviation angle from Pitsch OR is 1.4° around [ 0   1   0 ] C / / [ 1   1   0 ] A , and the predicted near row matching interface ( 1   0   1 ) C / ( 1   1 ¯   3 ) A is also in agreement with the observation. In addition, the minor T–H OR in this system can be also rationalized by matching of these rows. However, the predicted OR with the smallest misfit in Table 2 is
[ 0   1   0 ] C / / [ 1   1   0 ] A [ 0   0   1 ] C / / [ 1 ¯   1   1 ] A
The above OR has not been observed so far, and this may be because of the long-range matching in the interface [39], as NRM only considers local GMSs. Nevertheless, the observed OR has the second smallest misfit strain in Table 3.
The schematic diagram of the diffraction pattern at the zone axis of [ 0   1   0 ] C / / [ 1   1   0 ] A is shown in Figure 8a. Considering the predicted OR in Equation (12), the near row matching of reciprocal lattices is along ( 3   0   3 ) C / ( 1   1 ¯   3 ) A vectors. However, it is noted that there are several possible g rows that could be selected as near row matching as predicted by the NRM method from reciprocal space. The four g rows are numbered as 1–4, denoted as gi (i = 1–4), and are indicated by the dashed line in Figure 8a–c. The preference of gi rows can be compared by row misfit between g rows as in the NRM method or by the density of GMSs within the corresponding planes. Figure 8d shows constrained coincidence site lattice (CCSL) for austenite/cementite in the zone axis [ 0   1   0 ] C / / [ 1   1   0 ] A [39]. The densities of CSL in the planes defined by gi (i = 1, 3, 4) are similar and relatively high, compared with g2. The dense CSL plane can be also found by reciprocal vectors, that is, by the smallest translational Δg vector in the constrained displacement shift complete lattice (CDSCL) in reciprocal space [41]. The CDSCL vector of g1//(101)C is smaller than g2//(10−3)C, therefore, the former plane has denser CSL, consistent with the analysis in Figure 8d. Moreover, the strain to formation coherent row matching in gi (i = 1, 3, 4) is different. According to Table 3, the misfit strain for the row matching in the g3 and g4 plane is about 10% and 6.0%, respectively, but that in the g1 plane is 4.9%. In conclusion, the preferred OR in a large misfit system has a high density of CSL points and small constrained strain, and the dense CSL plane can be identified by the CDSL vectors in reciprocal space. We use this large misfit system to demonstrate that prediction of crystallography is challenging. Though we could predict the possible crystallographic features by the NRM method, other factors, such as coherent strain, density of matching sites, long-range matching state, and so on, are needed to be considered to differentiate various predictions.

5. Discussion

The preferred OR could be predicted by the NRM method in both direct and reciprocal space, though further refinement of the results should be done. In the NRM method, the GMS cluster is naturally defined by the selected vectors, and the GMS clusters will be repeated owing to the periodicity of the lattice structures. Therefore, the potential interface will pass through GMS clusters. The GMS cluster could have one-to-one lattice correspondence or x-to-y lattice correspondence like coincidence site lattice. GMS clusters will be coherent patches after relaxation. As mentioned early, the CRLP method and E2E method could also predict the ORs based on misfit analysis. On the basis of the PTCLab software, different methods can be compared. Figure 9 shows the possible combination of parallel directions and planes for the predicted ORs in the austenite/cementite system by E2E matching with PTCLab. The predicted ORs with parallel directions [ 0   1   0 ] C / / [ 1   1   0 ] A are [ 0   1   0 ] C / / [ 1   1   0 ] A and ( 1   0   3 ¯ ) C / / ( 1   1 ¯   1 ¯ ) A (In the E2E model, a similar OR [ 0   1   0 ] C / / [ 1   1   0 ] A and ( 1   0   3 ¯ ) C / / ( 1 ¯   1   1 ) A is also possible by changing ( 1   1 ¯   1 ¯ ) A to ( 1 ¯   1   1 ) A , which is close to T–H OR mentioned early. This OR will not be discussed here for brevity), [ 0   1   0 ] C / / [ 1   1   0 ] A and ( 0   0   6 ) C / / ( 1   1 ¯   3 ¯ ) A , or [ 0   1   0 ] C / / [ 1   1   0 ] A and ( 1   0   3 ) C / / ( 0   0   2 ) A . Similarly, the preferred OR in the CRLP method can predict the first two ORs as in the E2E method with PTCLab. As the last OR is predicted by E2E with a larger misfit, the superimposition of the diffraction pattern is low. The predicted ORs are all close to the observed OR. However, the IO in the E2E or CRLP methods cannot be simply obtained; on the contrary, the NRM method can predict the interface ( 1   0   1 ) C / ( 1   1 ¯   3 ) A . Considering the diffraction strength by the scattering factor, the intensity of (303)C is very weak and is about 3% of the maximum strength for (103)C, while the intensity of (006)C is 66% of the maximum value. It is noted that both E2E and CRLP only take strong diffraction spots into account, which are of physical importance. However, the interface with near row matching in the large misfit system has the densest CSL, and it may be not the plane with strong diffraction spots, but instead it is the plane normal to the smallest translational vector in the CDSCL in reciprocal space. Therefore, special attention should be paid to the large misfit system when determining the possible interface.
On the basis of the comparison, the differences between these methods are summarized here.
(1) The way to consider the misfit is different. In the CRLP method, superimposition of diffractions is preferred, and the misfit between diffraction spots, that is, g vectors, is small. In the E2E method, at least one pair of g vectors should have a small misfit in addition to a pair of low misfit crystal directions. However, the row misfit between rows of diffraction spots other than the misfit between g vectors is considered in the NRM method. The NRM method stresses the row matching condition (misfit between rows) and neglects the misfit along the row. However, when the misfit between g vectors is small, the row misfit would also be small and satisfy the criterion in the NRM method. In addition, GMS clusters are naturally included in the NRM method.
(2) The g vectors considered are different. In the extended CRLP method [28] and E2E method [42], the g vectors with strong diffraction intensity dominate, and these planes have physical importance. In the E2E method, the matching directions and matching planes are normally the closely packed or nearly closely packed directions and planes. However, the g vectors within certain distance, such as 1 Å−1, are all concerned in the NRM method. As a result, a large number of ORs would be predicted, and further refinement is needed for the NRM method by row misfit and so on.
(3) The NRM could predict the interface. In the ideal row matching condition, both the NRM and E2E methods could predict the IOs, and the planes containing the atomic row will match E2E in the interface. However, in general cases, especially in the large misfit system, the E2E matching planes are not easy to obtain, thus the E2E method is often used to rationalize the observation rather than for prediction in such a system [43]. However, the row matching plane is naturally the interface in the NRM method. The row matching plane contains denser local GMSs. Special attention should be paid to the large misfit system, where the interfacial normal is usually along the (near) closely packed planes in a large lattice, or strictly speaking, it is along the smallest translational vectors of CDSCL in reciprocal space other than g vectors with strong intensity. A smaller translational vector of CDSCL in reciprocal space implies a denser CSL in the interface [41].
(4) The NRM method in both direct and reciprocal space is nearly the same. Thus, the NRM condition in direct space could be identified in reciprocal space. The NRM method in reciprocal space could be directly compared with the experimental data and the data could be rationalized, which makes the application of the NRM method more convenient. However, it is not intuitive for E2E method, as it is proposed in direct space.

6. Conclusions

Misfit analysis in the interface is crucial to understanding the transformation crystallography. The atomic row matching in the interface is shown to be a sufficient condition for low interfacial energy. However, the exact row matching is only possible at a special lattice parameter, but the near row matching (NRM) method works.
(1) In this work, the rigid NRM method is extended from direct space to reciprocal space, which facilitates the analysis in reciprocal space using diffraction techniques. Near row matching in both direct and reciprocal space was quantitatively compared. These two methods are nearly the same, especially in view of the misfit strain.
(2) The NRM method in the reciprocal space was proposed to predict the transformation crystallography. Three steps are specified in the procedure, and various ORs and IOs could be predicted. In addition, it is implemented in our free software PTClab. Alternatively, the NRM method in reciprocal space could be directly applied to rationalize the commonly observed transformation crystallography in both small and large misfit systems, as diffraction patterns are commonly used to determine the crystallographic features.
(3) Several examples have shown that the NRM method in reciprocal space is quite convenient to rationalize the observations. Furthermore, the prediction of crystallographic features by the NRM method is illustrated in small and large misfit systems.
(4) Finally, the NRM method was compared with other predication methods, such as the E2E method and CRLP method, and the differences between them were clarified. Prediction of transformation crystallography is a not trivial and further improvement of the models is needed.

Supplementary Materials

The following are available online at https://www.mdpi.com/2073-4352/10/3/192/s1.

Funding

This research was funded by Beijing Natural Science Foundation, China, grant number 2192035; National Natural Science Foundation of China, grant number 51871131; and Fundamental Research Funds for the Central Universities, grant number FRF-IC-19-002.

Acknowledgments

Special thanks to Zhang W.-Z. for fruitful discussions.

Conflicts of Interest

The authors declare no conflict of interest.

References

  1. Christian, J.W. The Theory of Transformation in Metals and Alloys; Pergamon Press: Oxford, UK, 2002. [Google Scholar]
  2. Zhang, W.-Z.; Weatherly, G.C. On the Crystallography of Precipitation. Prog. Mater. Sci. 2005, 50, 181–292. [Google Scholar] [CrossRef]
  3. Zhang, M.-X.; Kelly, P.M. Crystallographic Features of Phase Transformations in Solids. Prog. Mater. Sci. 2009, 54, 1101–1170. [Google Scholar] [CrossRef]
  4. Zhang, W.-Z.; Gu, X.-F.; Dai, F.-Z. Faceted interfaces: A key feature to quantitative understanding of transformation morphology. Npj Comput. Mater. 2016, 2, 16021. [Google Scholar] [CrossRef] [Green Version]
  5. Gu, X.-F.; Shi, Z.-Z.; Chen, L.; Yang, P. Interface and the Preference of Transformation Crystallography. Mater. China 2019, 8, 731–741. [Google Scholar]
  6. Zhang, W.-Z.; Qiu, D.; Yang, X.-P.; Ye, F. Structures in Irrational Singular Interfaces. Metall. Mater. Trans. A 2006, 37, 911–927. [Google Scholar] [CrossRef]
  7. Qiu, D.; Shen, Y.X.; Zhang, W.-Z. An Extended Invariant Line Analysis for Fcc/Bcc Precipitation Systems. Acta Mater. 2006, 54, 339–347. [Google Scholar] [CrossRef]
  8. Qiu, D. Revisit the Role of Steps/Disconnections on Misfit Cancellation at Semi-Coherent Interface—Bridging the O-Line Model and the Topological Model. Crystals 2019, 9, 525. [Google Scholar] [CrossRef] [Green Version]
  9. Hall, M.G.; Aaronson, H.I.; Kinsma, K.R. The Structure of Nearly Coherent fcc:bcc Boundaries in a Cu-Cr Alloy. Surf. Sci. 1972, 31, 257–274. [Google Scholar]
  10. Rigsbee, J.M.; Aaronson, H.I. A Computer Modeling Study of Partially Coherent FCC: BCC Boundaries. Acta Metall. 1979, 27, 351–363. [Google Scholar] [CrossRef]
  11. Dahmen, U. Orientation Relationships in Precipitation Systems. Acta Metall. 1982, 30, 63–73. [Google Scholar] [CrossRef] [Green Version]
  12. Luo, C.P.; Weatherly, G.C. The Invariant Line and Precipitation in a Ni-45 Wt. % Cr Alloy. Acta Metall. 1987, 35, 1963–1972. [Google Scholar] [CrossRef]
  13. Kato, M. Simple Criteria for Epitaxial Relationships between F.C.C. and B.C.C. Crystals. Mater. Sci. Eng. A 1991, 146, 205–216. [Google Scholar] [CrossRef]
  14. Kato, M.; Mishima, T. The Crystallography of α-Iron Deposited onto the (112) Plane of a Cu-Ni Alloy. Philos. Mag. A 1987, 56, 725–733. [Google Scholar] [CrossRef]
  15. Zhang, W.-Z.; Purdy, G.R. O-Lattice Analyses of Interfacial Misfit. II. Systems Containing Invariant Lines. Philos. Mag. A 1993, 68, 291–303. [Google Scholar] [CrossRef]
  16. Qiu, D.; Zhang, W.-Z. A Systematic Study of Irrational Precipitation Crystallography in fcc-bcc Systems with an Analytical O-line Method. Philos. Mag. 2003, 83, 3093–3116. [Google Scholar] [CrossRef]
  17. Bollmann, W. Crystal Defects and Crystalline Interfaces; Springer: Berlin/Heidelberg, Germany, 1970. [Google Scholar]
  18. Bollmann, W. Crystal Lattices, Interfaces, Matrices; Bollmann: Geneva, The Netherlands, 1982. [Google Scholar]
  19. Liang, Q.; Reynolds, J.W.T. Determining Interphase Boundary Orientations from Near-Coincidence Sites. Metall. Mater. Trans. A 1998, 29, 2059–2072. [Google Scholar] [CrossRef]
  20. Miyano, N.; Ameyama, K. Three Dimensional Near-Coincidence Site Lattice Analysis of Orientation Relationship and Interface Structure in Two Phase Alloys. J. Jpn. Inst. Metals 2000, 64, 42–49. [Google Scholar] [CrossRef] [Green Version]
  21. Yang, X.-P.; Zhang, W.-Z. A systematic analysis of good matching sites between two lattices. Sci. China Technol. Sci. 2012, 55, 1343–1352. [Google Scholar] [CrossRef]
  22. Kelly, P.M.; Zhang, M.X. Edge-to-Edge Matching—A New Approach to the Morphology and Crystallography of Precipitates. Mater. Forum 1999, 23, 41–62. [Google Scholar]
  23. Zhang, M.X.; Kelly, P.M. Edge-to-Edge Matching Model for Predicting Orientation Relationships and Habit Planes—The Improvements. Scr. Mater. 2005, 52, 963–968. [Google Scholar] [CrossRef]
  24. Howe, J.M.; Pond, R.C.; Hirth, J.P. The Role of Disconnections in Phase Transformations. Prog. Mater. Sci. 2009, 54, 792–838. [Google Scholar] [CrossRef]
  25. Gu, X.-F.; Furuhara, T.; Zhang, W.-Z. PTCLab: Free and Open-Source Software for Calculating Phase Transformation Crystallography. J. Appl. Crystallogr. 2016, 49, 1099–1106. [Google Scholar] [CrossRef]
  26. Qiu, D.; Zhang, W.-Z. Research Progress in Precipitation Crystallography Models. Acta Metall. Sin. 2006, 42, 341–349. [Google Scholar]
  27. Ikuhara, Y.; Pirouz, P. Orientation Relationship in Large Mismatched Bicrystals and Coincidence of Reciprocal Lattice Points (CRLP). Mater. Sci. Forum 1996, 207, 121–124. [Google Scholar] [CrossRef]
  28. Gautam, A.R.S.; Howe, J.M. A Method to Predict the Orientation Relationship, Interface Planes and Morphology between a Crystalline Precipitate and Matrix: Part I—Approach. Philos. Mag. 2011, 911, 3203–3227. [Google Scholar] [CrossRef]
  29. Zhang, W.-Z.; Sun, Z.-P.; Zhang, J.-Y.; Shi, Z.-Z.; Shi, H. A Near Row Matching Approach to Prediction of Multiple Precipitation Crystallography of Compound Precipitates and Its Application to a Mg/Mg2Sn System. J. Mater. Sci. 2017, 52, 4253–4264. [Google Scholar] [CrossRef]
  30. Shi, Z.-Z.; Zhang, W.-Z. Characterization and Interpretation of Twin Related Row-Matching Orientation Relationships between Mg2Sn Precipitates and the Mg Matrix. J. Appl. Crystallogr. 2015, 48, 1745–1752. [Google Scholar] [CrossRef]
  31. Bauer, E.; van der Merwe, J.H. Structure and Growth of Crystalline Superlattices: From Monolayer to Superlattice. Phys. Rev. B 1986, 33, 3657–3671. [Google Scholar] [CrossRef]
  32. Van Der Merwe, J.H.; Shiflet, G.J. The Role of Structural Ledges at Phase Boundaries. I. Interfaces with Rectangular Atomic Nets. Acta Metall. Mater. 1994, 42, 1173–1187. [Google Scholar] [CrossRef]
  33. Braun, M.W.H.; van der Merwe, J.H. Reciprocal-Space Formulation and Prediction of Misfit Accommodation in Rigid and Strained Epitaxial Systems. Metall. Mater. Trans. A 2002, 33, 2485–2494. [Google Scholar] [CrossRef]
  34. Frank, F.C. Martensite. Acta Metall. 1953, 1, 15–21. [Google Scholar] [CrossRef]
  35. Wu, J.; Zhang, W.-Z.; Gu, X.-F. A Two-Dimensional Analytical Approach for Phase Transformations Involving an Invariant Line Strain. Acta Mater. 2009, 57, 635–645. [Google Scholar] [CrossRef]
  36. Baur, A.P.; Cayron, C.; Logé, R.E. {225} γ Habit Planes in Martensitic Steels: From the PTMC to a Continuous Model. Sci. Rep. 2017, 7, 40938. [Google Scholar] [CrossRef]
  37. Furuhara, T.; Wada, K.; Maki, T. Atomic-Structure of Interphase Boundary Enclosing Bcc Precipitate Formed in Fcc Matrix in a Ni-Cr Alloy. Metall. Mater. Trans. A 1995, 26, 1971–1978. [Google Scholar] [CrossRef]
  38. Gu, X.-F.; Furuhara, T. Characterization of Crystal Structure and Precipitation Crystallography of A New Mgxal2−xGd Phase in an Mg97Al1Gd2 Alloy. J. Appl. Crystallogr. 2016, 49, 1177–1181. [Google Scholar] [CrossRef] [Green Version]
  39. Ye, F.; Zhang, W.-Z. Coincidence Structures of Interfacial Steps and Secondary Misfit Dislocations in the Habit Plane between Widmanstatten Cementite and Austenite. Acta Mater. 2002, 50, 2761–2777. [Google Scholar] [CrossRef]
  40. Howe, J.M.; Spanos, G. Atomic Structure of the Austenite-Cementite Interface of Proeutectoid Cementite Plates. Philos. Mag. A 1999, 79, 9–30. [Google Scholar] [CrossRef]
  41. Zhang, W.-Z. Application of the DSCL in Reciprocal Space for the Study of Coincidence Boundaries. Scr. Mater. 1997, 37, 187–192. [Google Scholar] [CrossRef]
  42. Kelly, P.M.; Ren, H.-P.; Qiu, D.; Zhang, M.-X. Identifying Close-Packed Planes in Complex Crystal Structures. Acta Mater. 2010, 58, 3091–3095. [Google Scholar] [CrossRef]
  43. Zhang, M.X.; Kelly, P.M. Edge-to-edge Matching and its Applications: Part II. Application to Mg–Al, Mg–Y and Mg–Mn alloys. Acta Mater. 2005, 53, 1085–1096. [Google Scholar] [CrossRef]
Figure 1. Schematic diagram to show the physical basis for atomic matching in the interface. (a) The total energy varies with the spacing between the same atoms, (b) nearly coinciding atoms in the coherent interface between two 2D lattices.
Crystals 10 00192 g001
Figure 2. Comparison between near atomic row matching in direct space and reciprocal space. (a) Near row matching in the interface viewed along parallel row vα1//vβ1. (b) The atomic matching in the interface containing atomic rows, as indicated in the rectangle in (a). (c) Simulated diffraction pattern for (a). (d) The plane edge-to-edge matching at the interface.
Crystals 10 00192 g002
Figure 3. The misfit along a row direction, (a) with one-to-one correspondence, (b) with one-to-x correspondence. The filled circles are atoms in one phase and the open circles are those in the other phase. The arrows point to the correspondence.
Crystals 10 00192 g003
Figure 4. The atomic row matching in the (111)f//(011)b interface at the K–S orientation relationship (OR) for an face centered cubic/body centered cubic (fcc/bcc) system with λ = 4/3. (a) Atomic matching viewed from the [10−1]f//[11−1]b direction with interface edge-on. (b) Atomic row matching at the (111)f//(011)b interface layer. (c) Simulated diffraction pattern of (a). (d) Alignment of (020)f and (−110)b by rotating 5.26° from (c) to Pitsch OR.
Crystals 10 00192 g004
Figure 5. The atomic row matching in the irrational (1 2.4 1)f interface at K–S OR for an fcc/bcc system with λ = 6 / 2 . (a) Atomic matching viewed from the [10−1]f//[11−1]b direction with interface edge-on. (b) Atomic row matching at stepped interface layer. (c) Simulated diffraction pattern of (a). (d) Observation of the stepped structure in an Ni-Cr alloy.
Crystals 10 00192 g005
Figure 6. Transmission electron microscopy (TEM) observation of Al2Gd type precipitate in an Mg-Al-Gd alloy. (a) Bright field image of Mg/Al2Gd interface from the [−1−120]Mg//[−12−1]Al2Gd zone axis. (b) The atomic row matching in the Mg/Al2Gd interface. The inserted figure in (a) is the diffraction pattern taken across the interface.
Crystals 10 00192 g006
Figure 7. The interface for the near row matching method in PTCLab.
Crystals 10 00192 g007
Figure 8. Matching g rows at Pitsch OR between cementite and austenite. (ac) Simulated diffraction pattern at the zone axis of [110]A//[010]C, and dashed lines indicate different g rows. (d) Constrained coincidence site lattice (CSL) in the direct space at the same zone axis. The direction on this plane plus the zone axis directly compose possible interfaces.
Crystals 10 00192 g008
Figure 9. The combination atomic row direction and planes in the E2E model for the austenite and cementite system. γ indicates indices in austenite, and α for cementite. The left column shows the good matching rows, while the right column shows good matching planes containing the rows.
Crystals 10 00192 g009
Table 1. Matched atomic rows or reciprocal rows between the face centered cubic (fcc) lattice and body centered cubic (bcc) lattice, where the distance for the atomic row is smaller than 2af (or 0.8 Å−1 for reciprocal vectors), the reciprocal rows are (near) closely packed planes, and the misfit criterion is 15%.
FccBccMisfit, %FccBccMisfit, %
<011>/2<111>/22.2{111}{011}1.8
<011>/2<001>−11.2{002}{011}−7.9
<112>/2<011>12.4{002}{002}12.8
<112>/2<113>/2−12.0
Table 2. Predicted orientation relationships (ORs) and interfacial orientations (IOs) with the near atomic row matching method in the fcc/bcc system.
vα1vβ1Misfit, %vα2vβ2Row Misfitgα1gβ2OR
[011]/2[111]/22.2[101]/2[001]4.8(11−1)(1−10)K–S
[011]/2[001]−11.2[101]/2[111]/26.2(11−1)(−110)N–W
[011]/2[001]−11.2[0−11]/2[100]11.2(100)(010)Bain
Table 3. Predicted OR with the near atomic row matching method for the austenite and cementite system with the row parallel to [011]A/[010]C.
vA1vC1Misfit, aA%vA2vC2Row Misfit, aA%Misfit Strain, %gA1gC2OR
[011][010]1.6[−2−11]/2[100]1.91.5(11−1)(00−3)
[−1−11][001]12.06.9(2−11)(300)
[200][001]14.87.4(01−1)(200)
[−4−11]/2[101]11.05.2(1−22)(30−3)
[0−33]/2[101]11.05.2(100)(10−1)
[200][101]23.110.3(01−1)(10−1)3
[−1−33]/2[200]14.26.0(3−1)(00−6)4
[−1−33]/2[101]11.44.9(3−11)(30−3)1

