Article

How Nanoscale Dislocation Reactions Govern Low- Temperature and High-Stress Creep of Ni-Base Single Crystal Superalloys

1
Institute for Materials, Ruhr-Universität Bochum, Universitätsstr. 150, 44801 Bochum, Germany
2
Institute of Physics of Materials, Zizkova 22, 616 62 Brno, Czech Republic
3
Department of Materials Science, Tohoku University, 6-6-02 Aramaki Aza Aoba, Aoba-ku, Sendai 980-8579, Japan
*
Author to whom correspondence should be addressed.
Crystals 2020, 10(2), 134; https://doi.org/10.3390/cryst10020134
Submission received: 27 January 2020 / Revised: 19 February 2020 / Accepted: 20 February 2020 / Published: 22 February 2020
(This article belongs to the Special Issue Crystal Plasticity)

Abstract

:
The present work investigates γ-channel dislocation reactions, which govern low-temperature (T = 750 °C) and high-stress (resolved shear stress: 300 MPa) creep of Ni-base single crystal superalloys (SX). It is well known that two dislocation families with different b-vectors are required to form planar faults, which can shear the ordered γ’-phase. However, so far, no direct mechanical and microstructural evidence has been presented which clearly proves the importance of these reactions. In the mechanical part of the present work, we perform shear creep tests and we compare the deformation behavior of two macroscopic crystallographic shear systems [ 01 1 ¯ ] ( 111 ) and [ 11 2 ¯ ] ( 111 ) . These two shear systems share the same glide plane but differ in loading direction. The [ 11 2 ¯ ] ( 111 ) shear system, where the two dislocation families required to form a planar fault ribbon experience the same resolved shear stresses, deforms significantly faster than the [ 01 1 ¯ ] ( 111 ) shear system, where only one of the two required dislocation families is strongly promoted. Diffraction contrast transmission electron microscopy (TEM) analysis identifies the dislocation reactions, which rationalize this macroscopic behavior.

Graphical Abstract

1. Introduction

Creep, the time-dependent plastic deformation of materials, limits the service life of single crystal Ni-base superalloys (SX) [1,2]. During low-temperature (T < 800 °C)and high-stress (σ > 600 MPa) 100 tensile creep of SX, dislocation ribbons with a 112 displacement vectors move through the γ/γ′-microstructure [3,4,5,6,7,8,9]. The nucleation of such ribbons requires the reaction between ordinary a/2 110 γ-channel dislocations. In the early stages of low-temperature and high-stress primary tensile creep in the 100 direction, two creep rate minima are observed [10,11]. Dislocation processes, which rationalize this phenomenon, were studied. The increase of creep rate after the first minimum was interpreted as a result of an increasing intensity of reactions between two a/2 110 γ-channel dislocations with different Burgers vectors. While this reaction could be modelled using a simplified two-dimensional discrete dislocation dynamics (2D DDD) model [11], no direct experimental evidence for this reaction has been provided. In the present work, we combine high precision shear creep testing [12] with diffraction contrast scanning transmission electron microscopy (STEM) to show that these dislocation reactions govern low-temperature and high-stress SX creep.

2. Materials and Methods

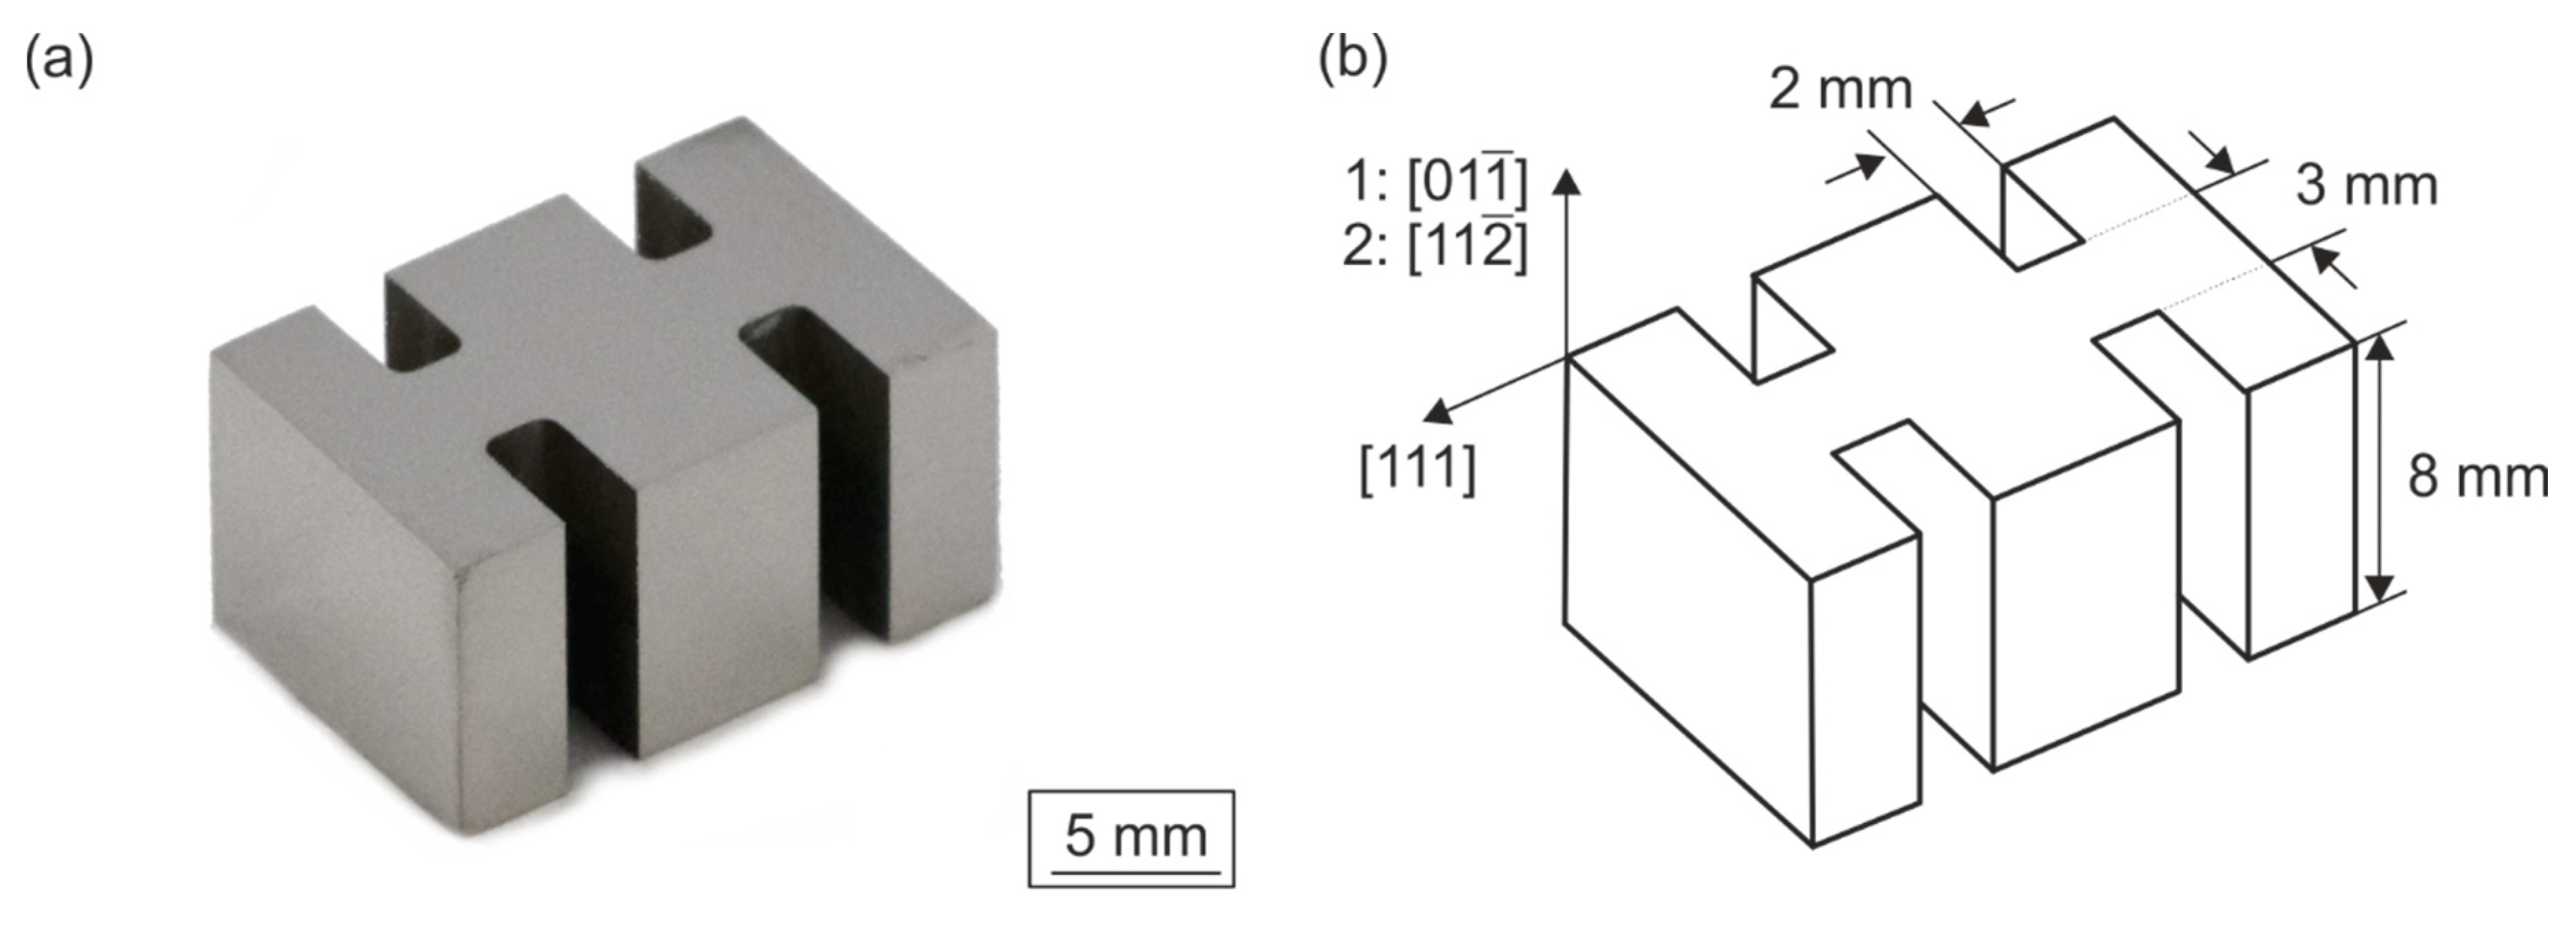
2.1. Material and Shear Creep Testing

The material investigated in the present work is the single crystal superalloy ERBO-1C (CMSX-4 type), which was available as a 140 mm × 100 mm × 20 mm slab. The chemical composition is given in Table 1 and all other details concerning its heat treatment and its microstructure have been published elsewhere [10,11,13,14].
The average spacing between primary dendrites was close to 500 µm [10,13]. After heat treatment and prior to creep, the average γ’-volume fractions were 72% and 77% in the dendritic and interdendritic regions, respectively [13,14]. In the present work, we used a shear creep test technique, which was recently documented [12]. The SX material was first mounted onto a goniometer and oriented into a specific crystallographic direction using a Laue system from Multiwire Laboratories (Lansing, NY, USA), equipped with an electronic position control unit and a sensitive real-time back reflection camera of type MWL120. The goniometer with the oriented specimen was subsequently fitted into an electro discharge machine (EDM) of type Charmilles Robofil 240 (Schorndorf, Germany), where the specimen was spark erosion machined as described in [15]. Figure 1 shows a photograph of the specimen together with a drawing which illustrates dimensions (shear width L = 2 mm, height H = 8 mm, and depth D = 3 mm) and crystallographic directions. Note that two macroscopic crystallographic shear systems (MCSS) are considered: [ 01 1 ¯ ] ( 111 ) and [ 11 2 ¯ ] ( 111 ) . During shear creep testing, the outer two loading wings were pulled upwards while the central loading section was pushed down. During creep, the shear displacement Δ was measured and the engineering shear γ was obtained by
γ = Δ L
Creep testing was performed using a creep machine of type Denison Mayes (Hunslet, Leeds, United Kingdom), equipped with a vertically movable three-zone resistance furnace. The individual zones were controlled by Eurotherm controllers (Neuss, Germany). The double shear creep specimen was positioned in the temperature constant zone of the furnace (at 750 °C: 100 mm). In addition to three control thermocouples, two measurement thermocouples were fixed to the upper and lower part of the shear specimens. The precision of the temperature measurement at 750 °C was ±2 °C. Displacements were measured using a ceramic rod in tube extensometry, which transferred displacements to electromechanical sensors (linear variable differential transformers, LVDTs) outside the furnace.
After mounting the specimens into the creep test rig, they were heated up to temperature within 2 to 3 hours under a small pre-load, which corresponds to 5% of the end load. Loads were applied over a 15:1 lever arm within 1 minute. As the creep specimens accumulated strain, the lever arm was kept in a horizontal position by an electromechanical control system. In the tensile studies which motivated the present work [10,11,15], the applied tensile stress in the 100 direction was 800 MPa. Comparable shear experiments on a macroscopic {111} shear system must therefore be performed at a directly applied shear stress of 328 MPa (800 MPa × 0.41). This shear stress yielded too high creep rates and therefore a stress of 300 MPa was chosen for the present work. Figure 2 shows a [ 01 1 ¯ ] ( 111 ) shear creep experiment, which was performed at a test temperature of 750 °C and 300 MPa. The experiment was interrupted after 5% shear strain, which corresponds to a shear displacement of 100 µm. This extensometer displacement result was verified in the SEM, as shown in Figure 2b,c. Creep tests were performed at a shear stress similar to the resolved shear stress which governed [001] tensile creep testing at 800 MPa (creep condition considered in [10,11]).

2.2. Scanning Transmission Electron Microscopy (STEM)

STEM was performed on crept specimens using a Jeol JEM-2100 F (Tokyo, Japan) operating at 200 kV. To prepare TEM specimens, 300 µm slices were cut out parallel to the shear planes of the double shear creep specimen using an Accutom 5 cutting disk from Struers. These were polished down to a thickness of 100 µm using emery paper of mesh size 4000. Electron transparent thin foils were obtained by electrochemical thinning using a TenuPol-5. An electrolyte consisting of 70 vol.-% methanol, 20 vol.-% glycerin, and 10 vol.-% perchloric acid yielded good thinning results at 2 °C, a voltage close to 14 V, and a flow rate of 16. All details describing TEM specimen preparation and the standard TEM procedures used in the present work have been described elsewhere [10,11,16,17,18,19]. The microstructure of the material prior to creep is shown in Figures 2 (SEM) and 3 (TEM) of [10]. No rafting is observed after 750 °C creep exposure [10]. It was shown how γ-channel widths (15–125 nm, average: 65 nm) and γ’-cube sizes (50–750 nm, average: 442 nm) scatter [10]. In the present work, we evaluated STEM micrographs, which were taken using two beam contrast conditions. Table 2 summarizes corresponding diffraction vectors together with the figure number of the STEM micrograph presented in this work.
In the present work, dislocation densities were determined using Ham’s intercept method [20], following the procedure described by Wu et al. [10]. The thicknesses of TEM foils were measured using a stereo technique [19,21]. Dislocation densities were evaluated from 4 to 5 TEM micrographs per material state (g: ( 1 1 ¯ 1 ¯ ) ). The micrographs were taken from TEM foils parallel to (111). Foil regions of about 10 x 10 µm2 were considered. Sixteen reference lines (8 lines parallel and 8 horizontal to shear direction) were evaluated for one dislocation density value. The measured dislocation densities represent mean values obtained from all micrographs. Error bars show the highest and lowest dislocation density measured on the micrographs for one material state.

2.3. Calculation of Peach Köhler Glide and Climb Forces (PKFg and PKFc)

In order to rationalize dislocation reactions, Peach Köhler glide and climb forces were calculated, using the 2D DDD methodology described previously [11,18,22,23]. We considered an actual dislocation substructure, which was characterized using STEM and used the input parameters listed in [11] (see Table 3 in [11]).

3. Results

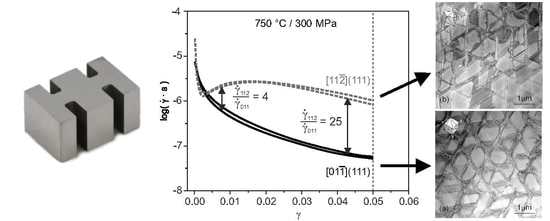
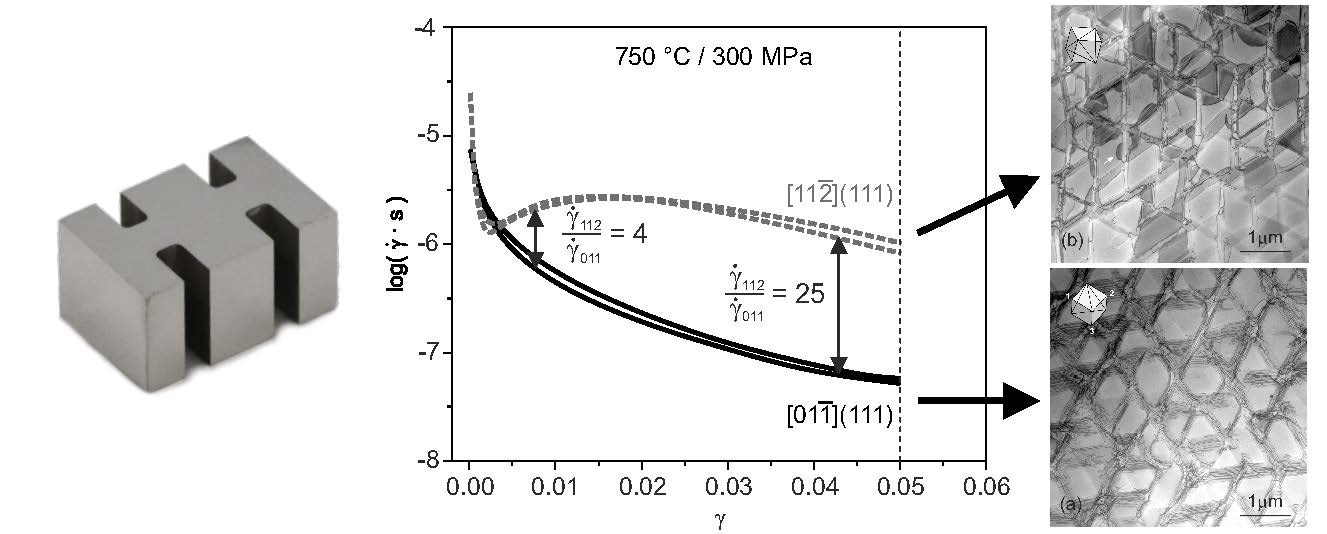
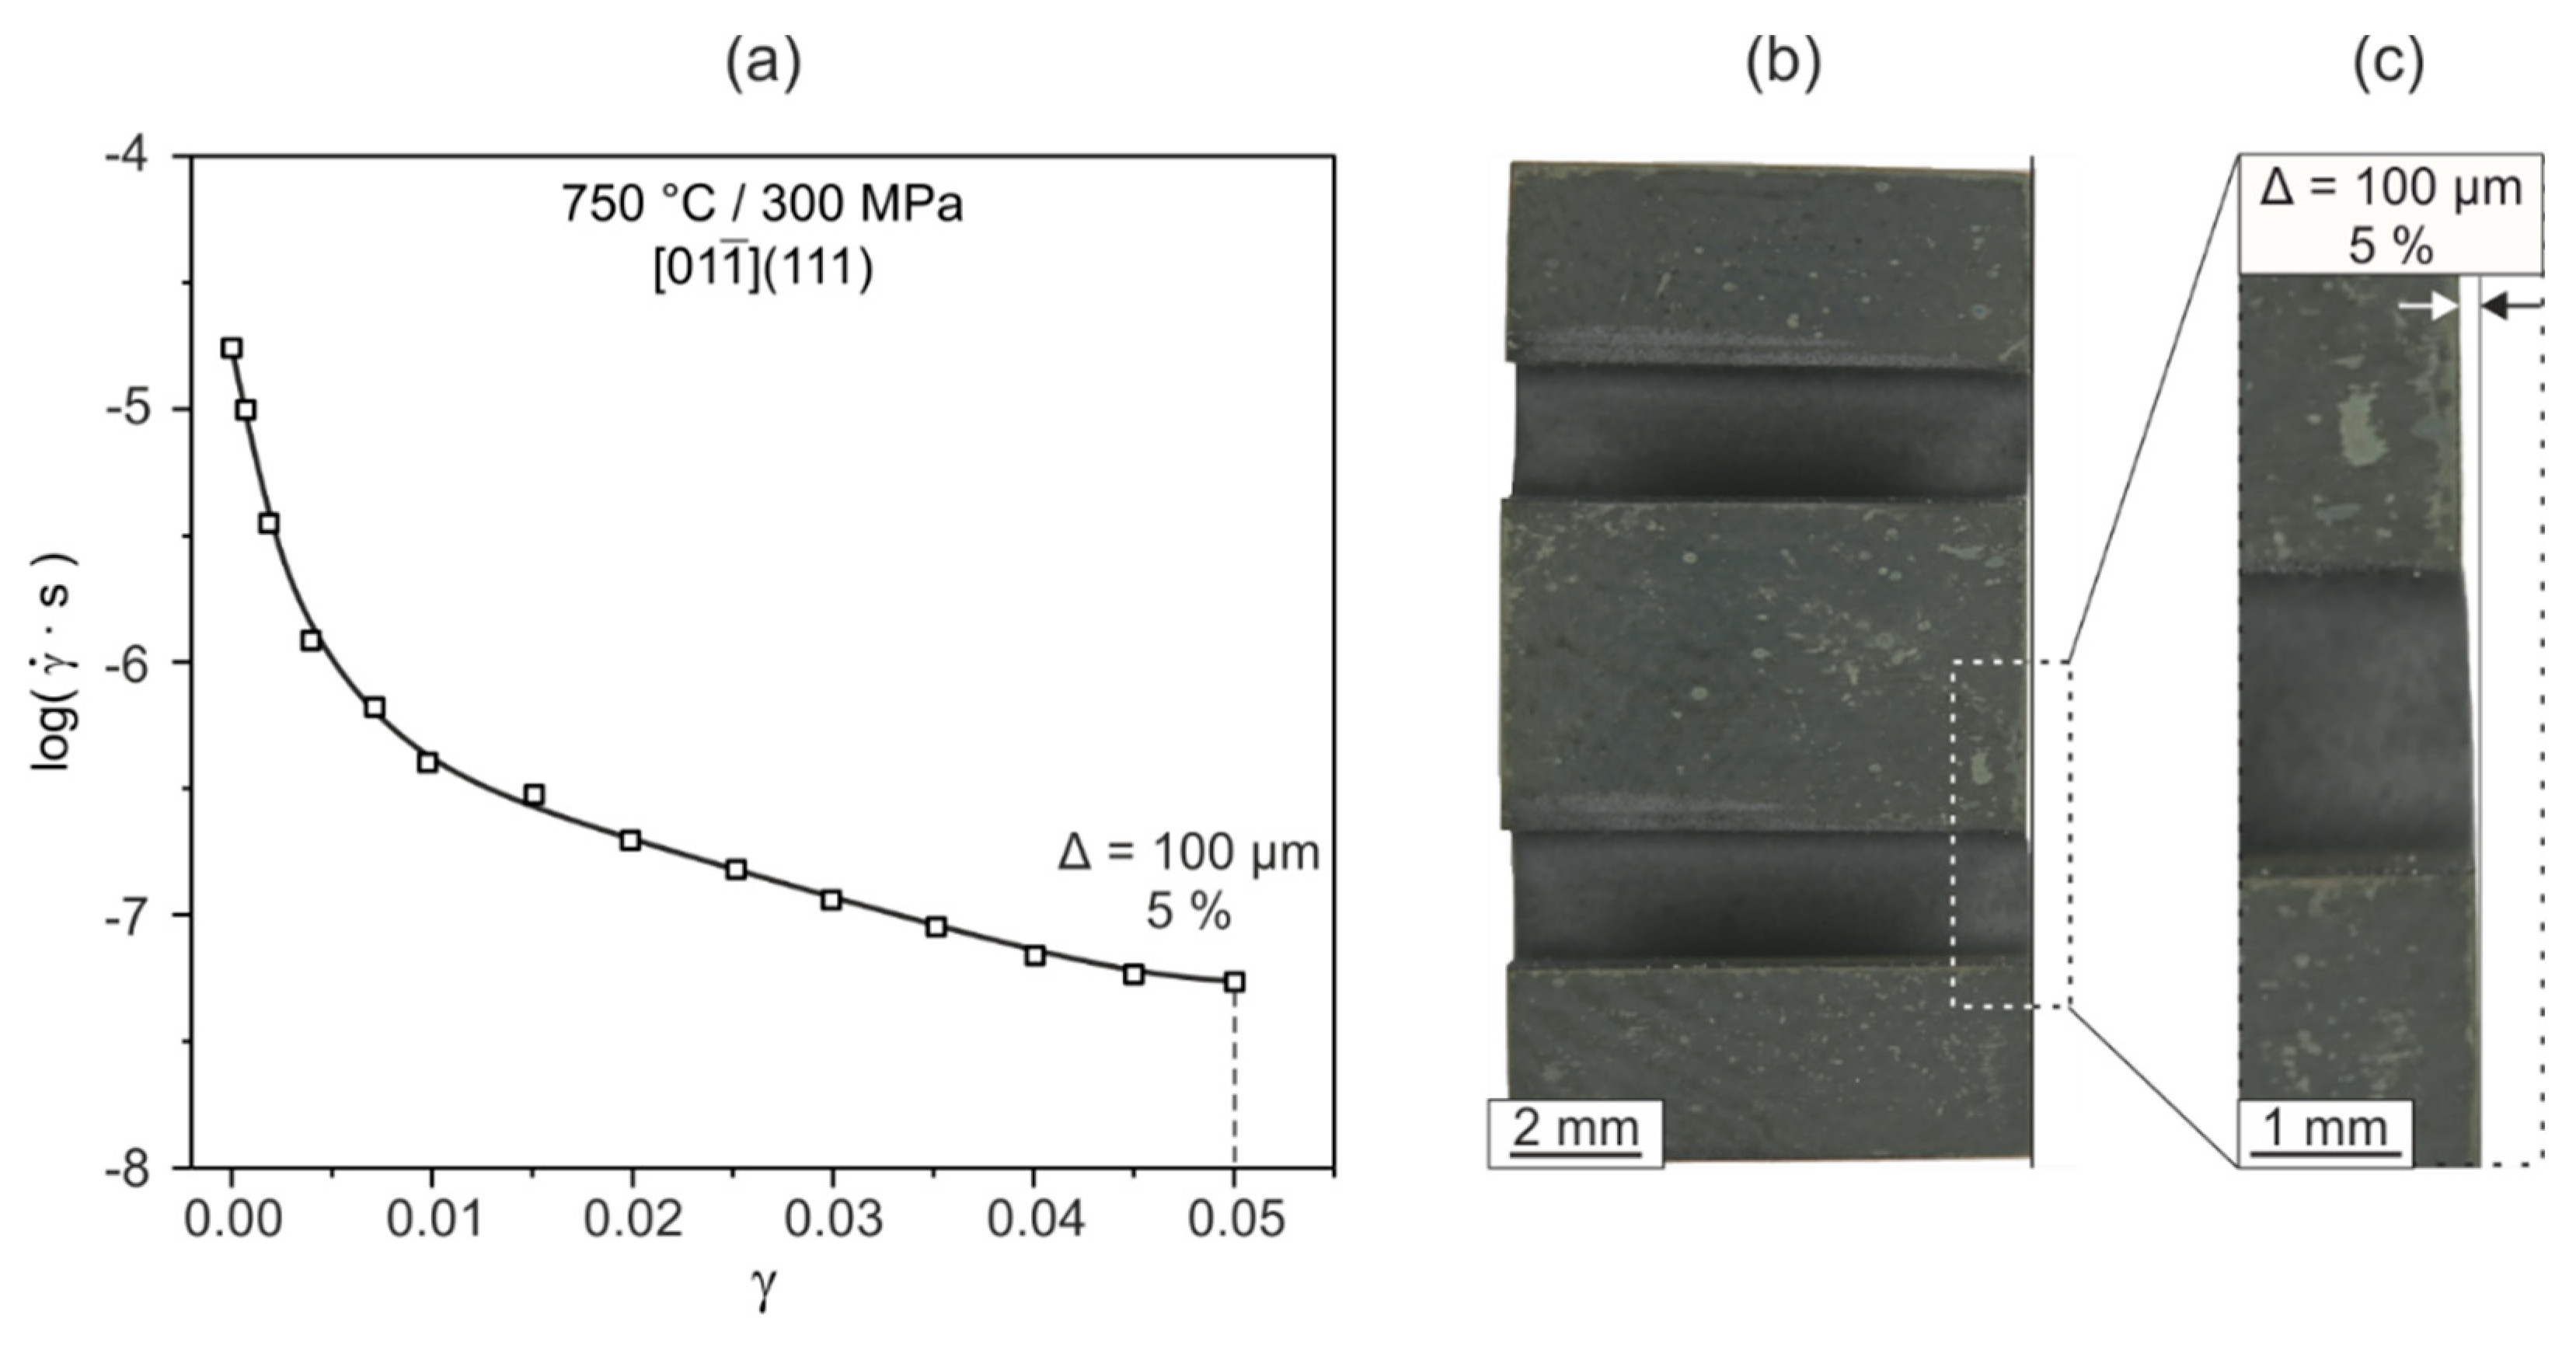
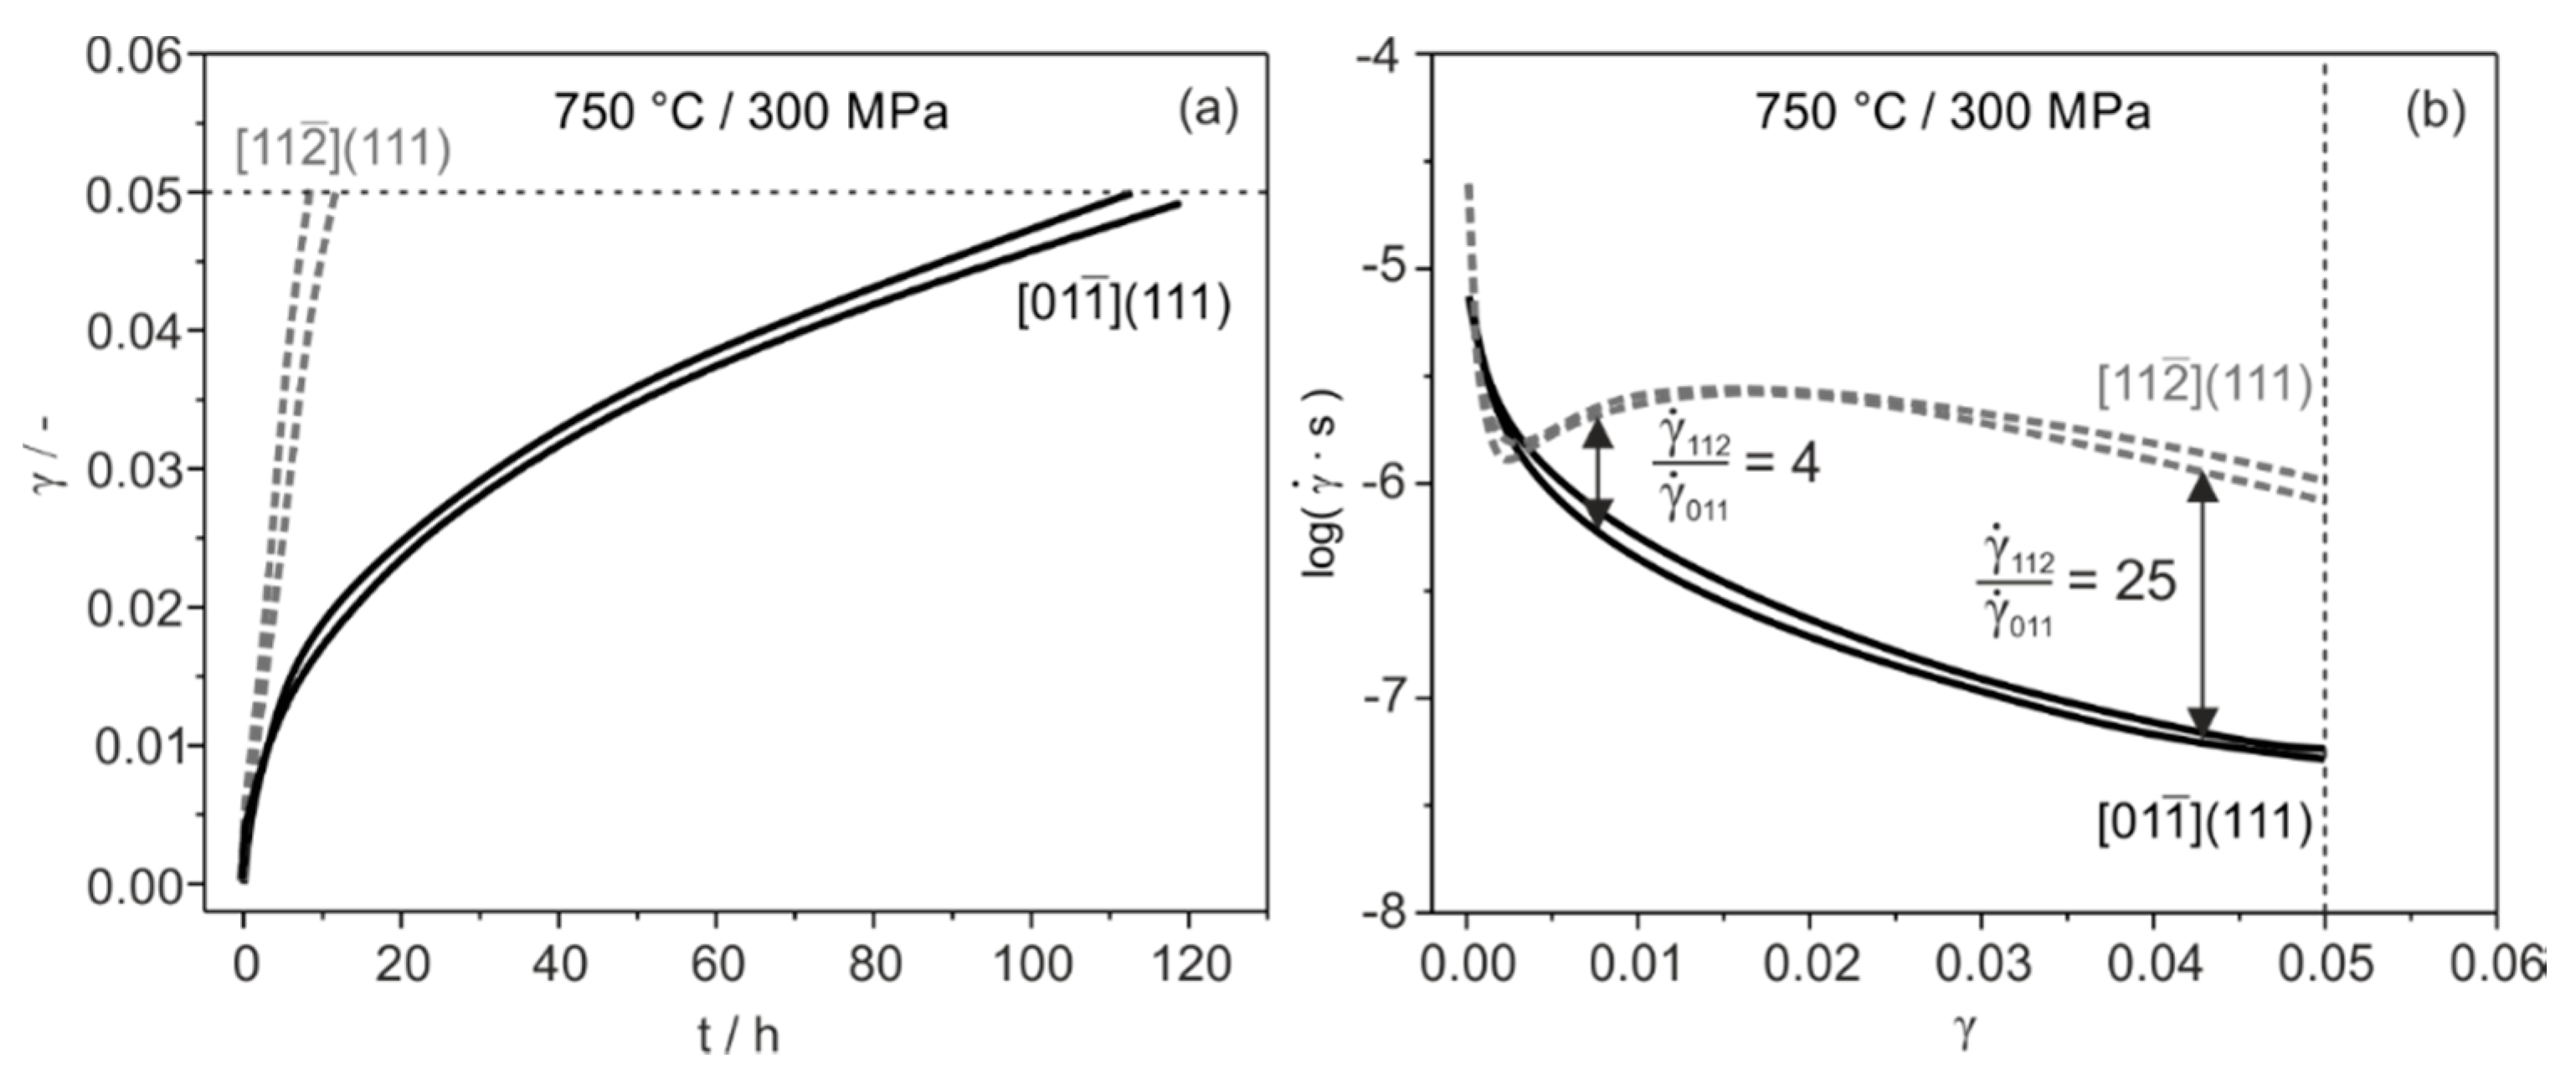
3.1. Creep in the Two MCSSs

In Figure 3, we compare the creep behavior of the macroscopic shear systems [ 01 1 ¯ ] ( 111 ) and [ 11 2 ¯ ] ( 111 ) . Two creep curves are shown for the two systems, which both show reproducible creep behavior. In Figure 3a, shear strains are plotted as a function of time t. Figure 3b shows the logarithmic creep rates as a function of strain. Early on, the two shear systems deform at a similar rate. However, starting at shear strains of the order of 0.5%, the creep rates of the two shear systems start to deviate from each other. At shear strains close to 1%, the [ 11 2 ¯ ] ( 111 ) shear system deforms four times faster than the [ 01 1 ¯ ] ( 111 ) shear system. This ratio increases to 25 at a strain of 4.25%, as shown in Figure 3b.

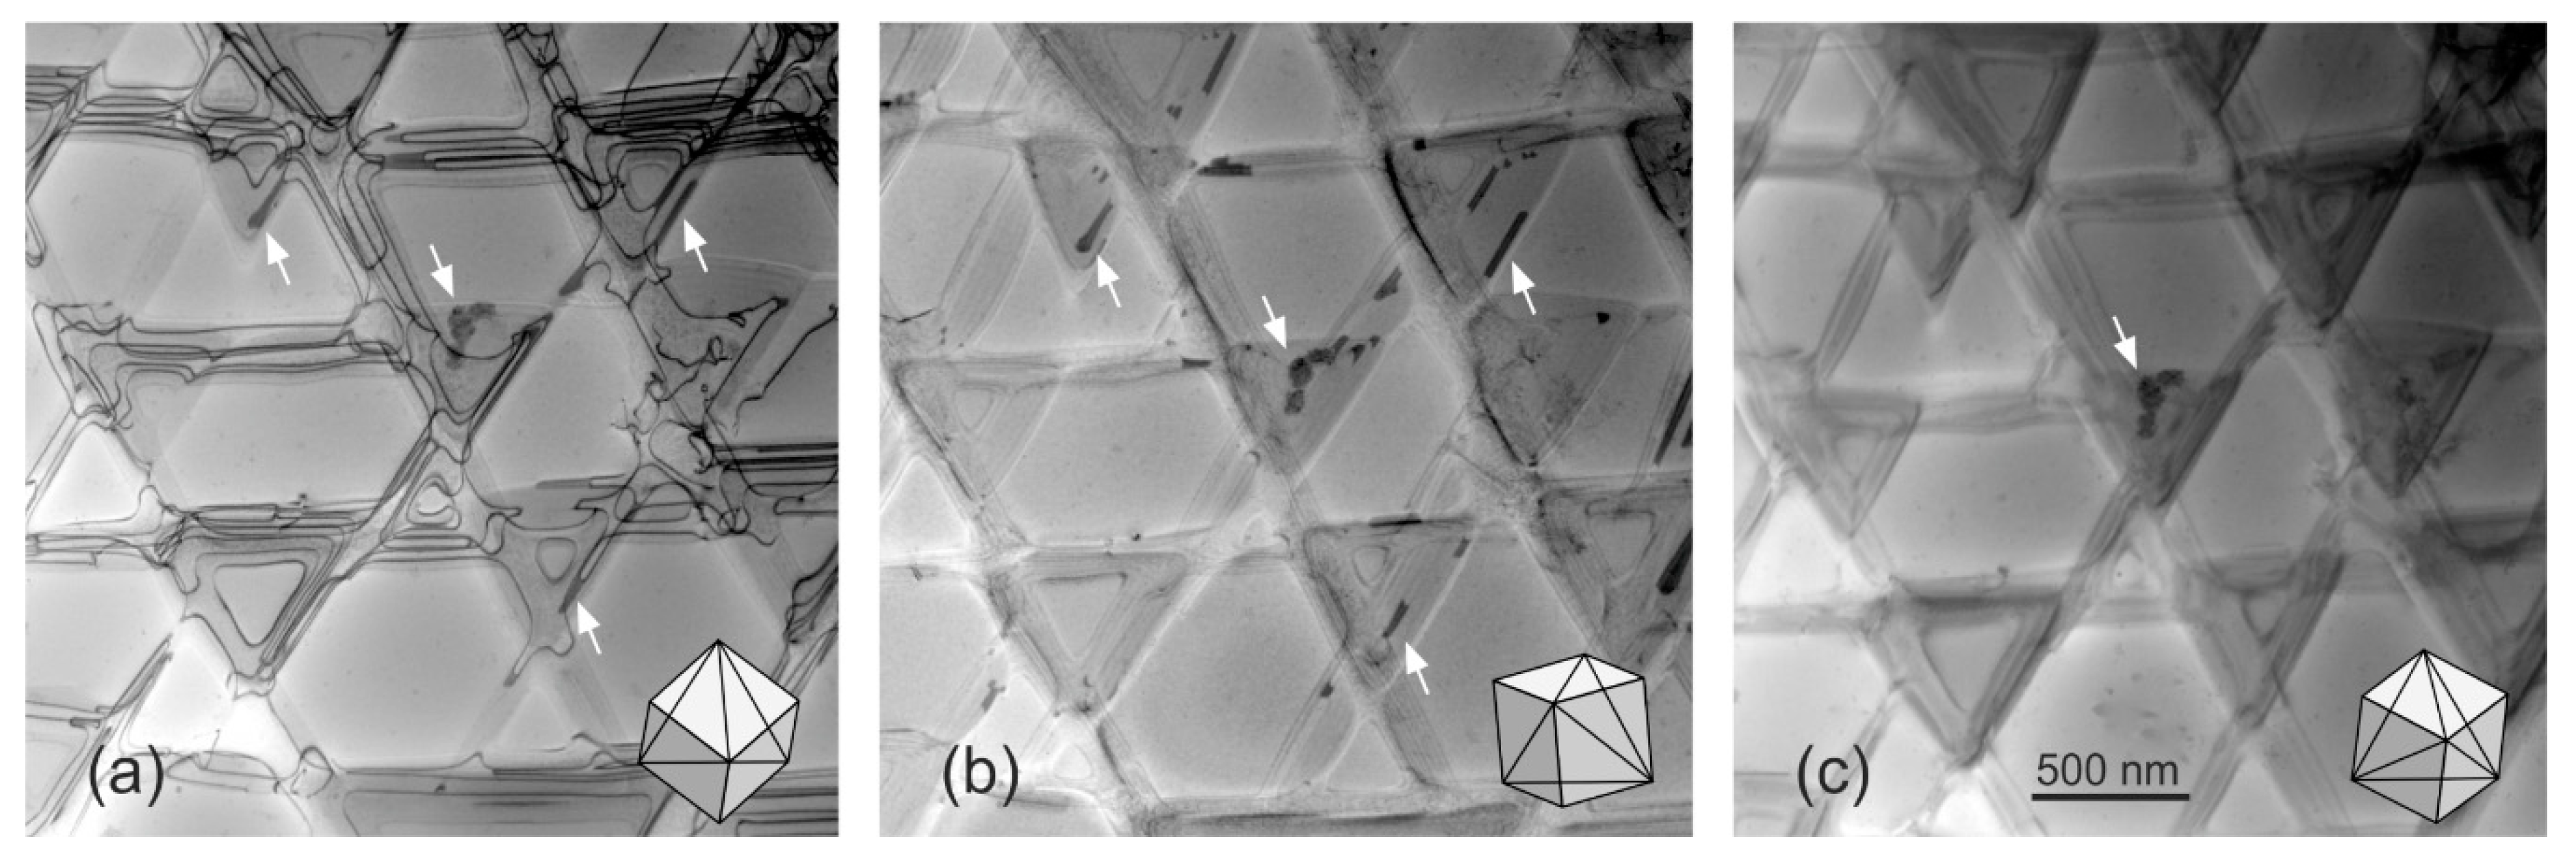
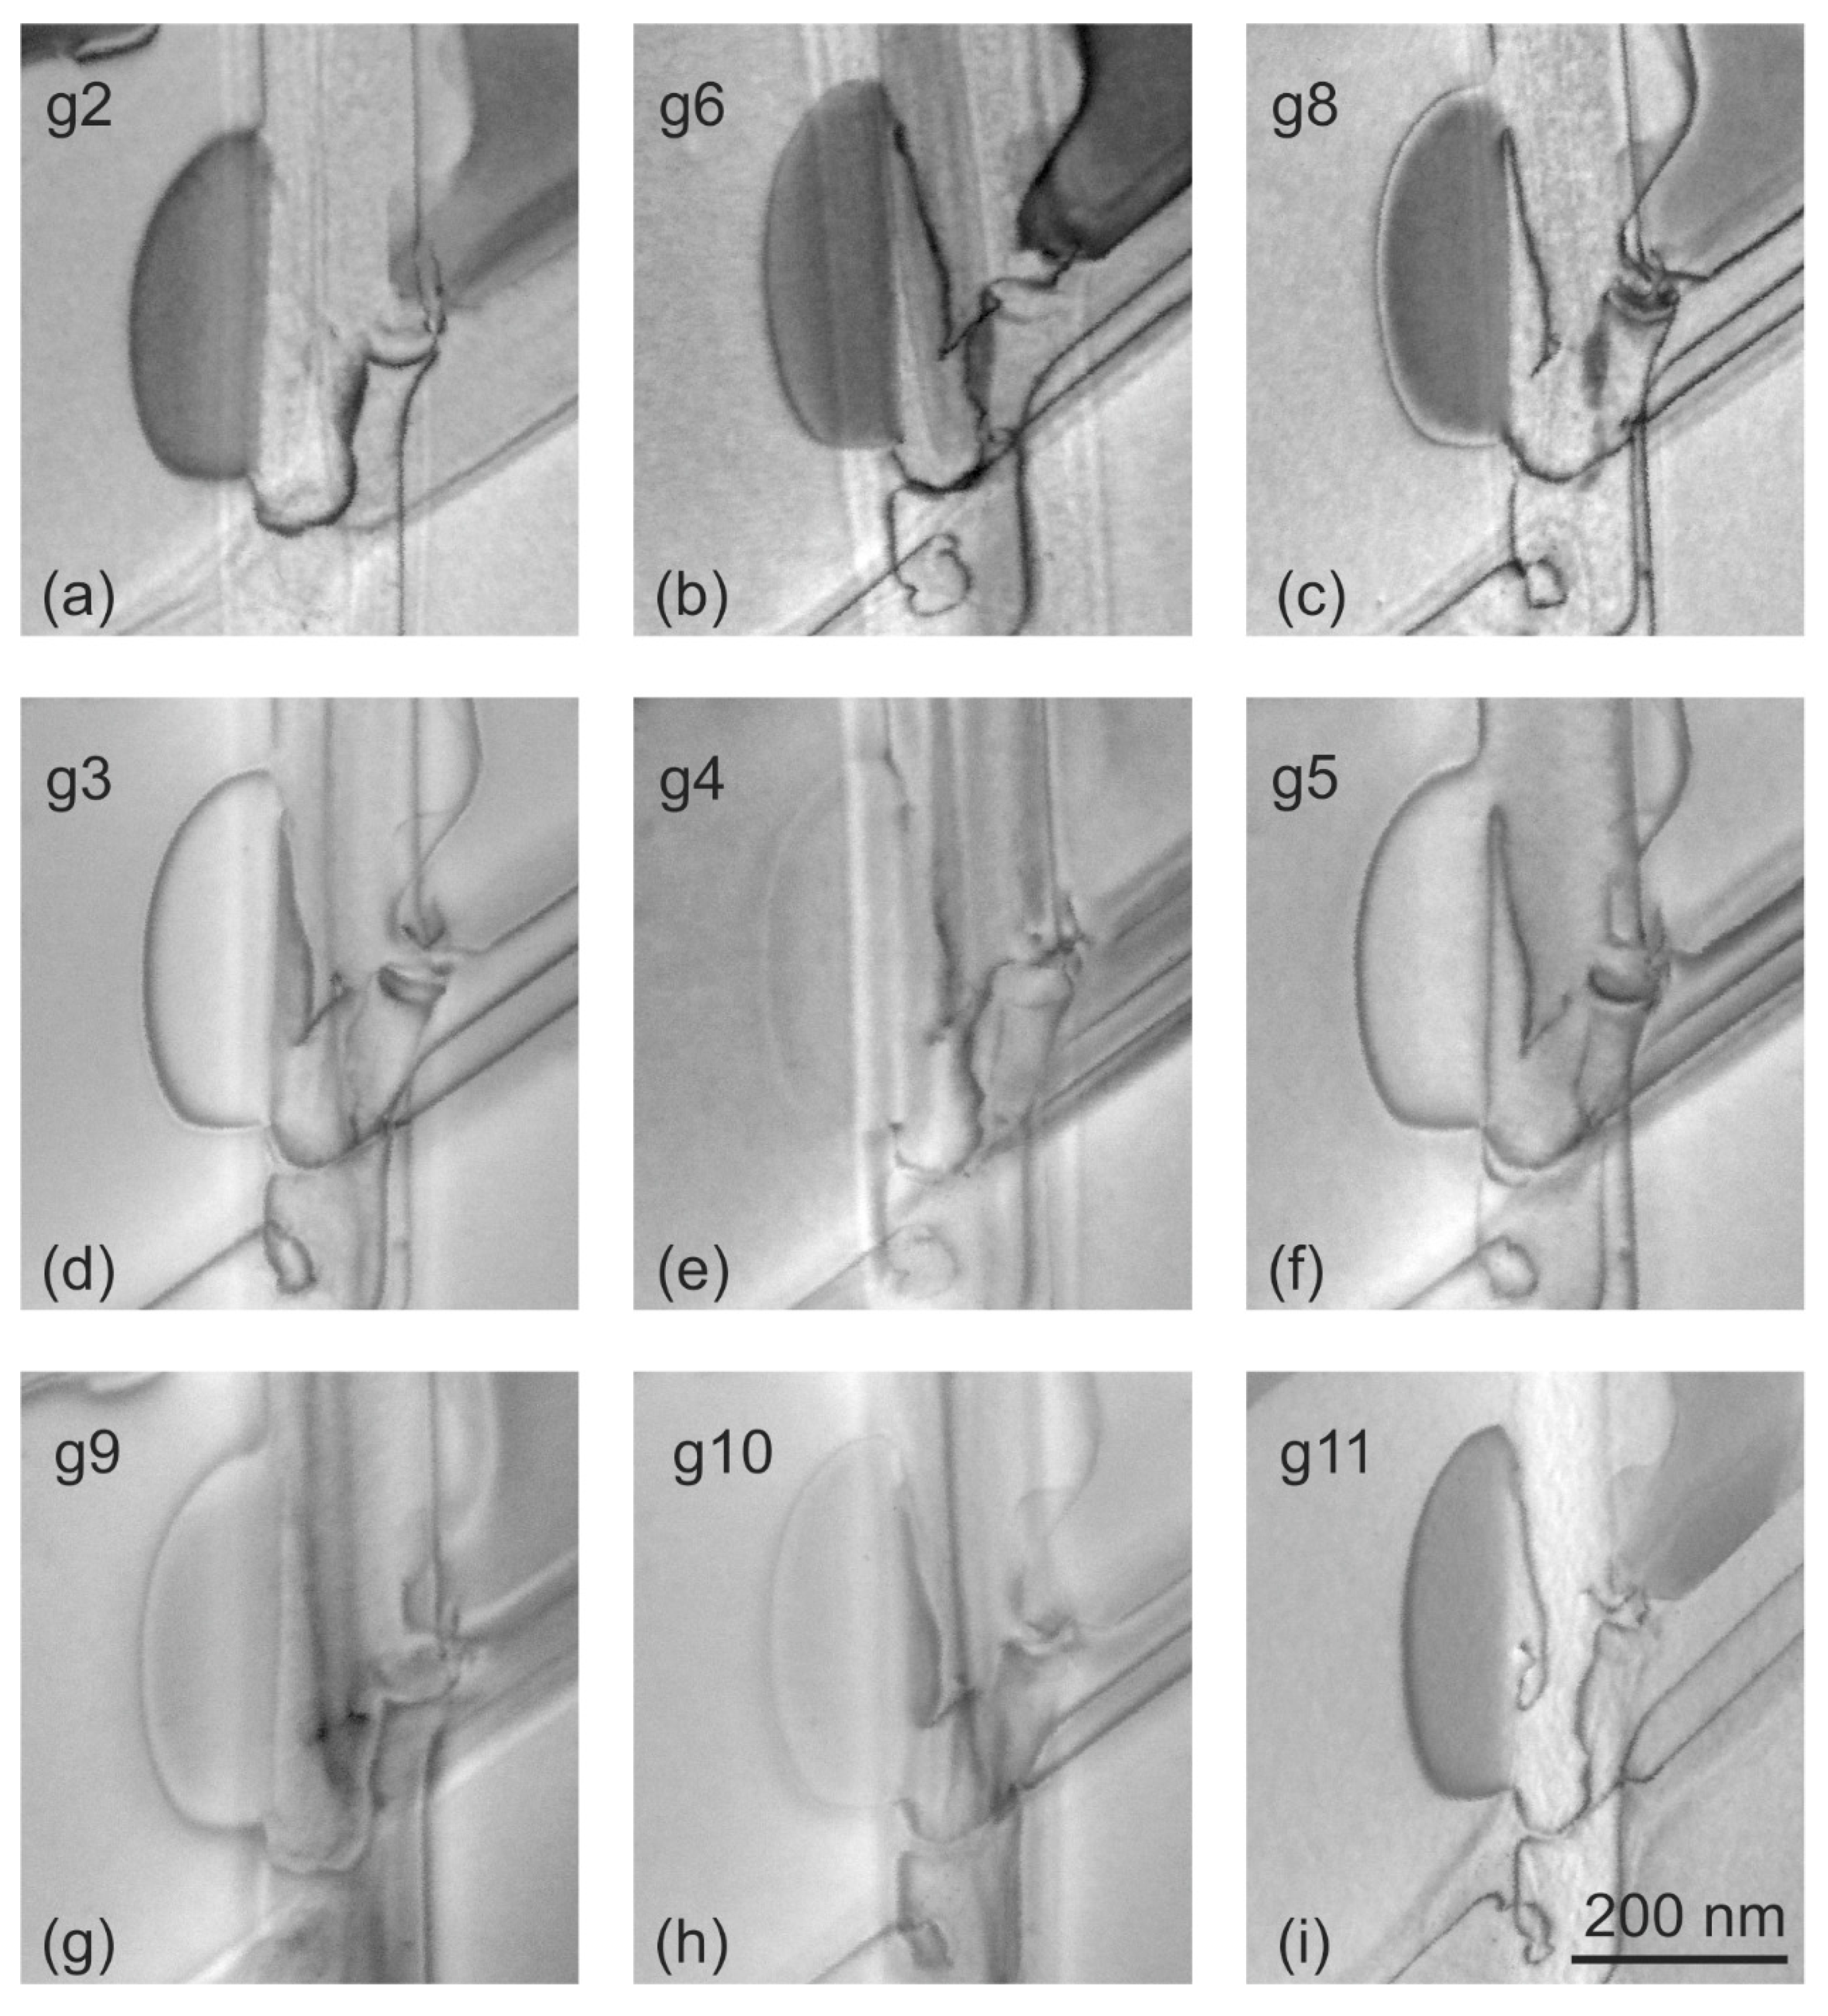
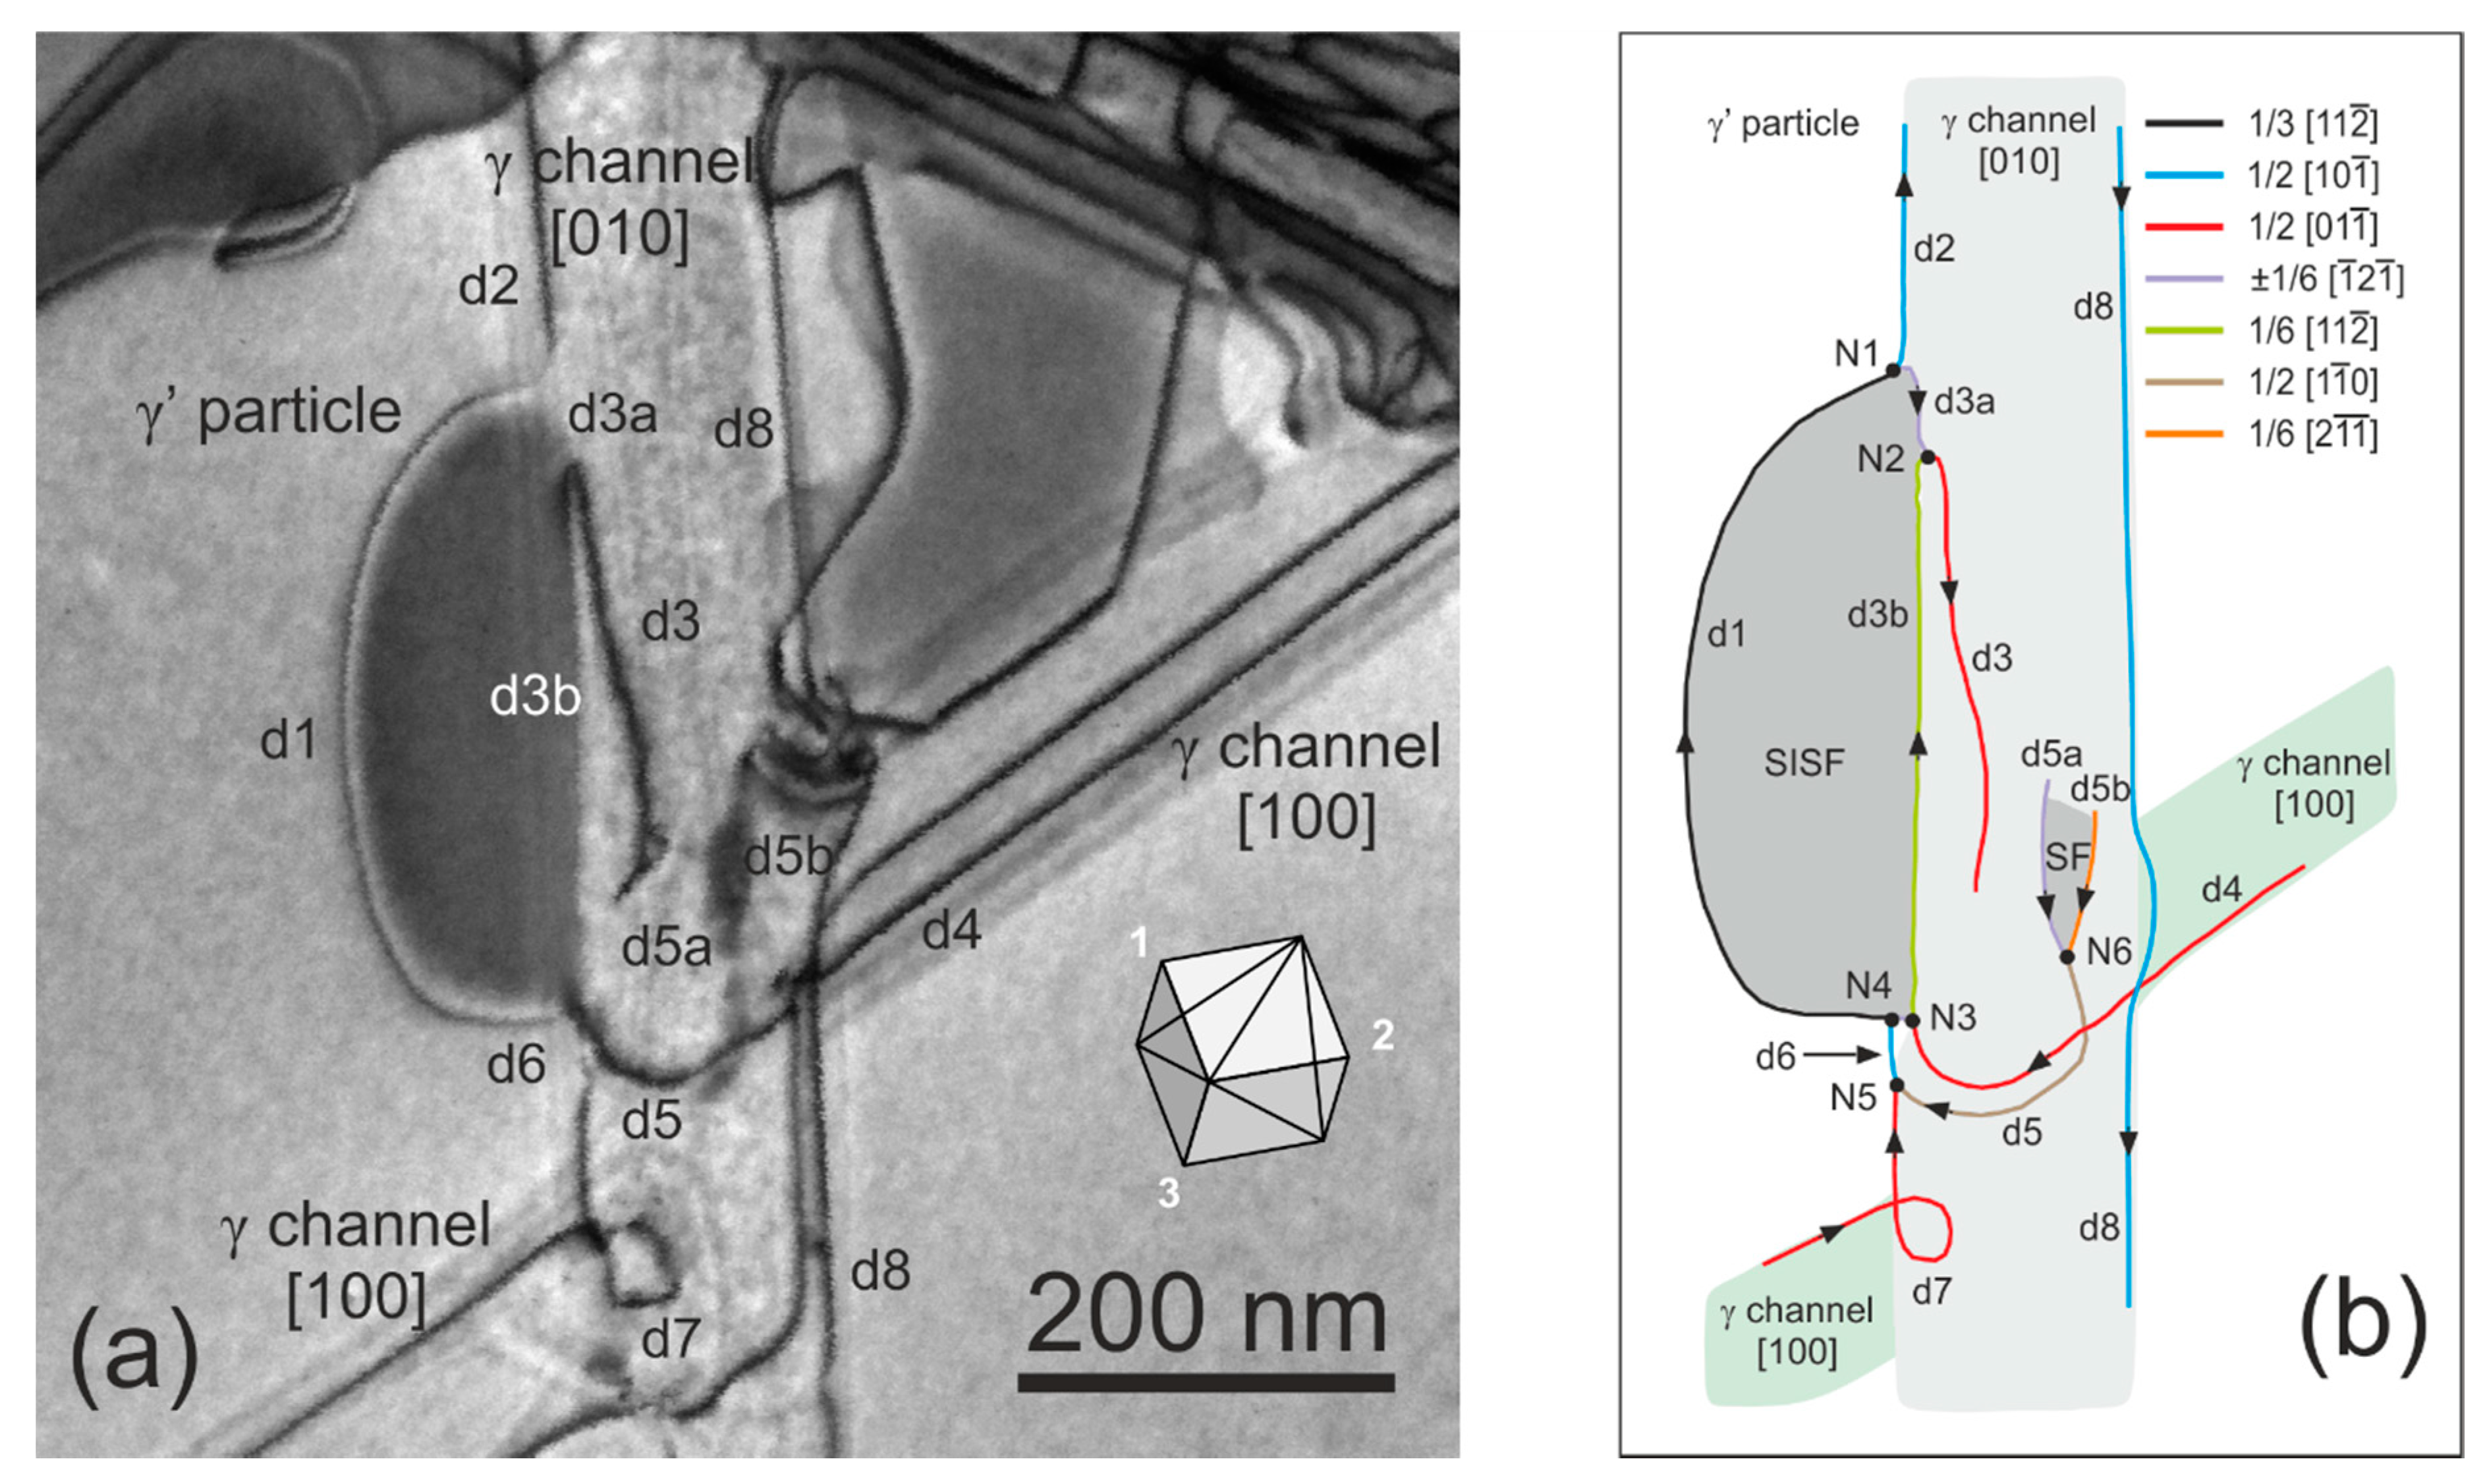
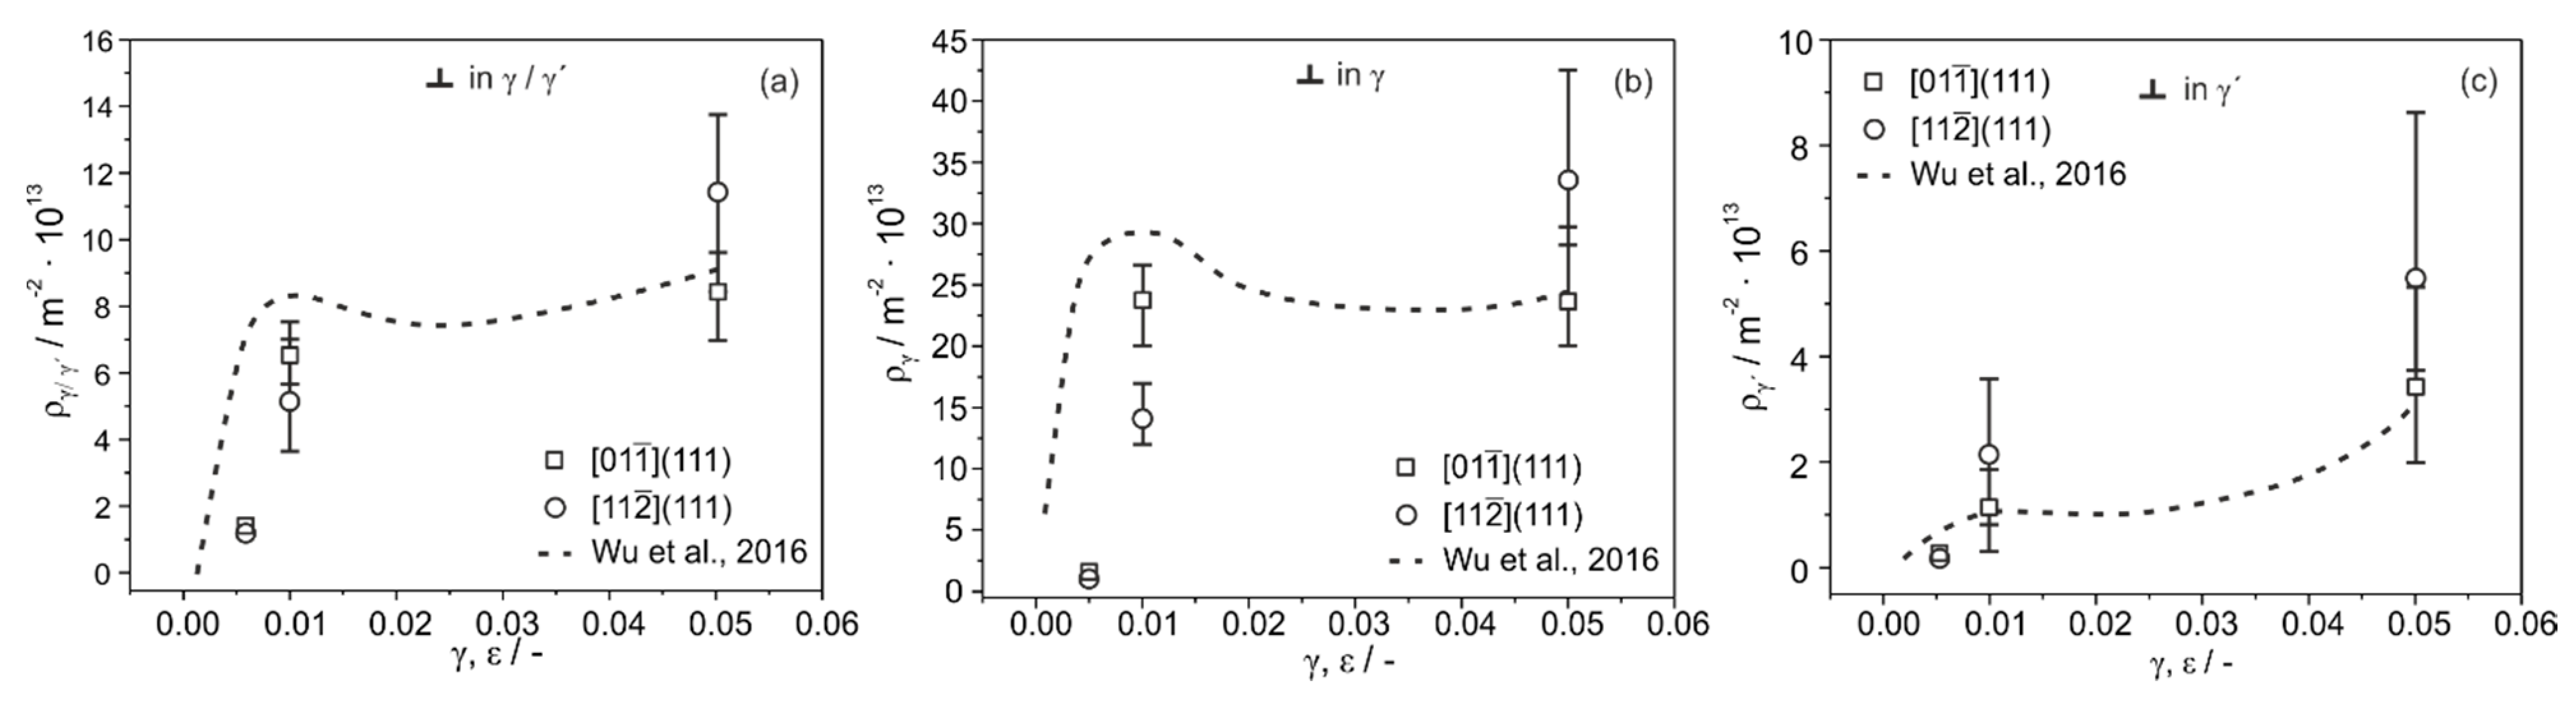
3.2. Dislocations and Planar Faults

Overview micrographs of dislocations and planar faults that formed during shear creep deformation at 750 °C and 300 MPa are shown in Figure 4a,b. They illustrate the state of the microstructure after 1% shear deformation in the macroscopic [ 01 1 ¯ ] ( 111 ) (Figure 4a, g7= ( 1 ¯ 1 ¯ 1 ) ) and [ 11 2 ¯ ] ( 111 ) (Figure 4b, g1= ( 1 1 ¯ 1 ¯ ) ) shear systems. Cube projections in the upper left corners of both STEM micrographs indicate the foil orientations. At the equivalent contrast condition of type {111}, the two microstructures show clear differences, as shown in Figure 4a,b. A high density of gamma channel dislocations is observed in Figure 4a. These dislocations enter the γ-channels in the early stages of creep and, depending on the channel type, deposit 60° and screw dislocation segments at the γ/γ’-interfaces. In Figure 4a, dislocations do not cut into the γ’-particles and no planar faults in the γ’-phase are observed. In contrast, numerous γ’-stacking faults (either superlattice intrinsic (SISF) or extrinsic (SESF)) have formed after 1% shear in the [ 11 2 ¯ ] ( 111 ) shear system, as shown in Figure 4b. One of the early γ’-cutting events is marked by a white arrow in Figure 4b.
Figure 5 shows three STEM micrographs taken after 1% [ 01 1 ¯ ] ( 111 ) shear creep deformation. These micrographs document full visibility for g7= ( 1 ¯ 1 ¯ 1 ) , as shown in Figure 5a, and two effective invisibilities for g2= ( 1 1 ¯ 1 ¯ ) , as shown in Figure 5b, and −g9 = ( 3 ¯ 11 ) , as shown in Figure 5c. The effective g·b = 0 invisibility criterion suggests that the Burgers vectors of these dislocations are of type ±1/2 [ 01 1 ¯ ] . Several of the leading ±1/2 [ 01 1 ¯ ] segments shown in Figure 5a (three of which are highlighted by white arrows pointing up) decompose into classical stacking fault coupled Shockley partials ±1/6 [ 1 ¯ 2 1 ¯ ] and ±1/6 [ 11 2 ¯ ] on the (111) plane. The white arrow pointing down marks a contamination, which serves as a reference location in all three micrographs of Figure 5. The locations of the three Shockley partials are also highlighted by white arrows in Figure 5b.
Nine STEM images of the cutting event highlighted with the white arrow in Figure 4b are shown in Figure 6a–i. They were taken using different contrast conditions (g-vectors) after macroscopic [ 11 2 ¯ ] ( 111 ) shear creep deformation to 1% (750 °C, 300 MPa). Stereo microscopy was used (images not shown) in order to clarify the spatial arrangement of individual dislocation segments [19,21].
Figure 7a shows the microstructure presented in Figure 6c at a higher magnification. Figure 7a and the associated schematic drawing in Figure 7b identify individual dislocation segments. The results of the effective visibility/invisibility Burgers vector analysis are compiled in Table 3 (effective visibilities/invisibilities for g2 to g6) and Table 4 (effective visibilities/invisibilities for g8 to g11). The last column of Table 4 shows the resulting b-vectors.
Figure 8 shows how dislocation densities evolve as a function of shear strain during macroscopic [ 01 1 ¯ ] ( 111 ) and [ 11 2 ¯ ] ( 111 ) shear loading. The dislocation density data obtained after shear creep testing in the present work are plotted as a function of shear strain γ. For comparison, the [001] tensile creep results from Wu et al. [10] are plotted as a function of strain ε into the same diagram (same x-axis). Figure 8a shows the increase of the overall dislocation density. As can be seen in Figure 8b (channel dislocation densities), there is a higher increase of dislocation density after 1% in the macroscopic [ 01 1 ¯ ] ( 111 ) shear system than in [ 11 2 ¯ ] ( 111 ) , while the opposite holds for 5%. Figure 8c shows the dislocation density evolution in the γ’-phase. Here, it is important to highlight that after 1% strain, more dislocations are detected in the γ’-phase after [ 11 2 ¯ ] ( 111 ) than after [ 01 1 ¯ ] ( 111 ) shear loading.

4. Discussion

4.1. Mechanical and Micro Mechanical Analysis

As a striking new result, it was found that from 0.5% onwards, the [ 11 2 ¯ ] ( 111 ) shear system deforms significantly faster than the shear system [ 01 1 ¯ ] ( 111 ) , as shown in Figure 3 (see also strain vs. time data in [12]). The corresponding logarithmic shear rate plotted as a function of shear strain is presented in Figure 3b. As a first step in our analysis, we took a look at the twelve basic microscopic crystallographic glides systems of type 110 { 111 } , which govern plasticity in cubic face-centered and related lattices. Table 5 compiles loading modes and Schmid factors [24], which scale as the resolved shear stresses, which, in turn, drive the dislocation activities in the associated microscopic crystallographic slip systems. We keep in mind that the present work was motivated by mechanical and microstructural findings related to 001 tensile loading (T). As can be seen in the fourth column of Table 5, precisely oriented 001 tensile loading [10,11,15] results in activation of eight out of twelve slip systems. This makes it difficult to single out the role of individual dislocation families and to analyze their reactions. In contrast, one microscopic crystallographic slip system promoted during 110 { 111 } shear creep (Schmid factor 1 is highlighted in bold in Table 5) but two during 112 { 111 } loading (Schmid factors 0.87 are highlighted in bold in Table 5). The corresponding Schmid factors for these two shear loading modes are listed in columns 5 and 6 of Table 5. Our mechanical results, presented in Figure 3, show that the macroscopic crystallographic shear system [ 11 2 ¯ ] ( 111 ) , where two slip systems have a Schmid factor of 0.87, deforms significantly faster than the [ 01 1 ¯ ] ( 111 ) shear system, where one dislocation family is promoted by the strongest resolved shear stress (Schmid factor: 1).
Figure 3 shows that the creep rates in both shear systems decrease during early primary creep, which is due to the filling of γ-channels by dislocations. In the [ 01 1 ¯ ] ( 111 ) shear system this decrease of creep rate continues throughout, up to 5% shear, where the test was terminated. In contrast, the [ 11 2 ¯ ] ( 111 ) shear system shows an increase of creep rate towards an intermediate maximum, very similar to what was reported by Wu et al. [10] for uniaxial [001] testing in the same temperature range. In this study, we show that this increase of creep rate is associated with the start of γ’-cutting. The fact that creep rates during [001] tensile testing decrease much more rapidly in the early stages of creep [10] is due to the interaction of multiple slip systems. This also explains why γ-channel dislocation densities increase more strongly during [001] creep (see data from [10] shown as dashed line in Figure 8). Figure 8 also shows that at shear strains of the order of 1%, where γ’-cutting starts, γ-channel dislocation densities in the [ 11 2 ¯ ] ( 111 ) shear systems are lower than in the [ 01 1 ¯ ] ( 111 ) shear system. The fact that γ’-cutting can result in a decrease of dislocation density has been explained in [10]. The continuous decrease of creep rate for shear strains > 2% has been attributed to the increase of γ-channel dislocation density (growing population of 1/2 110 dislocations [6]).

4.2. Analysis of STEM Overview Micrographs

The shear test technique used in the present work not only facilities micro mechanical analysis. As compared to 001 tensile experiments, which are commonly used to study these phenomena, it also has the advantage that it is easy to obtain TEM foils, which contain the glide planes of the activated slip systems. Therefore, all STEM micrographs presented in the present work contain long dislocation segments, which facilitate the analysis of dislocation reactions. The STEM image presented in Figure 4a shows that dislocations do not enter γ′-particles after 1% shear strain in the macroscopic [ 01 1 ¯ ] ( 111 ) shear system. It is generally assumed that dislocation plasticity is confined to the γ-channels and that dislocations do not easily enter the γ’-phase because of the high antiphase boundary (APB) energy associated with the classical pairwise cutting of the ordered L12 phase [2,25,26,27,28,29,30].The STEM micrographs shown in Figure 5a–c prove, that only the 1/2 [ 01 1 ¯ ] slip system (SF=1, Table 5) carries high temperature plasticity in the early stages of [ 01 1 ¯ ] ( 111 ) shear creep deformation. In contrast, in the macroscopic [ 11 2 ¯ ] ( 111 ) shear system, which after 1% shear deforms significantly faster than the [ 01 1 ¯ ] ( 111 ) shear system, frequent cutting events are observed, which manifest themselves by the presence of planar faults in the γ’-phase, as shown in Figure 4b. This represents direct experimental evidence for a rate controlling dislocation reaction of type
a / 2 [ 10 1 ¯ ] γ + a / 2 [ 01 1 ¯ ] γ a / 3 [ 11 2 ¯ ] γ + a / 6 [ 11 2 ¯ ] γ / γ
which accounts for the formation of the leading half of a dislocation ribbon (e.g., [3,4,5,6,7,8,9,10,11,31,32,33,34]). In combination with our mechanical results, this suggests that this reaction is promoted (and γ’-cutting more frequent) when the two dislocation families which participate in the reaction are equally strongly activated. While this result supports views suggested in the literature [3,4,5,6,7,8,9,10,11,31,32,33,34], the specific experimental evidence, proving the character of the reacting dislocation families and characterizing the reaction event itself, has previously not been given.

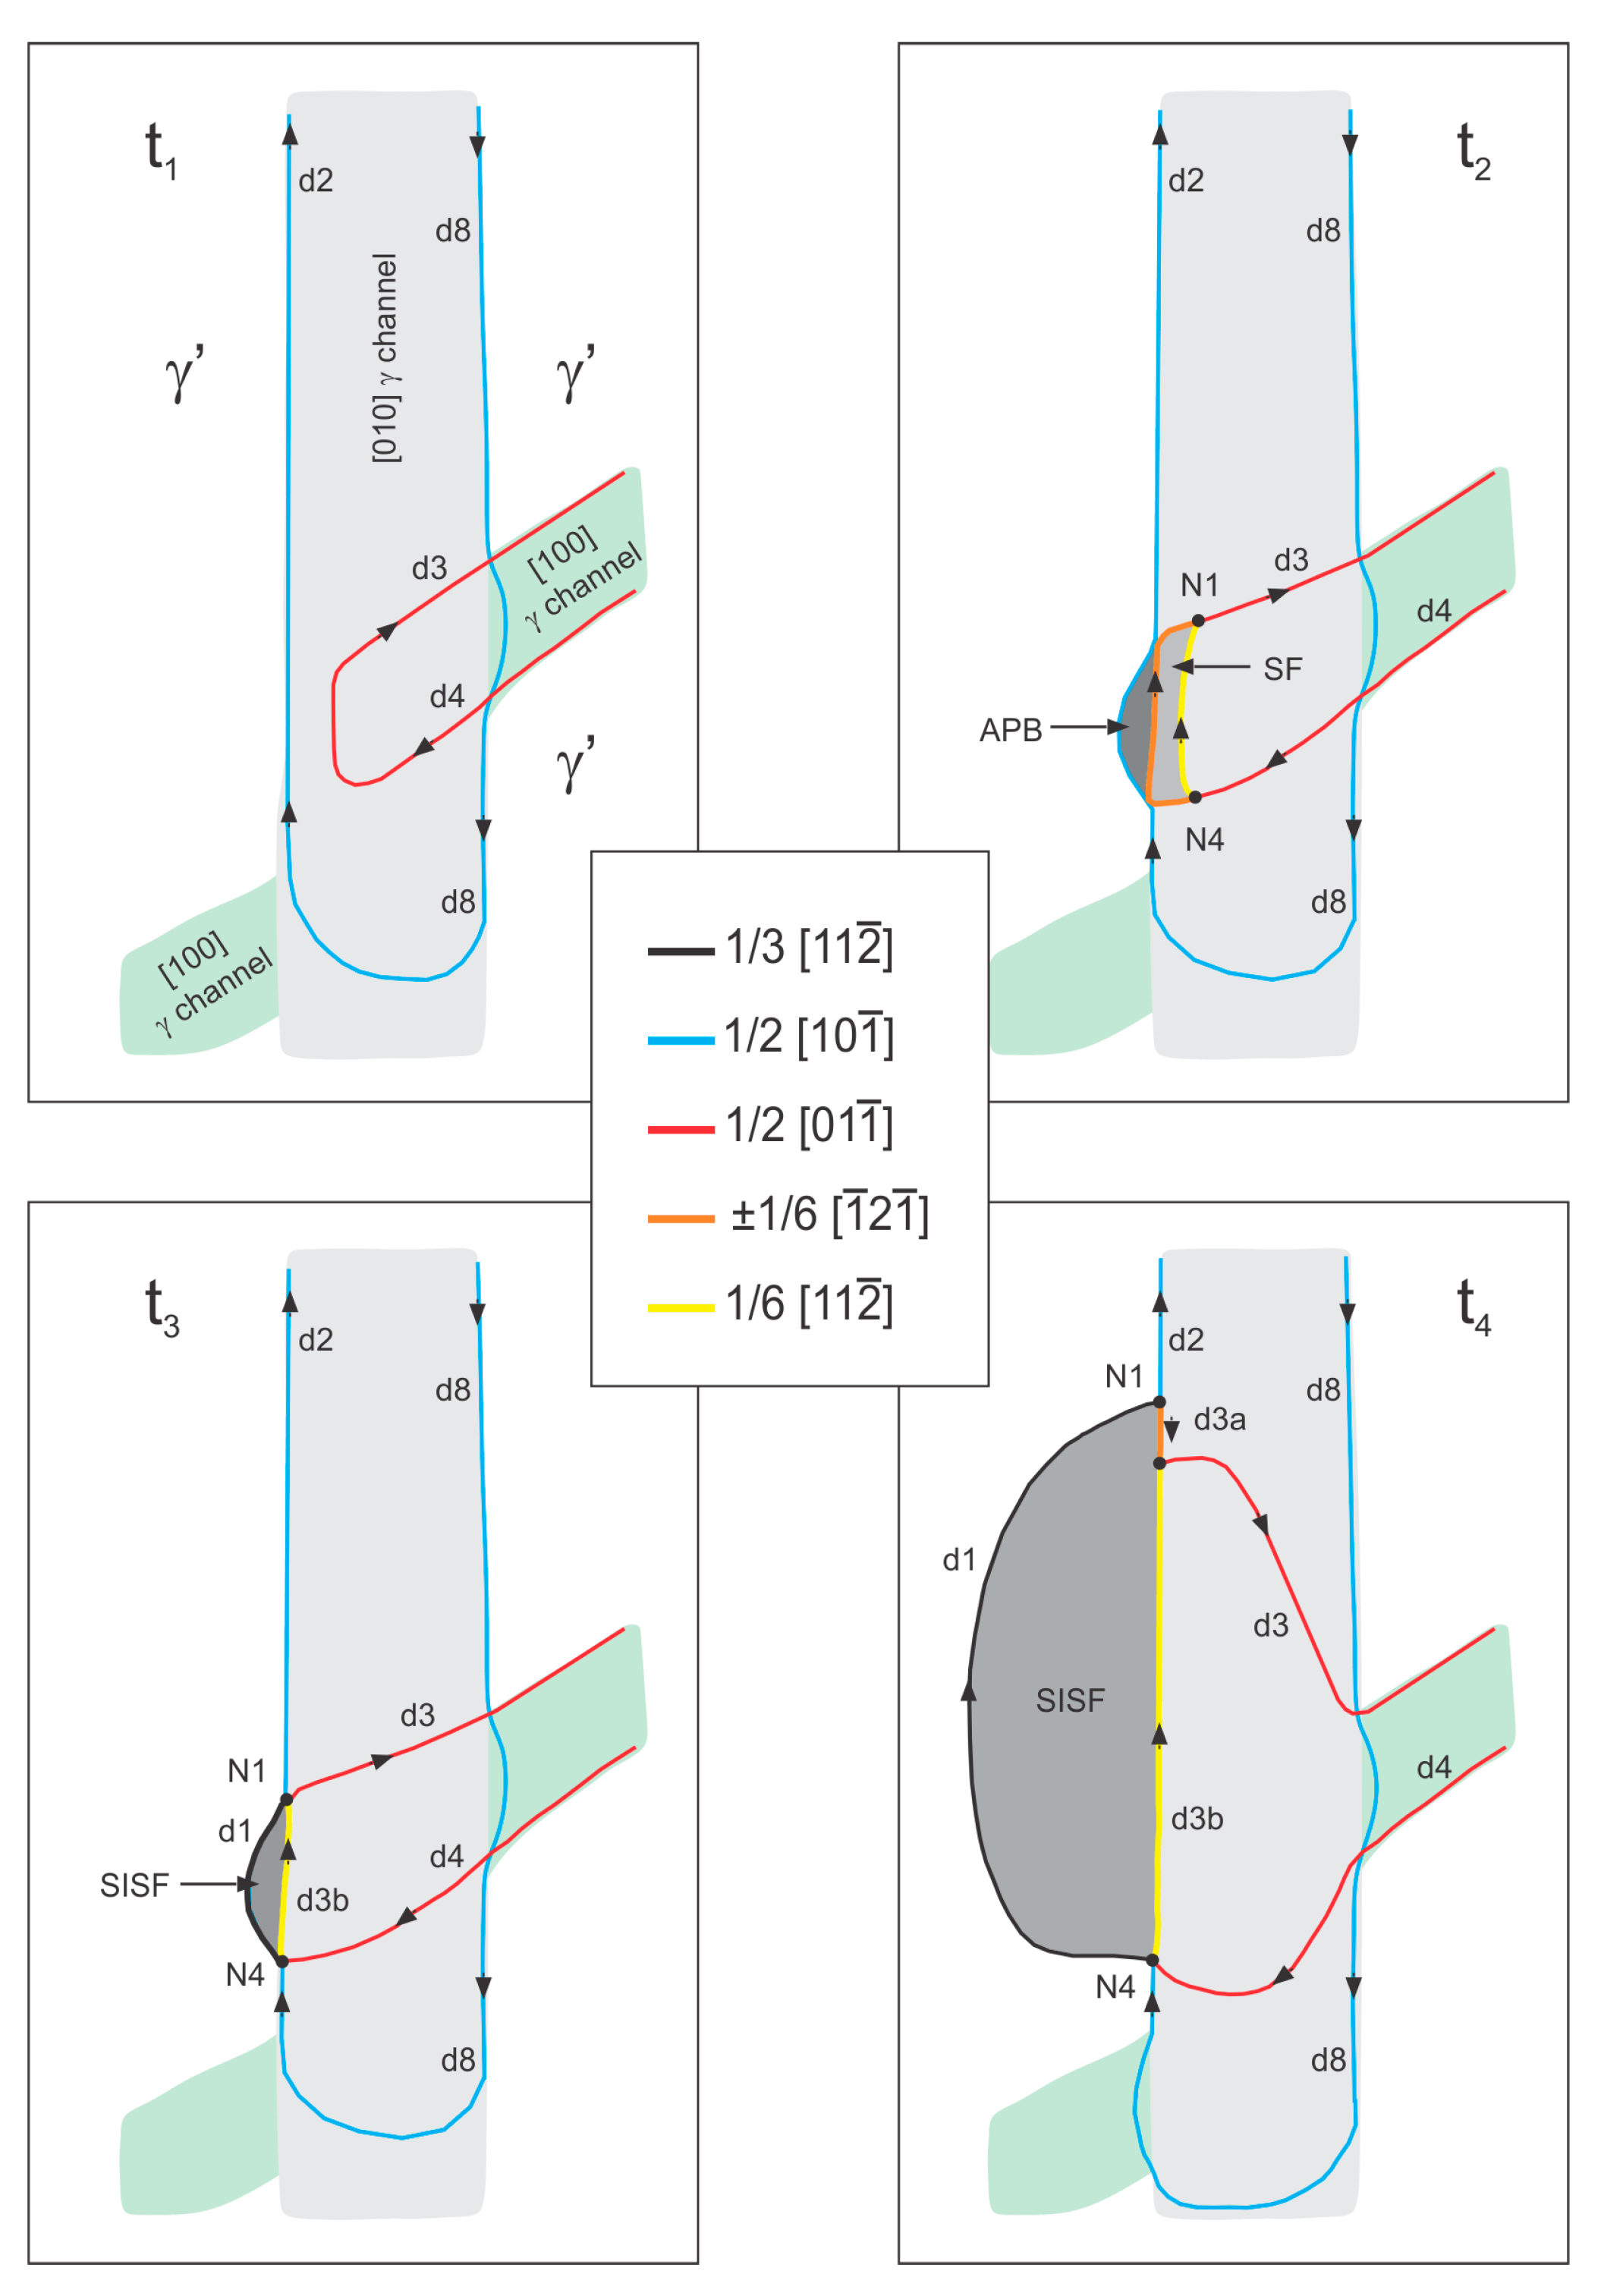
4.3. Analysis of a Local Dislocation Reaction

The results shown in Figure 6 and Figure 7 and Table 3 and Table 4 can be interpreted in terms of the mechanism, which was proposed by Wu et al. [11]. The simplified scenario in Figure 9 helps to understand how the cutting configuration of Figure 7 evolved during low-temperature and high-stress creep, as the creep exposure time increases from t1 to t4. We keep in mind that Figure 7b and Figure 9 show [111] projections of the γ/γ’-microstructure ([111] pointing into the image planes). The microstructure shown in Figure 9 is subjected to an external shear stress acting in the (111) plane in the [ 11 2 ¯ ] direction.
At t1, in the upper left scenario of Figure 9, the blue dislocation loop with a Burgers vector of [ 10 1 ¯ ] (dislocation family 1, glide plane: (111)) has expanded from the top to the bottom of the vertical grey γ-channel (channel directions given in Figure 9). From the right side, the red loop (Burgers vector: a/2 [ 01 1 ¯ ] , dislocation family 2, glide plane (111)) has arrived emerging from the green [100] channel. Our stereo TEM method [19] revealed that at the channel crossing the blue and red dislocation lines are not in the same (111) plane, the red dislocation being located slightly above the blue (not shown here).
At t2, the red dislocation segment d3 has moved by glide and climb. It has reached the γ’/γ-interface at the left side of the [010] γ-channel and has reached the same glide plane as the blue dislocation segment d2, which has locally entered the γ’-phase and created a thin APB ribbon. As suggested in the 2D DDD model of Wu et al. [11], the compact d3 segment dissociates into two Shockley partials. The leading Shockley partial is located at the γ/γ’-interface, while the trailing partial remains a short distance from the interface. The two Shockley partials are coupled by a stacking fault.
At t3, the leading Shockley partial has joined the blue dislocation segment resulting in the formation of the black dislocation segment d1. This fast reaction converts the high energy APB fault into a superlattice intrinsic stacking fault (SISF), while the trailing partial closes up to the γ/γ’-interface. Dislocation segment d1 bows out in between the two black nodes N1 and N4 at the γ/γ’-interface. This represents the nucleation event of the first half of the cutting ribbon. Finally, at t4, the experimentally observed configuration has been established. Segment d1 has paved its way into the γ’-phase, while the upper node N1 is dragged upwards along the interface.
An effort was made to support this scenario by calculating the forces, which act on the dislocation segments. Using the methodology and input parameters outlined in [11], one can calculate Peach Köhler glide and climb forces (PKFg and PKFc), which act on the blue and red dislocations highlighted in Figure 9. These PKF were calculated for a local stress state, which accounts for the applied shear stress and the superimposed coherency stress fields [11]; the results are presented in Table 6 and Table 7. The calculations were performed for three types of γ-channels [100], [010], and [001] (present in the upper right corner of Figure 7a but not shown in Figure 7b and Figure 9). As can be seen in Table 6 and Table 7, the character of the interface dislocation segments and the Peach Köhler glide and climb forces depend on the type of channel. From the results presented in Table 6 and Table 7, one can conclude that the dislocations with Burgers vectors 1/2 [ 10 1 ¯ ] (like segments d2 and d8 in Figure 7) prefer [010] channels. Dislocations with Burgers vectors 1/2 [ 01 1 ¯ ] (like dislocation segment d4 in Figure 7), on the other hand, experience higher Peach Köhler glide forces in [100] channels. The results for the channel in which our reaction takes places is highlighted in grey in Table 6 and Table 7. They show that both dislocation families experience positive glide forces, which pushes them towards the γ/γ’-interfaces. Moreover, the red 60° dislocation also experiences a positive climb force, which enables climb down onto the common (111) glide plane. Thus, the forces acting on the dislocations highlighted in Figure 9 are in line with the suggested scenario.

4.4. Relation to Previous Work

The dislocation reaction (Equation (2)) has been considered by several authors throughout the last five decades, and the fact that it is crucial to form the first half of a dislocation ribbon, which can propagate to the γ/γ’-microstructure, is well appreciated (e.g., [4,5,6,8,9]). Early primary creep phenomena were recently related to the opening of a window of opportunity [6,8,10,11,31] (the Rae-window [10]), where, after an incubation period, good conditions for the onset of γ’-cutting are established. However, only recently the dislocation reactions, which lead to the nucleation of the first half of the dislocation ribbon which shears the γ/γ’-microstructure, have received full attention [11].
A 2D DDD model helped to rationalize the underlying processes. While isolated elements of the overall scenario were presented in the literature (e.g., ribbon formation and peculiar primary creep behavior [5], observation of two γ-channel dislocation families reacting [32,33,34]), no clear link between the macroscopic mechanical data from the low-temperature high-stress creep regime and the underlying elementary dislocation processes was established. While we see the same dislocation pair as Sass et al. [34] (one screw and one 60° dislocation reacting at a γ/γ’-interface), our calculation suggests that the 60° dislocation climbs while the screw dislocation is sessile. Our screw dislocation does not cross slip, as suggested by Sass et al. [34]. Moreover, Sass et al. [34] did not rationalize their scenario by providing the Peach Köhler forces, which drive their reaction. During [001] and [011] tensile testing, eight and four microscopic crystallographic slip systems are activated, respectively, which makes it difficult to clarify the impact of individual dislocation processes on macroscopic creep rates.
There are other complicating factors associated with standard 001 tensile creep testing, such as (i) tensile specimens not always being precisely oriented, (ii) other mechanisms of microstructural evolution like rafting interfering [35], and (iii) modelling efforts not being guided by experimentally observed dislocation scenarios in realistic microstructures (with γ/γ’-misfit) [35,36]. The direct shear loading performed in the present work helps to overcome most of these issues. In the present study, it could be clearly shown that when only one microscopic crystallographic slip system is activated, ribbon formation is hampered, and strain rates keep decreasing. In contrast, when just the two dislocation families required for the formation of the first half of a shearing dislocation ribbon (Equation (2)) are activated, cutting starts and has the accelerating effect on creep rates described in this work. Evidence for these two different types of microstructural evolution are presented in the overview STEM micrographs shown in Figure 4 and Figure 5. Most importantly, a local dislocation scenario was analyzed after 1% shear creep deformation of the macroscopic crystallographic shear system [ 11 2 ¯ ] ( 111 ) , which rationalizes the macroscopic behavior and provides experimental proof for the 2D DDD model presented by Wu et al. [11]. In agreement with what was recently reported, we detected creep anisotropy [37]. However, it is important to keep in mind that microscopic 112 { 111 } slip systems depend on the continuous operation of 110 { 111 } slip systems in the γ-channels.

5. Conclusions

The present work provides direct experimental evidence for the importance of γ-channel dislocation reactions which govern low-temperature (T = 750 °C) and high-stress (resolved shear stress: 300 MPa) creep of Ni-base single crystal superalloys (SX). Two dislocation families with different Burgers vectors must react to form the first half of a dislocation ribbon, which can shear the γ’-phase. For the first time, the present work provides direct mechanical and microstructural proof, which documents the importance of this reaction. From the results obtained in the present work, the following conclusions can be drawn:
(1) Shear creep experiments can help to identify specific dislocation reactions, which are more difficult to study using standard 001 -tensile creep testing. They allow for the direct activation of specific microscopic crystallographic slip systems, which facilitates micromechanical analysis. Shear experiments also provide easier access to TEM foils, which are parallel to the activated glide planes and contain long dislocation segments. This facilitates defect analysis in the TEM.
(2) The macroscopic crystallographic shear system [ 11 2 ¯ ] ( 111 ) creeps significantly faster than the macroscopic crystallographic shear system [ 01 1 ¯ ] ( 111 ) . This represents direct mechanical proof for the fact that the formation of the first half of a dislocation ribbon which cuts the γ’-phase is rate controlling. In contrast to the multiple slip conditions associated with 001 or 011 tensile loading, shear loading of the macroscopic crystallographic shear system [ 11 2 ¯ ] ( 111 ) allows for the specific activation of the two dislocation families, which are required for this reaction, with equally high Schmid factors of 0.81. The higher activation of only one of the two partners during macroscopic [ 01 1 ¯ ] ( 111 ) shear creep deformation cannot produce equally high creep rates.
(3) Overview TEM micrographs of the material states, which were interrupted after 1% strain, show that dislocation activity is confined to the γ-channels during [ 01 1 ¯ ] ( 111 ) shear creep deformation, where no planar faults are observed. In contrast, planar faults are frequently observed after 1% shear strain in specimens subjected to [ 11 2 ¯ ] ( 111 ) shear creep deformation. This is one element of microstructural proof required to explain the difference in creep rates in the two shear system systems.
(4) Another element of microstructural proof is provided using higher magnification STEM diffraction contrast analysis in combination with micromechanical DDD modelling. This allows for the detection of the two dislocation families, which are required to form the first half of a dislocation ribbon.
(5) The present work provides experimental proof for the scenario suggested in the 2D DDD model by Wu et al. [11] and thus fully rationalizes the peculiar creep behavior (incubation times, intermediate creep rate maxima) which have been reported for low-temperature and high-stress creep of single crystal superalloys.

Author Contributions

D.B. performed the experimental work as part of his Dr.-Ing. Thesis, A.D. brought in his expertise in TEM defect analysis and 2D micromechanical modelling, G.E. wrote the paper during his time at Tohoku University (host: K.Y.), and all authors contributed to the discussion. All authors have read and agreed to the published version of the manuscript.

Funding

This research was funded by the Deutsche Forschungsgemeinschaft (DFG) through the collaborative research center SFB/TR 103.

Acknowledgments

The authors acknowledge funding through projects A1 and A2 of the collaborative research center SFB/TR 103 on super alloy single crystals funded by the Deutsche Forschungsgemeinschaft (DFG). G.E. acknowledges funding by the Japanese Society for the Promotion of Science (JSPS). A.D. acknowledges financial support from MSMT through a project CEITEC 2020 no. LQ1601.

Conflicts of Interest

The authors declare no conflict of interest. The funders had no role in the design of the study; in the collection, analyses, or interpretation of data; in the writing of the manuscript, or in the decision to publish the results.

References

  1. Durand-Charre, M. The Microstructure of Superalloys; CRC Press: Boca Raton, FL, USA, 1997. [Google Scholar]
  2. Reed, R.C. The Superalloys: Fundamentals and Applications; Cambridge University Press: Cambridge, UK, 2006. [Google Scholar]
  3. Kear, B.H.; Leverant, G.R.; Oblak, J.M. An analysis of creep-induced intrinsic/extrinsic fault pairs in a precipitation hardened Nickel-base alloy. Trans. ASM 1969, 62, 639–650. [Google Scholar]
  4. Kear, B.H.; Oblak, J.M.; Giamei, A.F. Stacking faults in gamma prime (Ni3(Al,Ti) precipitation hardened Nickel-base alloys. Metall. Trans. 1970, 1, 2477–2486. [Google Scholar]
  5. Matan, N.; Cox, D.C.; Rist, M.A.; Rae, C.M.F.; Reed, R.C. Creep of CMSX-4 single crystals: Effect of misorientation and temperature. Acta Mater. 1999, 47, 1549–1563. [Google Scholar] [CrossRef]
  6. Rae, C.M.F.; Matan, N.; Reed, R.C. The role of stacking fault shear in the primary creep of [001]-oriented single crystal superalloys at 750 °C and 750 MPa. Mater. Sci. Eng. 2001, 300, 125–134. [Google Scholar] [CrossRef]
  7. Drew, G.L.; Reed, R.C.; Kakehi, K.; Rae, C.M.F. Single crystal superalloys: The transition from primary to secondary creep. In Superalloys 2004; Green, K.A., Ed.; TMS: Warrendale, PA, USA, 2004; pp. 127–136. [Google Scholar]
  8. Rae, C.M.F.; Reed, R.C. Primary creep in single crystal superalloys: Origins, mechanisms and effects. Acta Mater. 2007, 55, 1067–1081. [Google Scholar] [CrossRef]
  9. Rae, C.M.F.; Zhang, L. Primary creep in single crystal superalloys: Some comments on effects of composition and microstructure. Mater. Sci. Technol. 2009, 25, 228–235. [Google Scholar] [CrossRef]
  10. Wu, X.; Wollgramm, P.; Somsen, C.; Dlouhy, A.; Kostka, A.; Eggeler, G. Double minimum creep of single crystal Ni-base superalloys. Acta Mater. 2016, 112, 242–260. [Google Scholar] [CrossRef]
  11. Wu, X.; Dlouhy, A.; Eggeler, Y.M.; Spiecker, E.; Kostka, A.; Somsen, C.; Eggeler, G. On the nucleation of planar faults during low temperature and high stress creep of single crystal Ni-base superalloys. Acta Mater. 2018, 144, 624–655. [Google Scholar] [CrossRef]
  12. Eggeler, G.; Wieczorek, N.; Fox, F.; Berglund, S.; Bürger, D.; Dlouhy, A.; Wollgramm, P.; Neuking, K.; Schreuer, J.; Agudo Jácome, L.; et al. On shear testing of single crystal Ni-base superalloys. Metall. Mater. Trans. 2018, 49, 3951–3962. [Google Scholar] [CrossRef] [Green Version]
  13. Parsa, A.P.; Wollgramm, P.; Buck, H.; Somsen, C.; Kostka, A.; Povstugar, I.; Choi, P.P.; Raabe, D.; Dlouhy, A.; Müller, J.; et al. Advanced scale bridging microstructure analysis of single crystal Ni-base superalloys. Adv. Eng. Mater. 2015, 17, 216–230. [Google Scholar] [CrossRef]
  14. Yardley, V.; Povstugar, I.; Choi, P.P.; Raabe, D.; Parsa, A.B.; Kostka, A.; Somsen, C.; Dlouhy, A.; Neuking, K.; George, E.; et al. On phase equilibria and the appearance of nanoparticles in the microstructure of single crystal Ni-base superalloys. Adv. Eng. Mater. 2016, 18, 1556–1567. [Google Scholar] [CrossRef]
  15. Wollgramm, P.; Bürger, D.; Parsa, A.B.; Neuking, K.; Eggeler, G. The effect of stress, temperature and loading direction on creep behavior of Ni-base single crystal superalloy miniature tensile creep specimens. Mater. High Temp. 2016, 33, 346–360. [Google Scholar] [CrossRef]
  16. Agudo Jácome, L.; Göbenli, G.; Eggeler, G. Transmission electron microscopy study of the microstructural evolution during high-temperature and low stress shear creep deformation of the superalloy single crystal CMSX 4. J. Mater. Res. 2017, 32, 4492–4502. [Google Scholar] [CrossRef]
  17. Jácome, L.A.; Nörtershäuser, P.; Heyer, J.K.; Lahni, A.; Frenzel, J.; Dlouhy, A.; Somsen, C.; Eggeler, G. High-temperature and low-stress creep anisotropy of single-crystal superalloys. Acta Mater. 2013, 61, 2926–2943. [Google Scholar] [CrossRef]
  18. Jácome, L.A.; Nörtershäuser, P.; Somsen, C.; Dlouhy, A.; Eggeler, G. On the nature of γ′ phase cutting and its effect on high temperature and low stress creep anisotropy of Ni-base single crystal superalloys. Acta Mater. 2014, 69, 246–264. [Google Scholar] [CrossRef]
  19. Jácome, L.A.; Eggeler, G.; Dlouhy, A. Advanced scanning transmission stereo electron microscopy of structural and functional engineering materials. Ultramicroscopy 2012, 122, 48–59. [Google Scholar] [CrossRef]
  20. Ham, R.K. The determination of dislocation densities in thin films. Philos. Mag. 1961, 6, 1183–1184. [Google Scholar] [CrossRef]
  21. Dlouhy, A.; Pesicka, J. Estimate of foil thickness by stereo TEM microscopy. Chech. J. Phys. 1990, 40, 539–584. [Google Scholar]
  22. Eggeler, G.; Dlouhy, A. On the formation of <010> dislocations in the gamma prime phase of superalloy single crystals during high temperature and low stress creep. Acta Mater. 1997, 45, 4251–4262. [Google Scholar] [CrossRef]
  23. Probst Hein, M.; Dlouhy, A.; Eggeler, G. Interface dislocation in superalloy single crystals. Acta Mater. 1999, 47, 2497–2510. [Google Scholar] [CrossRef]
  24. Schmid, E.; Boas, W. Kristallplastizität; Springer Verlag: Berlin, Germany, 1935. [Google Scholar]
  25. Williams, R.O. Origin of strengthening of precipitation: Ordered particles. Acta Metall. 1957, 5, 241–244. [Google Scholar] [CrossRef]
  26. Gleiter, H.; Hornbogen, E. Aushärtung durch kohärente geordnete Teilchen. Acta Metall. 1965, 13, 576–578. [Google Scholar] [CrossRef]
  27. Gleiter, H.; Hornbogen, E. Theorie der Wechselwirkung von Versetzungen mit kohärenten geordneten Zonen I. Phys. Stat. Sol. 1965, 12, 235–250. [Google Scholar] [CrossRef]
  28. Gleiter, H.; Hornbogen, E. Theorie der Wechselwirkung von Versetzungen mit kohärenten geordneten Zonen II. Phys. Stat. Sol. 1965, 12, 251–264. [Google Scholar] [CrossRef]
  29. Tituts, M.; Moturra, A.; Viswanathan, G.B.; Suzuki, A.; Mills, M.J.; Pollock, T.M. High resolution energy dispersive mapping of planar defects in L12-containing Co-based superalloy. Acta Mater. 2015, 82, 423–437. [Google Scholar] [CrossRef]
  30. Titus, M.; Eggeler, Y.M.; Suzuki, M.; Pollock, T.M. Creep-induced planar defects in L12-containing Co- and CoNi-based superalloys. Acta Mater. 2015, 82, 530–539. [Google Scholar] [CrossRef]
  31. Pollock, T.M.; Field, R.D. Dislocations and high-temperature plastic deformation of superalloy single crystals. In Dislocations in Solids; Nabarro, F.R.N., Duesbery, M.S., Eds.; Elsevier: Amsterdam, The Netherlands, 2002; pp. 547–618. [Google Scholar]
  32. Feller-Kniepmeier, M.; Kuttner, T. [011] creep in a single crystal Ni-base superalloy at 1037 K. Acta Metall. Mater. 1994, 42, 3167–3174. [Google Scholar] [CrossRef]
  33. Sass, V.; Glatzel, U.; Feller-Kniepmeier, M. Anisotropic creep properties of the Ni-base superalloy CMSX-4. Acta Mater. 1996, 44, 1967–1977. [Google Scholar] [CrossRef]
  34. Sass, V.; Feller-Kniepmeier, M. Orientation dependence of dislocation structures and deformation mechanisms in creep deformed CMSX-4 single crystals. Mater. Sci. Eng. 1998, 245, 19–28. [Google Scholar] [CrossRef]
  35. Svoboda, J.; Lukas, P. Model of creep in <001>-oriented superalloy single crystals. Acta Mater. 1998, 46, 3421–3431. [Google Scholar] [CrossRef]
  36. Haghighat, S.M.H.; Eggeler, G.; Raabe, D. Effect of climb on dislocation mechanisms and creep rates in gamma prime strengthened superalloy single crystals: A discrete dislocation dynamics study. Acta Mater. 2013, 61, 3709–3723. [Google Scholar] [CrossRef]
  37. Li, Y.; Wang, L.; Zhang, G.; Zhang, J.; Lou, L. Creep anisotropy of a 3rd generation Ni-base single crystal super alloy at 850 °C. Mater. Sci. Eng. A 2019, 760, 26–36. [Google Scholar] [CrossRef]
Figure 1. Double shear creep specimen. (a) Specimen after manufacturing. (b) Schematic drawing showing specimen dimensions and the shear crystallography.
Crystals 10 00134 g001
Figure 2. Shear creep displacements in the macroscopic crystallographic shear system [ 01 1 ¯ ] ( 111 ) . (a) Creep curve presented as the logarithmic shear rate log( γ ˙ ) as a function of engineering shear γ. The experiment was interrupted at γ = 5% corresponding to a displacement of 100 µm. (b) and (c): Corresponding specimen after 5% shear creep deformation, and 100 µm shear displacement detected in the SEM.
Crystals 10 00134 g002
Figure 3. Direct comparison of the creep behavior of the two macroscopic shear systems [ 01 1 ¯ ] ( 111 ) and [ 11 2 ¯ ] ( 111 ) at 750 °C and 300 MPa. (a) Creep curves presented as shear strain γ vs. time t. (b) Creep data presented as log( γ ˙ ) vs. γ.
Crystals 10 00134 g003
Figure 4. Scanning transmission electron microscopy (STEM) micrographs showing dislocation microstructures, which formed during shear creep deformation at 750 °C and 300 MPa to 1% strain. (a) Macroscopic shear system [ 01 1 ¯ ] ( 111 ) . (b) Macroscopic shear system [ 11 2 ¯ ] ( 111 ) .
Crystals 10 00134 g004
Figure 5. STEM micrographs taken after 1% strain accumulated in the [ 01 1 ¯ ] ( 111 ) shear creep system at 750 °C and 300 MPa. (a) g7 = ( 1 ¯ 1 ¯ 1 ) : 1/2 [ 01 1 ¯ ] -type dislocations and stacking faults (SFs) in full contrast. (b) g2 = ( 1 1 ¯ 1 ¯ ) : 1/2 [ 01 1 ¯ ] -type dislocations out of contrast, SFs in contrast. (c) −g9 = ( 3 ¯ 11 ) : 1/2 [ 01 1 ¯ ] -type dislocations and SFs out of contrast.
Crystals 10 00134 g005
Figure 6. Nine STEM micrographs taken at different g-vectors of the cutting event marked with a white arrow in Figure 7b. (a) g2 = ( 1 1 ¯ 1 ¯ ) . (b) g6 = ( 1 ¯ 1 1 ¯ ) . (c) g8 = ( 1 ¯ 1 ¯ 1 ) . (d) g3 = ( 0 2 ¯ 2 ) . (e) g4 = ( 2 ¯ 20 ) . (f) g5 = ( 2 ¯ 02 ) . (g) g9 = ( 3 1 ¯ 1 ¯ ) . (h) g10 = ( 1 3 ¯ 1 ) . (i) g11 = ( 0 2 ¯ 0 ) .
Crystals 10 00134 g006
Figure 7. STEM results and schematic illustrations of dislocation reactions, which are involved in forming planar fault. (a) Experimental STEM image. (b) Identification of Burgers vectors and orientations of dislocation line segments (d1 to d8). Nodes N1 to N6 indicate locations where dislocation reactions have taken place.
Crystals 10 00134 g007
Figure 8. Evolution of dislocation densities during [ 01 1 ¯ ] ( 111 ) and [ 11 2 ¯ ] ( 111 ) shear creep testing at 750°C and 300 MPa (dislocation densities vs. shear strain γ). Dislocation densities from [001] tensile creep tests reported by Wu et al. [10] (dislocation densities vs. tensile strain ε). (a) Overall dislocation density. (b) γ-channel dislocation density. (c) Dislocation density in the γ′-phase.
Crystals 10 00134 g008
Figure 9. Simplified schematic drawings illustrating how the dislocation substructure shown in the STEM micrograph of Figure 7 has evolved. Creep exposure time increases from t1 (starting configuration) to t4 (final configuration). For details see text.
Crystals 10 00134 g009
Table 1. Chemical composition of ERBO/1 in weight-%.
ElementAlCoCrHfMoReTaTiWNi
weight-%5.59.7 6.40.10.62.96.51.06.4Bal.
Table 2. The operating diffraction vectors used in this work with the appropriate figure numbers for conditions shown in the last row. Note that in Figure 5c the condition minus g9 is used.
g-vectorg1g2g3g4g5g6g7g8g9g10g11
Type ( 1 1 ¯ 1 ¯ ) ( 1 1 ¯ 1 ¯ ) ( 0 2 ¯ 2 ) ( 2 ¯ 20 ) ( 2 ¯ 02 ) ( 1 ¯ 1 1 ¯ ) ( 1 ¯ 1 ¯ 1 ) ( 1 ¯ 1 ¯ 1 ) ( 3 1 ¯ 1 ¯ ) ( 1 3 ¯ 1 ) ( 0 2 ¯ 0 )
Fig. no.4b5b,6a6d6e6f6b4a, 5a6c, 7a5c, 6g6h6i
Table 3. Effective visibilities (+) and invisibilities (-) for g-vectors 2 to 6 from Table 2.
Dislocation g 2 :   ( 1 1 ¯ 1 ¯ ) g 3 : ( 0 2 ¯ 2 ) g 4 :   ( 2 ¯ 20 ) g 5 :   ( 2 ¯ 02 ) g 6 :   ( 1 ¯ 1 1 ¯ )
d1+2/3+−2res0+−2+2/3
d2+1+−1+−1+−20
d30+−2+1+−1+1
d3a−1/3+−1+1-0+2/3
d3b−1/3w−10+−11/3
d40+−2+1+−1+1
d5+1+1+−2+−1+−1
d5a1/3+1+−1-0+−2/3
d5b+2/30w−1+−1−1/3
d6+1+−1?−1+−20
d70+−2+1+−1+1
d8+1+−1w−1+−20
Table 4. Effective visibilities (+) and invisibilities (-) for g-vectors 8 to 11 from Table 2.
Dislocation g 8 :   ( 1 ¯ 1 ¯ 1 ) g 9 :   ( 3 1 ¯ 1 ¯ ) g 10 :   ( 1 3 ¯ 1 ) g 11 :   ( 0 2 ¯ 0 ) b/a
d1+−4/3+4/3+−4/3+−2/31/3 [ 11 2 ¯ ]
d2+−1+2001/2 [ 10 1 ¯ ]
d3+−1res0+−2+−11/2 [ 01 1 ¯ ]
d3a−1/3−2/3+−4/3+−2/31/6 [ 1 ¯ 2 1 ¯ ]
d3bw−2/3+2/3−2/3−1/31/6 [ 11 2 ¯ ]
d4+−1res0+−2+−11/2 [ 01 1 ¯ ]
d50+2?2+11/2 [ 1 1 ¯ 0 ]
d5a1/3?2/3?4/3+2/31/6 [ 1 2 ¯ 1 ]
d5b−1/3+4/3?2/3−1/31/6 [ 2 1 ¯ 1 ¯ ]
d6+−1+2001/2 [ 10 1 ¯ ]
d7+−1res0+−2+−11/2 [ 01 1 ¯ ]
d8+−1+2001/2 [ 10 1 ¯ ]
Table 5. Activation of twelve microscopic a/2 110 { 1 ¯ 11 } crystallographic slip systems during [001] tensile testing (T) and shear creep testing (S) in the two macroscopic crystallographic shear systems [ 01 1 ¯ ] ( 111 ) and [ 11 2 ¯ ] ( 111 ) .
SystemPlaneDirectionT: [001] S :   [ 01 1 ¯ ] ( 111 ) S :   [ 11 2 ¯ ] ( 111 )
1 ( 111 ) [ 1 ¯ 10 ] 00.50
2 ( 111 ) [ 10 1 ¯ ] −0.410.50.87
3 ( 111 ) [ 01 1 ¯ ] −0.4110.87
4 ( 1 ¯ 11 ) [ 110 ] 00.17−0.19
5 ( 1 ¯ 11 ) [ 1 ¯ 0 1 ¯ ] −0.410.170.48
6 ( 1 ¯ 11 ) [ 01 1 ¯ ] −0.410.330.29
7 ( 1 1 ¯ 1 ) [ 1 ¯ 1 ¯ 0 ] 00.500.19
8 ( 1 1 ¯ 1 ) [ 10 1 ¯ ] −0.410.170.29
9 ( 1 1 ¯ 1 ) [ 0 1 ¯ 1 ¯ ] −0.410.670.48
10 ( 11 1 ¯ ) [ 1 ¯ 10 ] 00.170
11 ( 11 1 ¯ ) [ 101 ] −0.410.500.67
12 ( 11 1 ¯ ) [ 011 ] −0.410.670.67
Table 6. Normalized Peach Köhler glide (PKFg) and climb forces (PKFc) for dislocation family 1 (blue dislocation in Figure 9, Burgers vector: 1/2 [ 10 1 ¯ ] ) in the three types of γ-channels.
ChannelLine DirectionDislocation TypePKFgPKFc
[100] [ 0 1 ¯ 1 ] 60°0.1900.217
[010] [ 10 1 ¯ ] screw0.6120.0
[001] [ 1 ¯ 10 ] 60°1.035−0.217
Table 7. Normalized Peach Köhler glide (PKFg) and climb forces (PKFc) for dislocation family 2 (red dislocation in Figure 9, Burgers vector: 1/2 [ 01 1 ¯ ] ) in the three types of γ-channels.
ChannelLine DirectionDislocation TypePKFgPKFc
[100] [ 0 1 ¯ 1 ] screw0.6120
[010] [ 10 1 ¯ ] 60°0.1900.217
[001] [ 1 ¯ 10 ] 60°1.035−0.217

