Article

Hardness-Depth Relationship with Temperature Effect for Single Crystals—A Theoretical Analysis

1
Department of Applied Physics, School of Physics and Electronics, Hunan University, Changsha 410082, China
2
State Key Laboratory for Turbulence and Complex System, Department of Mechanics and Engineering Science, College of Engineering, Peking University, Beijing 100871, China
3
Department of Mechanics, School of Civil Engineering, Central South University, Changsha 410075, China
*
Author to whom correspondence should be addressed.
Crystals 2020, 10(2), 112; https://doi.org/10.3390/cryst10020112
Submission received: 23 January 2020 / Revised: 7 February 2020 / Accepted: 11 February 2020 / Published: 13 February 2020
(This article belongs to the Special Issue Crystal Plasticity at Micro- and Nano-scale Dimensions)

Abstract

:
In this paper, a mechanistic model is developed to address the effect of temperature on the hardness-depth relationship of single crystals. Two fundamental hardening mechanisms are considered in the hardness model, including the temperature dependent lattice friction and network dislocation interaction. The rationality and accuracy of the developed model is verified by comparing with four different sets of experimental data, and a reasonable agreement is achieved. In addition, it is concluded that the moderated indentation size effect at elevated temperatures is ascribed to the accelerated expansion of the plasticity affected region that results in the decrease of the density of geometrically necessary dislocations.

Graphical Abstract

1. Introduction

With increasing requirements for the application of advanced structural materials under high temperature environments, it becomes necessary and vital to effectively characterize the thermal-related materials properties at elevated temperatures to ensure structural safety and device function [1]. However, for the materials with limited size and characteristic microstructures, for example, multilayer thin-films and ion-irradiated materials with defect damage, the direct application of traditional mechanical tests seems invalid, and the consideration of small-scale testing techniques becomes inevitable [2]. Among several promising candidates, the technique of nano-indentation has been well developed over the last decades, and taken as a valid method to characterize the localized materials properties at elevated temperatures due to the development of advanced high temperature indentation systems [2,3,4].
So far, plenty of experimental works have been performed in the field of high temperature nano-indentation [5,6,7,8,9,10], and some principal features observed in these experiments indicate that the well-known indentation size effect, that is, the increase of materials hardness with decreasing indentation depth, still exists even when the testing temperature T increases up to T m / 3 ( T m is the melting temperature) for most materials [11,12,13,14,15]. However, when compared with the test performed at room temperature, both the increasing rate of materials hardness and ultimate bulk hardness are noticed to get weakened at elevated temperatures [9,15]. For instance, Lee et al. [16] investigated the dependence of indentation size effect on T for [0 0 1] -oriented single crystalline Nb, W, Al and Au, and demonstrated that for all of them both the hardness at infinite indentation depth and intrinsical materials length scale are strong functions of T. Similar experimental phenomena [17] have also been observed in the indentation test of polycrystalline Co, Ni and Pt that the indentation size effect becomes moderated when T increases from room temperature to T m / 3 .
In order to interpret the fundamental mechanisms related to the above observed experimental results, several theoretical models have been developed in the past years [1,18,19,20,21]. Thereinto, the most widely applied model, was proposed by Nix and Gao [18], which indicates that the intrinsic length scale is ascribed to the formation of geometrically necessary dislocations (GNDs) within the plasticity affected region. Later, Durst et al. [19] modified the Nix-Gao model by redefining the volume of the plasticity affected region, and pointing out that its radius should scale linearly with the contact radius. In addition, the contribution of intrinsic lattice friction resistance was noticed to play a dominant role in determining the material’s hardness, especially for body-centered cubic (BCC) materials at low temperatures [20]. When further addressing the temperature effect on the fundamental deformation mechanisms, it is noted that increasing temperature can not only help enhance the dislocation mobility and expansion of the plasticity affected region [17], but also lead to the decrease of lattice friction at elevated temperatures for most crystalline materials [22]. However, most existing hardness models are proposed at room temperature, and the temperature effect on both microstructural evolution and lattice friction has not yet been systematically addressed [1,21].
In this work, we intend to propose a theoretical framework for the hardness-depth relationship with temperature effect for single crystals. In Section 2, a detailed derivation of the hardness model with temperature effect is presented. The dominant deformation mechanisms cover the dependence of lattice friction and network dislocation interaction on temperature. In Section 3, the experimental data of four single crystals (Cu, Al, CaF2 and W) with different crystalline structures is applied to verify the accuracy and rationality of the proposed model. Moreover, corresponding deformation mechanisms and microsturcutres evolutions are discussed. Finally, we close with a conclusion in Section 4.

2. Hardness-Depth Relationship with Temperature Effect

2.1. Model Development

Intrinsically speaking, plastic deformation of pure single-crystal materials is mainly determined by the mobile ability of dislocations when there exist sufficient initial dislocations. At low temperatures, the slipping of existing dislocations, especially for BCC metals, is dominated by short-range barriers like the Peierls potential. With the increase of T, long-range barriers induced by the network dislocation interaction become the dominant role in determining materials hardness [21,23]. Therefore, the temperature dependent critical resolved shear stress τ CRSS ( T ) , indicating the impediment of slipping dislocations, can be expressed as
τ CRSS ( T ) = τ n ( T ) + τ f ( T ) ,
where τ n ( T ) and τ f ( T ) , respectively, denote the dislocation hardening term and lattice friction. Therefore, τ n ( T ) is influenced by both materials properties and dislocation microstructures at a given temperature. For the latter, statistically stored dislocations (SSDs) and GNDs should be simultaneously addressed when performing nano-indentation on pure single crystals. Following the Taylor law, the general form of τ n ( T ) with temperature effect yields as
τ n ( T ) = b μ ( T ) α ( T ) [ ρ G ( T ) + ρ S ( T ) ] m ( T ) ,
where b denotes the magnitude of Burgers vector. μ ( T ) and α ( T ) are, respectively, the shear modulus and dislocation strength coefficient, which both decrease with the increase of T. m ( T ) is the hardening coefficient that is generally around 0.5 at room temperature but also decreases with increasing temperature [24]. Moreover, ρ S ( T ) and ρ G ( T ) denote the density of SSDs and GNDs, respectively. Following the theory of Nix and Gao [18], GNDs are considered to generate beneath the indenter tip in order to coordinate with the gradient plastic deformation, and be stored within the plasticity affected region which is assumed to be a hemisphere, as illustrated in Figure 1. Therefore, ρ G ( T ) can be deduced by dividing the length λ of GNDs by the volume V ( T ) of the plasticity affected region, that is,
ρ G ( T ) = λ V ( T ) = 3 2 b tan θ M 3 ( T ) 1 h ,
where λ = π h 2 / ( b tan θ ) and V ( T ) = 2 / 3 π R 3 ( T ) . Here, θ is the angle between the surface of the indenter and sample, and R ( T ) denotes the radius of the plasticity affected region that proportionally scales with the indentation depth h with a proportional coefficient M ( T ) , that is, R ( T ) = M ( T ) h . At elevated temperatures, both lattice friction and dislocation impediment strength get weakened, which dramatically facilitate the expansion of the plastic region, and lead to the increase of M ( T ) and R ( T ) with T [24], as presented in Figure 1. Moreover, ρ S ( T ) is expressed as
ρ S ( T ) = 3 2 b tan θ 1 h * ( T ) ,
where h * ( T ) represents a characteristic length that is connected to the bulk hardness [18]. According to Ashby’s definition [25], SSDs are formed and accumulated in pure crystals during straining. Therefore, with higher internal strain stored in the materials at higher temperatures, more dislocations will be formed within the crystal that result in the higher density of SSDs.
Concerning the lattice friction, it is well known that τ f ( T ) for most face-centered cubic (FCC) materials is negligible when compared with the dislocation hardening term, therefore, the contribution of τ f ( T ) is generally ignored when addressing the temperature effect on materials’ hardening [26,27,28]. Whereas, for BCC materials, the stress required to move a dislocation over the Peierls potential is a thermally activated event, and takes a dominate role in determining the materials strength at low temperatures [22,29,30]. Following the work of [22], the expression of τ f ( T ) for BCC metals follows as
τ f ( T ) = τ p 0 [ 1 k B T 2 H k ln ( γ ˙ p 0 ε ˙ ) ] ( T T 0 ) τ f 0 [ 1 k B T 2 H k ln ( γ ˙ p 0 ε ˙ ) ] 2 ( T > T 0 ) ,
where τ p 0 and τ f 0 are, respectively, the reference stress for the screw dislocations when T is below and above the critical temperature T 0 , which divides the deformation region into the elastic interaction and line tension regimes. k B indicates the Boltzmann constant and 2 H k is the formation enthalpy of the kink pair on a screw dislocation. γ ˙ p 0 and ε ˙ are the reference strain rate and loading strain rate, respectively.
By further considering the Mises flow rule [31] and Tabor’s factor [32], one can connect the temperature dependent hardness H ( T ) with τ CRSS ( T ) as
H ( T ) = 3 3 τ CRSS ( T ) = H f ( T ) + H n ( T ) ,
where H f ( T ) = 3 3 τ f ( T ) is the hardness component induced by lattice friction, and H n ( T ) denotes the dislocation hardening component deduced by submitting Eqsuations (3) and (4) into Equation (2), that is,
H n ( T ) = H 0 ( T ) [ 1 + h ¯ * ( T ) h ] m ( T )
where
H 0 ( T ) = 3 3 b μ ( T ) α ( T ) ρ S m ( T ) ( T ) ,
and
h ¯ * ( T ) = h * ( T ) / M 3 ( T ) with h * ( T ) = 3 [ 3 3 b μ ( T ) α ( T ) ] 1 m ( T ) 2 b tan θ H 0 1 m ( T ) ( T ) .
Further derivation of Equation (7) indicates that [ H n ( T ) / H 0 ( T ) ] 1 / m ( T ) scales linearly with 1 / h , and the slope h ¯ * ( T ) is determined by both the characteristic length h * ( T ) and proportional coefficient M ( T ) . On the one hand, it shows that ρ S ( T ) tends to increase with T, which results in the decrease of h * ( T ) at elevated temperatures [25]. On the other hand, as the impediment of slipping dislocations gets weakened at high temperatures, the expansion of the plasticity affected region becomes comparatively easy, which results in the increase of M ( T ) with T [11]. Therefore, h ¯ * ( T ) tends to decrease at high temperatures that results in the weakened indentation size effect at elevated temperatures. Furthermore, increasing temperature not only leads to the decrease of H 0 ( T ) and m ( T ) , but also weakens the lattice friction, thus, it becomes rational to experimentally observe that H ( T ) decreases with the increase of T for most crystalline materials [16,24,25].
One may also note that Equation (6) offers a general law characterizing the hardness-depth relationships of pure single crystals at various temperatures. When ignoring the temperature effect, Equation (6) can be degraded into the hardness model involving lattice friction effect at room temperature. Once the hardening contribution of lattice friction is further ignored, the model is ultimately reduced to the classical Nix-Gao model [18]. This simplification is reasonable and rational for materials with small lattice friction. Whereas, when the lattice friction is relatively comparable with the dislocation hardening term, the ignoring of the former will result in the overestimation of H 0 and ρ S .

2.2. Model Calibration

In order to parameterize the temperature dependent hardness H ( T ) as expressed in Equation (6), the main attention turns to the determination of H 0 ( T ) , h ¯ * ( T ) and m ( T ) for H n ( T ) , given the experimental data or theoretical expression for H f ( T ) is generally known for the concerned materials. In the following, the calibration process is briefly introduced, that is,
(1)
First, conduct nano-indentation tests for single crystals at different temperatures to obtain the hardness-depth relationships, that is, the H ˜ ( T ) h curves [33]. Hereafter, the symbol ∼ denotes the experimental data. It then follows from Equation (6) that the H ˜ n ( T ) h relationships are obtained by subtracting H ˜ ( T ) from H f ( T ) .
(2)
Then, transform the H ˜ n ( T ) h relationships into the H ˜ n 1 / m ( T ) ( T ) 1 / h curves. By adjusting parameter m ( T ) to approximately obtain a straight line with the determination coefficient r 2 0.95 . The slope and intercept with the vertical axis give H 0 1 / m ( T ) ( T ) h ¯ * ( T ) and H 0 1 / m ( T ) ( T ) , respectively. It then yields the value of H 0 ( T ) and h ¯ * ( T ) .
(3)
Next, combine Equations (6) and (7) with the fitted value of H 0 ( T ) , h ¯ * ( T ) and m ( T ) as well as the previously known expression of H f ( T ) , it finally gives the parameterized hardness model with temperature effect.
(4)
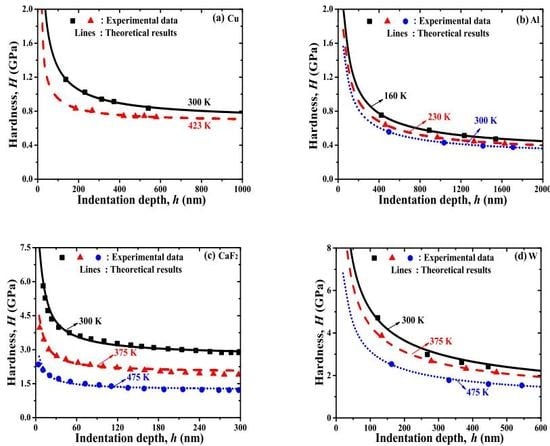
Finally, compare the fitted theoretical results with corresponding experimental data at different temperatures.

3. Experimental Verifications and Results

In this section, four sets of experimental data for single crystal Cu [24], Al [16], CaF2 [25] and W [16] are applied to verify the rationality and accuracy of the developed model. Before the calibration of model parameters, it should be noted that H f for Cu and Al is so small that is generally not considered [26,27]. For CaF2, H f is informed to be 1.2 GPa at room temperature [21], and vanishes to be zero around 473 K [34]. As to W, H f can be theoretically calculated by referring to Equation (5) with τ p 0 = 1038 MPa, τ f 0 = 2035 MPa, T 0 = 580 K, k B = 1.38 × 10 23 J/K, H k = 1.65 × 10 19 J, γ ˙ p 0 = 3.71 × 10 10 s 1 and ε ˙ = 0.02 s 1 [22,35]. Then, the experimental data can be plotted in the form as H ˜ n 1 / m 1 / h for the four materials, as illustrated in Figure 2. Following the calibration procedure as mentioned in Section 2.2, the model parameters are obtained, as listed in Table 1.
With these calibrated parameters, the H n 1 / m 1 / h relationships are compared between the theoretical results (lines) and experimental data (dots), and a reasonable agreement is achieved, as presented in Figure 2. It shows that both the intercept and slope of the fitting line decrease with increasing temperature, which mutually contribute to the decrease of H 0 and h ¯ * at elevated temperatures. The former is mainly ascribed to the weakened elastic constants and dislocation strength coefficient with the increase of temperature, and the latter originates from the stimulated expansion of the plasticity affected region at high temperatures that results in the decrease of the intrinsical length scale and limited indentation size effect. Moreover, the hardening coefficient m of Cu and CaF2 is noticed to decrease with increasing temperature when compared with that of Al and W. Similar experimental data has also been observed for OFHC copper that m decreases from 0.48 to 0.41 when T increases from 293 K to 698 K [36], which indicates the weakened work hardening behavior at elevated temperatures that resembles an elastic-ideally plastic material [24]. In order to further characterize the thermally activated deformation mechanisms resulting in the decrease of m with T, it could be addressed by the nano-indentation strain jump tests [10] or long term creep tests [37], especially in terms of the strain-rate sensitivity.
In Figure 3, we present the Hh relationships obtained from the calibrated theoretical model and experimental data of single crystal Cu [24], Al [16], CaF2 [25] and W [16]. As one can see the results match reasonably well for the four materials, and an obvious indentation size effect is informed at different temperatures. However, the increasing rate of H with the decrease of h tends to decrease with the increase of temperature, which is determined by the decrease of h ¯ * at elevated temperatures, as illustrated in Figure 2. In addition, the bulk hardness at the deep indentation depth also decreases with increasing temperature as both the hardness components H f ( T ) and H 0 ( T ) get weakened at high temperatures.
Based on the developed model, the effect of temperature on the evolution of different microstructures can be further analyzed, for example, the expansion of the plasticity affected region and evolution of dislocation density. Take W for an example, the temperature dependent shear modulus μ ( T ) and α ( T ) can be informed in previous works [35,38], and it is known that b = 0.274 nm and tan θ = 0.358 for the Berkovich nano-indentation of W [18,29], as summarized in Table 2. Therefore, according to Equation (9), one can calculate h * ( T ) and M ( T ) = h * ( T ) / h ¯ * ( T ) 3 at 160 K, 230 K and 300 K, respectively. Figure 4 illustrates the evolution of h * ( T ) and M ( T ) as a function of T for single crystal W, which indicates that h * ( T ) decreases while M ( T ) increases with T. The former is rational as ρ S ( T ) , determined by h * ( T ) as expressed in Equation (4), is considered to increase due to the high internal strain stored in the materials under high temperatures [25]. As a comparison, the latter is ascribed to the weakened impediment of slipping dislocations that the expansion of the plasticity affected region becomes comparatively easy at high temperatures [35].
Last but not the least, the evolution of ρ G ( T ) and ρ S ( T ) as a function of h at different temperatures is compared for single crystal W, as illustrated in Figure 5. According to Equation (3), ρ G ( T ) is determined by both M ( T ) and h. Thereinto, the inverse scaling law between ρ G ( T ) and h indicates the fundamental mechanism for the indentation size effect. Whereas, this scaling law tends to get weakened at high temperatures due to the increase of M ( T ) with T. As a comparison, ρ S ( T ) is independent with h but only increases with T. Moreover, one should note that ρ G ( T ) is generally more than one order of magnitude higher than ρ s ( T ) at the shallow indentation region, indicating the dominant dislocation hardening mechanism originates from the contribution of GNDs.

4. Conclusions

In this work, a mechanistic model is proposed for the hardness-depth relationships of single crystals with temperature effect. Fundamental hardening mechanisms, including the lattice friction and network dislocation interaction, are considered in the hardness model. Four sets of experimental data are applied to verify the rationality and accuracy of the proposed model, and a reasonable agreement is achieved. Moreover, it is realized that the moderated indentation size effect at elevated temperatures is ascribed to the accelerated expansion of the plasticity affected region, which results in the decrease of the density of GNDs.

Author Contributions

Conceptualization, H.L.; Writing—Original draft preparation, H.L.; Writing—Review and editing, L.Y. and X.X.; Project administration, X.X.; Funding acquisition, H.L. and X.X. All authors have read and agreed to the published version of the manuscript.

Funding

This work is supported by the National Nature Science foundation of China (NSFC) under Contract No. 11802344, 11872379 and 11805061, and Natural Science Foundation of Hunan Province, China (Grant No. 2019JJ50809 and 2019JJ50072). H.L. thanks the Fundamental Research Funds for the Central Universities.

Acknowledgments

The author acknowledges Terentyev for the useful discussion.

Conflicts of Interest

The authors declare no conflict of interest. The funders had no role in the design of the study; in the collection, analyses, or interpretation of data; in the writing of the manuscript, or in the decision to publish the results.

References

  1. Choi, I.C.; Brandl, C.; Schwaiger, R. Thermally activated dislocation plasticity in body-centered cubic chromium studied by high-temperature nanoindentation. Acta Mater. 2017, 140, 107–115. [Google Scholar] [CrossRef]
  2. Chavoshi, S.Z.; Xu, S. Temperature-dependent nanoindentation response of materials. MRS Commun. 2018, 8, 15–28. [Google Scholar] [CrossRef] [Green Version]
  3. Wheeler, J.M.; Armstrong, D.E.J.; Heinz, W.; Schwaiger, R. High temperature nanoindentation: The state of the art and future challenges. Curr. Opin. Solid State Mater. Sci. 2015, 19, 354–366. [Google Scholar] [CrossRef] [Green Version]
  4. Duan, Z.C.; Hodge, A.M. High-temperature Nanoindentation: New Developments and Ongoing Challenges. Jom 2009, 61, 32–36. [Google Scholar] [CrossRef]
  5. Schuh, C.A.; Mason, J.K.; Lund, A.C. Quantitative insight into dislocation nucleation from high-temperature nanoindentation experiments. Nat. Mater. 2005, 4, 617–621. [Google Scholar] [CrossRef]
  6. Sawant, A.; Tin, S. High temperature nanoindentation of a Re-bearing single crystal Ni-base superalloy. Scr. Mater. 2008, 58, 275–278. [Google Scholar] [CrossRef]
  7. Harris, A.J.; Beake, B.D.; Armstrong, D.E.J.; Davies, M.I. Development of High Temperature Nanoindentation Methodology and its Application in the Nanoindentation of Polycrystalline Tungsten in Vacuum to 950 A degrees C. Exp. Mech. 2017, 57, 1115–1126. [Google Scholar] [CrossRef]
  8. Beake, B.D.; Harris, A.J.; Moghal, J.; Armstrong, D.E.J. Temperature dependence of strain rate sensitivity, indentation size effects and pile-up in polycrystalline tungsten from 25 to 950 degrees C. Mater. Des. 2018, 156, 278–286. [Google Scholar] [CrossRef]
  9. Zhang, Y.; Mohanty, D.P.; Seiler, P.; Siegmund, T.; Kruzic, J.J.; Tomar, V. High temperature indentation based property measurements of IN-617. Int. J. Plasticity 2017, 96, 264–281. [Google Scholar] [CrossRef]
  10. Maier, V.; Hohenwarter, A.; Pippan, R.; Kiener, D. Thermally activated deformation processes in body-centered cubic Cr-How microstructure influences strain-rate sensitivity. Scr. Mater. 2015, 106, 42–45. [Google Scholar] [CrossRef]
  11. Prasitthipayong, A.; Vachhani, S.J.; Tumey, S.J.; Minor, A.M.; Hosemann, R. Indentation size effect in unirradiated and ion-irradiated 800 H steel at high temperatures. Acta Mater. 2018, 144, 896–904. [Google Scholar] [CrossRef]
  12. Koch, S.; Abad, M.D.; Renhart, S.; Antrekowitsch, H.; Hosemann, P. A high temperature nanoindentation study of Al-Cu wrought alloy. Mater. Sci. Eng. Struct. Mater. Prop. Microstruct. Process. 2015, 644, 218–224. [Google Scholar] [CrossRef] [Green Version]
  13. Gibson, J.S.K.L.; Schroeders, S.; Zehnder, C.; Korte-Kerzel, S. On extracting mechanical properties from nanoindentation at temperatures up to 1000 degrees C. Extreme Mech. Lett. 2017, 17, 43–49. [Google Scholar] [CrossRef]
  14. Hangen, U.; Chen, C.L.; Richter, A. Mechanical Characterization of PM2000 Oxide-Dispersion-Strengthened Alloy by High Temperature Nanoindentation. Adv. Eng. Mater. 2015, 17, 1683–1690. [Google Scholar] [CrossRef]
  15. Javaid, F.; Johanns, K.E.; Patterson, E.A.; Durst, K. Temperature dependence of indentation size effect, dislocation pile-ups, and lattice friction in (001) strontium titanate. J. Am. Ceram. Soc. 2018, 101, 356–364. [Google Scholar] [CrossRef] [Green Version]
  16. Lee, S.W.; Meza, L.; Greer, J.R. Cryogenic nanoindentation size effect in 001 -oriented face-centered cubic and body-centered cubic single crystals. Appl. Phys. Lett. 2013, 103. [Google Scholar] [CrossRef] [Green Version]
  17. Maughan, M.R.; Leonard, A.A.; Stauffer, D.D.; Bahr, D.F. The effects of intrinsic properties and defect structures on the indentation size effect in metals. Philos. Mag. 2017, 97, 1902–1920. [Google Scholar] [CrossRef]
  18. Nix, W.D.; Gao, H. Indentation size effects in crystalline materials: A law for strain gradient plasticity. J. Mech. Phys. Solids 1998, 46, 411–425. [Google Scholar] [CrossRef]
  19. Karsten, D.; Bjom, B.; Mathias, G. Indentation size effect in metallic materials: Correcting for the size of the plastic zone. Scr. Mater. 2005, 52, 1093–1097. [Google Scholar]
  20. Qiu, X.; Huang, Y.; Nix, W.D.; Hwang, K.C.; Gao, H. Effect of intrinsic lattice resistance in strain gradient plasticity. Acta Mater. 2001, 49, 3949–3958. [Google Scholar] [CrossRef]
  21. Sadrabadi, P.; Durst, K.; Goeken, M. Study on the indentation size effect in CaF2: Dislocation structure and hardness. Acta Mater. 2009, 57, 1281–1289. [Google Scholar] [CrossRef]
  22. Lim, H.; Battaile, C.C.; Carroll, J.D.; Boyce, B.L.; Weinberger, C.R. A physically based model of temperature and strain rate dependent yield in BCC metals: Implementation into crystal plasticity. J. Mech. Phys. Solids 2015, 74, 80–96. [Google Scholar] [CrossRef] [Green Version]
  23. Durst, K.; Franke, O.; Bohner, A.; Goken, M. Indentation size effect in Ni-Fe solid solutions. Acta Mater. 2007, 55, 6825–6833. [Google Scholar] [CrossRef]
  24. Franke, O.; Trenkle, J.C.; Schuh, C.A. Temperature dependence of the indentation size effect. J. Mater. Res. 2010, 25, 1225–1229. [Google Scholar] [CrossRef]
  25. Chua, J.; Zhang, R.; Chaudhari, A.; Vachhani, S.J.; Kumar, A.S.; Tu, Q.; Wang, H. High-temperature nanoindentation size effect in fluorite material. Int. J. Mech. Sci. 2019, 159, 459–466. [Google Scholar] [CrossRef]
  26. Xiao, X.; Song, D.; Xue, J.; Chu, H.; Duan, H. A self-consistent plasticity theory for modeling the thermo-mechanical properties of irradiated FCC metallic polycrystals. J. Mech. Phys. Solids 2015, 78, 1–16. [Google Scholar] [CrossRef]
  27. Lu, C.; Deng, G.Y.; Tieu, A.K.; Su, L.H.; Zhu, H.T.; Liu, X.H. Crystal plasticity modeling of texture evolution and heterogeneity in equal channel angular pressing of aluminum single crystal. Acta Mater. 2011, 59, 3581–3592. [Google Scholar] [CrossRef]
  28. Kiner, D.; Hosemann, P.; Maloy, S.A.; Minor, A.M. In situ nanocompression testing of irradiated copper. Nat. Mater. 2011, 10, 608–613. [Google Scholar] [CrossRef] [Green Version]
  29. Terentyev, D.; Xiao, X.; Dubinko, A.; Bakaeva, A.; Duan, H. Dislocation-mediated strain hardening in tungsten: Thermo-mechanical plasticity theory and experimental validation. J. Mech. Phys. Solids 2015, 85, 1–15. [Google Scholar] [CrossRef]
  30. Brunner, D.; Glebovsky, V. The plastic properties of high-purity W single crystals. Mater. Lett. 2000, 42, 290–296. [Google Scholar] [CrossRef]
  31. Gurson, A.L. Continuum Theory of Ductile Rupture by Void Nucleation and Growth: Part I-Yield Criteria and Flow Rules for Porous Ductile Media. J. Eng. Mater. Technol. 1977, 99, 2–15. [Google Scholar] [CrossRef]
  32. David, T. A simple theory of static and dynamic hardness. Proc. R. Soc. A 1948, 192, 247–274. [Google Scholar] [CrossRef]
  33. Oliver, W.C.; Pharr, G.M. An improved technique for determining hardness and elastic modulus using load and displacement sensing indentation experiments. J. Mater. Res. 1992, 7, 1564–1583. [Google Scholar] [CrossRef]
  34. Mekala, S.R. Analysis of Creep Transients in Calcium Fluoride Single Crystals following Stress Changes. Ph.D. Thesis, Friedrich-Alexander-University Erlangen-Nurnberg, Erlangen and Nuremberg, Bavaria, Germany, 2006. [Google Scholar]
  35. Xiao, X.; Terentyev, D.; Ruiz, A.; Zinovev, A.; Bakaev, A.; Zhurkin, E.E. High temperature nano-indentation of tungsten: Modelling and experimental validation. Mater. Sci. Eng. Struct. Mater. Prop. Microstruct. Process. 2019, 743, 106–113. [Google Scholar] [CrossRef]
  36. Christodoulou, N.; Jonas, J.J. Work hardening and rate sensitivity material coefficients for OFHC Cu and 99.99% A1. Acta Metall. 1984, 32, 1655–1668. [Google Scholar] [CrossRef]
  37. Durst, K.; Maier, V. Dynamic nanoindentation testing for studying thermally activated processes from single to nanocrystalline metals. Curr. Opin. Solid State Mater. Sci. 2015, 19, 340–353. [Google Scholar] [CrossRef]
  38. Lowrie, R.; Gonas, A.M. Single-Crystal Elastic Properties of Tungsten from 24 to 1800 C. J. Appl. Phys. 1967, 38, 4505. [Google Scholar] [CrossRef]
Figure 1. (Color online) Schematic of the nano-indentation of single crystal materials at two different temperatures, that is, T 2 > T 1 . The plasticity affected region is assumed as a hemisphere with radius of R, and R ( T 2 ) > R ( T 1 ) .
Crystals 10 00112 g001
Figure 2. (Color online) Comparison of the H n 1 / m 1 / h relationships at various temperatures between theoretical results (lines) and experimental data (dots) for (a) Cu [24], (b) Al [16], (c) CaF2 [25] and (d) W [16].
Crystals 10 00112 g002
Figure 3. (Color online) Comparison of the Hh relationships at different temperatures between theoretical results (lines) and experimental data (dots) for (a) Cu [24], (b) Al [16], (c) CaF2 [25] and (d) W [16].
Crystals 10 00112 g003
Figure 4. (Color online) Evolution of M and h * as a function of T for single crystal W.
Crystals 10 00112 g004
Figure 5. (Color online) Comparison of the ρ G h and ρ S h relationships at various temperatures for single crystal W.
Crystals 10 00112 g005
Table 1. Parameter calibration of the proposed theoretical model for single crystal Cu [24], Al [16], CaF2 [25] and W [16].
Cu (N/A)Al ([001])CaF2 ([111])W ([001])
300 K423 K160 K230 K300 K300 K375 K475 K160 K230 K300 K
H f (GPa)0.000.000.000.000.001.200.600.003.052.582.18
m0.480.410.500.500.500.500.450.350.500.500.50
H 0 1 m (GPa 1 m )0.4740.3810.1010.0840.0722.3202.0701.7500.7500.7160.627
H 0 1 m h ¯ * (GPa 1 m ·nm)127.649.6198.5150.3118.3199.892.475.925031796915
r 2 0.990.950.990.990.990.990.970.960.980.990.99
H 0 (GPa)0.6990.6730.3180.2900.2681.5231.3901.2200.8660.8460.792
h ¯ * (nm)268130196517891643864543333725081459
Table 2. Material properties for single crystal W with temperature effect.
Parameterb (nm)μ (GPa)α
Value0.274 C 44 ( T ) [ C 11 ( T ) C 12 ( T ) ] / 2 α 0 k 0 T with α 0 = 0.38 and k 0 = 4 × 10 4 K 1
Ref.[29][38][35]
b: the magnitude of Burgers vector; μ : shear modulus; α : dislocation strength coefficient; C 11 , C 12 and C 44 : elastic constants; α 0 : dislocation strength coefficient when the temperature equals zero; k 0 : proportional coefficient; T: temperature.

