Article

Femtosecond Laser-Induced Self-Assembly of Ce3+-Doped YAG Nanocrystals

Graduate School of Engineering, Kyoto University, Kyotodaigaku-Katsura, Kyoto 615-8510, Japan
*
Author to whom correspondence should be addressed.
Crystals 2020, 10(12), 1142; https://doi.org/10.3390/cryst10121142
Submission received: 25 November 2020 / Revised: 4 December 2020 / Accepted: 14 December 2020 / Published: 16 December 2020
(This article belongs to the Special Issue Laser-Induced Crystallization)

Abstract

:
Direct three-dimensional laser writing of crystallization inside glass has been intensely studied as an attractive technique for fabricating photonic devices. In particular, polarization-dependent periodic nanostructures composed of the partial crystallization in glass can be self-assembled through focused irradiation of femtosecond pulses. Here, we report on the Y3Al5O12 (YAG) crystal precipitation in nanoscale by femtosecond laser irradiation inside Al2O3-Y2O3 glass. Furthermore, we focus on the white emission by Ce: YAG in which a part of Y3+ site was replaced by Ce3+, the effect on photoluminescence (PL) characteristics by changing of ligand field induced by nanostructure formation was observed.

1. Introduction

Glass-ceramic is one of the key materials in the field of materials engineering due to its excellent physical properties and ease of formability derived from glass. For example, the partial crystallization of glass composed of a Li2O-SiO2 system including sensitizer has been practically used as a photosensitive machinable glass [1,2]. A photo thermo-refractive glass is also a well-studied glass-ceramic candidate for a phase hologram [3]. The polychromatic properties of such glass are caused by the photochemical precipitation of Ag nanoparticles and the subsequent anisotropic crystal-growth of NaF nano-crystals [4]. To realize the high functionality of such glass-ceramics, the process control of both nucleation and crystal growth are critical. Meanwhile, progress in high-power ultrashort pulse lasers [5] has opened new frontiers in physics and technology of light-matter interactions [6], leading to innovative discovery ranging from laser surgery [7], integrated and fiber optics [8,9], optical data storage [10], 3D nanostructuring [11], glass decomposition [12], spatial control of element distribution [13], and nanoparticle synthesis [14], to non-reciprocal photosensitivity [15]. In particular, space-selective patterning of crystals in glasses through laser irradiation is an extremely attractive approach. Recently the patterning of crystallization with a high orientation has been achieved by scanning laser-irradiated local regions [16]. By the optimal combination between the laser-induced temperature gradient, crystal growth rate, and laser writing speed and direction [17,18], it is possible to space-selectively grow a single crystal [19,20], and to design a spatial nucleation site and control the crystal growth direction [21,22]. Structural changes based on heat accumulation generated by femtosecond laser pulses having a faster pulse repetition rate than the timescale of thermal diffusion is generally isotropic according to the temperature distribution [23]. Recently, we observed the self-assembly of a periodic nanostructure, in which a partially crystallized domain was aligned in a plane perpendicular to the laser polarization direction [24]. Based on the observation of periodic nanostructures induced inside various materials, we have empirically classified such polarization-dependent periodic nanostructures as having one of the following three characteristics: (1) a structural deficiency including nanovoids [25], (2) a strained crystal structure [26], (3) a partial crystallization [27]. However, because conventional crystallization is promoted by cooling from molten state via symmetrical heat diffusion, it is difficult to control crystallization and orientation at the nanoscale. Cao et al. also reported that the oriented LiNbO3-like crystals were precipitated by the femtosecond laser irradiation in Li2O-Nb2O5-SiO2 glass, leading to an angular dependence of SHG being obtained with the probe laser polarization [28]. They have explained that the main force for the well-defined texture formation composed of the nanocrystals with their polar axis oriented perpendicular to the femtosecond laser polarization would be the effect of the laser polarization on the anisotropic induced dipole. Poumellec et al. also proposed a new interpretation based on a space-charge built from ponderomotive force and stored in the dielectric inducing an asymmetric stress field [29]. They deduced that the driving force of the nanostructure exists before and drives the phase separation in lithium niobium silicate glass, leading to a self-organized nanostructure made of LiNbO3 crystalline plates embedded in lamella-shaped frames of amorphous SiO2 [30]. As LiNbO3 is an anisotropic and ferroelectric crystal, the electric dipole is generally not parallel to the electromagnetic field, except when the laser polarization direction is along the principle axis. Indeed, the relative permittivities of a LiNbO3 crystal with a negative uniaxial birefringence are ϵ 11 r = 83.3 , ϵ 33 r = 28.5 , respectively [31]. As a result, a non-zero torque forces the nanocrystal to rotate to the stable positions, where the polar axis is perpendicular to the writing laser polarization [32,33].
However, Dy3Al5O12 garnet nanocrystals were successfully self-assembled in the plane perpendicular to the writing laser polarization [27], despite the fact that the crystal structure of garnet group represented by yttrium aluminum garnet (Y3Al5O12 or YAG) is a typical isotropic cubic structure. Furthermore, the relative permittivity of Dy3Al5O12 was reported to be 2.67 [34], which is more than one digit smaller than that of LiNbO3. The formation mechanism of the bulk nanograting structure consisting of nanocrystals has still remained a mystery. Therefore, we focused on a precipitation of Ce-doped YAG nanocrystals in nanoscale by femtosecond laser irradiation inside Y2O3-Al2O3 glass with the stoichiometric composition of YAG. Here a change in the photoluminescence (PL) properties from the emission center in which a part of Y3+ site was replaced by Ce3+ before and after femtosecond laser irradiation was investigated.

2. Materials and Methods

Commercially available reagents of aluminum oxide and yttrium oxide were homogeneously mixed to the composition of 62.5Al2O3-37.5Y2O3 in alumina mortar, and pressed into pellets. The pellets were sintered for 12 h at 1100 °C in air. The calcined pellets were crushed and then used as a preform for an aerodynamic levitation with CO2 laser melting [35]. While being observed by a charge-coupled device (CCD) camera (KP-FD30, Hitachi Kokusai Electric, Tokyo, Japan), the calcined preforms of approximately 15 mg were levitated using a flow of dry air (N2: 79% O2: 21%) and melted through focusing of 100 W CO2 laser via a ZnSe lens (f = 254 mm). To ensure the melting was homogeneous, the measured temperature by a radiation thermometer was maintained above the melting point for tens of seconds. After that, the melt was rapidly cooled by turning off the laser power, and a transparent spherical sample was obtained. Any bubbles that appeared on the samples obtained were melted again and eliminated, as these would otherwise interrupt laser propagation. Since the weight loss of a spherical sample before and after the CO2 laser melting was less than 0.1%, no apparent compositional variation was considered to have been generated. The glass phase of the as-prepared samples was verified by Cu Ka X-ray diffraction (XRD, SmartLab, Rigaku, Tokyo, Japan). The glass-transition (Tg) and crystallization (Tx) temperatures for the as-prepared glass samples were determined by measurements using thermogravimetry and a differential thermal analyzer (TG-DTA, Thermoplus TG8120, Rigaku, Tokyo, Japan) at a heating rate of 10 °C/min. For reference, the prepared spherical glass sample was crystallized at crystallization temperature for 30 min. To discuss the luminescence properties, we also fabricated Ce-doped YAG glass (Ce-YAG glass) composed of 62.5Al2O3-36.1Y2O3-1.4CeO2 by the same method. The excitation and emission spectra of the Ce-YAG glass samples before and after crystallization at 920 °C were also measured by spectrofluorometer (FluoroMax, Horiba-Jobin Yvon, Kyoto, Japan). The top and bottom parts of the spherical glass samples were polished in a parallel manner for later use in the femtosecond-laser irradiation experiments. Laser experiments were performed using a mode-locked regeneratively amplified Ti: sapphire laser system (RegA 9000, Coherent, Santa Clara, CA, USA) operating at 800 nm. The pulse duration was tuned ranging from 50 fs to 1 ps. The laser pulses were focused at 60 µm below the sample surface using a microscope objective lens (LU Plan Fluor, 50 × 0.80 N.A., Nikon, Tokyo, Japan). The laser energy was controlled by a variable neutral density filter (typically 0.5~3.0 µJ). To change the amount of accumulated heat, the pulse repetition rate was also modulated from 10 to 250 kHz. The focus spot was scanned in the plane perpendicular the laser propagation direction at 10 µm/s by moving the glass sample by the XYZ translation stage. Simultaneously, an irradiated spot was observed using a CCD camera (CSDW2M60CM28, Toshiba-Teli, Tokyo, Japan). After laser irradiation, the modified regions in the glass samples were inspected using confocal fluorescence microscope (exciting laser wavelength: 532 nm). The structural changes in the glass were analyzed by a confocal Raman spectrometer excited by a diode-pumped solid-state (DPSS) laser with a wavelength of 532 nm (Nano Finder 30, Tokyo Instruments, Tokyo, Japan). After polishing the sample to the depth of the beam waist location, the polished sample surface was also inspected using a field-emission scanning electron microscope (FE-SEM) (JSM-7100F, JEOL, Tokyo, Japan) equipped with a cathodoluminescence (CL) spectrometer (iHR-320, Horiba, Kyoto, Japan).

3. Results

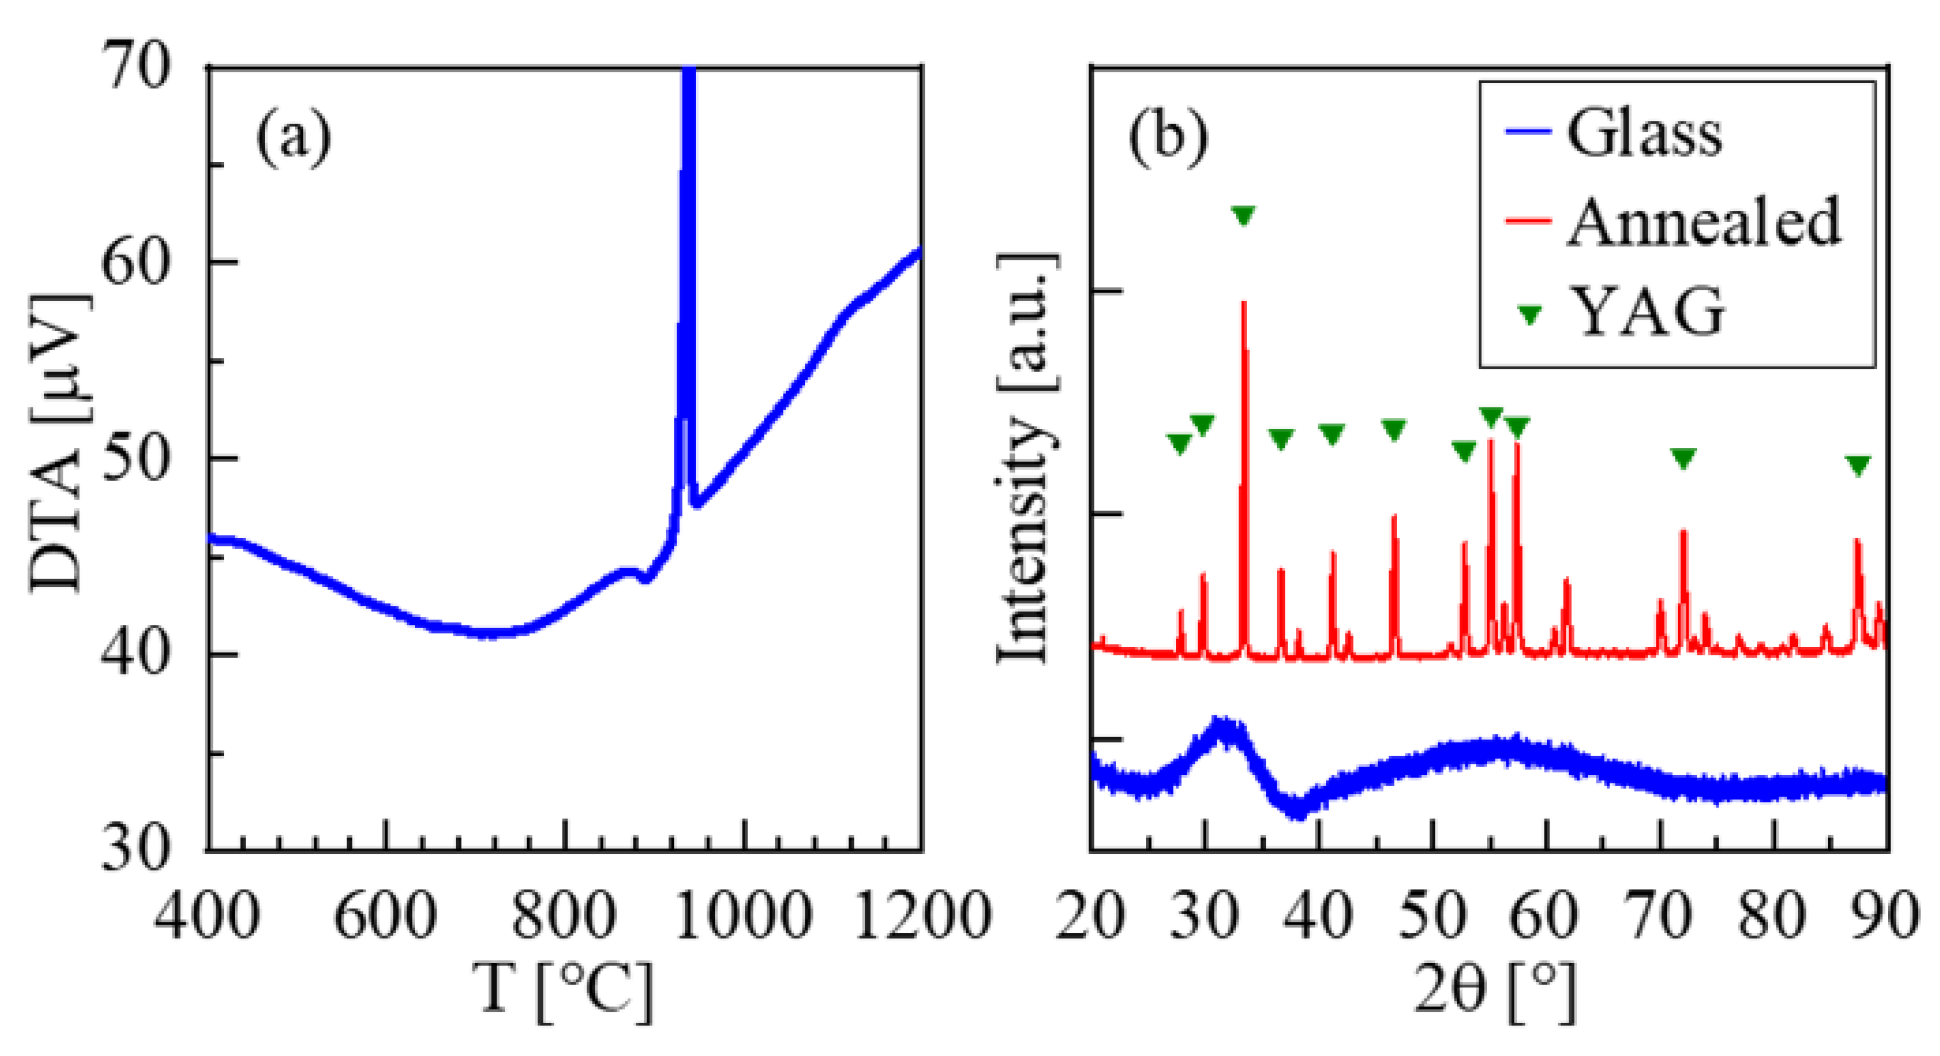
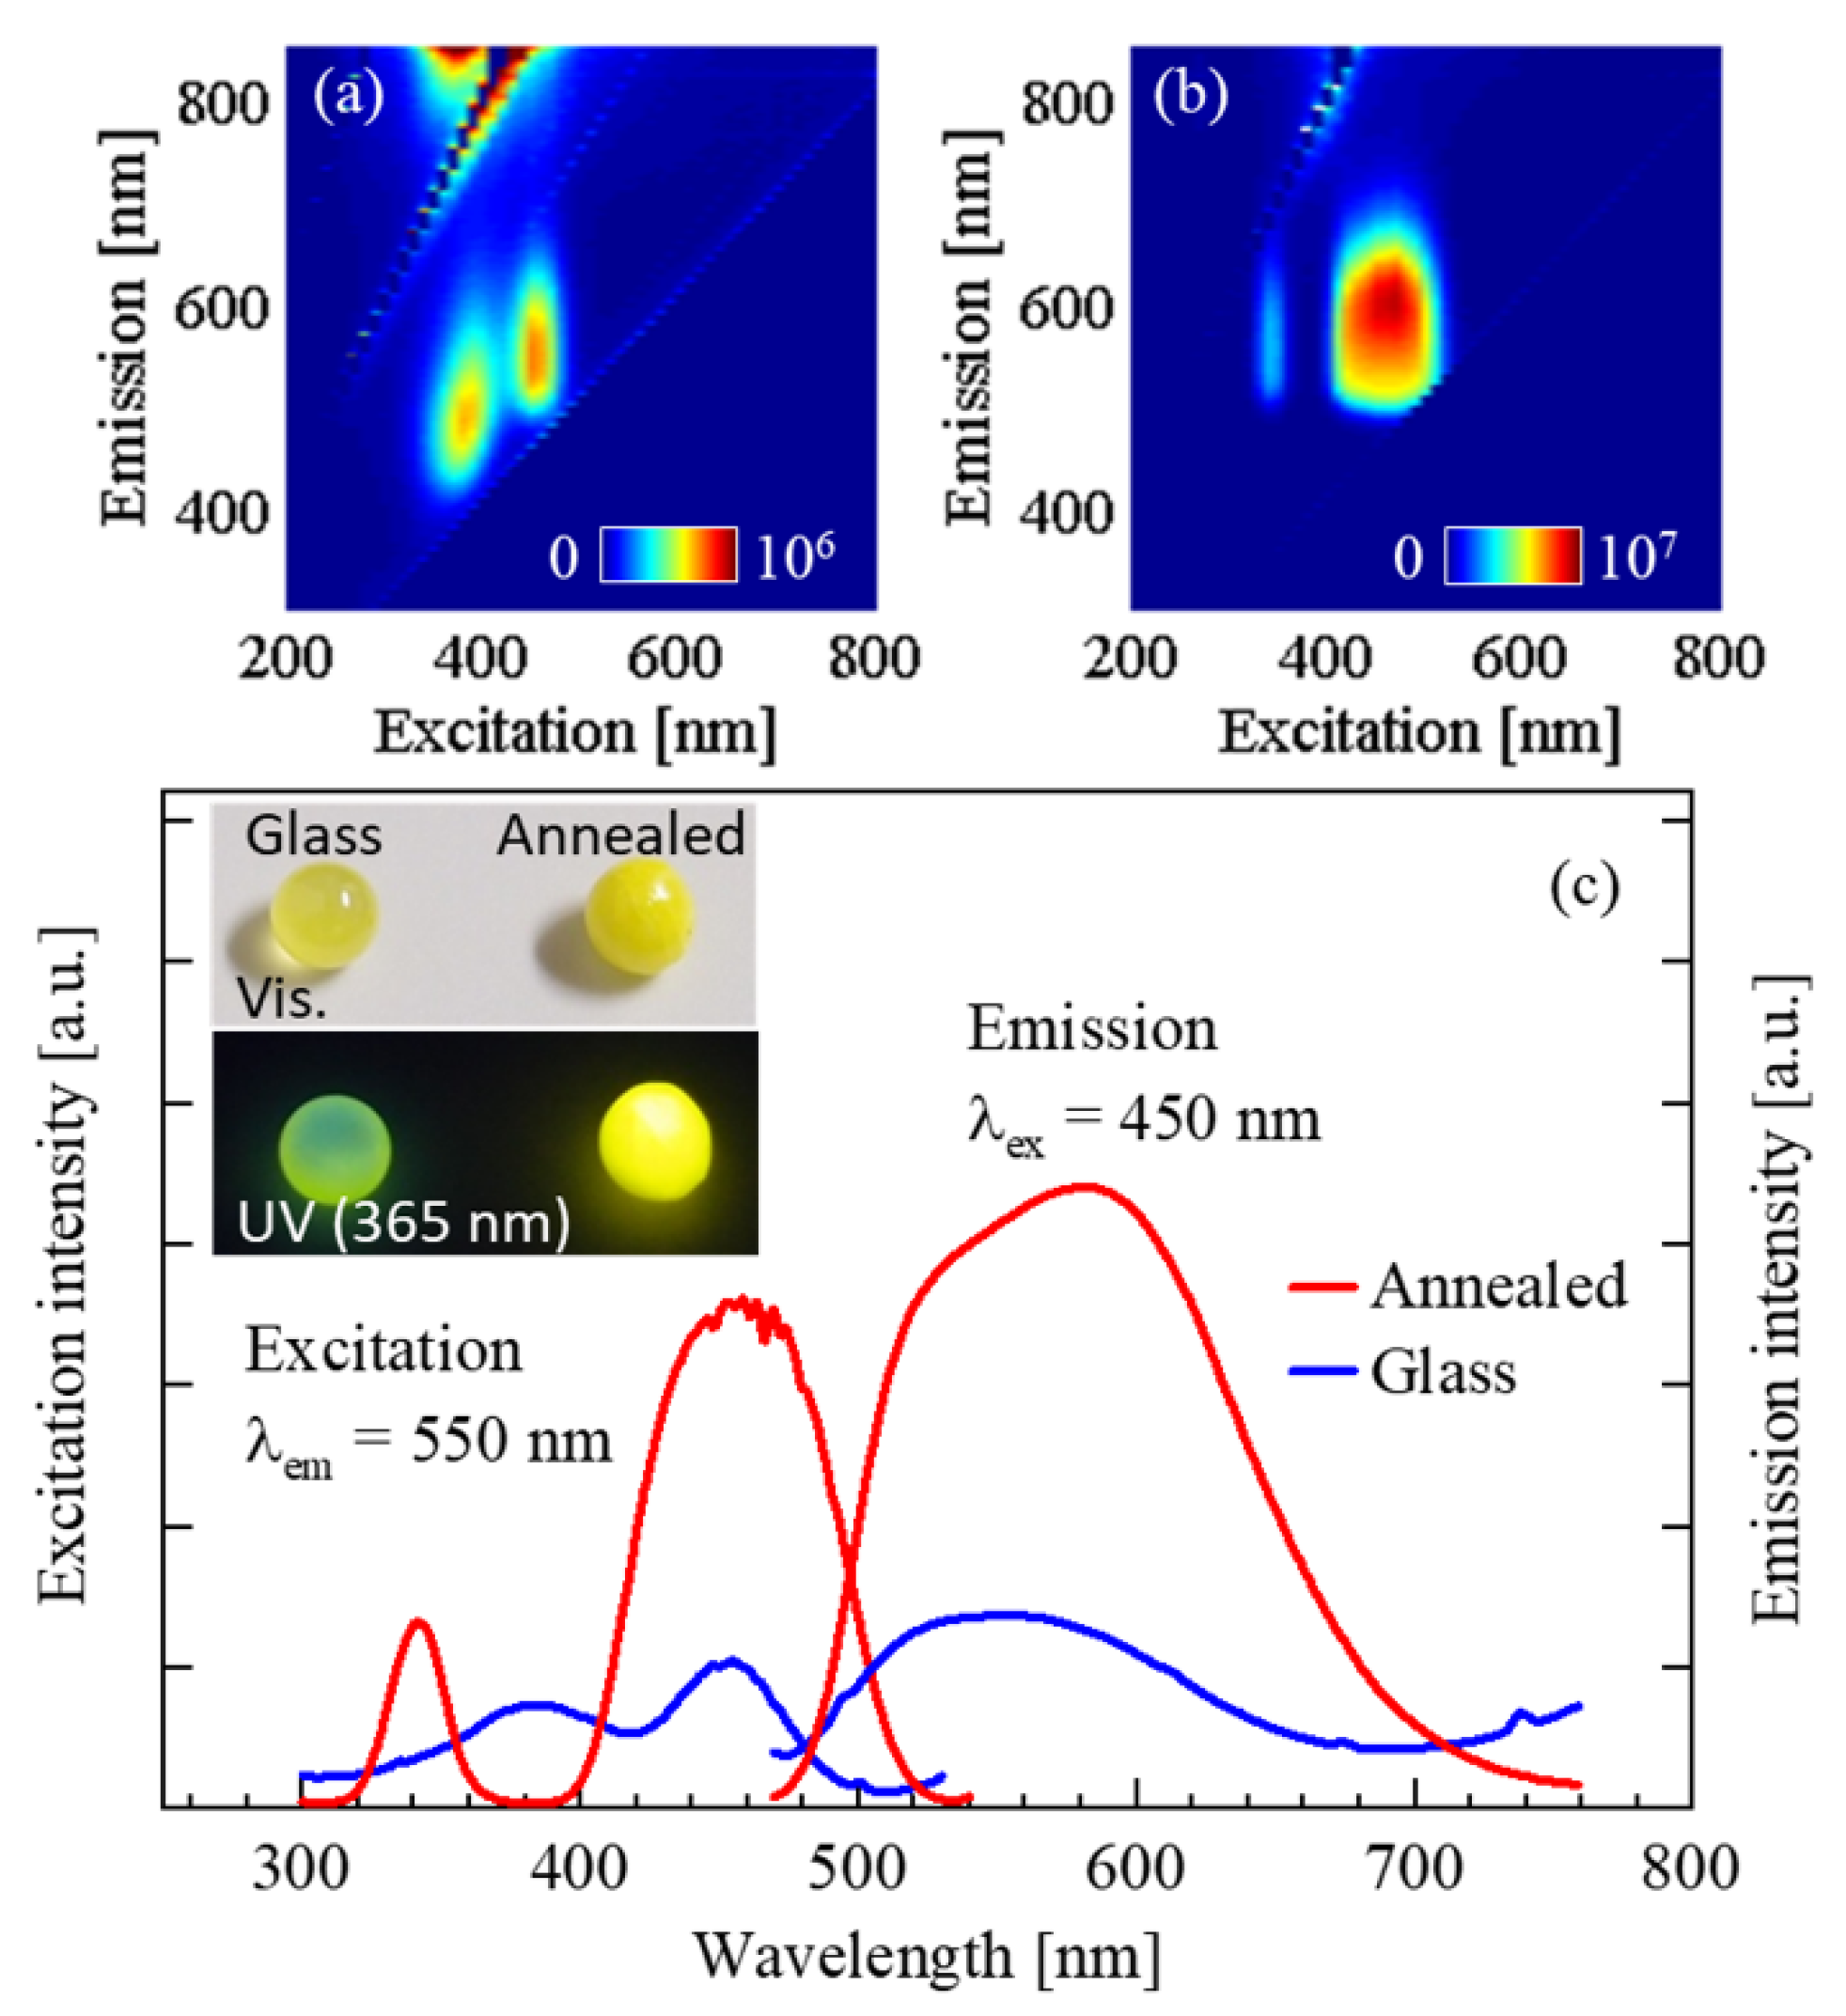
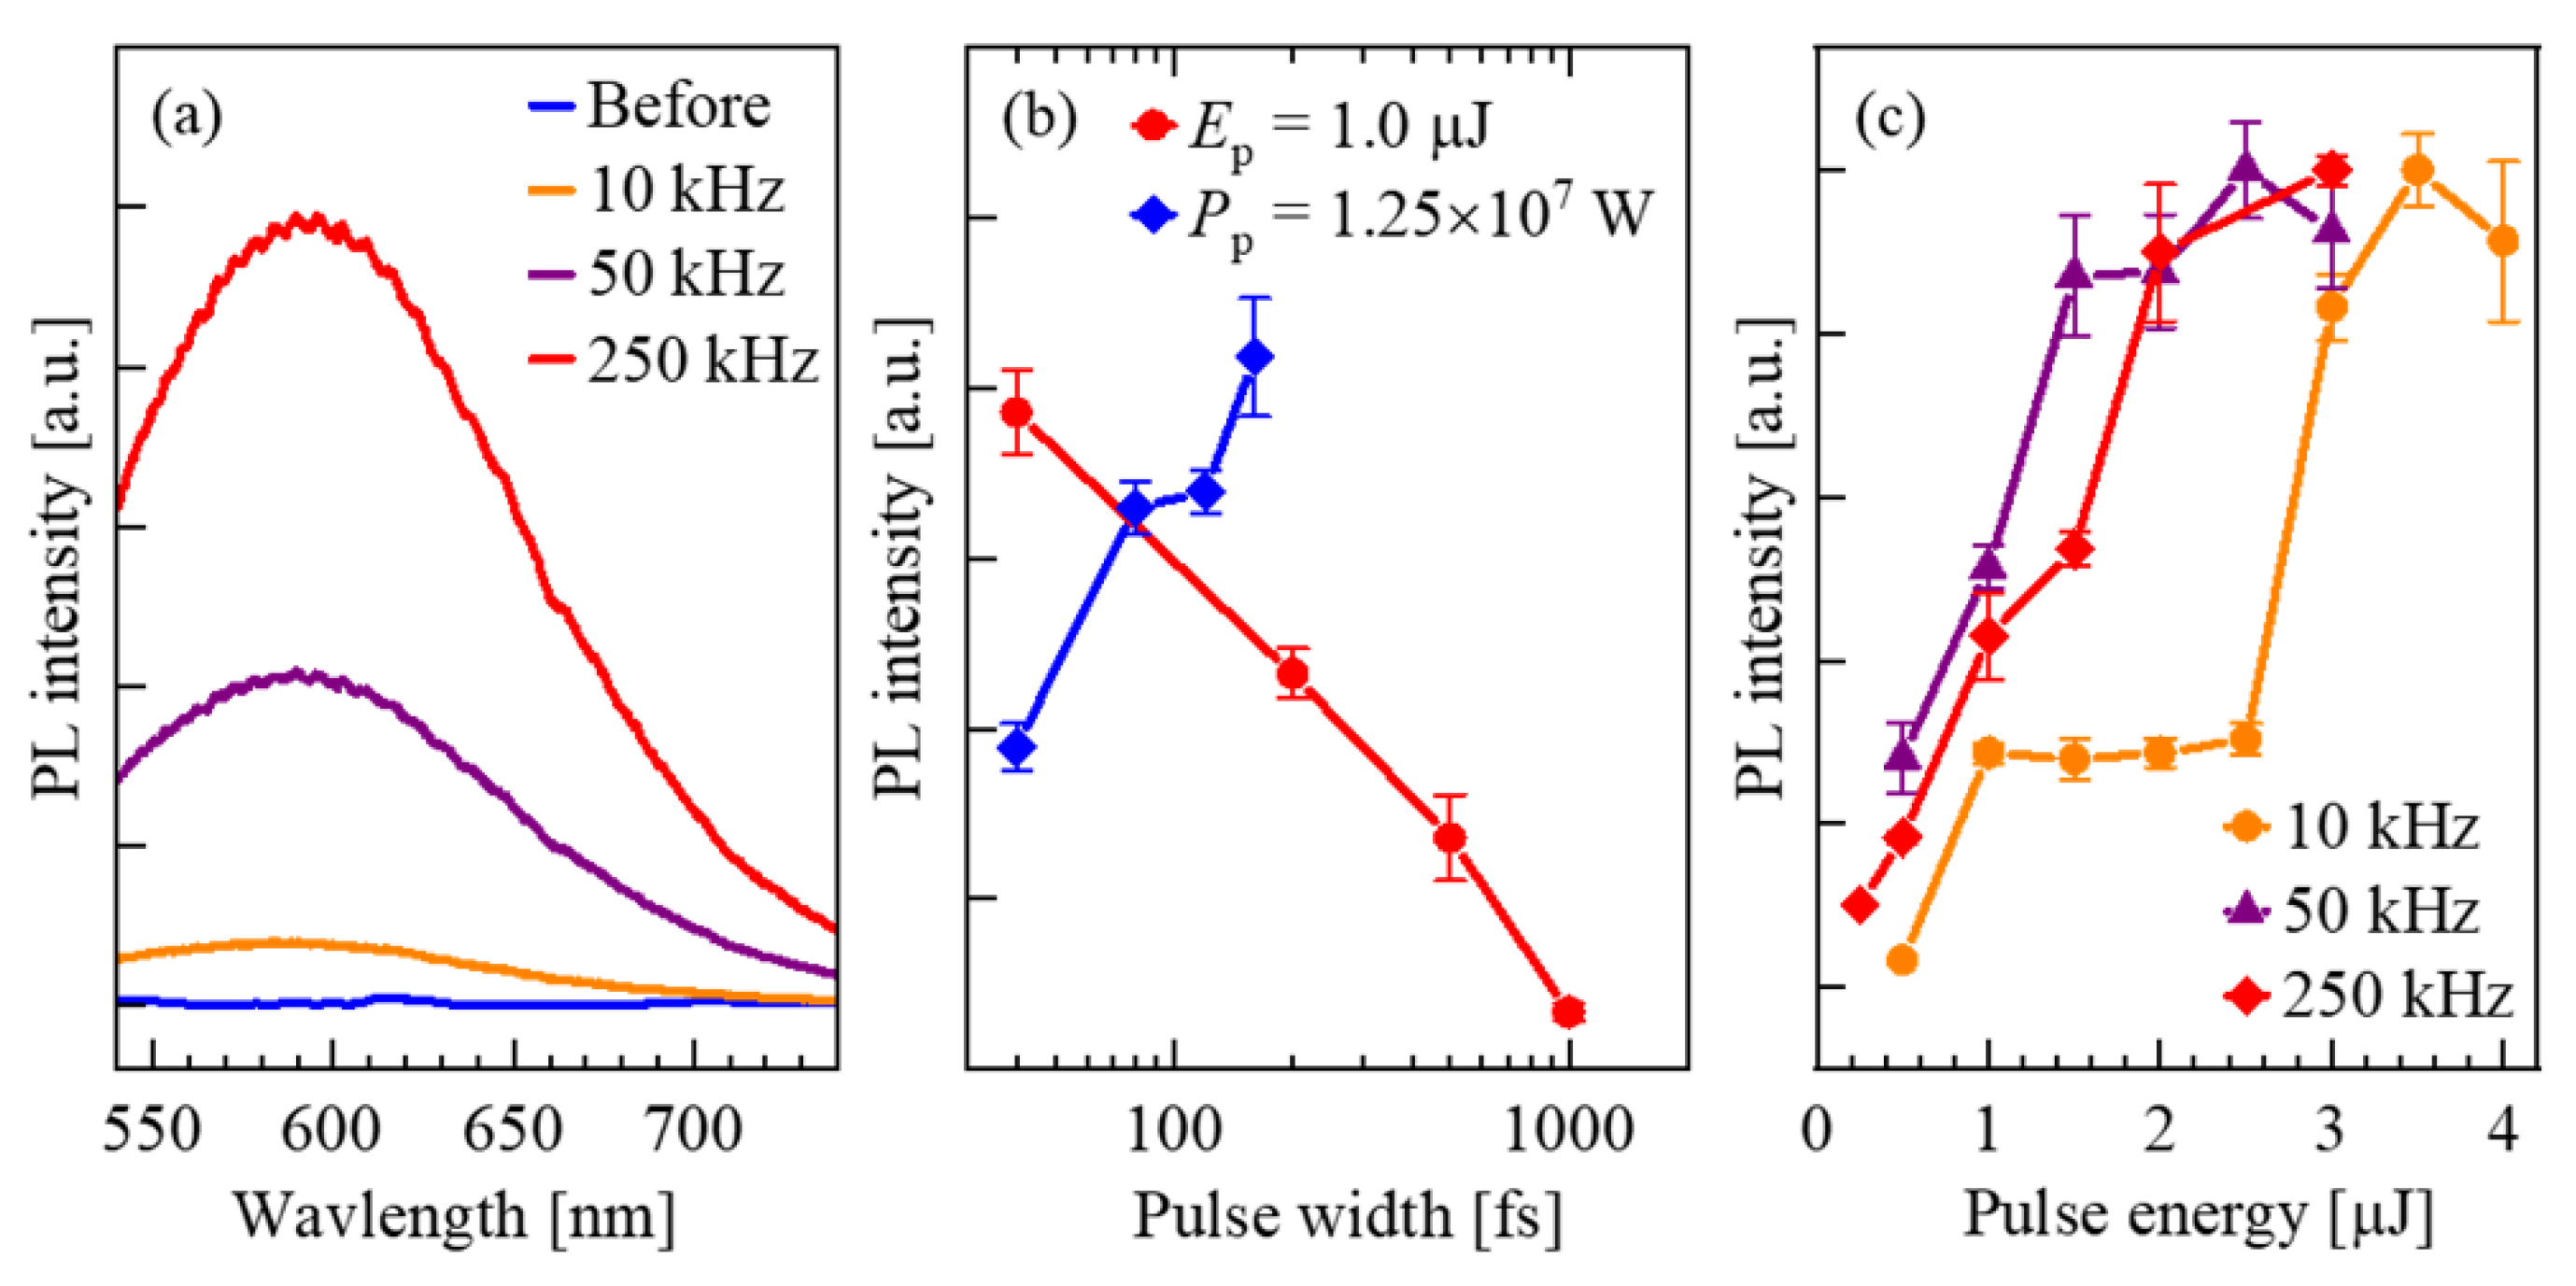
3.1. Photoluminescence Properties of Ce3+-Doped Yttrium Aluminum Garnet (YAG) Crystal and Glass

Figure 1 shows DTA curve and XRD patterns of the 62.5Al2O3-37.5Y2O3 glass sample prepared. The Tg and Tx for the as-prepared glass samples were 890 °C and 920 °C, respectively Figure 1a. Unlike the previously reported results [36,37], no apparent XRD sharp peak assigned to Y3Al5O12 (YAG) crystal was observed for the as-made glass sample (Figure 1b). The XRD pattern for the sample after annealing at 920 °C for 30 min, clearly indicates that Y3Al5O12 (YAG) crystal was deposited. The YAG crystal has a body-centered cubic garnet structure belonging to the space group Ia 3 ¯ d , where the Y occupies a dodecahedral site (24c), two of the five Al atoms occupy octahedral sites (16a), and the other three Al occupy tetrahedral sites (24d). The O atoms locate at one equivalent site (96h). In the crystal lattice of YAG, the Ce3+ which substitutes for Y3+ in the site of D2 symmetry has 8 nearest neighbor oxygen atoms. The eightfold coordination of Ce3+ in the dodecahedral site can be described as a cubic coordination with an additional tetragonal distortion [38].
Figure 2c shows excitation and emission spectra before and after crystallization of the Ce-YAG glass. Insets depict the photographs of the as-prepared Ce-YAG glass and the crystallized Ce-YAG glass, illuminated by visible or ultraviolet (UV) light (365 nm). The excitation-emission patterns before and after crystallization of the Ce-YAG glass are also shown in Figure 2a,b. Both of excitation and emission peak intensities for Ce-YAG glass greatly increased after the crystallization. Because the improved crystallinity generally results in the increase of emission intensity, the emission intensity can serve as an index of local crystallization induced by the femtosecond laser irradiation. Two broad excitation peaks were observed for Ce-YAG glass and Ce-YAG crystal. Although the peak position of a longer wavelength was almost the same as approximately 450 nm, the peak of a shorter wavelength was red shifted from 340 nm for crystal to 380 nm for glass. The electronic configuration of Ce3+ is [Xe]4f1, the blue absorption and yellow emission of which are attributed to the transition between 4f to 5d. Although the 4f electron is shielded by the outer 5s and 5p orbitals, it is well known that the 5d electron is strongly influenced by the crystal field environment and the site symmetry, leading to large crystal field effects on the excited states. According to the ligand field theory, the 5d state will split into triplet 2T2g states with higher energy and doublet 2Eg states with lower energy in the cubic field [39]. Since the ligand field strength in glass is generally weaker than that in crystals, the two excitation bands at 340-380 nm and 450 nm could be attributed to the 4f-5d2 and 4f-5d1 transitions, respectively [40]. An asymmetric broad emission ranging from 480 to 700 nm was observed for both Ce-YAG glass and Ce-YAG crystal. This emission consists of doublet sub-emissions assigned to the 5d12F7/2 and 5d12F5/2 transition, since the ground state of Ce3+ consists of 2F7/2 and 2F5/2 due to the spin-orbit interaction [41].

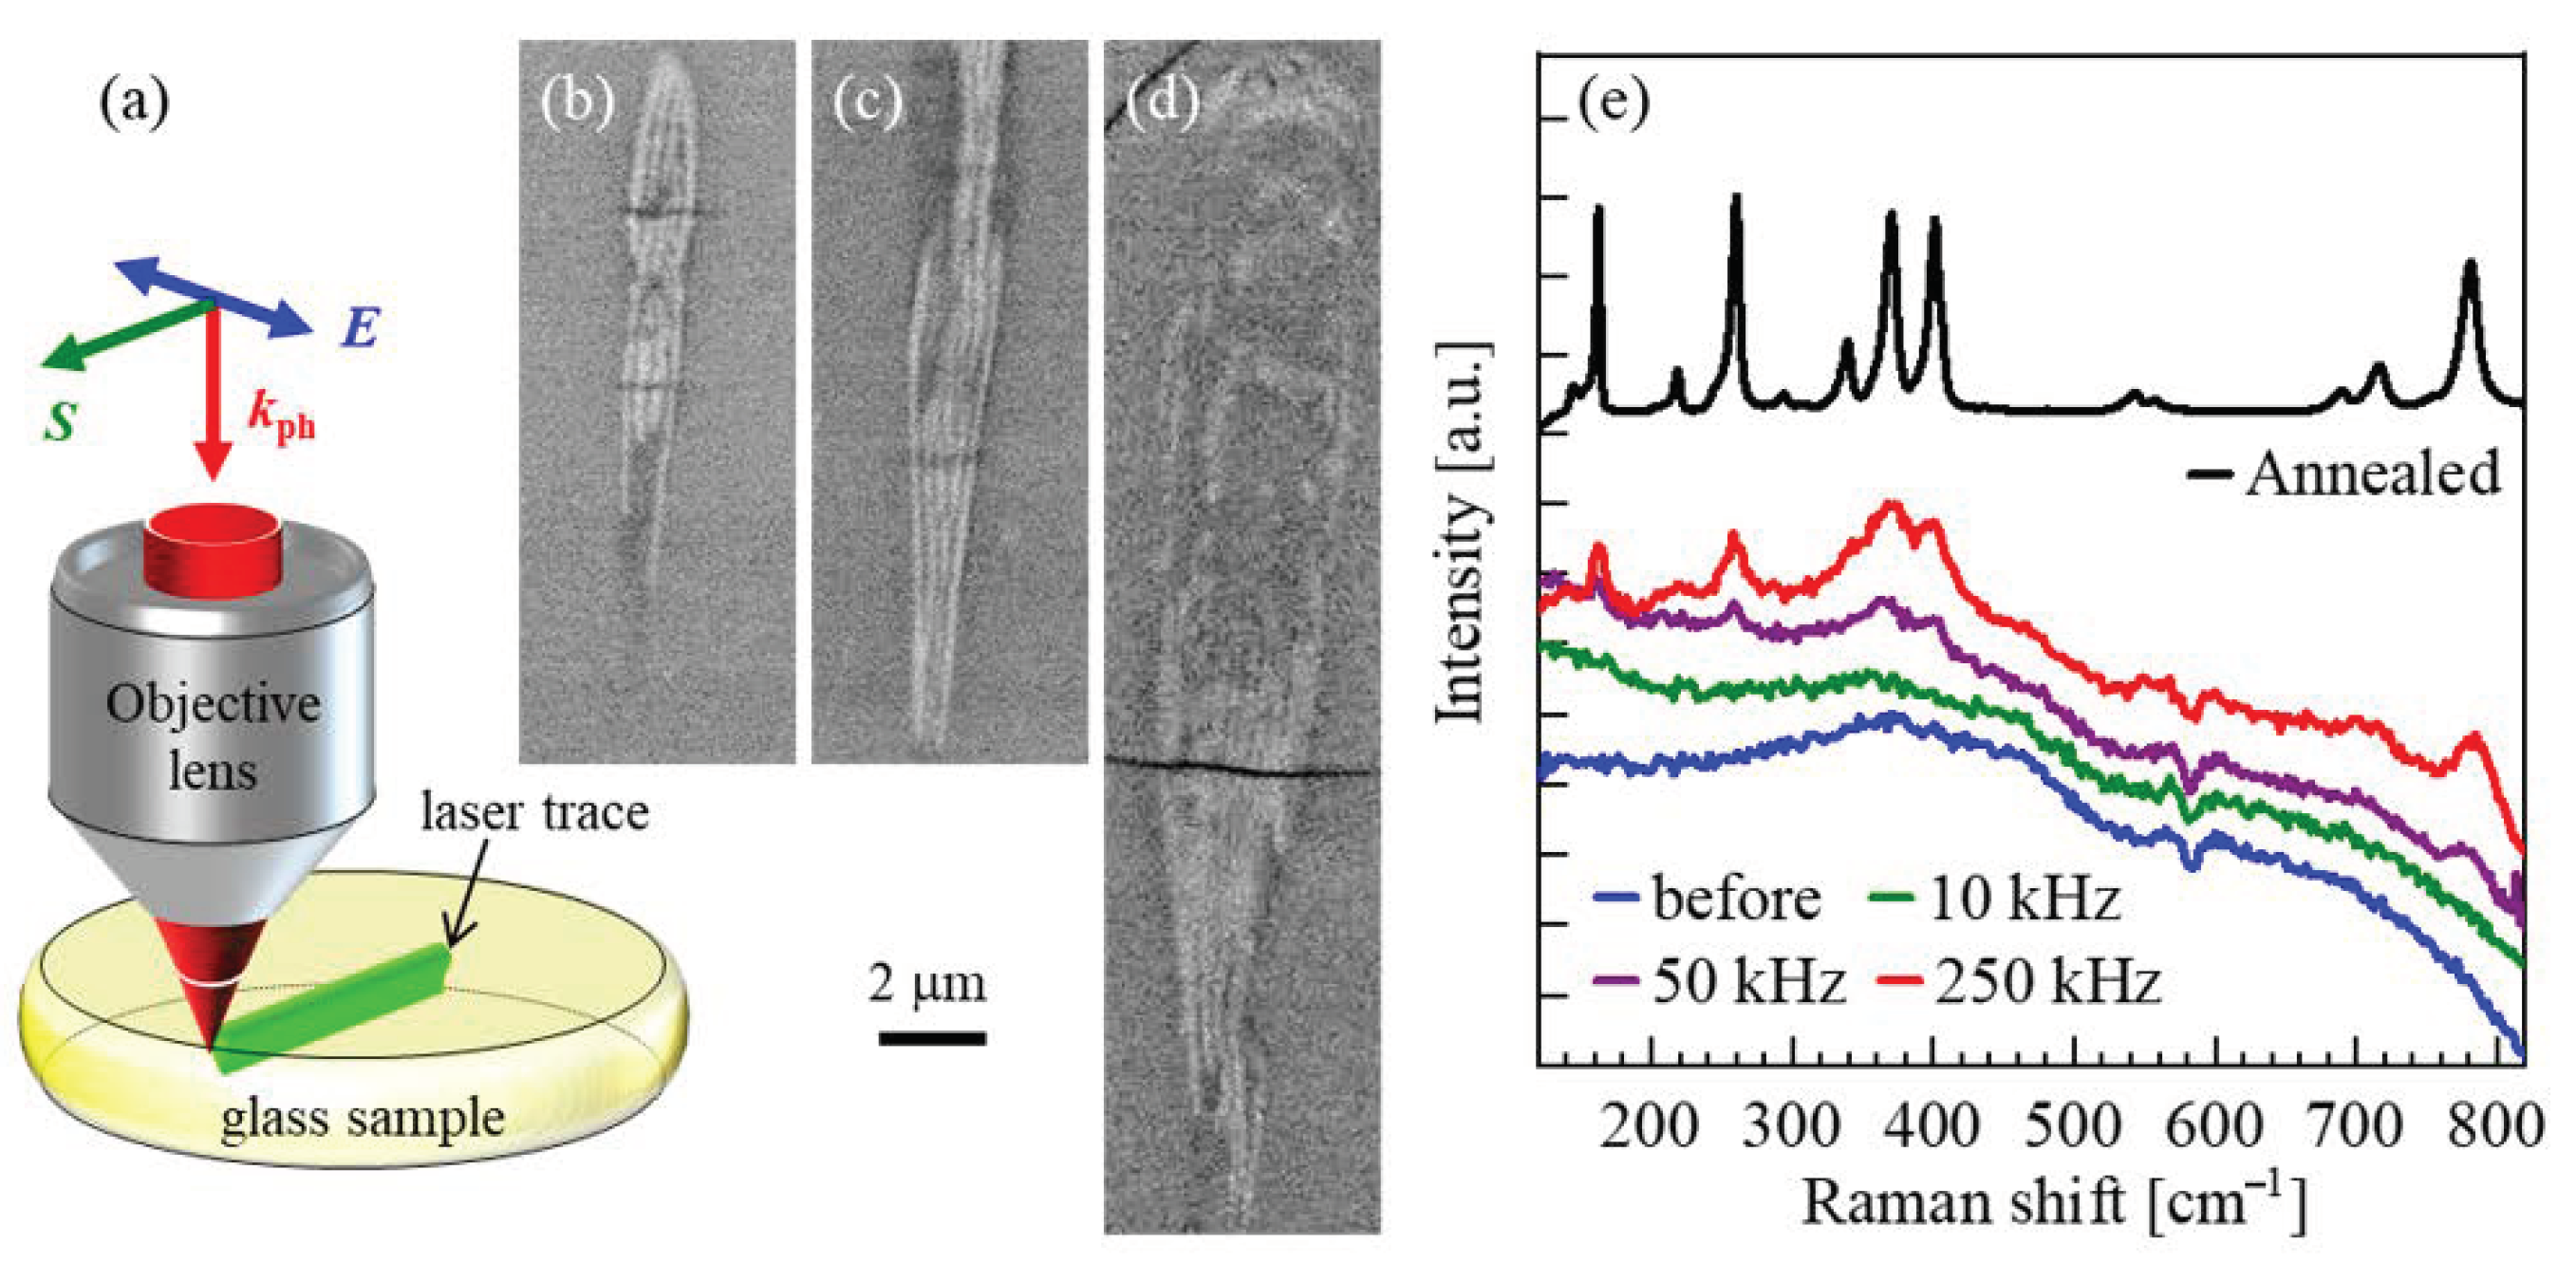
3.2. Photo-Induced Local Crystallization

Although it was expected that a polarization-dependent periodic nanostructure could be induced by the irradiation of femtosecond laser pulses, as with the case of Al2O3-Dy2O3 glass, no apparent birefringence was observed under the polarization microscope in both of Ce-YAG glass and undoped YAG glass. To confirm the formation of nanograting structure, the polished sample in the plane perpendicular to the laser writing direction was inspected by a FE-SEM Figure 3a–c. Furthermore, to reveal the structural changes of the photo-induced regions in glass samples, the Raman spectra of the modified regions after laser irradiation were also measured as shown in Figure 3d. Backscattering electron images (BEIs) indicate that a periodic nanostructure with an orientation perpendicular to the laser polarization direction was clearly formed in the case of the pulse repetition rate of 10 kHz and 50 kHz. While, in the case of the pulse repetition rate of 250 kHz, a large melting region was formed as a result of heat accumulation. In this case, the nanograting structure was partially formed. Based on the reported thermal diffusivity ( D th ) [42], the thermal diffusion length ( L ~ D th t int ) during the interpulse time ( t int ) was roughly estimated to be 20 µm, 9 µm, and 4 µm for 10 kHz, 50 kHz, and 250 kHz, respectively. Although the glass composition is almost same as the stoichiometric composition of Y3Al5O12 crystal, the striped shades were observed in BEIs, owing to the difference in the density. The YAG crystal phase was periodically precipitated in the stripe-like bright contrast regions in BEIs, corresponding to the nanograting structure, which was similar to that reported in a previous study [27]. The periods of bright contrast regions in BEIs were calculated to be approximately 250 nm, even in the case a pulse repetition rate was changed. While, the width of bright contrast regions slightly decreased from approximately 130 nm to 90 nm with an increasing pulse repetition rate. Detailed investigations using a high-resolution transmission electron microscopy should be required. Although no apparent Raman peaks were observed in the initial undoped YAG glass samples, some characteristic sharp peaks were observed after laser irradiation. A comparison between the spectrum on the laser-modified region in undoped YAG glass and the reference spectra indicates that the YAG crystal was precipitated following laser irradiation. In particular, the appearance of the Raman peak assigned to YAG crystal were more remarkable for the higher pulse repetition rate. These results indicated that a nanograting structure is composed of YAG crystal precipitation.

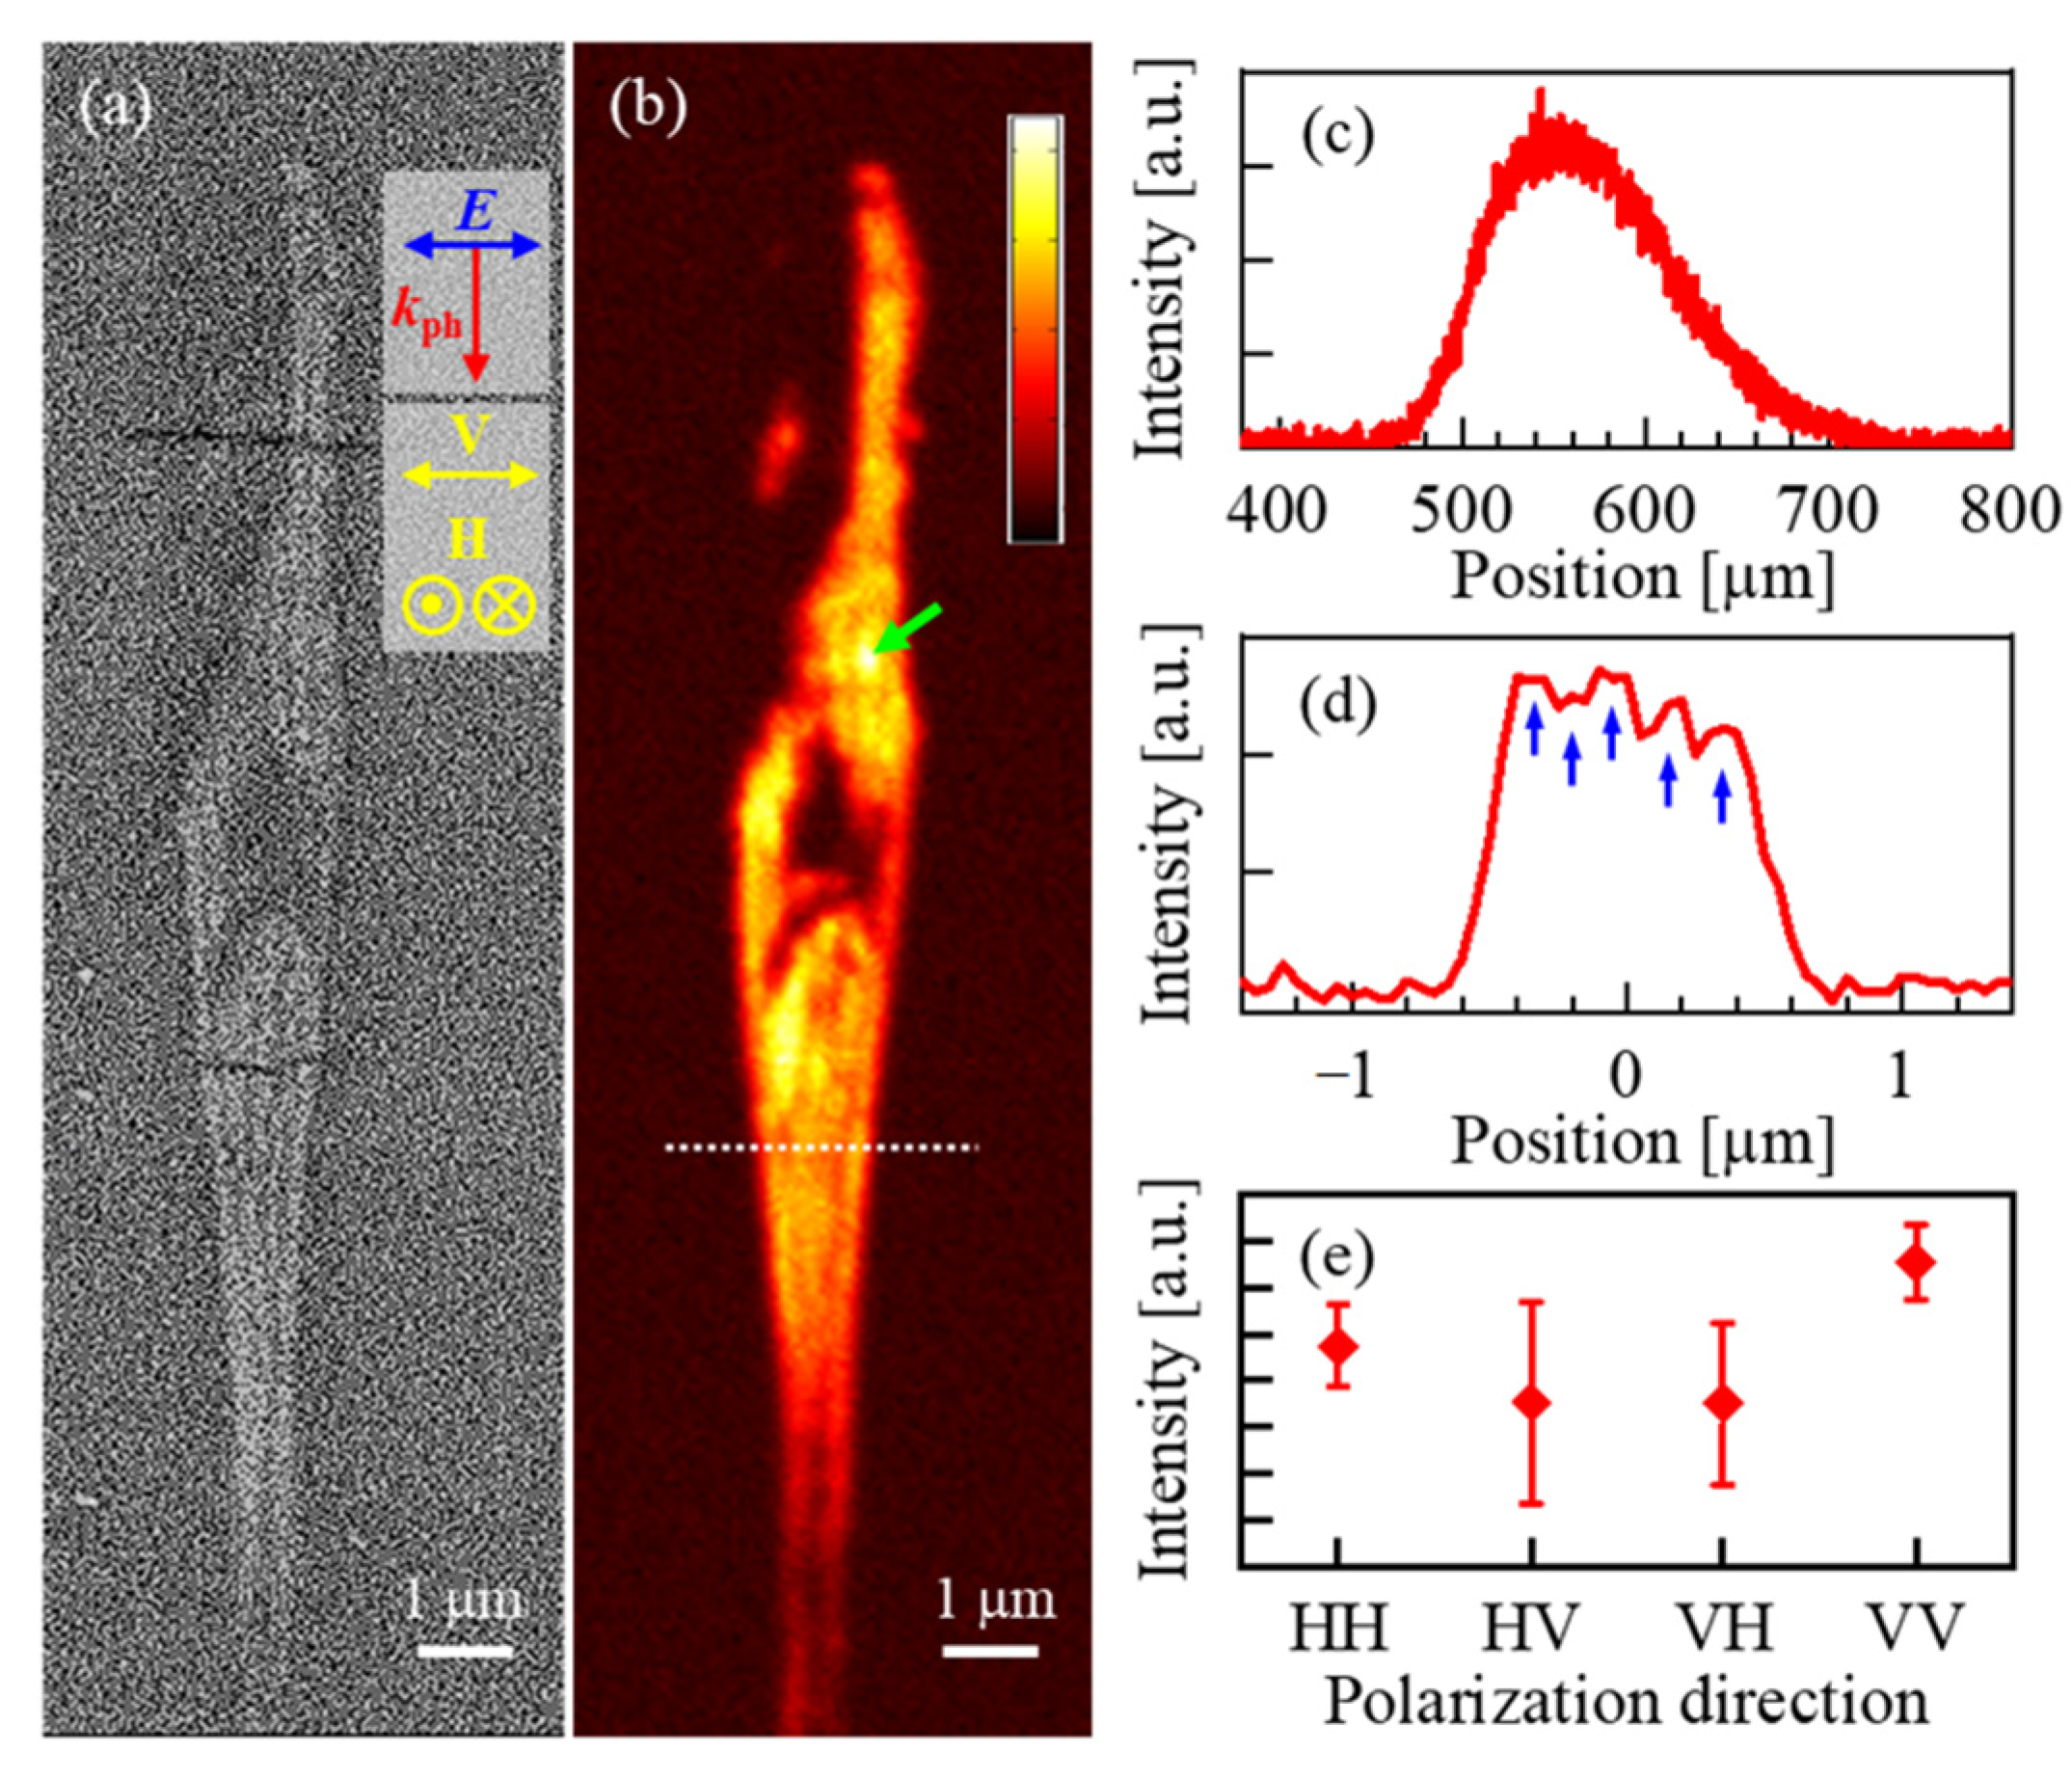
3.3. Cathode Luminescence from Nanograting Structure

We have observed cathodoluminescence (CL) based on the spatial distribution of the Ce3+ emission in nanoscale crystallization. BEIs are on the polished sample in the plane perpendicular to the laser traces written by the femtosecond laser pulses with 50 kHz, and the CL intensity map on the same surface are shown in Figure 4a,b. The asymmetric broad emission ranging from 480 to 700 nm, assigned to the 5d12F7/2 and 5d12F5/2 transition, was observed at the crystallized region Figure 4c, which is similar to the PL spectrum. The emission intensity at the crystallized region exceeded more than 2 orders higher compared to that of the unirradiated region. This reason is due to the difference in the surrounding ligand field of Ce3+ between glass and ceramics [43]. Interestingly, the CL intensity inside the crystallized region was periodically oscillating according to the nanograting structure Figure 4d. The crystallized region was also inspected by a fluorescence polarization measurement using a confocal fluorescence microscope Figure 4e. Each polarization direction of the excitation light (532 nm) and the detection light (550 nm) was tuned by the polarizer, and set to be horizontal (H) or vertical (V) with respect to the nanograting structure orientation. In the measurements, the emission intensity of 550 nm excited by light with a wavelength of 532 nm was detected. The first and second characters in transverse axis denotes that the polarization direction of the excitation light and the detection light, e.g., “HV” shows the horizontally polarized excitation and the vertically polarized detection. The emission intensity increased when the polarization directions of the excitation light and the detection light are the same, i.e., HH and VV. Furthermore, the emission intensity for VV was higher than that for HH.

3.4. Progress of Photoinduced Crystallization

We have also investigated the difference in the emission intensity of Ce3+ from the crystallized region induced by the femtosecond laser pulses with various repetition rates, pulse widths, and pulse energies Figure 5. In the measurements, a confocal fluorescence microscope was used. The crystallized region at 60 µm below the sample surface was inspected by an objective lens (LU Plan Fluor, 50 × 0.80 N.A., Nikon, Tokyo, Japan). The pinhole size was set to be 100 µm. The typical optical slice thickness is given by [44]:
A = { ( 0.88 λ n n 2 N A 2 ) 2 + ( 2 n d N A ) 2 } 1 2
here λ, n, NA, and d are the emission wavelength (~580 nm), the refractive index of air (~1), the numerical aperture, and the pinhole diameter, respectively. In addition, assuming the pinhole size is infinitely small, the lateral resolution is also given by [45]:
L = 0.51 λ N A
The values of A and L are calculated to be approximately 1.3 µm and 0.4 µm. Furthermore, considering a spherical aberration, the axial resolution can be roughly estimated to be 1.6 µm. Since the length of the laser-modified region was at least 10 µm for 250 kHz, we deduced that the PL intensity measured by our confocal setup can be an intercomparison. Although quantitative analysis of crystallinity in a local region from the PL intensity is difficult, to evaluate the crystallinity of the laser irradiated region qualitatively we obtained the PL intensity by the methods shown below.
The spectral mapping of Ce3+ emission ranging from 560 nm to 620 nm was performed in a plane involving the laser-modified region while varying the depth every 1 µm to a total of 10 µm. The maximum PL intensity in every spectra map was integrated 10 times. Finally, we deduced that the evaluated PL intensity is proportional to the crystallinity. In the experiments for estimating the pulse repetition rate dependence on the PL intensity, for irradiating the same number of pulses per unit area, the writing speed was adjusted. The PL intensity was evidently increased with increasing the pulse repetition rate, suggesting that the heat accumulation during laser irradiation effects on the crystal nucleation and/or growth Figure 5a. As shown in Figure 5b, the PL intensity decreased with increasing the pulse width under the same pulse energy (Ep), in contrast, increased with increasing the pulse width under the same peak power (Pp). From these results, it is suggested that the crystal nucleation is photoinduced in a supersaturated region where the electric field intensity exceeds a certain threshold. In the case of higher pulse repetition rate, the PL intensity linearly increased with increasing the Ep under the same pulse width of 40 fs Figure 5c. According to the increase of the pulse energy, the PL intensity was increased and then saturated regardless of the pulse repetition rate. These results suggested that the crystallinity becomes high in proportion to the pulse energy. However, in the case of low pulse repetition rate of 10 kHz, there was no significant change in the PL intensity with increase of the Ep up to 2.5 µJ, although the PL intensity was slightly higher than that for as-prepared Ce-YAG glass. For over 2.5 µJ, the PL intensity was increased to approximately the same level as that for the higher repetition rate. We deduced that the nuclei of YAG crystal before growth were kept in a glass matrix in the case of the lower pulse energy and the pulse repetition rate due to smaller effect of the heat accumulation.
To make a comparison of the PL intensity induced by various pulse repetition rate in Figure 5a, the PL intensity ratios at 590 nm before and after the laser irradiation are listed in Table 1.
Table 1 shows the PL intensity ratio increased proportional to the pulse repetition rate. Furthermore, the fact that the PL intensity was almost the same value in the case of the pulse energy lower than 2.5 µJ at 10 kHz Figure 5c, indicates that an interpulse time of 100 µs or less should be required for crystal growth. Therefore, we deduced that the increase of laser energy absorption followed by thermal accumulation during laser pulse irradiation caused the proportional increase of PL intensity. At the moment, it is difficult to estimate the timescale of nucleation process because the laser energy absorption increases with increasing pulse repetition rate [46]. To discuss the nucleation process, detailed experiments of a transient photoluminescence and absorption should be required.

3.5. Nucleation and Growth of YAG Nanocrystals

To confirm the growth of the photo-induced nuclei, thermal treatment was performed. The samples after the femtosecond laser irradiation with various pulse energies and pulse repetition rates were annealed at 300 °C, 500 °C, and 700 °C for 30 min. The measurements were repeated several times. The PL intensity ratios of the laser-modified region before and after thermal treatment are plotted in Figure 6. In the case of lower pulse repetition rate of 10 kHz and 50 kHz, the R value for every thermal treatment was increased, although the annealing temperature is quite a lot lower than Tg of 890 °C. On the other hand, no apparent change in the R value was observed in the case of 250 kHz pulse repetition rate. These results are suggested that the crystal nuclei were already grown during the irradiation of higher pulse repetition rate laser pulses.

4. Discussion

4.1. Polarization-Dependent Phenomena

The formation of the polarization-dependent subwavelength nanostructure composed of the partial crystallization was formed in few kinds of glass such as Al2O3-Dy2O3 glass [27], Li2O-Nb2O5-SiO2 glass [33], and La2O3-Ta2O5-Nb2O5 glass [47]. In the case of Li2O-Nb2O5-SiO2 glass, the induced LiNbO3 is an anisotropic and ferroelectric crystal. In addition, although the structure of the TaxOyz+ crystal cluster is unknown, it is known that the Ta2O5 thin film exhibits a piezoelectric property [48]. On the other hand, Dy3Al5O12 and Y3Al5O12 belong to the garnet-type structure and is optically isotropic crystal with cubic symmetry. It is also known that the relative permittivity of Y3Al5O12 is low (~11) [49] compared to LiNbO3. In our experiments, polarization-dependent periodic nanostructures composed of the partially crystallized domain with garnet-type structure were successfully photo-induced by the femtosecond laser irradiation with the relatively low pulse repetition rate (Figure 3). The enhancement of PL and CL intensity of the Ce3+ activators due to large ligand field strength supports the local crystallization in nanograting structures Figure 4. Furthermore, it is known that the emission efficiency of Ce3+ doped Gd3Ga5O12 crystal can be improved by applying pressure of several GPa [50]. This effect is interpreted in terms of two possible phenomena: (i) by pressure-induced electronic crossover of the excited 5d energy level of the Ce3+ with the conduction band bottom of the host crystal, and (ii) by decrease of electron-lattice coupling with increasing pressure, resulting in reduction of the Stokes shift and non-radiative transitions between the low vibrational levels of the 5d state and high vibrational levels of the ground 4f state. On the other hand, Ma et al. recently proposed a possible mechanoluminescence mechanism for Ce3+-doped YAG involving the phonon-assisted mechanical energy transfer processes [51]. Based on the demonstration of the mechanoluminescence degradation under a cyclic stress test, they reported that the electrons at the ground level of Ce3+ could be transferred to the excited levels with the assistance of the energy from the phonons in the matrix, which then recombined with the holes. In our case, Raman peaks of YAG were apparently increased with increasing pulse repetition rate, Figure 3e, suggesting the increase of crystallinity. We deduced that the effect induced by the crystal field environment is dominant compared to the phonon-assisted mechanical energy transfer model. Therefore, the crystallization and alignment in nanoscale will be interpreted in terms of not only a torque force provided by the anisotropic and ferroelectric properties of crystal, but also a pressure difference periodically induced by electron plasma within the laser focus. Based on the formation of a subwavelength periodic plasma-field structure consisting of the overcritical plasma layers perpendicular to the laser polarization [11,52], a periodic modulation of the pressure may also be produced. Meanwhile, it is known that the crystal nucleation rate is given by [53,54]:
J J 0 exp ( W * κ B T ) ,   W * = 16 π σ 3 3 Δ P 2
where J0, W*, κB, T, σ, and ΔP are the prefactor, energy barrier to nucleation, the Boltzmann constant, temperature, surface tension of the nucleus, and pressure difference between in and out of the nucleus, respectively. This equation represents how the pressure difference reduces the energy barrier to nucleation, leading to an increase of the nucleation rate. Of course, the nucleation rate also increases with temperature. Assuming the electron pressure is proportional to the pressure difference, finally, crystallization could occur at a higher electron plasma density region. Assuming the electron pressure is proportional to the pressure difference, finally, crystallization could preferentially occur at a higher electron plasma density region. In general, based on the crystal field theory, the photoluminescence properties depend on the polarization direction as well as the stress axis relative to the crystallographic axis. However, this cannot explain the results of fluorescence polarization measurements Figure 4e, because the crystallized region in the nanograting structure is polycrystalline. Although the periodic stress field corresponding to the nanograting structure may be related to such polarization-dependent photoluminescence properties, more detailed investigations should be required. Although another interesting phenomenon inducing an asymmetric stress field caused by the ponderomotive force, which is proportional to the laser intensity gradient, was also observed [29], this force is not sensitive to the laser polarization direction.

4.2. Nucleation and Growth Mechanism for Photoinduced Crystallization

From the results in Figure 5 and Figure 6, we consider the nucleation and growth mechanism to be as follows: firstly, the electric field intensity of a laser pulse affects the nucleation process, since the PL intensity increased with increasing in the peak power and the pulse width. Furthermore, the heat accumulation phenomenon during laser irradiation with high pulse repetition rate also affects the nucleation, particularly the size of crystal nucleus. Based on the classical nucleation theory [55], the growth rate of crystal nucleus can be given by:
d r d t ( 1 r c r )
where rc is the radius of critical nucleus. If the radius of the crystal nucleus induced by the laser irradiation is larger than rc, the crystal nucleus will grow. Meanwhile, according to the time-temperature-transformation (T-T-T) curve for isothermal crystallization of quenched amorphous YAG [56], the progress in crystallinity for the sample after the laser irradiation at room temperature and the thermal treatment at 700 °C for 30 min is quite low. Furthermore, the R value was slightly increased with an increase of the annealing temperature, and decreased with an increase of the pulse repetition rate. These results suggested that the size of crystal nucleus for the higher pulse repetition rate becomes larger. In addition, even though the temperature of the photo-induced region in glass is speculated to be much higher than crystallization temperature, the R value was not very different to changing pulse energy. This may be related to the solid-state conversion of bulk solid glass to a crystal [57], determined by kinetics, not thermodynamic equilibrium.

5. Conclusions

We investigated femtosecond laser-induced crystallization in Ce3+-doped YAG glass prepared using an aerodynamic levitation melting method. We observed the self-assembly of periodic nanostructure in which partially precipitated Y3Al5O12 garnet structure was aligned in a plane perpendicular to the laser polarization direction. To grow YAG nanocrystals locally inside Ce3+ doped YAG glass by the irradiation of femtosecond laser pulses, thermal accumulation induced by an interpulse time of 100 µs or less should be required. We have proposed the formation mechanisms of periodic nano-crystallization in a plane perpendicular to the laser polarization. A periodic pressure difference induced by electron plasma within the laser focus could reduce the energy barrier to nucleation, leading to an increase of the nucleation rate. Such self-assembled nanostructure of Ce3+-doped YAG nanocrystals will open the possibilities of a new type of light-emitting device.

Author Contributions

Conceptualization, Y.S. and K.M.; methodology, Y.S. and M.S.; investigation, Y.S., K.T. and T.O.; writing—original draft preparation, Y.S. and K.T.; writing—review and editing, Y.S.; supervision and funding acquisition, Y.S. and K.M. All authors have read and agreed to the published version of the manuscript.

Funding

This research was funded by JSPS KAKENHI, grant number 20H02656 and Takahashi Industrial and Economic Research Foundation.

Acknowledgments

The authors appreciate the technical support of an aerodynamic levitation melting method from Atsunobu Masuno, Hirosaki University and Hiroyuki Inoue, University of Tokyo.

Conflicts of Interest

The authors declare no conflict of interest.

References

  1. Zanotto, E.D. Metastable phases in lithium disilicate glasses. J. Non Cryst. Solids 1997, 219, 42–48. [Google Scholar] [CrossRef]
  2. Stookey, S.D. Photosensitive Glass. Ind. Eng. Chem. 1949, 41, 856–861. [Google Scholar] [CrossRef]
  3. Lumeau, J.; Glebova, L.; Golubkov, V.; Zanotto, E.D.; Glebov, L.B. Origin of crystallization-induced refractive index changes in photo-thermo-refractive glass. Opt. Mater. 2009, 32, 139–146. [Google Scholar] [CrossRef]
  4. Stookey, S.D.; Beall, G.H.; Pierson, J.E. Full-color photosensitive glass. J. Appl. Phys. 1978, 49, 5114–5123. [Google Scholar] [CrossRef]
  5. Strickland, D.; Mourou, G. Compression of amplified chirped optical pulses. Opt. Commun. 1985, 56, 219–221. [Google Scholar] [CrossRef]
  6. Gattass, R.R.; Mazur, E. Femtosecond laser micromachining in transparent materials. Nat. Photon. 2008, 2, 219–225. [Google Scholar] [CrossRef]
  7. Tirlapur, U.K.; Konig, K. Cell biology—Targeted transfection by femtosecond laser. Nature 2002, 418, 290–291. [Google Scholar] [CrossRef]
  8. Davis, K.M.; Miura, K.; Sugimoto, N.; Hirao, K. Writing waveguides in glass with a femtosecond laser. Opt. Lett. 1996, 21, 1729–1731. [Google Scholar] [CrossRef]
  9. Haque, M.; Lee, K.K.C.; Ho, S.; Fernandes, L.A.; Herman, P.R. Chemical-assisted femtosecond laser writing of lab-in-fibers. Lab Chip 2014, 14, 3817–3829. [Google Scholar] [CrossRef]
  10. Glezer, E.N.; Milosavljevic, M.; Huang, L.; Finlay, R.J.; Her, T.-H.; Callan, J.P.; Mazur, E. Three-dimensional optical storage inside transparent materials. Opt. Lett. 1996, 21, 2023–2025. [Google Scholar] [CrossRef]
  11. Shimotsuma, Y.; Kazansky, P.G.; Qiu, J.; Hirao, K. Self-Organized Nanogratings in Glass Irradiated by Ultrashort Light Pulses. Phys. Rev. Lett. 2003, 91, 247405. [Google Scholar] [CrossRef] [PubMed] [Green Version]
  12. Lancry, M.; Poumellec, B.; Canning, J.; Cook, K.; Poulin, J.-C.; Brisset, F. Ultrafast nanoporous silica formation driven by femtosecond laser irradiation. Laser Photon. Rev. 2013, 7, 953–962. [Google Scholar] [CrossRef]
  13. Sakakura, M.; Kurita, T.; Shimizu, M.; Yoshimura, K.; Shimotsuma, Y.; Fukuda, N.; Hirao, K.; Miura, K. Shape control of elemental distributions inside a glass by simultaneous femtosecond laser irradiation at multiple spots. Opt. Lett. 2013, 38, 4939–4942. [Google Scholar] [CrossRef] [PubMed]
  14. Qiu, J.; Jiang, X.; Zhu, C.; Shirai, M.; Si, J.; Jiang, N.; Hirao, P.K. Manipulation of Gold Nanoparticles inside Transparent Materials. Angew. Chem. Int. Ed. 2004, 43, 2230–2234. [Google Scholar] [CrossRef] [PubMed]
  15. Yang, W.; Kazansky, P.G.; Svirko, Y.P. Non-reciprocal ultrafast laser writing. Nat. Photon. 2008, 2, 99–104. [Google Scholar] [CrossRef]
  16. Komatsu, T.; Ihara, R.; Honma, T.; Benino, Y.; Sato, R.; Kim, H.; Fujiwara, T. Patterning of Non-Linear Optical Crystals in Glass by Laser-Induced Crystallization. J. Am. Ceram. Soc. 2007, 90, 699–705. [Google Scholar] [CrossRef]
  17. Komatsu, T.; Honma, T. Nucleation and Crystal Growth in Laser-Patterned Lines in Glasses. Front. Mater. 2016, 3, 32. [Google Scholar] [CrossRef] [Green Version]
  18. Stone, A.; Sakakura, M.; Shimotsuma, Y.; Miura, K.; Hirao, K.; Dierolf, V.; Jain, H. Femtosecond laser-writing of 3D crystal architecture in glass: Growth dynamics and morphological control. Mater. Des. 2018, 146, 228–238. [Google Scholar] [CrossRef]
  19. Miura, K.; Qiu, J.; Mitsuyu, T.; Hirao, K. Space-selective growth of frequency-conversion crystals in glasses with ultrashort infrared laser pulses. Opt. Lett. 2000, 25, 408–410. [Google Scholar] [CrossRef]
  20. Stone, A.; Jain, H.; Dierolf, V.; Sakakura, M.; Shimotsuma, Y.; Miura, K.; Hirao, K.; Lapointe, J.; Kashyap, R. Direct laser-writing of ferroelectric single-crystal waveguide architectures in glass for 3D integrated optics. Sci. Rep. 2015, 5, 10391. [Google Scholar] [CrossRef]
  21. Ogawa, K.; Honma, T.; Komatsu, T. Birefringence imaging and orientation of laser patterned β-BaB2O4 crystals with bending and curved shapes in glass. J. Solid State Chem. 2013, 207, 6–12. [Google Scholar] [CrossRef]
  22. Xuan, H.; Fan, C.; Bertrand, P.; Liu, Q.; Zeng, H.; Brisset, F.; Chen, G.; Zhao, X.; Lancry, M. Size-controlled oriented crystallization in SiO2-based glasses by femtosecond laser irradiation. J. Opt. Soc. Am. B 2014, 31, 376–381. [Google Scholar] [CrossRef]
  23. Sakakura, M.; Shimizu, M.; Shimotsuma, Y.; Miura, K.; Hirao, K. Temperature distribution and modification mechanism inside glass with heat accumulation during 250 kHz irradiation of femtosecond laser pulses. Appl. Phys. Lett. 2008, 93, 231112. [Google Scholar] [CrossRef] [Green Version]
  24. Mori, S. Nanogratings Embedded in Al2O3-Dy2O3 Glass by Femtosecond Laser Irradiation. J. Laser Micro Nanoeng. 2016, 11, 87–90. [Google Scholar] [CrossRef] [Green Version]
  25. Asai, T.; Shimotsuma, Y.; Kurita, T.; Murata, A.; Kubota, S.; Sakakura, M.; Miura, K.; Brisset, F.; Bertrand, P.; Lancry, M. Systematic Control of Structural Changes in GeO2 Glass Induced by Femtosecond Laser Direct Writing. J. Am. Ceram. Soc. 2015, 98, 1471–1477. [Google Scholar] [CrossRef] [Green Version]
  26. Mori, M.; Shimotsuma, Y.; Sei, T.; Sakakura, M.; Miura, K.; Udono, H. Tailoring thermoelectric properties of nanostructured crystal silicon fabricated by infrared femtosecond laser direct writing. Phys. Status Solidi A 2015, 212, 715–721. [Google Scholar] [CrossRef]
  27. Shimotsuma, Y.; Mori, S.; Nakanishii, Y.; Kim, E.; Sakakura, M.; Miura, K. Self-assembled glass/crystal periodic nanostructure in Al2O3-Dy2O3 binary glass. Appl. Phys. A 2018, 124, 82. [Google Scholar] [CrossRef]
  28. Cao, J.; Bertrand, P.; François, B.; Helbert, A.-L.; Lancry, M. Angular Dependence of the Second Harmonic Generation Induced by Femtosecond Laser Irradiation in Silica-Based Glasses: Variation with Writing Speed and Pulse Energy. World J. Nano Sci. Eng. 2015, 5, 96–106. [Google Scholar] [CrossRef] [Green Version]
  29. Bertrand, P.; Lancry, M.; Desmarchelier, R.; Hervé, E.; Brisset, F.; Poulin, J. Asymmetric Orientational Writing in glass with femtosecond laser irradiation. Opt. Mater. Express 2013, 3, 1586. [Google Scholar] [CrossRef] [Green Version]
  30. Cao, J.; Poumellec, B.; Mazerolles, L.; Brisset, F.; Helbert, A.-L.; Surble, S.; He, X.; Lancry, M. Nanoscale phase separation in lithium niobium silicate glass by femtosecond laser irradiation. J. Am. Ceram. Soc. 2017, 100, 115–124. [Google Scholar] [CrossRef] [Green Version]
  31. Kushibiki, J.; Takanaga, I.; Arakawa, M.; Sannomiya, T. Accurate measurements of the acoustical physical constants of LiNbO3 and LiTaO3 single crystals. IEEE Trans. Ultrason. Ferroelectr. Freq. Control 1999, 46, 1315–1323. [Google Scholar] [CrossRef] [PubMed]
  32. Cao, J.; Bertrand, P.; Brisset, F.; Helbert, A.-L.; Lancry, M. Tunable angular-dependent second-harmonic generation in glass by controlling femtosecond laser polarization. J. Opt. Soc. Am. B 2016, 33, 741. [Google Scholar] [CrossRef]
  33. Cao, J.; Lancry, M.; Brisset, F.; Mazerolles, L.; Saint-Martin, R.; Bertrand, P. Femtosecond Laser-Induced Crystallization in Glasses: Growth Dynamics for Orientable Nanostructure and Nanocrystallization. Cryst. Growth Des. 2019, 19, 2189–2205. [Google Scholar] [CrossRef]
  34. Papagelis, K.; Ves, S. Vibrational properties of the rare earth aluminum garnets. J. Appl. Phys. 2003, 94, 6491. [Google Scholar] [CrossRef] [Green Version]
  35. Yoshimoto, K.; Masuno, A.; Ueda, M.; Inoue, H.; Yamamoto, H.; Kawashima, T. Low phonon energies and wideband optical windows of La2O3-Ga2O3 glasses prepared using an aerodynamic levitation technique. Sci. Rep. 2017, 7, srep45600. [Google Scholar] [CrossRef] [PubMed]
  36. Alahraché, S.; Deschamps, M.; Lambert, J.; Suchomel, M.R.; Meneses, D.D.S.; Matzen, G.; Massiot, D.; Véron, E.; Allix, M. Crystallization of Y2O3–Al2O3 Rich Glasses: Synthesis of YAG Glass-Ceramics. J. Phys. Chem. C 2011, 115, 20499–20506. [Google Scholar] [CrossRef]
  37. Lee, C.-H.; Jung, S.-K.; Yoda, S.; Cho, W.-S. Microstructure of rapidly quenched YAG-based glass–ceramics prepared by aerodynamic levitation. Ceram. Int. 2015, 41, 14475–14481. [Google Scholar] [CrossRef]
  38. Chen, L.; Chen, X.; Liu, F.; Chen, H.; Wang, H.; Zhao, E.; Jiang, Y.; Chan, T.-S.; Wang, C.-H.; Zhang, W.; et al. Charge deformation and orbital hybridization: Intrinsic mechanisms on tunable chromaticity of Y3Al5O12:Ce3+ luminescence by doping Gd3+ for warm white LEDs. Sci. Rep. 2015, 5, 11514. [Google Scholar] [CrossRef] [Green Version]
  39. Robbins, D.J. The Effects of Crystal Field and Temperature on the Photoluminescence Excitation Efficiency of Ce3+ in YAG. J. Electrochem. Soc. 1979, 126, 1550–1555. [Google Scholar] [CrossRef]
  40. Ueda, J.; Tanabe, S. (INVITED) Review of luminescent properties of Ce3+-doped garnet phosphors: New insight into the effect of crystal and electronic structure. Opt. Mater. X 2019, 1, 100018. [Google Scholar] [CrossRef]
  41. Jacobs, R.R.; Krupke, W.F.; Weber, M.J. Measurement of excited-state-absorption loss for Ce3+ in Y3Al5O12 and implications for tunable 5d→4f rare-earth lasers. Appl. Phys. Lett. 1978, 33, 410–412. [Google Scholar] [CrossRef]
  42. Sato, Y.; Taira, T. The studies of thermal conductivity in GdVO4, YVO4, and Y3Al5O12 measured by quasi-one-dimensional flash method. Opt. Express 2006, 14, 10528. [Google Scholar] [CrossRef] [PubMed]
  43. Sontakke, A.D.; Ueda, J.; Xu, J.; Asami, K.; Katayama, M.; Inada, Y.; Tanabe, S. A Comparison on Ce3+ Luminescence in Borate Glass and YAG Ceramic: Understanding the Role of Host’s Characteristics. J. Phys. Chem. C 2016, 120, 17683–17691. [Google Scholar] [CrossRef]
  44. Wilhelm, S.; Gröbler, B.; Gluch, M.; Heinz, H. Confocal Laser Scanning Microscopy Principles; ZEISS: Jena, German, 2003; Available online: http://zeiss-campus.magnet.fsu.edu/referencelibrary/pdfs/ZeissConfocalPrinciples.pdf (accessed on 15 December 2020).
  45. Wilson, T. Resolution and optical sectioning in the confocal microscope. J. Microsc. 2011, 244, 113–121. [Google Scholar] [CrossRef] [PubMed]
  46. Miyamoto, I.; Cvecek, K.; Schmidt, M. Evaluation of Nonlinear Absorptivity and Absorption Region in Fusion Welding of Glass using Ultrashort Laser Pulses. Phys. Procedia 2011, 12, 378–386. [Google Scholar] [CrossRef] [Green Version]
  47. Zhang, B.; Tan, D.; Liu, X.; Tong, L.; Kazansky, P.G.; Qiu, J. Self-Organized Periodic Crystallization in Unconventional Glass Created by an Ultrafast Laser for Optical Attenuation in the Broadband Near-Infrared Region. Adv. Opt. Mater. 2019, 7, 19900593. [Google Scholar] [CrossRef]
  48. Audier, M.; Chenevier, B.; Roussel, H.; Vincent, L.; Pena, A.; Salaün, A.L. A very promising piezoelectric property of Ta2O5 thin films. II: Birefringence and piezoelectricity. J. Solid State Chem. 2011, 184, 2033–2040. [Google Scholar] [CrossRef]
  49. Krupka, J.; Derzakowski, K.; Tobar, M.; Hartnett, J.G.; Geyer, R.G. Complex permittivity of some ultralow loss dielectric crystals at cryogenic temperatures. Meas. Sci. Technol. 1999, 10, 387–392. [Google Scholar] [CrossRef]
  50. Kaminska, A.; Duzynska, A.; Berkowski, M.; Trushkin, S.; Suchocki, A. Pressure-induced luminescence of cerium-doped gadolinium gallium garnet crystal. Phys. Rev. B 2012, 85, 155111. [Google Scholar] [CrossRef]
  51. Ma, Z.; Zhou, J.; Zhang, J.; Zeng, S.; Zhou, H.; Smith, A.T.; Wang, W.; Sun, L.; Wang, Z. Mechanics-induced triple-mode anticounterfeiting and moving tactile sensing by simultaneously utilizing instantaneous and persistent mechanoluminescence. Mater. Horizons 2019, 6, 2003–2008. [Google Scholar] [CrossRef]
  52. Gildenburg, V.B.; Pavlichenko, I.A. High contrast periodic plasma pattern formation during the laser-induced breakdown in transparent dielectric. Phys. Plasmas 2017, 24, 122306. [Google Scholar] [CrossRef]
  53. Kelton, K. Crystal Nucleation in Liquids and Glasses. Solid State Physics 1991, 45, 75–177. [Google Scholar] [CrossRef]
  54. Balibar, S.; Caupin, F. Nucleation of crystals from their liquid phase. Comptes Rendus Phys. 2006, 7, 988–999. [Google Scholar] [CrossRef]
  55. Lifshitz, I.; Slyozov, V. The kinetics of precipitation from supersaturated solid solutions. J. Phys. Chem. Solids 1961, 19, 35–50. [Google Scholar] [CrossRef]
  56. Johnson, B.R.; Kriven, W.M. Crystallization kinetics of yttrium aluminum garnet (Y3Al5O12). J. Mater. Res. 2001, 16, 1795–1805. [Google Scholar] [CrossRef]
  57. Savytskii, D.; Knorr, B.; Dierolf, V.; Jain, H. Demonstration of single crystal growth via solid-solid transformation of a glass. Sci. Rep. 2016, 6, 23324. [Google Scholar] [CrossRef] [PubMed] [Green Version]
Figure 1. (a) Differential thermal analysis (DTA) curve and (b) X-ray diffraction (XRD) patterns of the prepared 62.5Al2O3-37.5Y2O3 glass sample. The XRD pattern for the ample after annealing at 920 °C for 30 min is also shown in (b).
Crystals 10 01142 g001
Figure 2. The excitation-emission contour maps (a) before and (b) after crystallization of the Ce-YAG (yttrium aluminum garnet) glass by annealing at 920 °C for 30 min. The excitation and emission spectra are also shown in (c). Insets depict the photographs of the as-prepared Ce-YAG glass and the crystallized Ce-YAG glass, illuminated by visible or ultraviolet (UV) light (365 nm).
Crystals 10 01142 g002
Figure 3. (a) Schematic indicating the orientation of the laser propagation, polarization direction and writing direction. Symbols of kph, E and S indicate the orientation of the laser propagation, polarization direction and writing direction, respectively. Backscattering electron images on the polished sample in the plane perpendicular to the laser traces written by the femtosecond laser pulses with (b) 10 kHz, (c) 50 kHz, and (d) 250 kHz. The laser parameters were as follows: 800 nm, 40 fs, 1.0 µJ, 10,000 pulse/µm, 0.80 NA. (e) Raman spectra of the prepared 62.5Al2O3-37.5Y2O3 glass samples before and after laser irradiation with various pulse repetition rate. The reference Raman spectrum of the Y3Al5O12 crystal precipitated by annealing of undoped YAG glass is also shown.
Crystals 10 01142 g003
Figure 4. (a) Backscattering electron image (BEI) on the polished sample in the plane perpendicular to the laser traces written by the femtosecond laser pulses with 50 kHz. Symbols of E and kph indicate the writing laser polarization and propagation direction, respectively. Symbols of V and H indicate the direction relative to the nanograting structure orientation. (b) Cathodoluminescence (CL) intensity map at 550 nm on the same surface in (a). Green arrow indicates the measurement point of CL spectrum in (c). Dotted white line indicates the measurement position of CL intensity profile in (d). (e) Plots of the emission intensities using confocal fluorescence microscope. Each polarization direction of the excitation light and the detection light was set to be horizontal (H) or vertical (V) with respect to the nanograting structure orientation. The arrows in (d) are guides for the eyes.
Crystals 10 01142 g004
Figure 5. (a) Photoluminescence (PL) spectra of the crystallized regions induced by the femtosecond laser pulses with various pulse repetition rates. The laser parameters were as follows: 800 nm, 40 fs, 1.0 µJ, 0.80 NA. For irradiating the same number of pulses per unit area, the writing speed was adjusted. (b) Pulse width dependence of the PL intensity in the crystallized region. The Ep or the Pp was set to be 1.0 µJ, 1.25 × 10⁷ W, respectively. (c) Pulse repetition rate dependence of the PL intensity as a function of the pulse energy. The pulse width was set to be 40 fs.
Crystals 10 01142 g005
Figure 6. (a) Plots of PL intensity of the laser-modified region as a function of the pulse energy after annealing at (a) 300 °C, (b) 500 °C, (c) 700 °C for 30 min. The PL intensity was normalized as the ratio of the intensity before and after thermal treatment ( R = I PL anneal / I PL laser ). Dotted line (R = 1) indicates there is no change in the PL intensity before and after thermal treatment.
Crystals 10 01142 g006
Table 1. PL intensity ratios before and after the laser irradiation.
Repetition Rate (kHz)PL Intensity Ratio 1
106
5038
250198
1 The PL intensity at 590 nm from the modified region was normalized by that for the pristine Ce-YAG glass.
Publisher’s Note: MDPI stays neutral with regard to jurisdictional claims in published maps and institutional affiliations.

