Abstract
We report on space-selective crystallization of congruent and polar Sr2TiSi2O8 crystals in a stoichiometric SrO-TiO2-SiO2 glass induced by (1030 nm, 300 fs) femtosecond laser irradiation. This allows us to compare with non-congruent laser-induced crystallization of polar LiNbO3 in non-stoichiometric Li2O-Nb2O5-SiO2 glass and gain information on the mechanism of nanocrystals orientation with the laser polarization that we pointed out previously. Using scanning electron microscopy (SEM), second harmonic generation (SHG), and electron backscattered diffraction (EBSD), we studied the laser-induced crystallization according to the laser processing parameters (pulse energy, pulse repetition rate, scanning speed). We found (1) a domain where the laser track is filled with crystals not perfectly textured (low energy), (2) a domain where an amorphous volume remains surrounded by a crystallized shell (high energy). This arises from Sr out-diffusion and may give rise to the crystallization of both SrTiO3 and Sr2TiSi2O8 phases at low speed. In the one-phase domain (at higher speed), the possibility to elaborate a tube with a perfect Fresnoite texture is found. A significant difference in size and morphology whereas the crystallization threshold remains similar is discussed based on glass thermal properties. Contrarily to Li2O-Nb2O5-SiO2 (LNS) glass, no domain of oriented nanocrystallization controlled by the laser polarization has been found in SrO-TiO2-SiO2 (STS) glass, which is attributed to the larger crystallization speed in STS glass. No nanogratings have also been found that is likely due to the congruency of the glass.
1. Introduction
Materials functionalized by non-linear crystals exhibiting second harmonic generation (SHG) effect have gained rapidly increasing attention due to their wide potential applications in various optical devices over the past two decades [1,2,3]. Crystallization of glass is one of the easy and low-cost techniques to explore and fabricate new nonlinear optical materials for nano and microphotonics. Up to now, several methods, including thermal gradient [4], ultrasonic surface treatment [5], and continuous-wave laser irradiation [6,7], have been proposed to facilitate a controlled crystallization. However, these methods do not allow the control of the crystals’ space distribution in volume, whereas it is a key point for the applications in integrated optics. When using Continuous wave (CW) laser, the light absorption is single-photon and usually doping the glass with a transition metal or rare-earth is necessary ([8]), resulting in surface or shallow modifications.
On the contrary, femtosecond (fs) laser has been proved as a powerful tool to induce three-dimensional crystallization inside glasses. For example, in 2000, Miura et al. [9] were one of the first to use an 800 nm fs laser to induce β-BaB2O4 crystal inside 47.5BaO-5Al2O3-47.5B2O3 glass. Similar results were then reported in BaO-TiO2-SiO2 glass for inducing Fresnoite crystallization by Dai et al. in 2007 [10] and followed by Stone et al. [11] in 2009, succeeding in direct-writing of the ferroelectric single-crystal waveguide of LaBGeO5 from a glass system of the same composition. Then, a decade ago, our research group and others have also reported the three-dimensional growth of ferroelectric LiNbO3 crystals [12] that crystallize non-congruently inside Li2O-Nb2O5-SiO2 glasses [13,14,15]. LiNbO3 exhibits a strong anisotropy with a non-center symmetric space group R3c. It is polar along the trigonal axis and thus shows the maximum non-linear optical property in this direction. It is a uniaxial crystal but with the largest refractive index being perpendicular to the polar axis [16]. With those properties, we showed it is possible to control the orientation of LiNbO3 nanocrystals appearing at low fs pulse energy with the laser polarization [17]. This was a breakthrough in material science, whereas, at high pulse energy, the crystallization grains are larger with the polar axis directed along the laser scanning direction irrespective of the laser polarization orientation, as it is the case in many publications [7,8].
One question motivating this work was to see if such a possibility to orientate nanocrystals can be found in other glass systems and draw out conclusions about the mechanism and other compounds. As we mentioned above, Ba-Fresnoite has been already investigated by Dai et al. [10]. A quite recent review reports the various properties of the Fresnoite compounds [18]. Their space group is P4bm, tetragonal, and non-center symmetric, but even if they exhibit a polar axis and have strong nonlinear optical properties, they are not ferro-electric but only pyro-electric. In addition, Fresnoite is a uniaxial structure with a large refractive index perpendicular to the polar axis [19] as for LiNbO3. There are several minerals with Fresnoite structure. The original one is Ba2TiSi2O8, but others are Ba2Ti(Ge/Si)2O8 or Sr2TiSi2O8. They can be obtained from glasses of the same composition in a congruent way contrasting with LiNbO3 from Li2O-Nb2O5-SiO2 (LNS) glasses [19]. From these compounds, we chose to test Sr-Fresnoite possessing a remarkable second-order nonlinear coefficient [20]. Its melting temperature is close to the one of LiNbO3, i.e., around 1257 and 1312 °C. The glass transition temperature is higher for SrO-TiO2-SiO2 (STS) glass by about two hundred °C, but the nucleation and growth seem much more efficient [18,21].
Dai et al. [22] used a high repetition rate fs laser to induce Sr2TiSi2O8 crystal arbitrarily inside a stoichiometric SrO-TiO2-SiO2 glass. This is the usual condition for controlling the average temperature in space and time. Note we made some preliminary investigations in 33.3SrO-16.7TiO2-50SiO2 glass already several years ago [23]. Here, we present a much more complete description of the crystallization morphology according to pulse energy, pulse repetition rate, and beam scanning speed for looking if nanocrystals elaboration conditions can be found. In this respect, we extend the above works and investigate the influence of laser irradiation parameters on the size, distribution, and phase of photo-induced crystals in 40SrO-20TiO2-40SiO2 (so called STS glass in the following).
2. Materials and Methods
2.1. Preparation of Samples
Samples were synthesized by the conventional melt-quenching technique using SrCO3 (99.95%), TiO2 (99.9%), and SiO2 (99.9%) as raw materials. Well-mixed reagents were melted in a Pt crucible at 1450 °C for roughly 2 h. Then, the obtained glass melts were poured onto a carbon plate preheated at 200 °C. Then, annealing was performed at 650 °C for 12 h to release cooling stresses. The glasses were then cut into 10 mm × 10 mm × 1.5 mm-sized pieces and mirror-polished.
2.2. Laser Irradiation and Material Characterization
A Yb-doped fiber amplifying fs laser system (Satsuma, Amplitude Systèmes Ltd.), working at 1030 nm, was used as a light source to irradiate below the glass surface by moving the converging aspheric lens (0.6 NA) 150 μm towards the sample after focusing at the surface of it. The other laser parameters were: repetition rate 300 kHz, pulse duration 300 fs, pulse energy 0.1–3 μJ, scanning speed 3–20 μm/s, laser polarization parallel to the scanning direction. After writing pairs of lines, the sample was cleaved along the plane perpendicular to the written lines, polished to optical quality, and subsequently etched in 2% hydrogen fluoride acid for 30 s. Then a field-emission gun scanning electron microscope (ZEISS SUPRA 55 VP) was used for imaging and analyzing the crystal orientation (electron backscattered diffraction (EBSD)) in the cross-section of the laser lines. The chemical analysis energy-dispersive X-ray spectroscopy (EDS) also was used by the same system to evaluate the compositional variation caused by laser irradiation. Second-harmonic generation (SHG) microscopy measurements were carried out in the same experimental setup at 1030 nm, except the focusing was weaker and the applied pulse energy was below the threshold of glass modification. The probe polarization was linear, and the 1030 nm light was filtered before the CCD detector.
3. Results
A matrix of static irradiations was firstly performed to determine the crystallization boundary in STS glass. The results are shown in Figure 1a (green dots). For repetition rates below 200 kHz, no crystallization is observed. For repetition rates higher than 200 kHz, the minimum average pulse energy is around 1 μJ at 200 kHz (0.2 W in average) and reduced to 0.3 μJ at 400 kHz (0.12 W in average). From that, a proper frequency of 300 kHz was used for writing all the lines reported in this paper (with an average power larger than 0.16 W). We can notice that this average power is comparable to the one for crystallization in LNS glass [24].
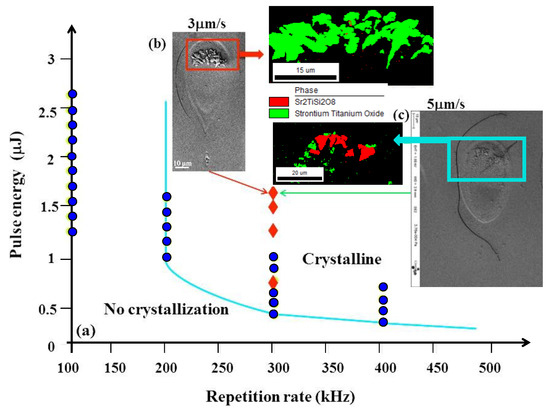
Figure 1.
(a) The different domains defined by pulse energy vs. repetition rate diagram in SrO-TiO2-SiO2 (STS) glass. SEM and electron backscattered diffraction (EBSD) images of written line cross-sections irradiated at 1.7 μJ with a scanning speed at (b) 3 μm/s and (c) 5 μm/s, respectively, are also shown. Blue dots in the picture indicate the static irradiation; red rhombi indicate the scanning mode in this work.
Figure 1b, corresponding to the cross-section of two laser traces written at 1.7 μJ pulse energy, with close low scanning speed, shows the now classical tear-like shape of the heat-affected volume (HAV) with the laser penetrating the material from the top. As usual with fs laser irradiation, we can see several interaction areas (also detectable in Figure 2). There is a zone surrounding the internal one and that remained amorphous. It corresponds to the first type of interaction with fs laser: a change of fictive temperature of the glass (a measure of the structural order of the glass, [25]) due to the thermal treatment imposed by the scanning beam [26]. Within this shell, the micrograph (in Figure 2) and EBSD analyses (in Figure 3) reveal crystals either in the head of the laser trace cross-section (at 1.5 μJ, for various scanning speed) or making up a shell surrounding a non-crystallized volume (at 1.3 μJ) or also a complete crystallized volume surrounded by a thin amorphous shell (at 0.7 μJ). The numerous experiments we performed showed that sizes are not strongly dependent on the scanning speed in the limited range investigated here (i.e., smaller than 20 μm/s). On the contrary, when laser power varied from 0.7 up to 1.7 μJ, the interaction volume clearly increased from ~5 to ~50 μm in width and ~18 to ~70 μm in length, respectively.
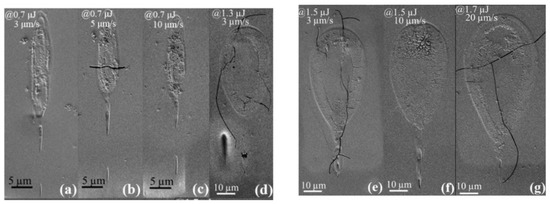
Figure 2.
SEM images of cross-sections of written lines irradiated at 0.7–1.7 μJ and 3–20 μm/s. At low energy (a–c), the heat-affected volume (HAV) is completely rough because crystallized. At higher energy (d–g), a shell is rough; at further higher energy (g), the head is further crystallized.
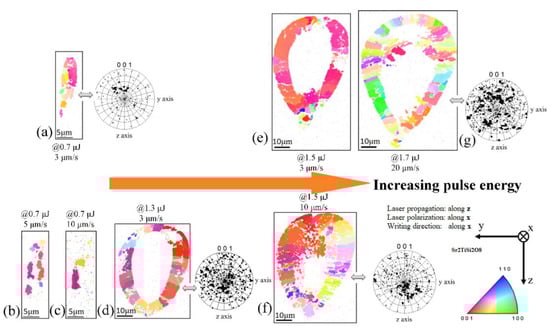
Figure 3.
EBSD inverse pole images of written line cross-sections irradiated at 0.7–1.7 μJ and 3–20 μm/s writing velocity, coding the crystal orientation along x-axis. The pole figures give the angular distribution of the polar axis. The scanning direction and the laser polarization x are at the center of the pole figure. (a–g): morphology of the line cross-sections for increasing pulse energy and scanning speed; 0.7 μJ ((a) 3 μm/s, (b) 5 μm/s, (c) 10 μm/s), 1.3 μJ (d), 1.5 μJ ((e) 3 μm/s, (f) 10 μm/s), 1.7 μJ (g).
These observations can be summed up as follows:
- (1).
- At low pulse energy, the laser trace is completely crystallized in the Fresnoite system. The c-axis is rather well oriented in the direction of writing when the scanning speed is not too large, i.e., below a few μm/s.
- (2).
- Increasing the pulse energy, the size of the HAV increases dramatically and a crystallized shell surrounds an amorphous volume. In 3D, this defines an amorphous tube with crystallized walls. Again, the Fresnoite crystals are rather well oriented with c-axis aligned in the direction of beam scanning.
- (3).
- Increasing further the pulse energy (1.7 μJ at 20 μm/s or 1.5 μJ at 10 μm/s), the top of the tube is partially filled (see Figure 3g).
- (4).
- We note that the Fresnoite crystal texture with c-axis in the direction of scanning is deteriorated for large scanning speed (see Figure 3g).
The <001> pole figures are employed to display the degree of preferred orientation in crystal lines. For 0.7–1.3–1.5 μJ pulse energy, low scanning speed (3 μm/s), most of the crystalline matter is oriented with the polar axis in the scanning direction with a tilted angle for lower pulse energy (Figure 3d–f). When scanning speed is increased, whatever the pulse energy, the crystal texture becomes disordered (see the inverse pole figures (IPF) and pole figures in Figure 3f–g).
- (5).
- At high energy but low speed, a SrTiO3 phase appears in the top of the HAV, mixed with Fresnoite and may reach about 50% of the volume.
Second harmonic generation (SHG) efficiency results from the texturation of non-linear polycrystals based on Fresnoite. The maximum of SHG is obtained when probing laser linear polarization is along the crystal polar axis. It is, therefore, a kind of measurement of crystal ordering that should be consistent with the pole figure of the EBSD map. Figure 4 shows the normalized SH intensity of crystal lines (irradiated at different pulse energies) as a function of the probing laser polarization angle. The intensity maximum on all curves is around 0° excepted at the lowest energy for which doubt can remain. The intensity minima are around 90° for the highest energy, whereas for the smallest energy, the curve seems shifted in one direction. It is worth to note that SHG contrast defined by (SHGmax − SHGmin)/(SHGmax + SHGmin), is the smallest at high energy, whereas it is quite large for the smallest energy. It is about 42% at 0.7 μJ@3 μm/s, 12.9% at 1.3 μJ@3 μm/s, 20% at 1.5 μJ@3 μm/s, 16.8% at 1.7 μJ@20 μm/s, indicating a weaker texturation at high energy. It seems thus that there are only one texture (polar c-axis in the direction of writing, mainly at low energy) and a large part of random orientation at higher pulse energy. This is quite different from what occurs in LNS glass for which there are two textures, including one that is perpendicular to the direction of the polarization [27]. The angle shift we observe at low energy may be due to an effect of the Pulse Front tilt, an effect extensively described in Reference [28]. In conclusion, low energy with low writing speed favored the formation of oriented crystals along the writing direction, while increased pulse energy at high writing speed mainly induced randomly oriented crystals. This is consistent with EBSD results shown in Figure 3.

Figure 4.
Probe polarization angle dependence of SH intensity of the laser lines written at 0.7 μJ (red), 1.3 μJ (pink), 1.5 μJ (yellow), and 1.7 μJ (blue); the scanning direction is at 0°; laser polarization is linear and parallel to x, the scanning direction.
An elemental redistribution was also discovered after irradiation in STS glass by energy-dispersive X-ray spectroscopy (EDS), as shown in Figure 5. The relative compositional fluctuation for Sr element indicates a tendency to migrate towards the crystallized region, whereas Si element preferred to concentrate in the amorphous zone at the center of the interaction volume. No apparent composition variation for Ti elements is detected. It has been published that the thermal gradient determined the elemental migration tendency in glass [29,30]. In agreement with the literature, we observe that network formers (like Si element) concentrate at the center, whereas the network modifiers, alkalin, and earth alkaline (like Sr element) migrate out.
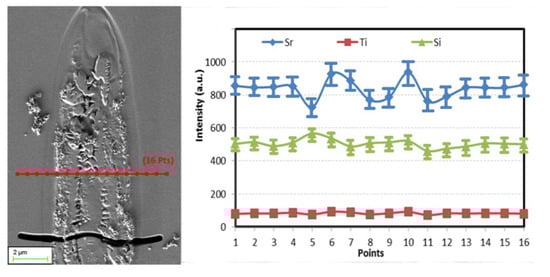
Figure 5.
SEM image and energy-dispersive X-ray spectroscopy (EDS) line profile through a laser line cross-section irradiated at 0.7 μJ and 5 μm/s. The measurement error is about 10%.
4. Discussion
First of all, we can be surprised to see that the lowest pulse energy for crystallization in STS is close to the one for LNS glass (0.12–0.2 W for STS and 0.16 W for LNS glass), whereas the nucleation rate is known to be much faster for STS glass [8]. So, it seems that the nucleation rate is not the limitation in the related crystallization process. We can already hypothesize that the temperature field and its temporal evolution are the main parameters in the process.
When a fs laser beam is tightly focused on glasses, the laser intensity is high enough to enable nonlinear photoionization that relaxes mostly by electron–phonon coupling creating some local heating. The energy carried by the laser beam is thus delivered to the material at the focal volume and potentially cumulates pulse after pulse. Then, the heat diffuses away from that volume and the temperature that was very high in the focal volume after a few 10′s ps decreases until the next pulse. If the period between two consecutive pulses is much larger than the diffusion time τD = ω02/4DT (where ω0 is the beam waist radius and DT the thermal diffusivity), ca. larger than 100.τD, (the contribution of one pulse to the next one is 103 times smaller) there is no heat accumulation and we can admit that the time at high temperature is too small for inducing any phase transformation. On the contrary, when the repetition rate is large enough, the period of time between consecutive pulses may be much smaller than 100.τD, resulting in heat accumulation. In these conditions, the T distribution changes its spatial and temporal shape mainly by broadening for radius larger than a few ω0 from the beam [31]. If we define an average temperature at a point of the material where tn is the time of the nth pulse, by: where τ is the period of the pulse, it evolves until a stationary state [31,32,33]. The time for that is also of about 100 τD. This yields a temperature distribution in space that appears to be a bell-shaped curve around the beam. At a pulse repetition rate large enough (ca. >30 MHz for STS glass), it approaches the T distribution for a CW laser. In that case, the maximum T is defined by with E the pulse energy, f the pulse repetition rate, and κ the thermal conductivity. On the other hand, as a first approximation, the shape of the function is defined only by the absorption coefficient (here a multiphoton coefficient) [34]. The width is just defined by the beam width but its shape is affected by the order of the multiphoton process that is highly non-linear. On the opposite, the T distribution associated with one pulse is quite different: the maximum temperature is given by with ρ the mass density, Cp the heat capacity, and α the absorption coefficient (here multiphoton). Opposite to the CW case, the shape of this curve in time is defined by the thermal diffusion coefficient [35], e.g., the width is proportional to DT. Of course, when the repetition rate f is intermediate, the T distribution shape is also intermediate. Fortunately, whatever the repetition rate, the shape is not distorted with the scanning provided that the speed is much smaller than the heat diffusion speed that we can estimate from the characteristic time τD for the heat to diffuse out of the waist, i.e., 4 DT/ω0 (ca. a few m/s), which is our case as the effective scanning speed for crystallization is smaller than 100 μm/s.
So the average temperature space and time distributions can be controlled and used for space-selective crystallization, which was described in Reference [16]. In this paper, from what we have said above, the steady-state is reached on around 12 pulse periods for LNS glass and 1 for STS one. Considering a point in the material at some distance of the center of the T bell shape, it experiences an increase of T followed by a subsequent decrease controlled by the heat diffusion coefficient in our conditions that we call thermal treatment curve, quoted TTC. If T and scanning speed are suitable, some phase transformations can occur. The volume of the material where this happens defines the heat-affected volume (HAV). There are several cases that depend on the amplitude of the TTC.
(a) When the pulse energy is quite low (a few 0.1 μJ) but above the threshold for observing crystallization, Tmax can be nevertheless lower than the melting temperature of the Fresnoite crystal, i.e., 1312 °C [36]. The TTC may then cross the crystallization domain as it is exemplified in Figure 6b, whereas Figure 6a gives a classic definition of TTT (Temperature–Time Transformation) and CCT (Continuous Cooling Transformation) curves. So, the crystallization begins with homogeneous nucleation (the lowest side of the domain) and then goes on crystal growing (the highest side). This is achieved at any place of the HAV and may form a complete crystallized volume. Its size is comparable to the laser beam size as it is demonstrated in Reference [16]. Note that there is homogeneous nucleation but the growth of the nuclei is favored when their c-axis are oriented in the direction of scanning because c-axis exhibits the fastest growth rate in such a structure [37] and aligned with the largest gradient (like in the method of single crystal growth by floating zone).
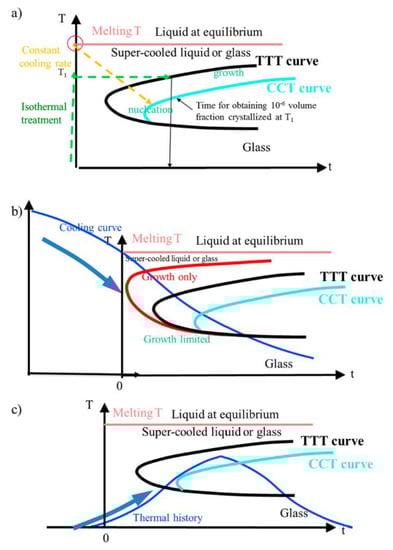
Figure 6.
(a) The temperature–time transformation (TTT) and continuous cooling transformation (CCT) curves (CCT curve appears shifted from the TTT curve a little to the downward right. This is because the lower growth rate is integrated during the cooling process from the melt to a given T. Thus, the time required for obtaining the same amount (e.g., 10−6) is larger); (b) position of the thermal treatment curve (TTC) for places experiencing a TTC with a maximum average T larger than Tm. The red curve corresponds to the growth rate only. It is applicable when nucleation sites already exist; (c) position of the TTC for places experiencing maximum temperature smaller than melting temperature (Figure 15 from Reference [16]).
When the scanning speed is increased, the previously nucleated nanocrystals during the T increase has not enough time for growing. Crystals with other orientations appear, therefore, if there is no other driving force that can be involved. Here, with STS we do not observe another texture than the one cited above, but in LNS glass we pointed out an orientable texture controlled with the laser polarization [17]. These two distinct behaviors are likely due to the large difference in nucleation and growth speeds: a few μm/s in LNS and at least two orders of magnitude higher for STS ([18,21]).
(b) When the pulse energy is increased, a part of the temperature distribution may overcome the melting temperature (i.e., Tm ≈ 1350 °C) and a stable liquid phase appears. In such a case, the TTC part to take into account starts from Tm (see Figure 6c). It is only decreasing (cooling curve) and then may cross the crystallization domain from the growth side (the top of the domain, in fact). The crystallization is thus non-homogeneous and is very sensitive to interfaces with the peripheral part of the HAV that is already crystallized because it started sooner in the course of the scanning. In the case of LNS glass, the center is thus filled in by crystal having the orientation of the surrounding crystallized region [38,39]). However, here in STS glass, the elemental migration is effective and leads to a decrease of the Sr concentration in the center of the HAV and an increase of Si content, which modify the crystallization temperature and time conditions. As we observed an amorphous state in this region, we have to conclude that this migration prevents the Fresnoite crystallization. Therefore, we conclude that the appearance of a crystallized shell marks the domain of homogeneous crystallization, so the domain with T < Tm and the interior boundary is the surface with T = Tm.
About the size of the heat-affected volume: Now if we compare the size of the heat-affected volume between STS and LNS glasses (see Figure 7), we find that the width and the length of the HAV are much larger for STS glass. As a matter of fact, they are defined by the size of the bell-shaped temperature distribution that is itself defined by several glass properties: the thermal conductivity, the heat capacity, the specific density, and thus the thermal diffusivity. Table 1 compares their values.
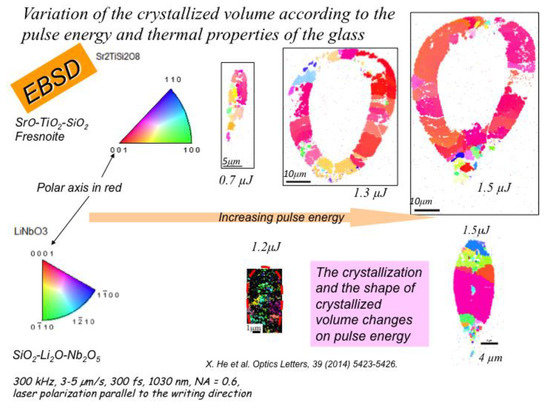
Figure 7.
Comparison of the size of the heat-affected volume in STS and LNS glasses.

Table 1.
Physico-chemical data for STS and LNS glasses.
However, these physico-chemical quantities are involved differently in the T distribution as we mentioned at the beginning of the discussion section. After a limited number of pulses corresponding to ca. 5.τD, the T distribution reaches a steady state that corresponds to the bell-shaped curve.
When the repetition rate is much smaller than 1/τD, the width of the T curve is defined by the thermal diffusivity. We note that the thermal diffusivity is 8 times larger in STS glass. The maximum T is defined by ρCp and the size of the irradiated volume (πw02/α, see above), and we note that ρCp is 1.56 times smaller for STS. About the irradiated volume, the focusing conditions mainly (with some material correction) define its width, but since it does not change a lot from glass to another, we can conclude it to be 3 μm in our conditions. The length or the height of the HAV (in the direction of the laser propagation) is more difficult to estimate. For that purpose, we can consider that the heat diffusion is isotropic from the beam, either along or perpendicular to the laser propagation axis. The characteristic length of diffusion is thus roughly the same either from the waist or from the multiphoton absorption length 1/α, which is around 13 μm for STS and 15 μm for LNS. This is quite realistic as their optical bandgap are similar (see Table 1) and their multiphoton ionization coefficient probably also, as their electronic structure are similar (p orbitals of oxygen for the top of the valence band and d orbital of Ti or Nb for the bottom of the conduction band).
If the repetition rate f was high enough in such a way the steady-state will approach the CW distribution, the HAV size would be just sensitive to α and we would expect the same size for both STS and LNS. In this case, as the T maximum is reversely proportional to the thermal conductivity κ, it would be 8 times smaller for STS than for LNS. This is clearly not the case. In addition, 1/τD is 28 MHz for STS and 3.6 MHz for LNS that should be compared to our repetition rate, i.e., 300 kHz. So, the T distribution at the steady-state (after a time of 100τD) for LNS is closer to CW regime but neither STS nor LNS is close enough to say that their width is not dependent on κ. On the other hand, as their absorption coefficients are close to each other, there is no difference in the width arising from this.
The conclusions are summed up in Figure 8. The maximum of T in the STS glass is higher than the one of the LNS glass due to Cpρ difference. The width of the T distribution of the STS glass is much larger due to the diffusion coefficient difference. The maximum of T for LNS is close to the melting T and the HAV is completely crystallized, whereas for STS a large part of the HAV is above the melting T that cannot crystallize due to Sr/Si migration. So, crystallization occurs only in the volume shell between Tg and Tm.
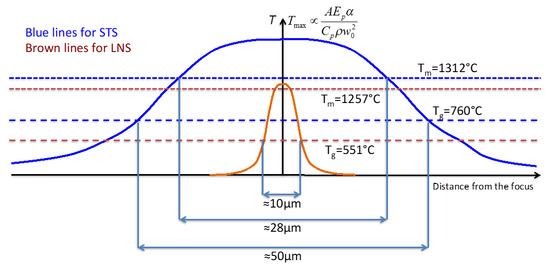
Figure 8.
Differences of the T distribution of STS and LNS glasses in the conditions of Figure 7. Sum-up of the discussion.
Of interest, it is worthy to note that the minimum energy Em for TTC to touch the crystallization domain can be estimated by saying that the maximum T of this curve should overcome Tg. So, Em scales as ρCpTg/α, which is close to each other within 30%. We have also pointed out that for high pulse energy and low speed (e.g., 1.7 μJ, 3 μm/s), a second phase appears (SrTiO3). We think that this is the result of Sr out-diffusion. Therefore, varying the fs laser parameters, induced crystallization in STS glass can produce a mixture of SrTiO3 and Sr2TiSi2O8 or pure Sr2TiSi2O8 crystals by adjusting laser parameters. Similar results were reported by Y. Yonesaki et al. [48].
Lastly, we can add also that we have not found any spure of nanograting (a kind of organized submicrostructure pointed out in silica [49] by P. Kazansky) that found in many compounds nowadays [50] and that we found in LNS glass [51]. We can hypothesize that the reason is the congruency of the glass in the case of STS.
5. Conclusions
In summary, systematic studies of laser-induced crystallization according to pulse energy, repetition rate, and scanning speed have been achieved in STS glass (2SrO-1TiO2-2SiO2) and compared to results for LNS glass (1Li2O-1Nb2O5-1SiO2). Depending on these laser processing parameters, crystallization differs in size, morphology, texturation, and also in phase composition, i.e., distribution to the crystalline phases (both SrTiO3 and Sr2TiSi2O8 phases are precipitated for high energy and low speed). When only the Fresnoite phase is detected in the heat-affected volume, this one is fully crystallized at low energy, whereas an amorphous volume remains surrounded by a crystallized shell at higher energy. This is quite different from what occurs for LNS glass. We demonstrate that both thermal conditions (due to the physico-chemical properties difference) and Sr/Si chemical migration under the thermal gradient play important roles in this morphology. The crystallized shell is generally disordered but, for moderate speed (≈3 μm/s), we observe the appearance of a texture where c-axis is aligned in the direction of scanning (this is observed frequently using CW or pulsed lasers and interpreted by the influence of the movement on the temperature gradient). This leads to the elaboration of a tube made of non-linear optical crystals having the largest SHG efficiency along the tube axis (it is also the same for pyro and piezo-electric properties). We believed that it would be an optical waveguide structure but as Sr2TiSi2O8 (3.887 g/cm−3 [52] in STS glass (3.600 g/cm−3 [53]) has probably a larger refractive index that the inside of the tube, it is rather an anti-guiding structure. Otherwise, Fresnoite crystal is also polar but not ferroelectric and as the laser-induced crystallization is like the drawing in the floating zone method, the tube is probably not a waveguide but nevertheless an interesting structure for fabricating integrated nonlinear optical devices.
Lastly, at this stage of the study, we have not found a domain of oriented nanocrystallization controlled by the laser polarization, as we reported for LNS glass. If such a domain exists, it would be located between 0.3 and 0.7 μJ at 300 kHz for scanning speed high enough. Just above the crystallization threshold, there is nanocrystallization in LNS glass filling partially the HAV, whereas in STS the HAV is fully crystallized. This arises likely from the nucleation speed difference between the two families (a few μm/s in LNS, whereas it is at least two orders of magnitude higher in STS [18]). The growth rates are also with the same trend [21]. Therefore, the effect of laser polarization acting on nanocrystals was not pointed out in STS glass.
Author Contributions
Conceptualization, X.H. and B.P.; methodology, B.P.; investigation, X.H. and F.B.; original draft preparation and writing, X.H. and B.P.; review and editing and project administration, B.P. and M.L.; supervision and funding acquisition, Q.L. and B.P. All authors have read and agreed to the published version of the manuscript.
Funding
This research work was financially supported by the National Natural Science Foundation of China (51572202, 61604110) and Shenzhen basic research (JCYJ20150417142356651). It was achieved in the frame of the FLAG (Femtosecond Laser Application in Glasses) consortium project with the support of the Agence Nationale pour la Recherche (ANR-09-BLAN-0172-01) and the French Foreign Office (Eiffel program).
Conflicts of Interest
The authors declare no conflict of interest.
References
- Choi, J.; Bellec, M.; Royon, A.; Bourhis, K.; Papon, G.; Cardinal, T.; Canioni, L.; Richardson, M. Three-dimensional direct femtosecond laser writing of second-order nonlinearities in glass. Opt. Lett. 2012, 37, 1029–1031. [Google Scholar] [CrossRef] [PubMed]
- Liu, Q.; Gan, F.; Zhao, X.; Tanaka, K.; Narazaki, A.; Hirao, K. Second-harmonic generation in Ge20As25S55 glass irradiated by an electron beam. Opt. Lett. 2001, 26, 1347–1349. [Google Scholar] [CrossRef] [PubMed]
- Takahashi, Y.; Benino, Y.; Fujiwara, T.; Komatsu, T. Optical Second Order Nonlinearity of Transparent Ba2TiGe2O8 Crystallized Glasses. Appl. Phys. Lett. 2002, 81, 223. [Google Scholar] [CrossRef]
- Ochi, Y.; Meguro, T.; Kakegawa, K. Orientated crystallization of fresnoite glass-ceramics by using a thermal gradient. J. Eur. Ceram. Soc. 2006, 26, 627–630. [Google Scholar] [CrossRef]
- Ding, Y.; Masuda, N.; Miura, Y.; Osaka, A. Preparation of polar oriented Sr2TiSi2O8 films by surface crystallization of glass and second harmonic generation. J. Non-Cryst. Solids 1996, 203, 88–95. [Google Scholar] [CrossRef]
- Oikawa, T.; Honma, T.; Komatsu, T. Laser-induced crystal growth of nonlinear optical Ba3Ti3O6(BO3)2 on glass surface. Cryst. Res. Technol. 2008, 43, 1253–1257. [Google Scholar] [CrossRef]
- Komatsu, T.; Honma, T. Nucleation and Crystal Growth in Laser-Patterned Lines in Glasses. Front. Mater. 2016, 3. [Google Scholar] [CrossRef]
- Komatsu, T. Design and control of crystallization in oxide glasses. J. Non-Cryst. Solids 2015, 428, 156–175. [Google Scholar] [CrossRef]
- Miura, K.; Qiu, J.; Mitsuyu, T.; Hirao, K. Space-selective growth of frequency-conversion crystals in glasses with ultrashort infrared laser pulses. Opt. Lett. 2000, 25, 408–410. [Google Scholar] [CrossRef]
- Dai, Y.; Zhu, B.; Qiu, J.R.; Ma, H.L.; Lu, B.; Cao, S.X.; Yu, B.K. Direct writing three-dimensional Ba2TiSi2O8 crystalline pattern in glass with ultrashort pulse laser. Appl. Phys. Lett. 2007, 90, 181109. [Google Scholar] [CrossRef]
- Stone, A.; Jain, H.; Dierolf, V.; Sakakura, M.; Kashyap, R. Direct Laser-Writing of Ferroelectric Single-Crystal Waveguide Architectures in Glass for 3D Integrated Optics. Sci. Rep. 2015, 5, 10391. [Google Scholar] [CrossRef]
- Svaasand, L.O.; Eriksrud, M.; Nakken, G.; Grande, A.P. Solid-solution range of LiNbO3. J. Cryst. Growth 1974, 22, 230–232. [Google Scholar] [CrossRef]
- Cao, J.; Mazerolles, L.; Lancry, M.; Brisset, F.; Poumellec, B. Modifications in lithium niobium silicate glass by femtosecond laser direct writing: Morphology, crystallization, and nanostructure. J. Opt. Soc. Am. B 2017, 34, 160–168. [Google Scholar] [CrossRef]
- Fan, C. Contribution to Nano or Micro Crystallization Induction in Silica-Based Glass by Femtosecond Laser Irradiation. Ph.D. Thesis, Universite Paris-saclay, Orsay, France, 2012. [Google Scholar]
- Musgraves, J.D.; Richardson, K.; Jain, H. Laser-induced structural modification, its mechanisms, and applications in glassy optical materials. Opt. Mater. Express 2011, 1, 921–935. [Google Scholar] [CrossRef]
- Cao, J.; Lancry, M.; Brisset, F.; Mazerolles, L.; Saint-Martin, R.; Poumellec, B. Femtosecond Laser-Induced Crystallization in Glasses: Growth Dynamics for Orientable Nanostructure and Nanocrystallization. Cryst. Growth Des. 2019, 19, 2189–2205. [Google Scholar] [CrossRef]
- Cao, J.; Poumellec, B.; Brisset, F.; Helbert, A.L.; Lancry, M. Tunable angular-dependent second-harmonic generation in glass by controlling femtosecond laser polarization. J. Opt. Soc. Am. B 2016, 33, 741–747. [Google Scholar] [CrossRef]
- Wisniewski, W.; Thieme, K.; Rüssel, C. Fresnoite glass-ceramics—A review. Prog. Mater. Sci. 2018, 98, 68–107. [Google Scholar] [CrossRef]
- Lipat’ev, A.S.; Moiseev, I.A.; Lotarev, S.V.; Lipat’eva, T.O.; Presnyakov, M.Y.; Vasetskii, A.M.; Sigaev, V.N. Femtosecond Laser Assisted Local Crystallization of Barium-Titanate-Silicate Glass. Glass Ceram. 2018, 74, 423–427. [Google Scholar] [CrossRef]
- Höche, T.; Rüssel, C.; Neumann, W. Incommensurate modulations in Ba2TiSi2O8, Sr2TiSi2O8, and Ba2TiGe2O8. Solid State Commun. 1999, 110, 651–656. [Google Scholar] [CrossRef]
- Fokin, V.M.; Nascimento, M.L.F.; Zanotto, E.D. Correlation between maximum crystal growth rate and glass transition temperature of silicate glasses. J. Non-Cryst. Solids 2005, 351, 789–794. [Google Scholar] [CrossRef]
- Dai, Y.; Zhu, B.; Qiu, J.; Ma, H.; Lu, B.; Yu, B. Space-selective precipitation of functional crystals in glass by using a high repetition rate femtosecond laser. Chem. Phys. Lett. 2007, 443, 253–257. [Google Scholar] [CrossRef]
- He, X.; Poumellec, B.; Liu, Q.; Brisset, F.; Lancry, M. One-step photoinscription of asymmetrically oriented fresnoite-type crystals in glass by ultrafast laser. Opt. Lett. 2014, 39, 5423–5426. [Google Scholar] [CrossRef]
- He, X.; Fan, C.; Poumellec, B.; Liu, Q.; Zeng, H. Size-controlled oriented crystallization in SiO2-based glasses by femtosecond laser irradiation. J. Opt. Soc. Am. B 2014, 31, 376–381. [Google Scholar] [CrossRef]
- Ritland, H.N. Limitations of the Fictive Temperature Concept. J. Am. Ceram. Soc. 1956, 39, 403–406. [Google Scholar] [CrossRef]
- Poumellec, B.; Lancry, M.; Chahid-Erraji, A.; Kazansky, P.G. Modification thresholds in femtosecond laser processing of pure silica: Review of dependencies on laser parameters [Invited]. Opt. Mater. Express 2011, 1, 766–782. [Google Scholar] [CrossRef]
- Cao, J.; Poumellec, B.; Brisset, F.; Helbert, A.L.; Lancry, M. Angular Dependence of the Second Harmonic Generation Induced by Femtosecond Laser Irradiation in Silica-Based Glasses: Variation with Writing Speed and Pulse Energy. World J. Nano Sci. Eng. 2015, 5, 11. [Google Scholar] [CrossRef]
- Poumellec, B.; Lancry, M.; Desmarchelier, R.; Hervé, E.; Brisset, F.; Poulin, J.C. Asymmetric Orientational Writing in glass with femtosecond laser irradiation. Opt. Mater. Express 2013, 3, 1586–1599. [Google Scholar] [CrossRef]
- Zhang, F.; Tu, Z.; Du, X.; Zhang, H.; Qiu, J. Femtosecond laser induced migration of alkali ions in calcium silicate glasses. Mater. Lett. 2014, 137, 92–95. [Google Scholar] [CrossRef]
- Shimizu, M.; Sakakura, M.; Kanehira, S.; Nishi, M.; Miura, K. Formation Mechanism of Element Distribution in Glass Under Femtosecond Laser Irradiation. Opt. Lett. 2011, 36, 2161–2163. [Google Scholar] [CrossRef]
- Vogel, A.; Noack, J.; Hüttman, G.; Paltauf, G. Mechanisms of femtosecond laser nanosurgery of cells and tissues. Appl. Phys. B 2005, 81, 1015–1047. [Google Scholar] [CrossRef]
- Sanders, D.J. Temperature distributions produced by scanning Gaussian laser beams. Appl. Opt. 1984, 23, 30–35. [Google Scholar] [CrossRef]
- Miyamoto, I.; Horn, A.; Gottmann, J.; Wortmann, D.; Yoshino, F. Fusion Welding of Glass Using Femtosecond Laser Pulses with High-repetition Rates. J. Laser Micro Nanoeng. 2007, 2, 57–63. [Google Scholar] [CrossRef]
- Lax, M. Temperature rise induced by a laser beam. J. Appl. Phys. 1977, 48, 3919–3924. [Google Scholar] [CrossRef]
- Miyamoto, I.; Horn, A.; Gottmann, J. Local Melting of Glass Material and Its Application to Direct Fusion Welding by Ps-laser Pulses. J. Laser Micro Nanoeng. 2007, 2, 7–14. [Google Scholar] [CrossRef]
- Avramov, I.; Keding, R.; Rüssel, C. Crystallization kinetics and rigidity percolation in glass-forming melts. J. Non-Cryst. Solids 2000, 272, 147–153. [Google Scholar] [CrossRef]
- Wisniewski, W.; Patschger, M.; Russel, C. Sr-fresnoite surface crystallisation in a 2SrO center dot TiO2 center dot 2.75 SiO2 glass studied by EBSD. Crystengcomm 2012, 14, 5425–5433. [Google Scholar] [CrossRef]
- Cao, J.; Poumellec, B.; Brisset, F.; Lancry, M. Pulse energy dependence of refractive index change in lithium niobium silicate glass during femtosecond laser direct writing. Opt. Express 2018, 26, 7460–7474. [Google Scholar] [CrossRef]
- Stone, A.; Sakakura, M.; Shimotsuma, Y.; Miura, K.; Hirao, K.; Dierolf, V.; Jain, H. Femtosecond laser-writing of 3D crystal architecture in glass: Growth dynamics and morphological control. Mater. Des. 2018, 146, 228–238. [Google Scholar] [CrossRef]
- Inc. Chemical Catalog Company. Chemical Engineering Catalog, 12th ed.; The Chemical Catalog Company, Inc.: New York, NY, USA, 1927. [Google Scholar]
- Fang, Z.; Xiao, X.; Wang, X.; Ma, Z.; Lewis, E.; Farrell, G.; Wang, P.; Ren, J.; Guo, H.; Qiu, J. Glass-ceramic optical fiber containing Ba2TiSi2O8 nanocrystals for frequency conversion of lasers. Sci. Rep. 2017, 7, 44456. [Google Scholar] [CrossRef]
- Kingery, W.D. Thermal Conductivity: XII, Temperature Dependence of Conductivity for Single-Phase Ceramics. J. Am. Ceram. Soc. 1955, 38, 251–255. [Google Scholar] [CrossRef]
- Morgan, R.A.; Kang, K.I.; Hsu, C.C.; Koliopoulos, C.L.; Peyghambarian, N. Measurement of the thermal diffusivity of nonlinear anisotropic crystals using optical interferometry. Appl. Opt. 1987, 26, 5266–5271. [Google Scholar] [CrossRef] [PubMed]
- Vigouroux, H. Etude de Vitrocéramiques Optiques Pour le Doublement de Fréquence; University of Bordeaux: Bordeaux, France, 2012. [Google Scholar]
- Shimada, M.; Honma, T.; Komatsu, T. Laser patterning of oriented LiNbO3 crystal particle arrays in NiO-doped lithium niobium silicate glasses. Int. J. Appl. Glass Sci. 2018, 9, 518–529. [Google Scholar] [CrossRef]
- Li, Y.; Wang, Y.; Xu, X.; Yu, G.; Wang, N. Electronic Structures and Pr3+ Photoluminescence Characteristics in Fresnoite, Sr-Frenoite, and Ge-Frenoite. J. Am. Ceram. Soc. 2011, 94, 496–500. [Google Scholar] [CrossRef]
- Thierfelder, C.; Sanna, S.; Schindlmayr, A.; Schmidt, W. Do we know the band gap of lithium niobate? Phys. Status Solidi 2010, 7, 362–365. [Google Scholar] [CrossRef]
- Yonesaki, Y.; Kiyotaka, M.; Ryuhei, A.; Koji, F.; Kazuyuki, H. Space-selective precipitation of non-linear optical crystals inside silicate glasses using near-infrared femtosecond laser. J. Non-Cryst. Solids 2005, 351, 885–892. [Google Scholar] [CrossRef]
- Shimotsuma, Y.; Kazansky, P.G.; Qiu, J.R.; Hirao, K. Self-organized nanogratings in glass irradiated by ultrashort light pulses. Phys. Rev. Lett. 2003, 91, 247405. [Google Scholar] [CrossRef]
- Shimotsuma, Y.; Sakakura, M.; Miura, K. Photoinduced self-assembly of nanostructure. In Proceedings of the 77th JSAP Autumn Meeting, Niigata city, Japan, 13–16 September 2016; pp. 301–307. [Google Scholar]
- Cao, J.; Poumellec, B.; Mazerolles, L.; Brisset, F.; Helbert, A.L.; Surble, S.; He, X.; Lancry, M. Nanoscale Phase Separation in Lithium Niobium Silicate Glass by Femtosecond Laser Irradiation. J. Am. Ceram. Soc. 2017, 100, 115–124. [Google Scholar] [CrossRef]
- Höche, T.; Neumann, W.; Esmaeilzadeh, S.; Uecker, R.; Lentzen, M.; Rüssel, C. The Crystal Structure of Sr2TiSi2O8. J. Solid. State. Chem. 2002, 166, 15–23. [Google Scholar] [CrossRef]
- Halliyal, A.; Safari, S.; Bhalla, R.; Newnham, E.; Cross, L. Grain-Oriented Glass-Ceramics for Piezoelectric Devices. J. Am. Ceram. Soc. 1984, 67, 331–335. [Google Scholar] [CrossRef]
Publisher’s Note: MDPI stays neutral with regard to jurisdictional claims in published maps and institutional affiliations. |
© 2020 by the authors. Licensee MDPI, Basel, Switzerland. This article is an open access article distributed under the terms and conditions of the Creative Commons Attribution (CC BY) license (http://creativecommons.org/licenses/by/4.0/).