Article

Processing and Optical Properties of Eu-Doped Chloroborate Glass-Ceramic

National Institute of Materials Physics, 077125 Magurele, Romania
*
Author to whom correspondence should be addressed.
Crystals 2020, 10(12), 1101; https://doi.org/10.3390/cryst10121101
Submission received: 2 November 2020 / Revised: 23 November 2020 / Accepted: 30 November 2020 / Published: 1 December 2020
(This article belongs to the Special Issue Glass-Ceramics: Improving Glass Properties through Crystallization)

Abstract

:
An europium doped BaO–B2O3–BaCl2 chloroborate glass-ceramic containing a BaCl2 nanocrystalline phase was produced by melt-quenching followed by glass crystallization during annealing. Structural and morphological investigations using x-ray diffraction and scanning electron microscopy have shown fvBaCl2 nanocrystals of about tens of nm size accompanied by a smaller amount of the BaB2O4 crystalline phase. Photoluminescence spectra have indicated the reduction of Eu3+ to Eu2+ during processing in air or a reducing atmosphere. The spectra analysis showed the presence of Eu3+ ions in the borate glass matrix, while the Eu2+ were incorporated in both the BaCl2 nanocrystals and glass matrix. Thermoluminescence properties were due to the recombination of F(Cl) centers and Eu2+ related hole centers produced by irradiation within the BaCl2 nanocrystals. The color impression of the samples and the photoluminescence quantum efficiency were influenced by the glass processing.

Graphical Abstract

1. Introduction

Glass-ceramics are composite materials formed by a nano-crystalline phase dispersed within a glass matrix. The precursor glass is converted into a glass-ceramic during a subsequent annealing through a controlled nucleation and crystallization processes. Transparent glass-ceramics offer balanced properties between a glassy material and crystals. By proper doping with luminescent rare-earth (RE) ions, they can combine the fluorescence properties and optical transparency due to lack of scattering. The new optical functionalities added are very important for photonics related applications (optical amplifiers, optical waveguides, white LEDs, etc.) at the industrial scale ([1,2] and references therein).
Most studies have been focused on the preparation and characterization of RE-doped transparent oxyfluoride glass-ceramics containing nanocrystalline fluorides such as PbF2, CaF2, BaF2, LaF3, NaLaF4, etc. embedded in an aluminosilicate glass matrix ([3] and references therein). The thermal stability and chemical advantages of oxide glasses combine with those of the fluoride environment of dopant ions that assures a high luminescence efficiency because of low phonon energies and low non-radiative decay rates. Transparent fluorozirconate-based glass-ceramics containing RE3+-doped BaCl2 nanocrystals represent new developments in the field, and their crystallization behavior [4,5] and optical properties have been investigated [6]. Eu2+-doped glass-ceramics are of special interest [7,8,9] because of their remarkable scintillating and x-ray storage phosphor properties as shown by the Eu2+-doped BaCl2 crystal [9,10,11]. Nevertheless, fluorozirconate glass synthesis is performed at relatively high temperature and controlled atmosphere, and therefore other glass matrix options have been considered such as such as borate glasses. The synthesis and crystallization properties of barium borate glass-ceramics in the BaO–B2O3 system have been studied, and their structural and optical properties related to the borate nanocrystals (BaB2O4, BaB4O7, Li2B4O7) [12,13,14,15] and BaCl2 [16,17] nanocrystals have been investigated.
The aim of the present study was to perform a structural and morphological investigation of the Eu-doped chloroborate glass ceramic in the BaO–B2O3–BaCl2 system and to evaluate the influence of the ceramization process on its optical properties: optical absorption, photoluminescence, and thermoluminescence.

2. Materials and Methods

2.1. Samples Preparation

Glass samples with the composition of (34BaO–30B2O3-28BaCl2-1Eu2O3) (mol%) [16] were prepared from high purity BaCO3, B2O3, BaCl2, and Eu2O3 precursors, as detailed in [11]. The constituent chemicals were carefully mixed, dried at 80 °C, and melted in a covered corundum crucible at 1130 °C in air for 1 h, followed by fast pouring onto a brass preheated plate. Then, in order to relinquish the inner stress, the glass samples were annealed for 1 h at 400 °C (i.e., below the glass temperature Tg of 500 °C (see thermal analysis section from below)). Glass ceramization has been obtained during subsequent annealing at different temperatures above Tg for various times in air or reducing atmosphere (5H2–95Ar gas mixture). The initial glass was clear-transparent, but after annealing, it was converted to milky-white as a consequence of the crystallization processes evidenced by the XRD measurements.

2.2. Characterization Methods

For the thermal analysis by thermogravimetry (TG) and differential scanning calorimetry (DSC), we used a SETARAM Setsys Evolution 18 Thermal Analyzer in synthetic air (80% N2/20% O2) and a heating rate of 10 °C/min. Structural characterization by X-ray diffractometry (XRD) was carried out by using a BRUKER D8 ADVANCE type X-ray diffractometer in focusing geometry, equipped with copper target x-ray tube and LynxEye one-dimensional detector. The XRD pattern was recorded in the 20 to 60° range, with 0.04° step and 2 s integration time. For the phase composition analysis and crystallographic characteristic, we used the Powercell dedicated software [18]. The morphological characterizations of the samples were carried out by using a Zeiss MERLIN (Jena, Germany) Compact scanning electron microscope (SEM) with GEMINI column and equipped with an energy dispersive x-ray system (EDX) analyzer. The photoluminescence, excitation spectra, and photoluminescence decay curves were recorded at room temperature by using a FluoroMax 4P spectrophotometer (HORIBA Jobin Yvon, Kyoto, Japan); for the chromaticity and quantum efficiency analysis, we used the Quanta-Phy accessory. For thermoluminescence (TL) measurements, we used a Harshaw 3500 TL reader in the 50–350 °C temperature range with a heating rate of 2 °C/s. The TL measurements were performed after x-ray irradiation at room temperature for 30 min (using a copper anode at 40 kV and 40 mA) and storage for 25 min.

3. Results and Discussion

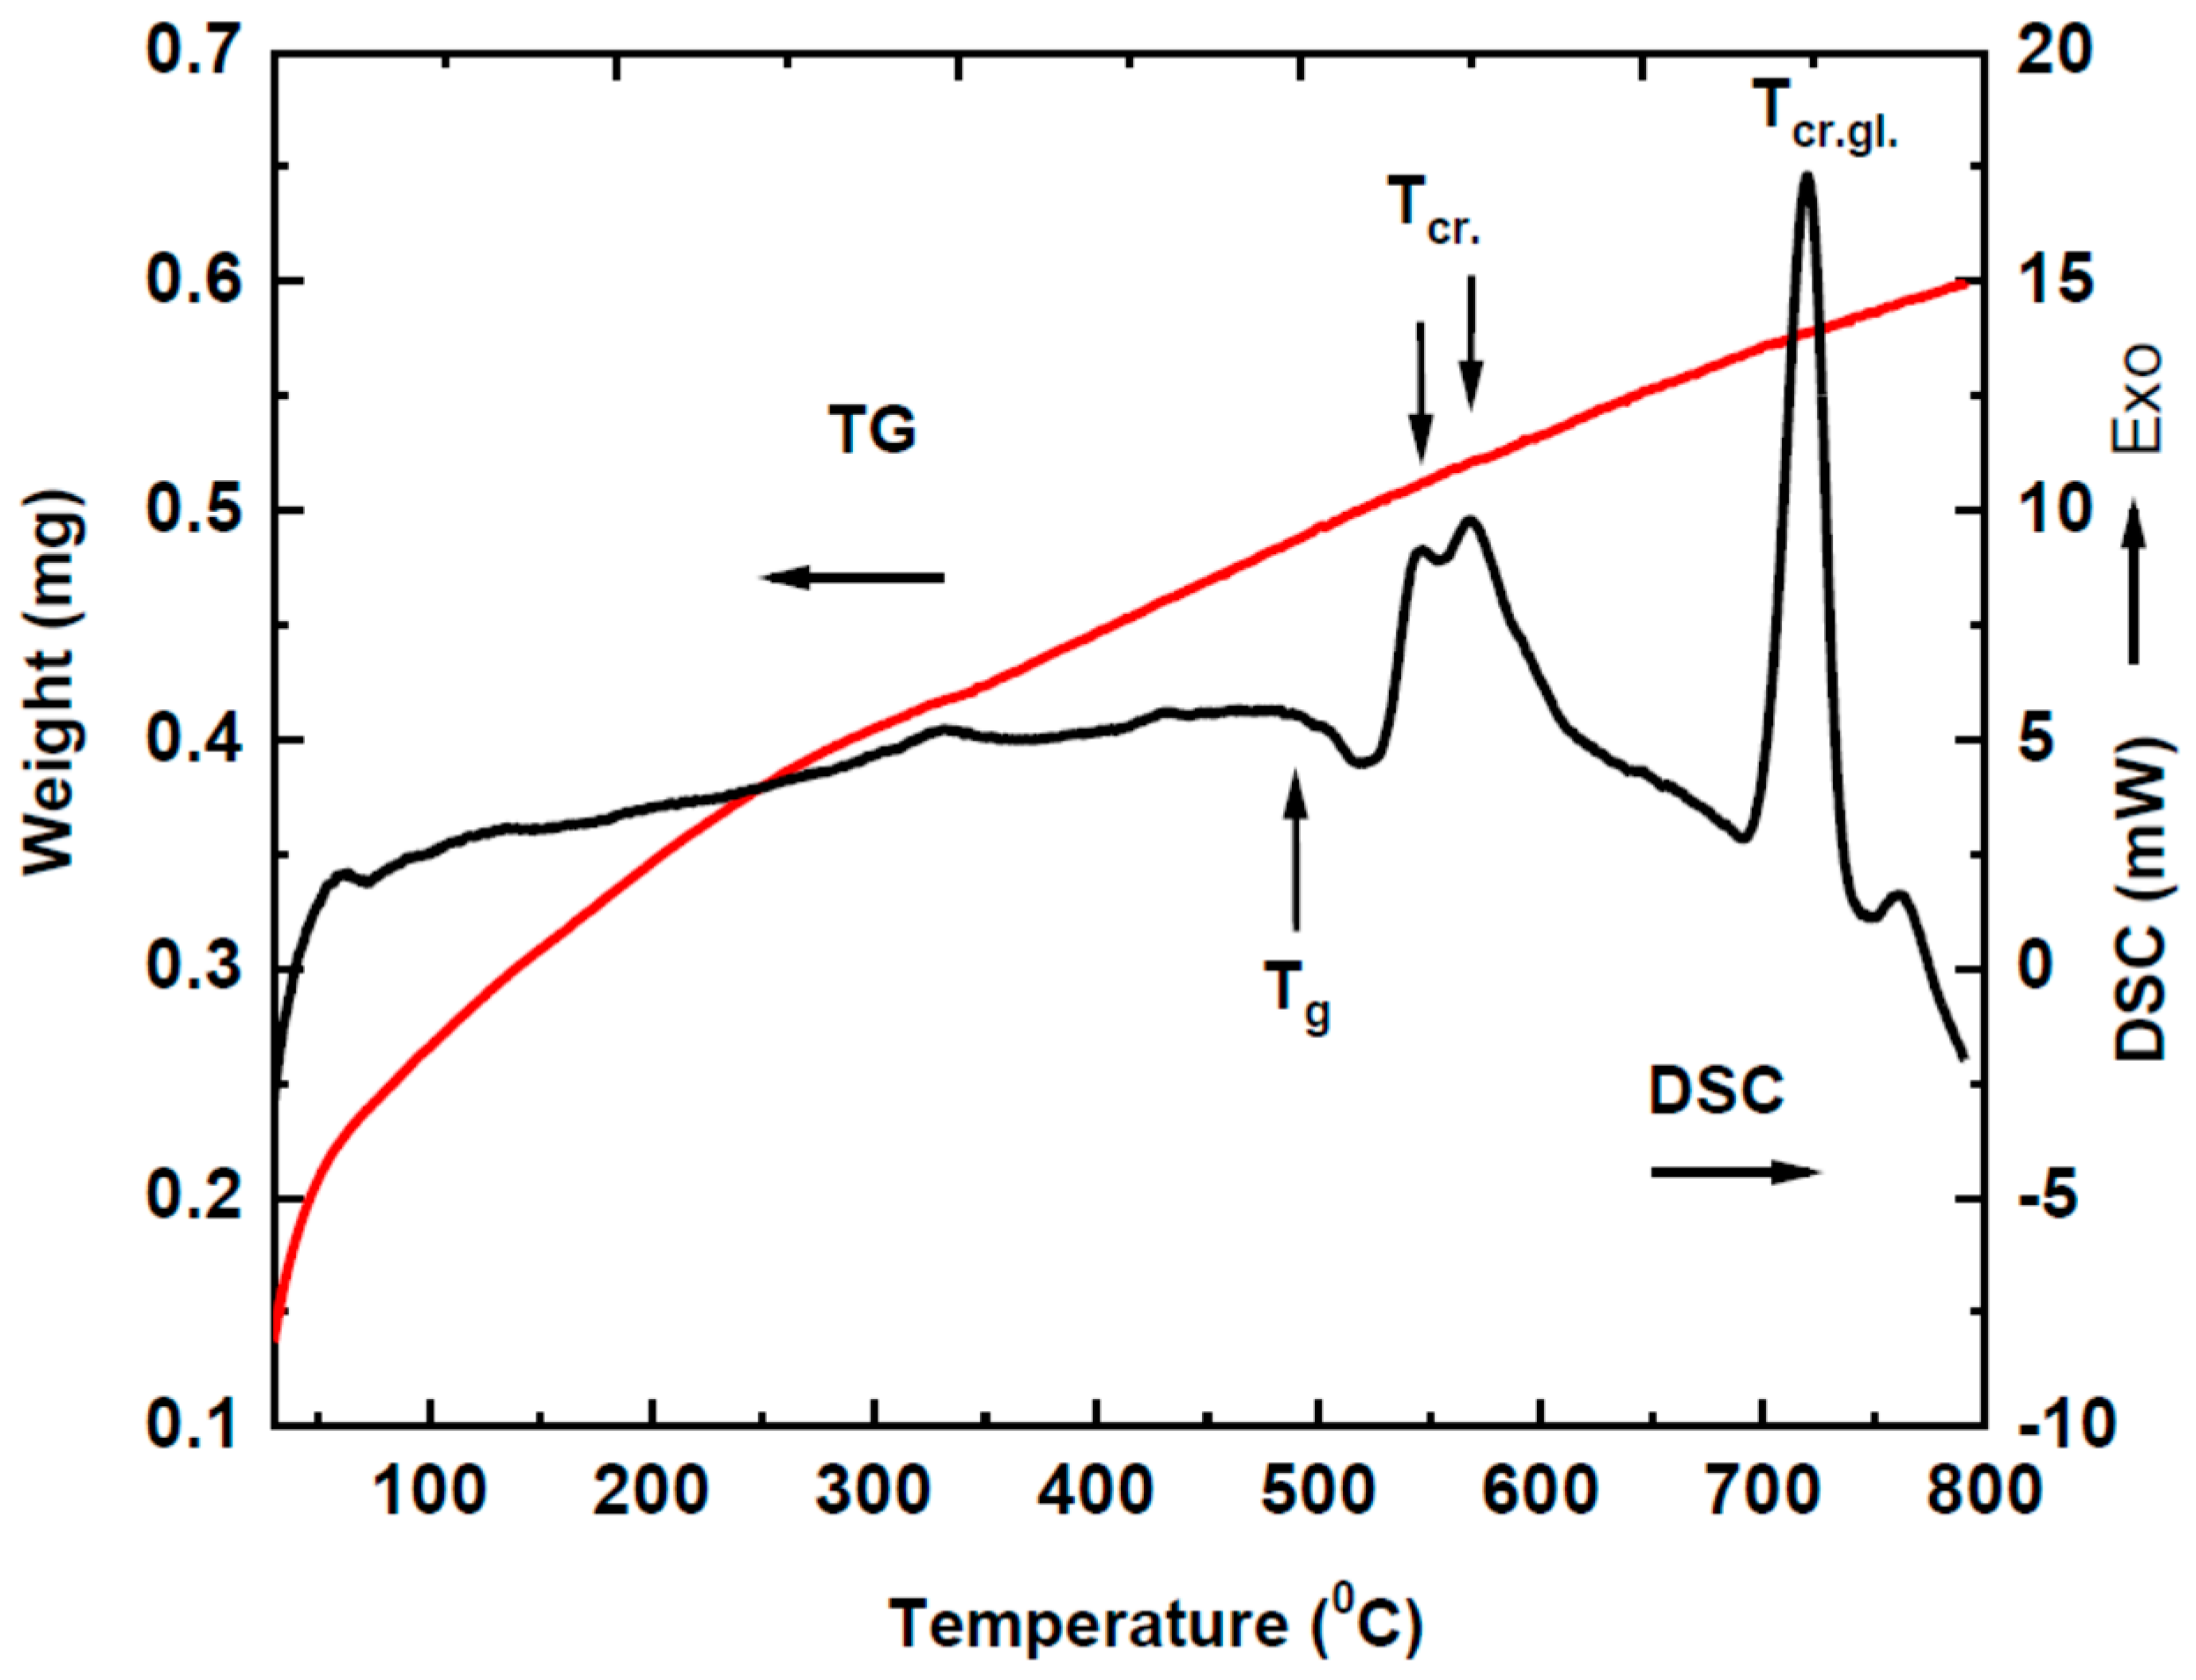
3.1. Thermal Analysis

The thermogravimetry (TG) curve recorded on the prepared glass sample showed a monotone increase with the temperature, but several peaks were observed on the DSC curve (Figure 1). The weak endothermic decrease at about 500 °C was assigned to the glass transition temperature Tg and the sharp exothermic peak at about 710 °C to the bulk crystallization of the glass (Tcr.gl). Between 525 and 600 °C, we observed a composed exothermic peak Tcr. that was assigned to the glass ceramization associated with the precipitation of BaCl2 and β-BaB2O4 phases within the glass matrix [11], as was shown by XRD analysis (see below). The inset of the crystallization observed at 530 °C (Figure 1) agreed with the value of 521 °C recorded on a barium borate glass with a similar composition (i.e., the ratio ΣBa: 2B = 1.7) [19].

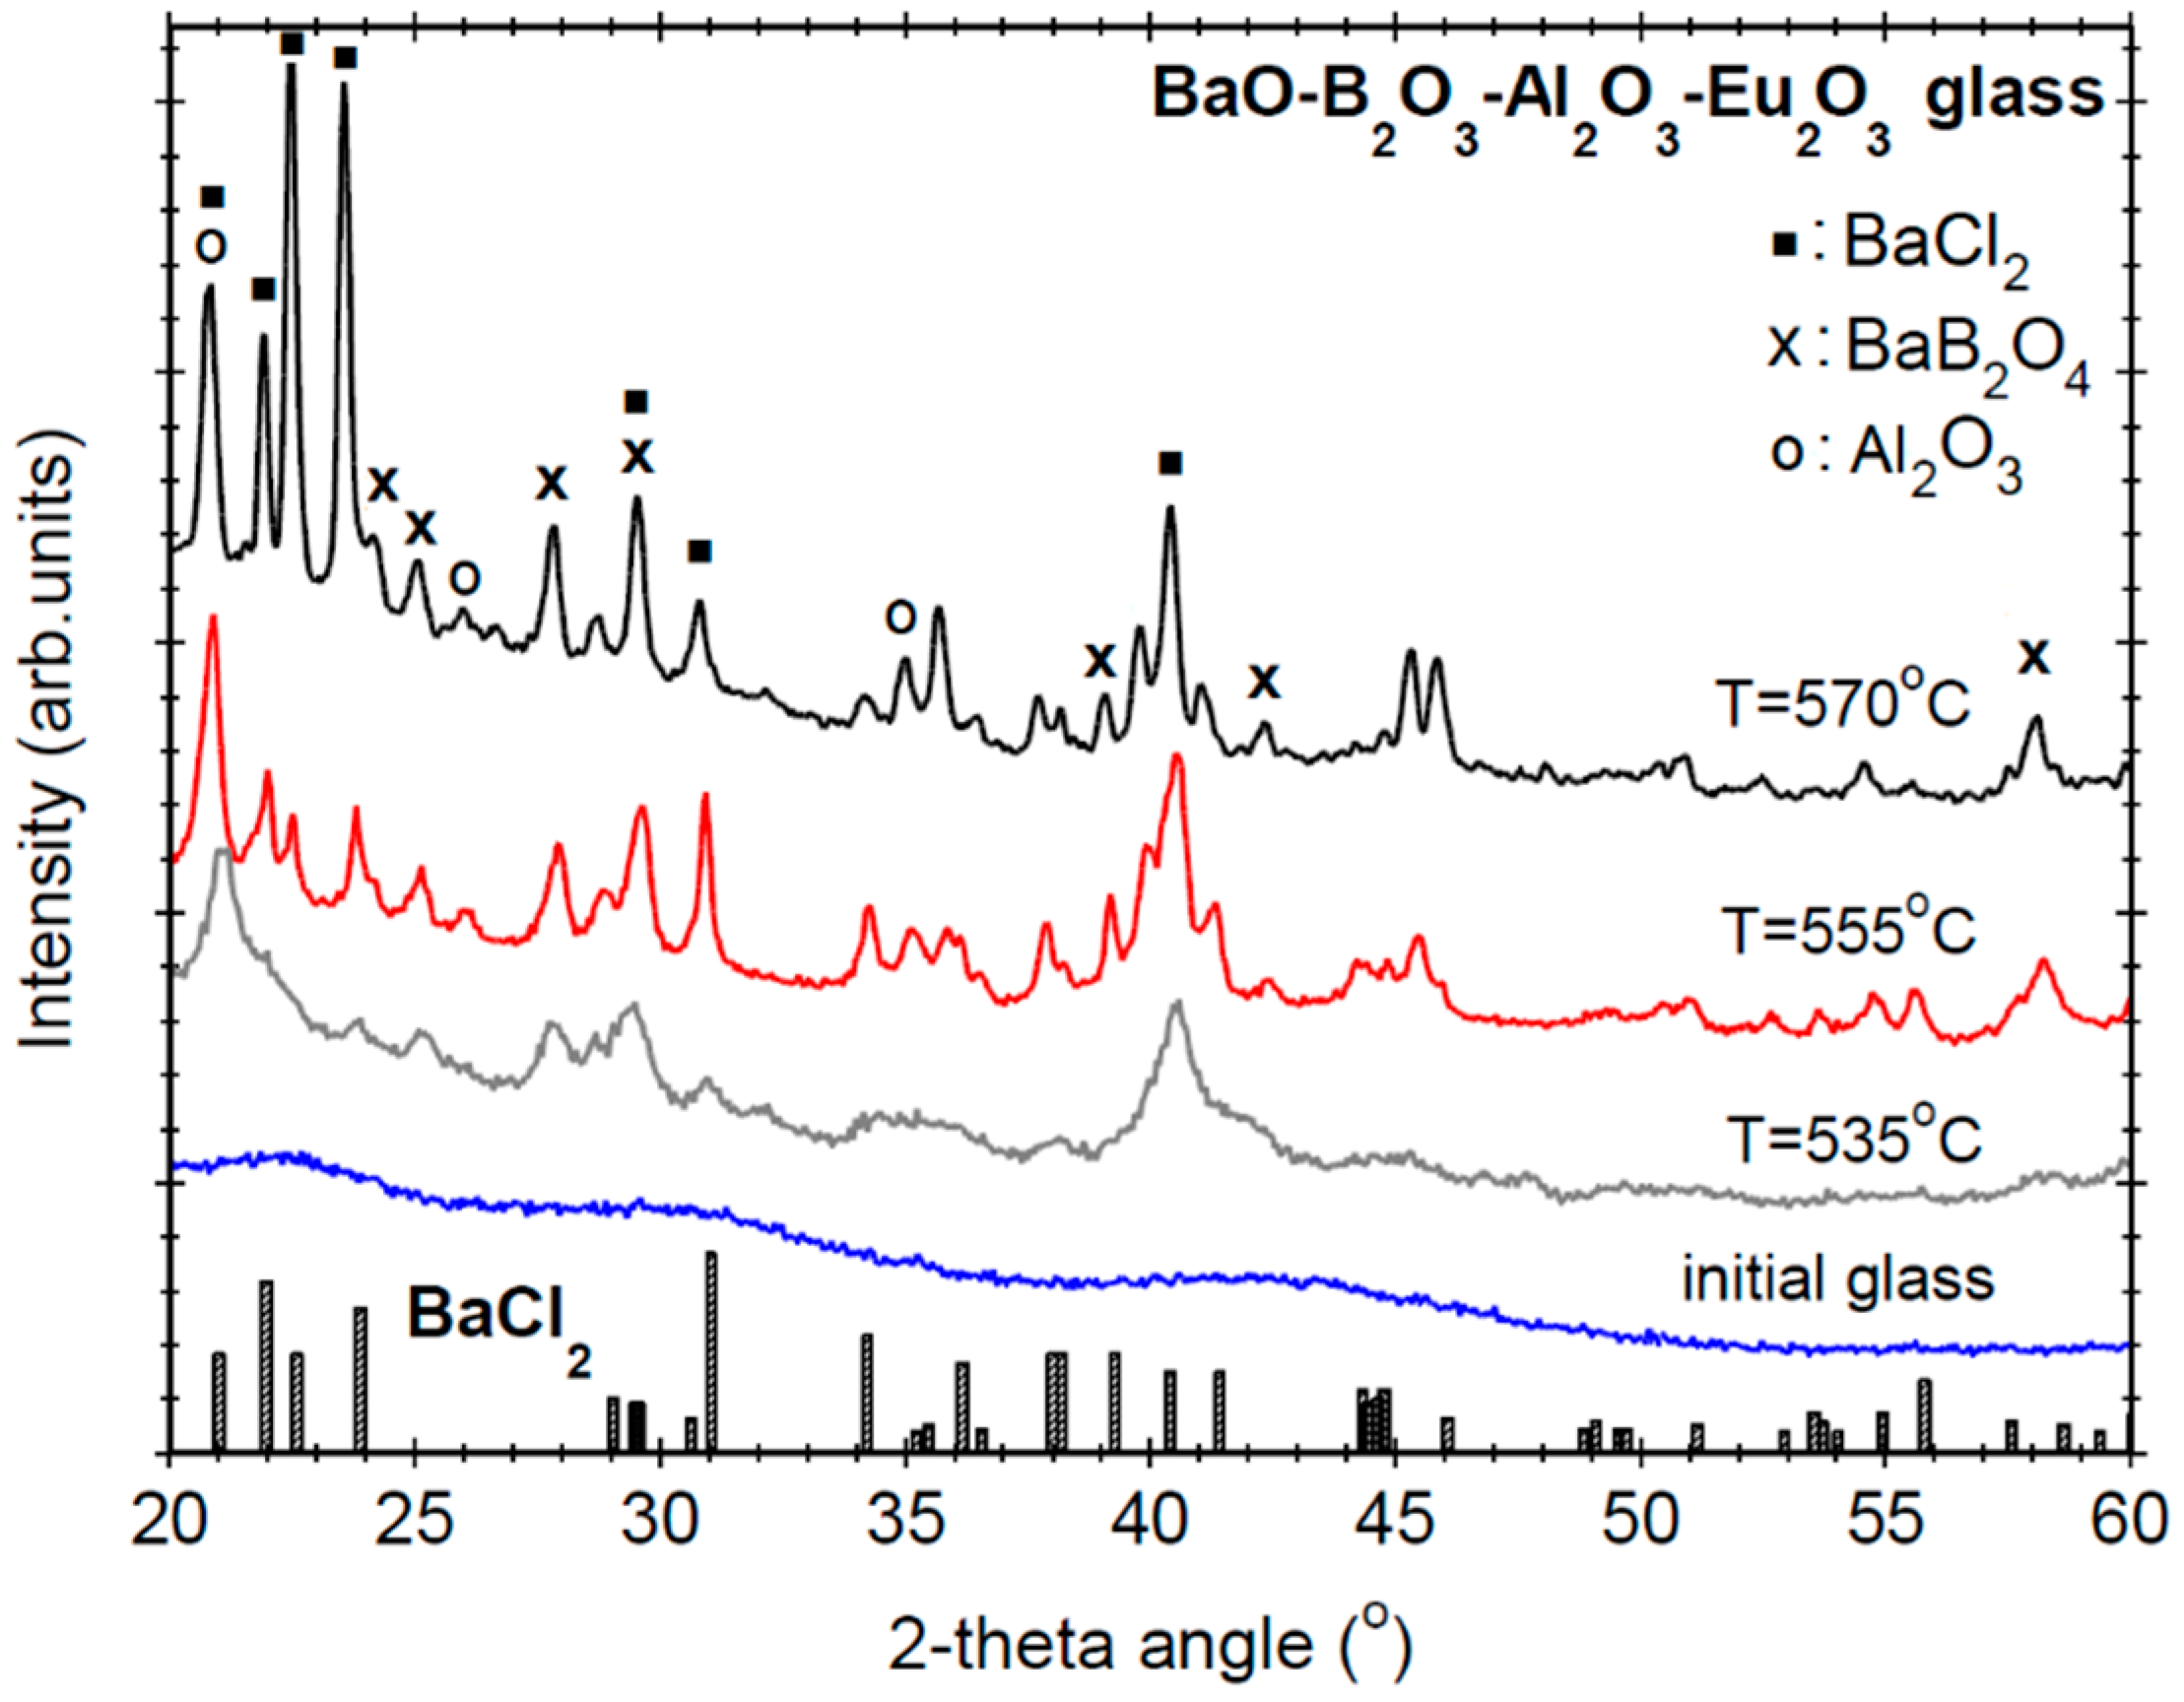
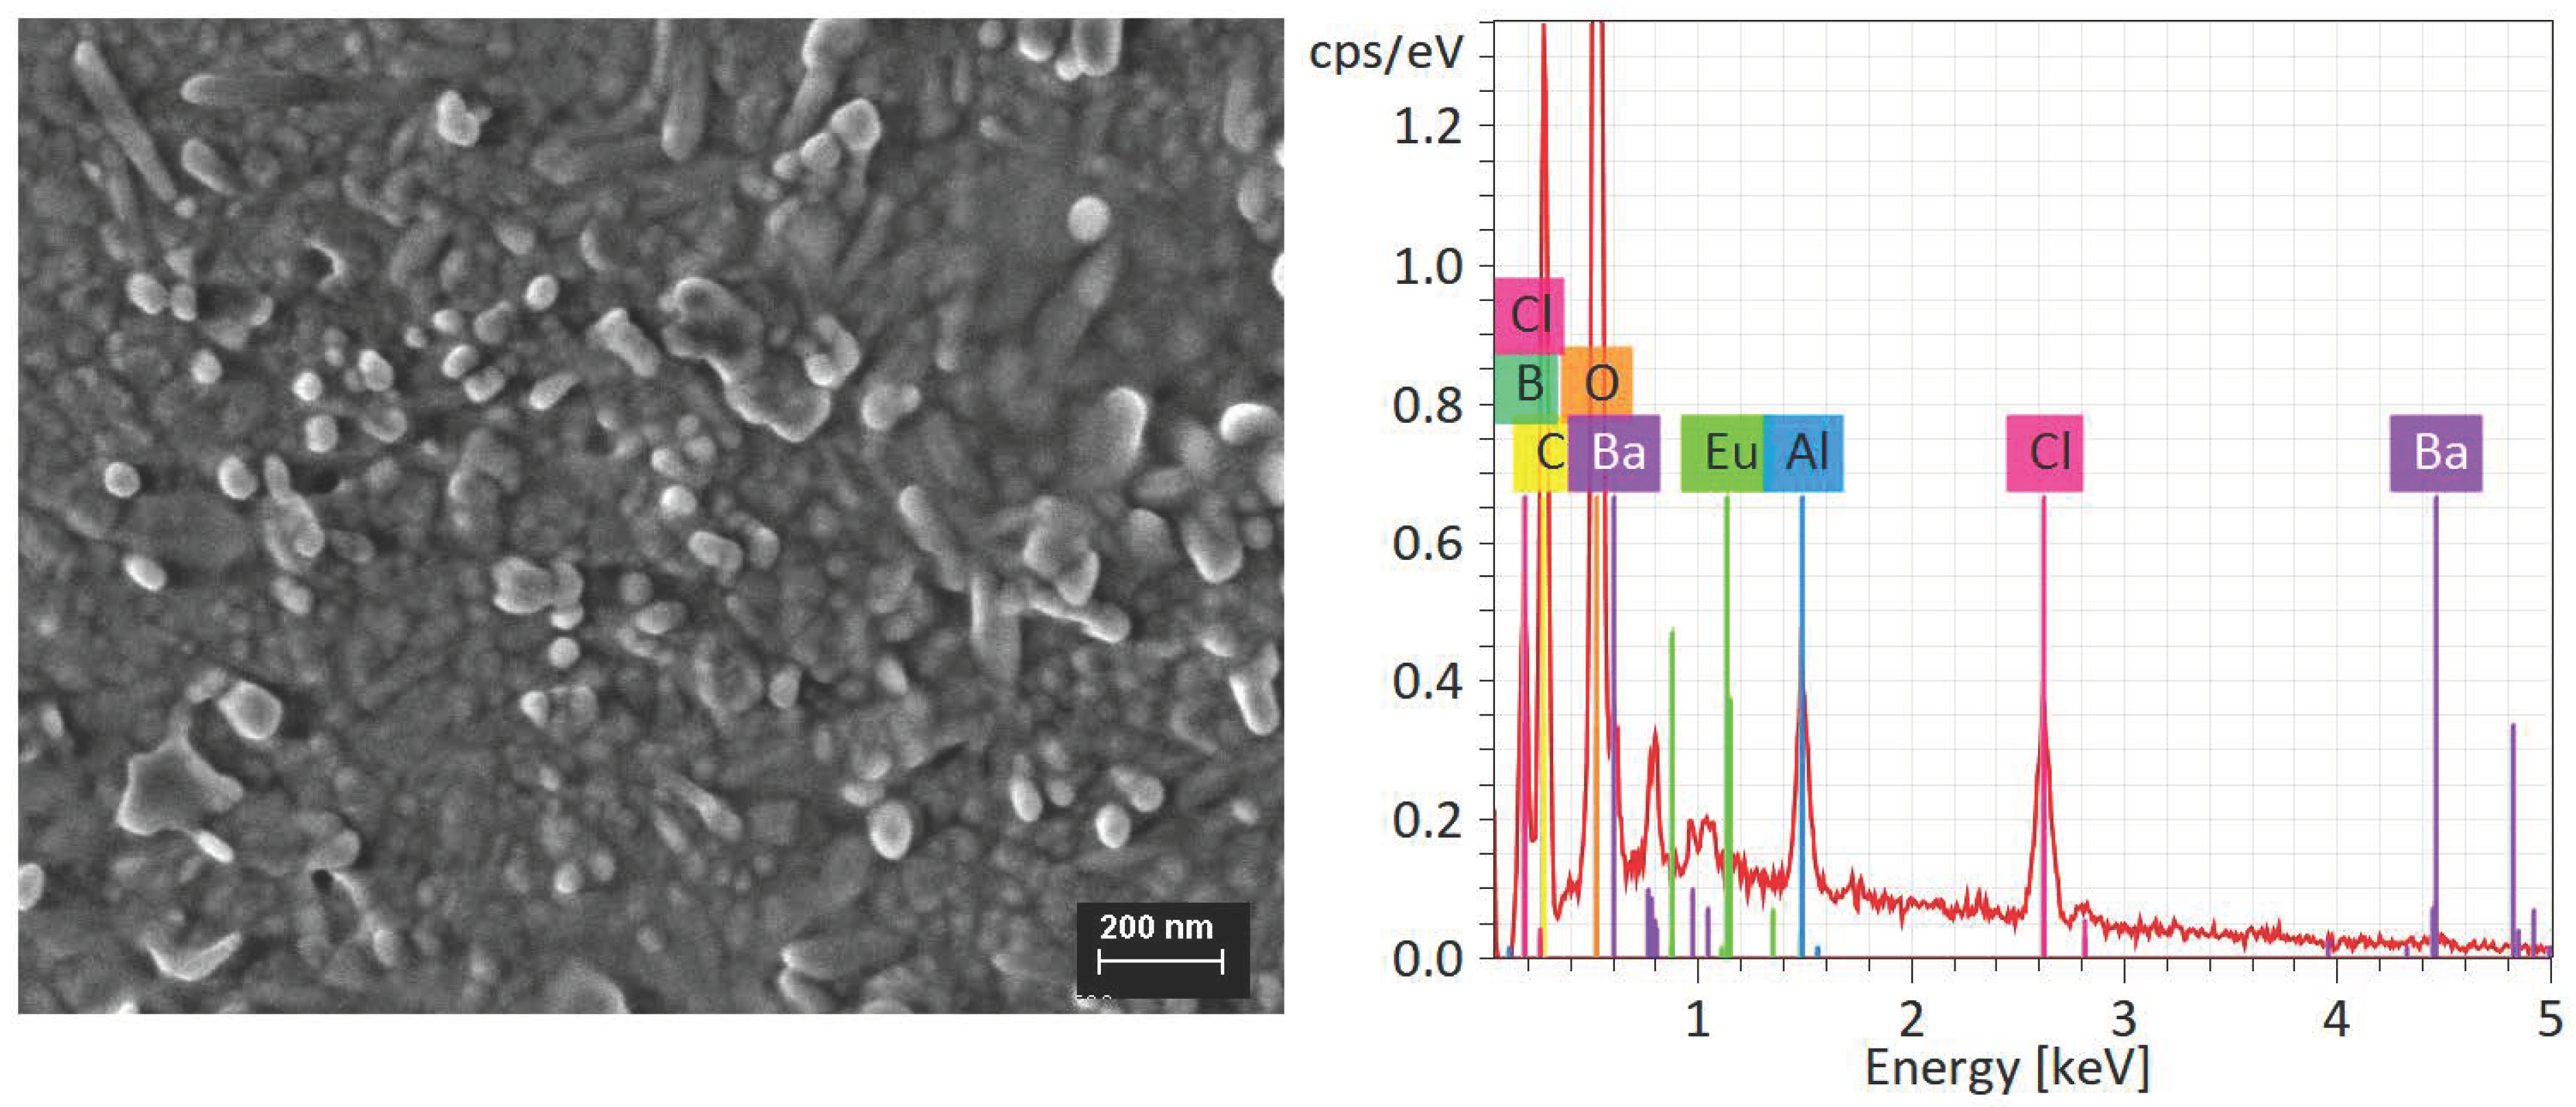
3.2. Structural and Morphological Characterization

The XRD pattern of the initial glass showed several broad peaks at 21.5, 31, and 41.5°, consistent with its amorphous structure (Figure 2). The glass ceramization started at 535 °C (i.e., right below the composed exothermic peak Tcr). The XRD patterns of the glass ceramic samples (Figure 2) showed the diffraction peaks assigned to the precipitation of the orthorhombic BaCl2 phase accompanied by the peaks due to the β-BaB2O4 crystallites [11]; weaker peaks due to Al2O3 from the crucibles were also observed [11]. The stable phase of BaCl2 has an orthorhombic PbCl2 structure (space group D2h16, Pnma) with the lattice parameters a = 7.865 Å, b = 4.731 Å, and c = 9.421 Å (PDF 00-024-094) [20].
According to the results of the XRD pattern analysis (Table 1), the cell parameters of BaCl2:Eu2+ nanocrystals in the glass ceramic showed a clear increase compared to the corresponding nanocrystalline powder. For Eu2+-doped BaCl2 nanocrystals where the Ba2+ ions are substituted by the Eu2+ dopants [20,21], there is a relatively small distortion of the BaCl2 crystalline structure assigned to the ionic radii difference of 1.47 Å for Ba2+ and 1.3 Å for Eu2+ [22]. However, for the glass-ceramic, we observed a strong crystalline lattice expansion effect (Table 1). Therefore, we assigned it to the particularities of the nanocrystal growth process in the glass matrix, which is strongly influenced by the ionic environment and ionic impurities incorporated during the growth process [23].
The scanning electron microscopy (SEM) image analysis indicated volume crystallization of the sample as a relatively uniform, compact, and broad distribution of nanoparticles of about tens of nm size (Figure 3); their aggregation and collapse resulted in bigger particles, of about hundreds of nm in size. Previous studies have indicated a surface crystallization in the glasses containing BaO and B2O3 [24], but in the present case, the SEM image (Figure 3) indicated a ceramization process within the glass sample volume.
The EDX spectral analysis of the glass-ceramic samples showed the presence of elements from the precursor chemicals: 7 at%(C), 72 at%(O), 9 at%(Ba), 2.5 at%(Al), 9 at%(Cl), and 0.5 at%(Eu). There was a deviation from the batch composition that was assigned to the chlorine loss during the melting caused by the chemical interaction of the oxychloride melt with water vapor or oxygen [16].

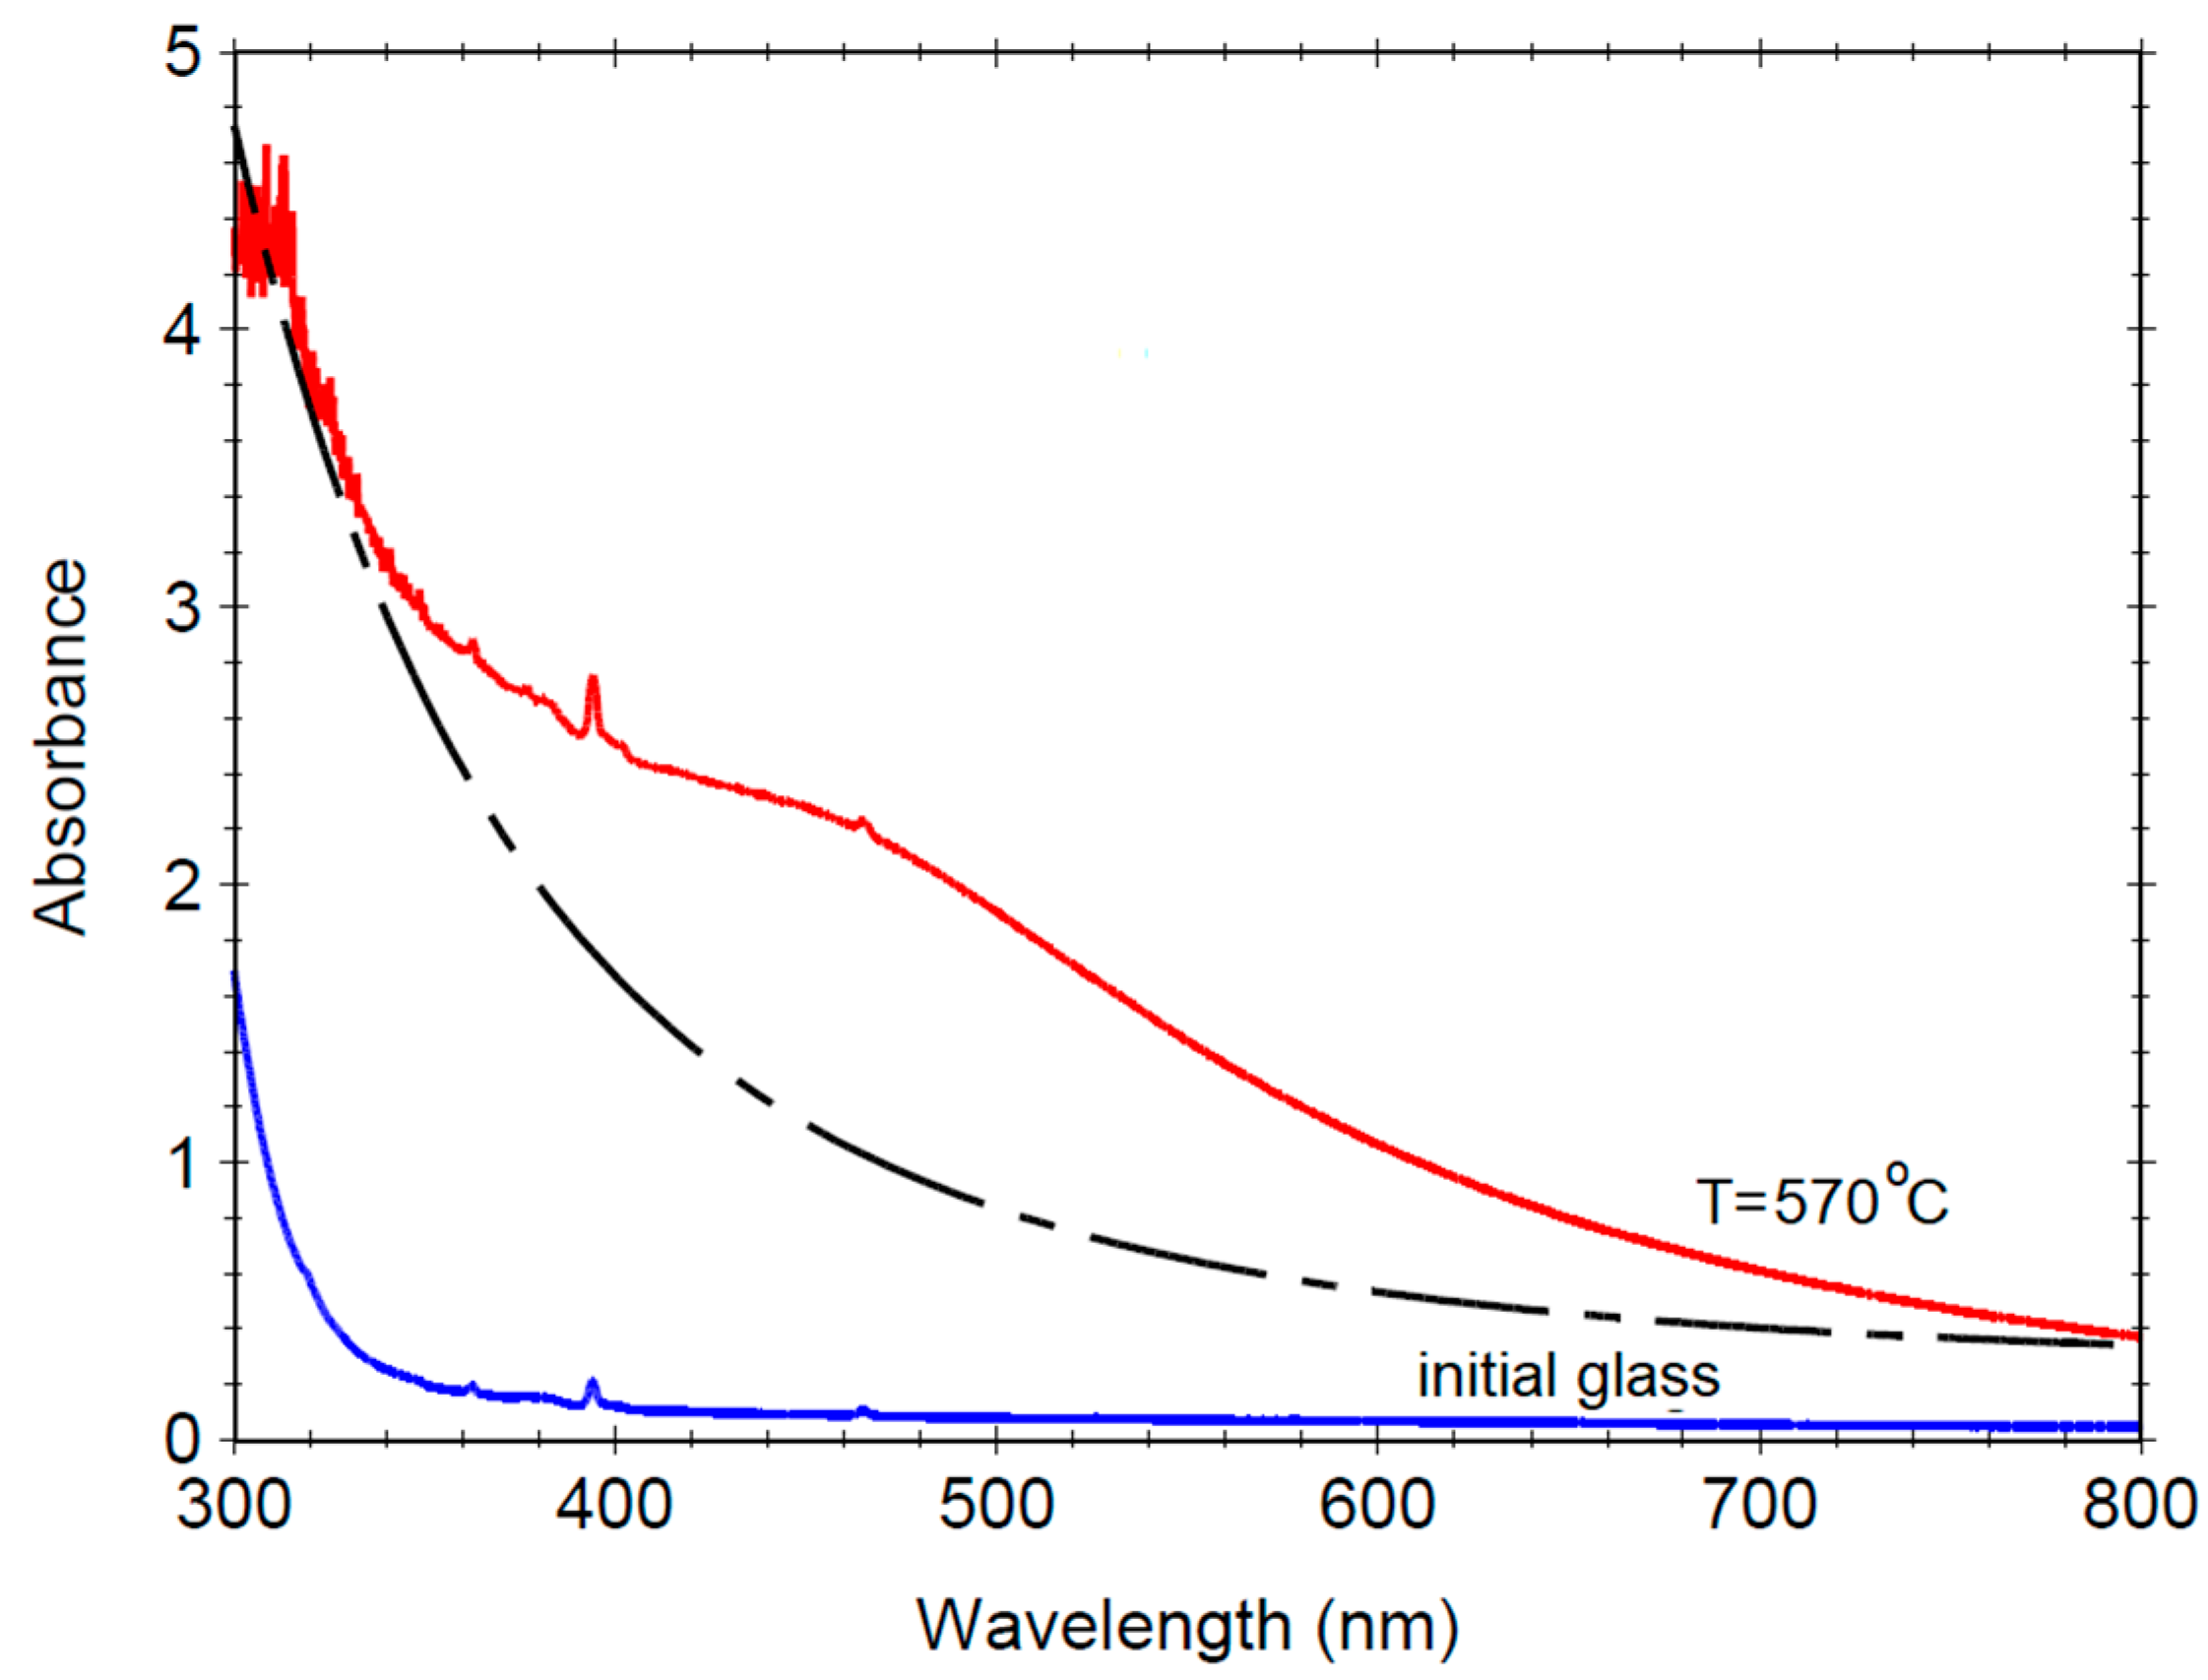
3.3. Optical Absorption UV–Vis

The effect of glass ceramization can be clearly observed in the absorption spectra recorded on the initial and glass ceramic samples (Figure 3). The initial glass showed high transparency in the whole blue-visible region, but for the glass-ceramic, the spectrum was dominated by the scattering on the nanocrystals; two small peaks at about 394 and 463 nm were due to the 5F05L6 and 5F05D2 transitions of the Eu3+ ions [25]. The absorption spectrum recorded on the glass-ceramic followed a 1/λn wavelength dependence, with n ≈ 4 (Figure 4, dotted curve) consistent with a Rayleigh scattering on nanocrystals much smaller than the wavelength (i.e., <1/10 of the wavelength) [26]. Superimposed on the Rayleigh scattering curve, we observed a weak “bump” at about 480 nm assigned to the Mie scattering on nanocrystal agglomerates larger than the wavelength.

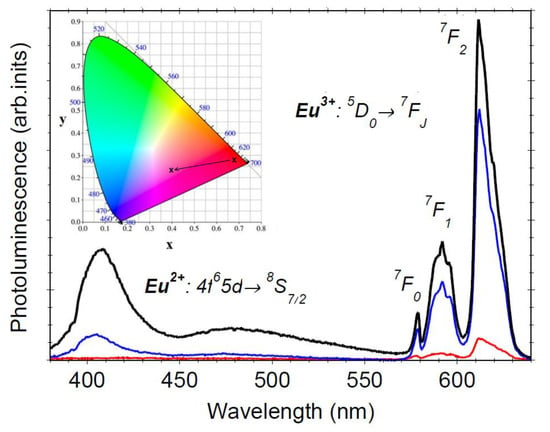
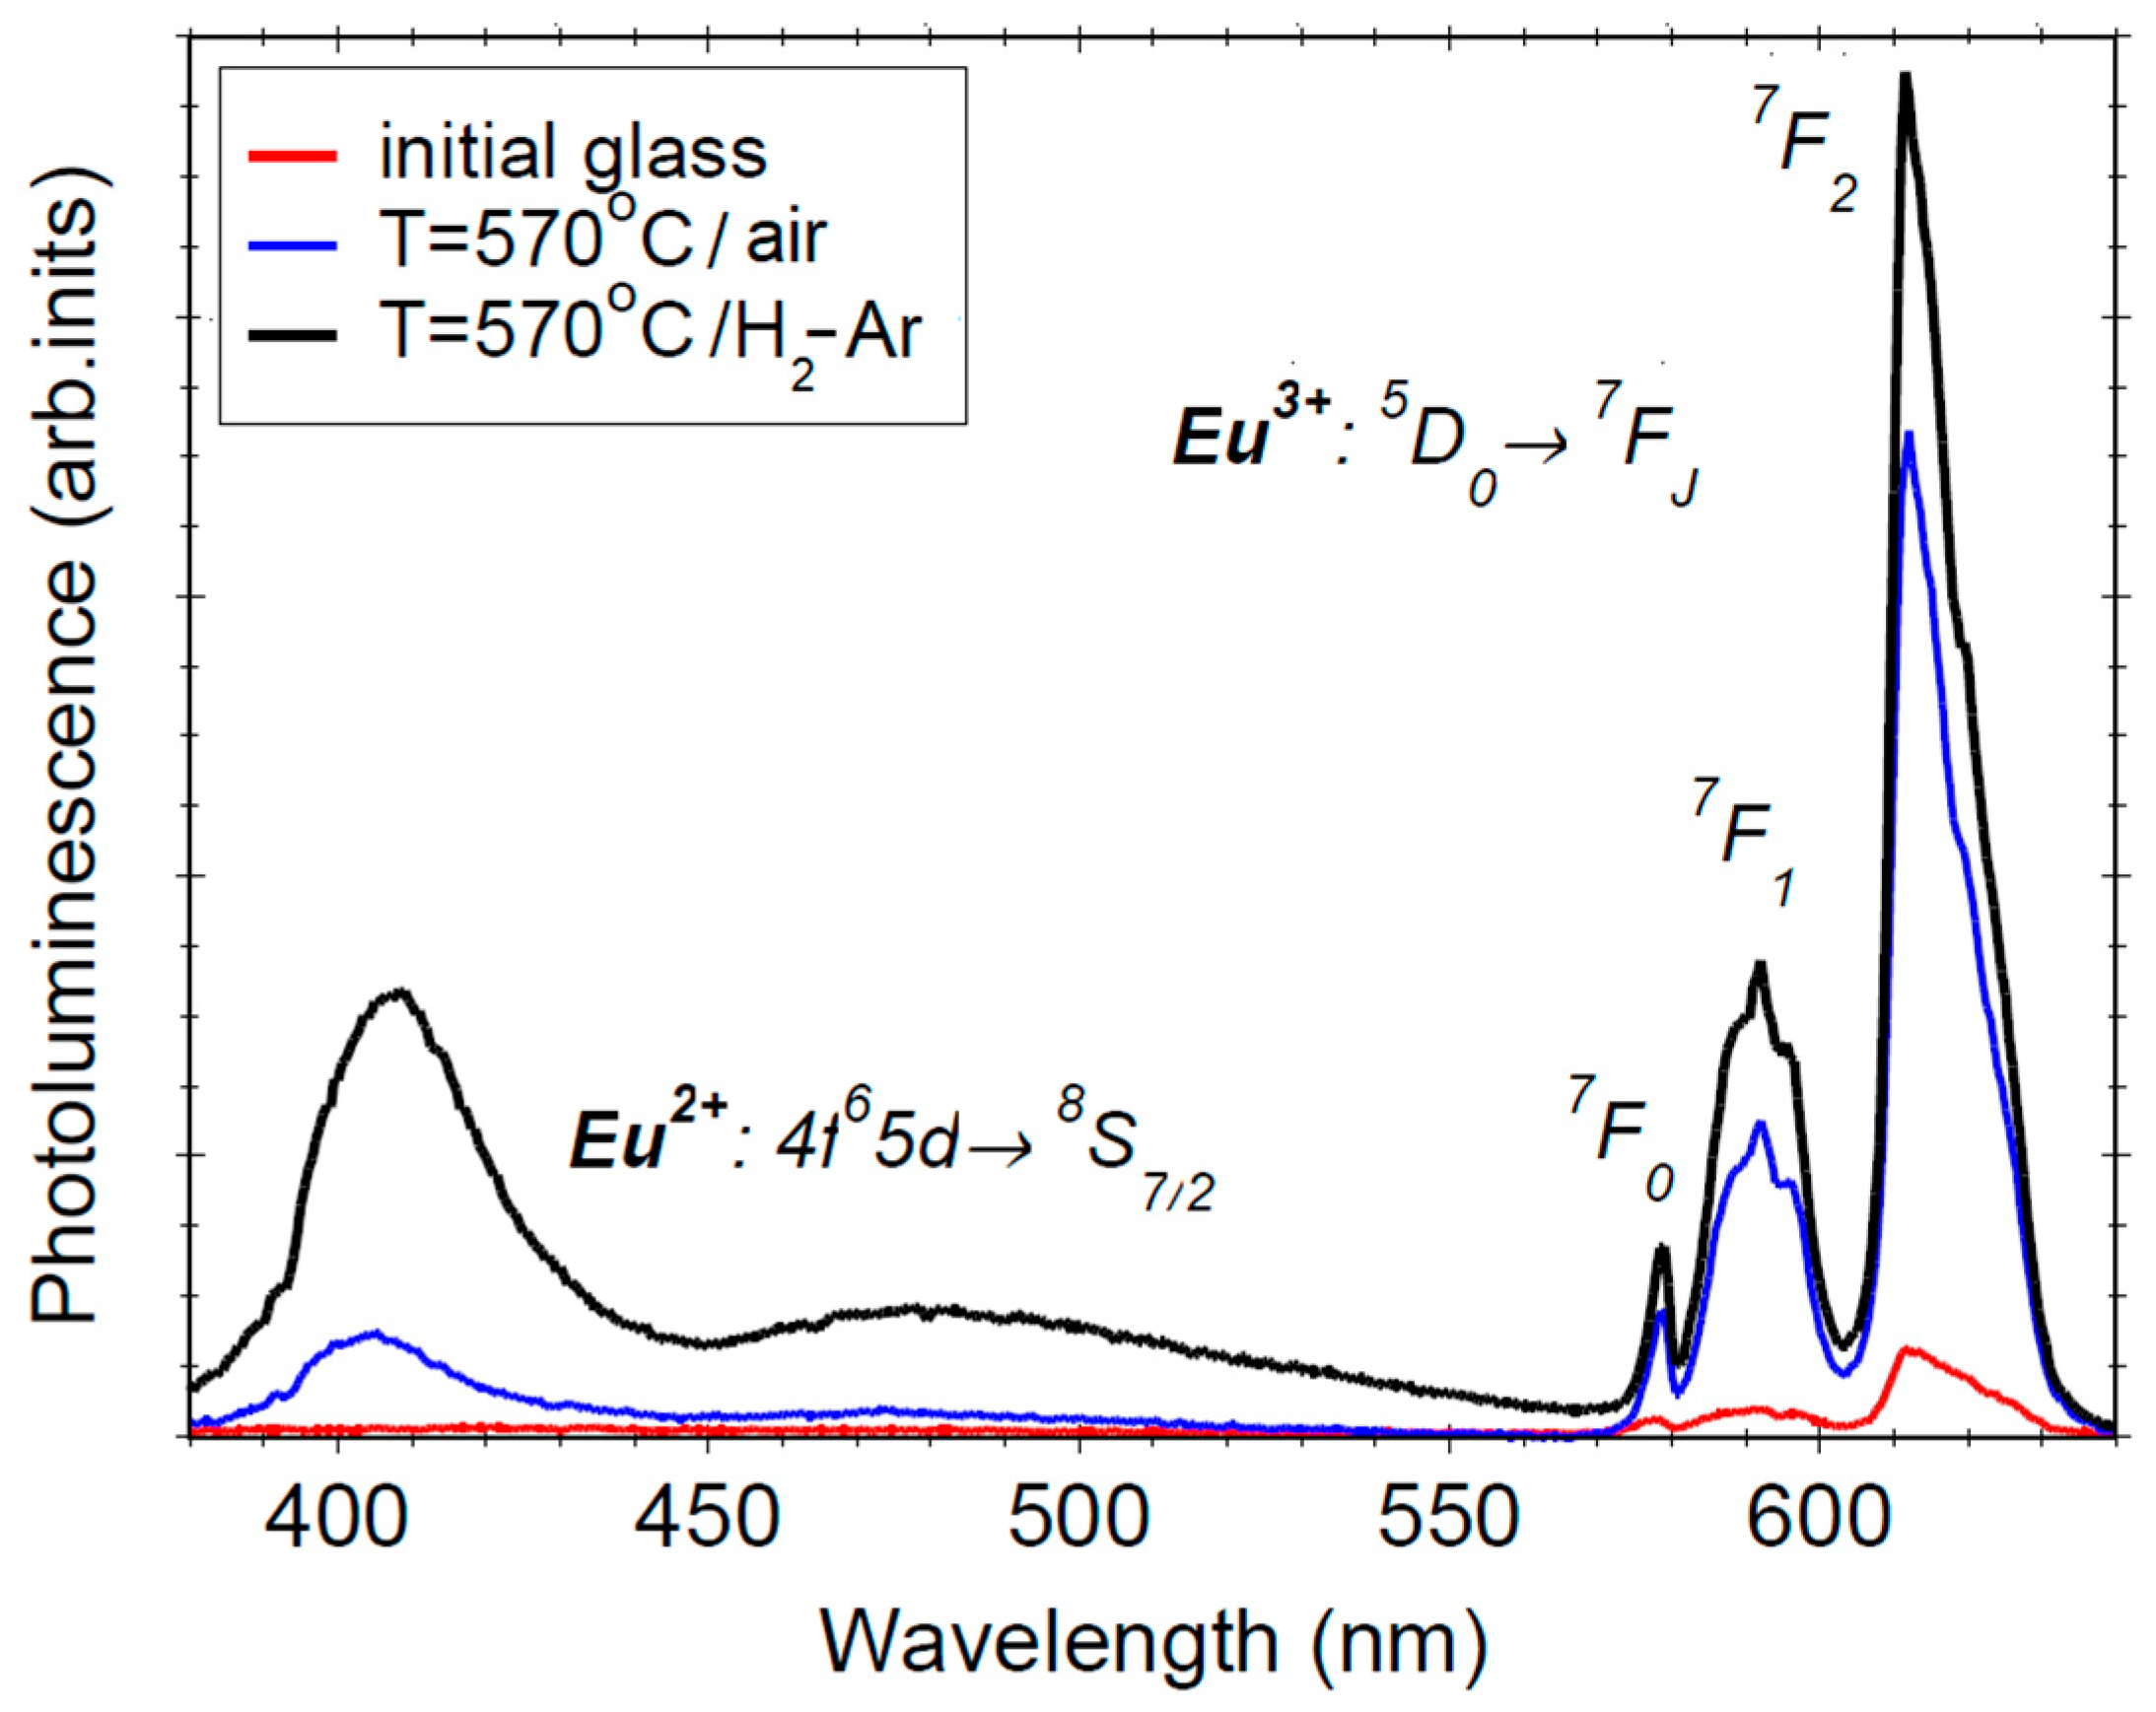
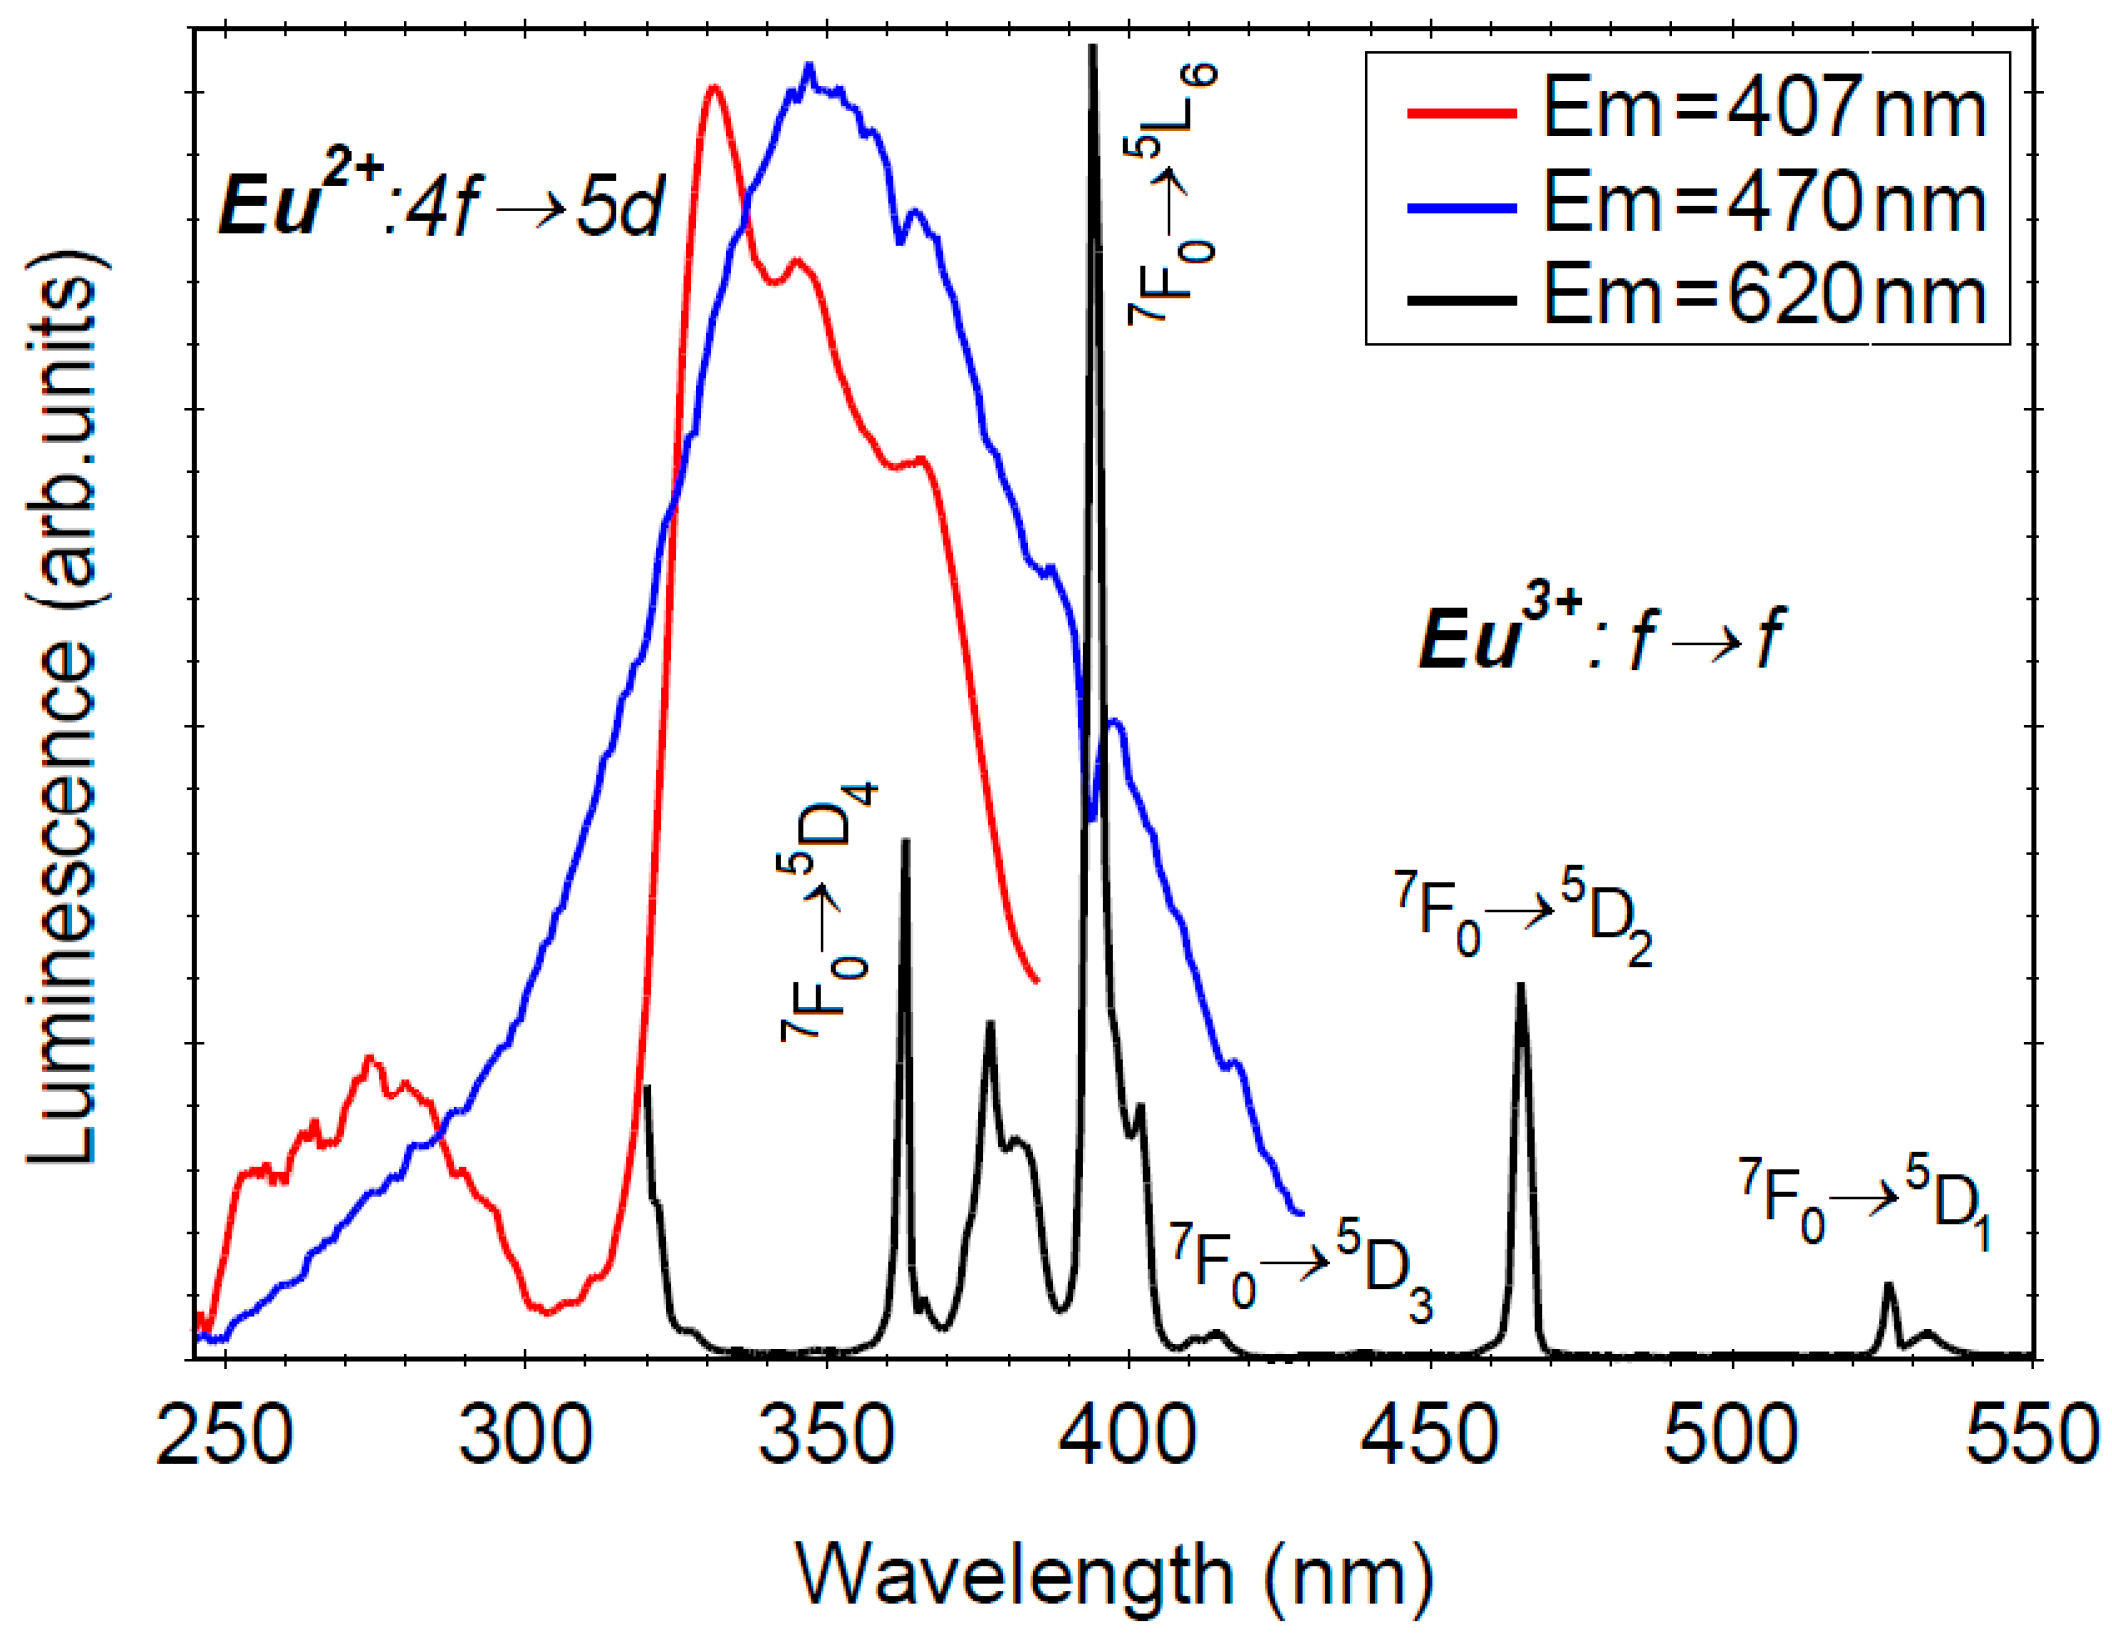
3.4. Photoluminescence Properties

The luminescence properties of the europium ion are strongly dependent on its valence state (Eu2+ or Eu3+) and on the nature of the host lattice; sharp visible luminescence peaks were observed for Eu3+ and broad blue luminescence for Eu2+. The PL and PL excitation spectra recorded on the Eu-doped chloroborate glass and glass-ceramic samples are presented in Figure 5 and Figure 6, respectively.
The PL spectra of the initial glass showed weak Eu3+-related luminescence peaks at 578, 592, and 620 nm assigned to the 5D07F0–3 radiative transitions [25], which increased after glass ceramization due to the partial absorption of the UV-blue luminescence of the Eu2+ ions (see below). The PL excitation spectrum of the 620 nm luminescence showed sharp peaks at 363, 377, 394, 465, and 526 nm assigned to the 4f→4f transitions between the 7F0 ground state to various excited states [25]. For the dopant level used (1%), we supposed a uniform distribution of the europium dopants within the amorphous structure of the glass (Figure 2), which was characterized by no regular arrangement of the constituent ions. Hence, in the glass matrix, the luminescence spectra of the RE3+-ions showed broadening due to the random positions and random surroundings of the dopant ions. When the RE3+-ions are incorporated within the crystalline structure of the precipitated nanocrystals (i.e., during the glass ceramization process), this effect is removed, and for the Eu3+ ions, Stark splitting of the 7FJ final states [27] is expected, which, however, in the present case, could not be observed (Figure 5). Moreover, for lower phonon frequencies of the precipitated nanocrystals (i.e., reduced non-radiative relaxation rate), longer RE3+ luminescence lifetimes are expected. The phonon energies of borate glasses of about ~1300–1500 cm−1 were much higher compared to barium chloride (~300 cm−1). However, the PL decay curves recorded on the glass and glass ceramic bulk sample (not presented) showed single decays with relatively close characteristic lifetimes of 1.86 ± 0.02 ms and 2.20 ± 0.02 ms, respectively (Table 2). From all these experimental facts, we can infer that in glass-ceramics, the Eu3+ ions are incorporated dominantly in the glass matrix.
Further insight into the local structure and bonding in the vicinity of the Eu3+ ions is given by the analysis of the Judd–Ofelt (J-O) intensity parameters Ω2,4,6. The Ω2 parameter is sensitive to the local RE environment and large values were observed for chemical bonds with covalent character; and the Ω4 and Ω6 parameters are related to the viscosity and rigidity of the material (for doped glasses), respectively [28]. The JO parameters Ω2 and Ω4 were computed from the experimental luminescence spectra and by using the Einstein coefficients A0-λ for spontaneous emission [29,30]. The experimental spontaneous emission coefficients A0–2 and A0–4 are obtained from the relation:
A0–λ = A0–1 ⋅ (S0–λ/S0–1) (σ21)   with λ = 2,4
where S0–2 and S0–4 are the integrated areas of the luminescence curves related to the 5D07F2,4 transitions, and σ1, σ2, and σ4 are the energies of the 5D07F1,2,4 transitions. The 5D07F1 transition is the only MD transition, and therefore we used A0–1 = 50 s−1 [31]. The computed results for the Ω2,4 parameters are tabulated in Table 2, where a very good agreement with the Ω2, Ω4 parameters was reported for the Eu3+ doped lead borate glass [32] and a small decrease in the glass ceramic as a consequence of structural transformations during the ceramization process could be observed. We suppose that in the glass ceramic, a very small fraction of the Eu3+ ions is incorporated within the crystalline lattice, and hence we observed a decrease in the Eu bonds’ covalency degree and of the Ω2 parameter.
In the glass ceramic, the Eu3+-related luminescence peaks were accompanied by broad blue luminescence peaks at 407 and 480 nm (Figure 5) assigned to the Eu2+ ion luminescence in different environments. The Eu2+ luminescence occurs from the lowest crystal-field component of the 4f65d excited configuration to the 8S7/2 ground state (parity-allowed). This d-f type emission has a broad band character and is strongly dependent on the host lattice (i.e., the coordination number and symmetry of the site occupied by the Eu2+ ions) [33]. The Eu2+-related luminescence was not observed in the initial glass, but only after the ceramization process as a consequence of the Eu3+→Eu2+ reduction processes in the glass matrix [34,35,36], and was enhanced by the reduction atmosphere (Figure 5). As the Eu2+ luminescence in BaB2O4 crystals was observed at 380 nm [37] and given that the 407 nm luminesence was close to that observed in bulk orthorhombic BaCl2:Eu2+ crystals at 399 nm [38], we could assign the observed features to the Eu2+ luminescence in the BaCl2 nanocrystalline phase from the glass ceramic.
The excitation spectrum of the 407 nm luminescence showed two broad bands at about 275 and 330 nm (Figure 6) assigned to energy splitting between the t2g and eg one electron states of the 5d orbital. Its shape was different from the spectrum recorded on the BaCl2:Eu2+ nanocrystalline powder [39], where a broad band in the 250 to 375 nm range was observed. The energy splitting indicated a lower crystal field symmetry at the Ba2+ sites occupied by the Eu2+ ions (compared to the nanocrystalline powder), which was assigned to the stress and distortion induced by the growth process (see Section 3.2). Such effects might also be responsible for the spectral shift of the 407 nm luminescence, compared to the Eu2+ luminescence observed at 396 nm in the nanocrystalline powder [39]. By comparison, the excitation spectrum of the 470 nm luminescence showed a broad and structureless band, which could be tentatively assigned to the Eu2+ ions in the glass matrix.

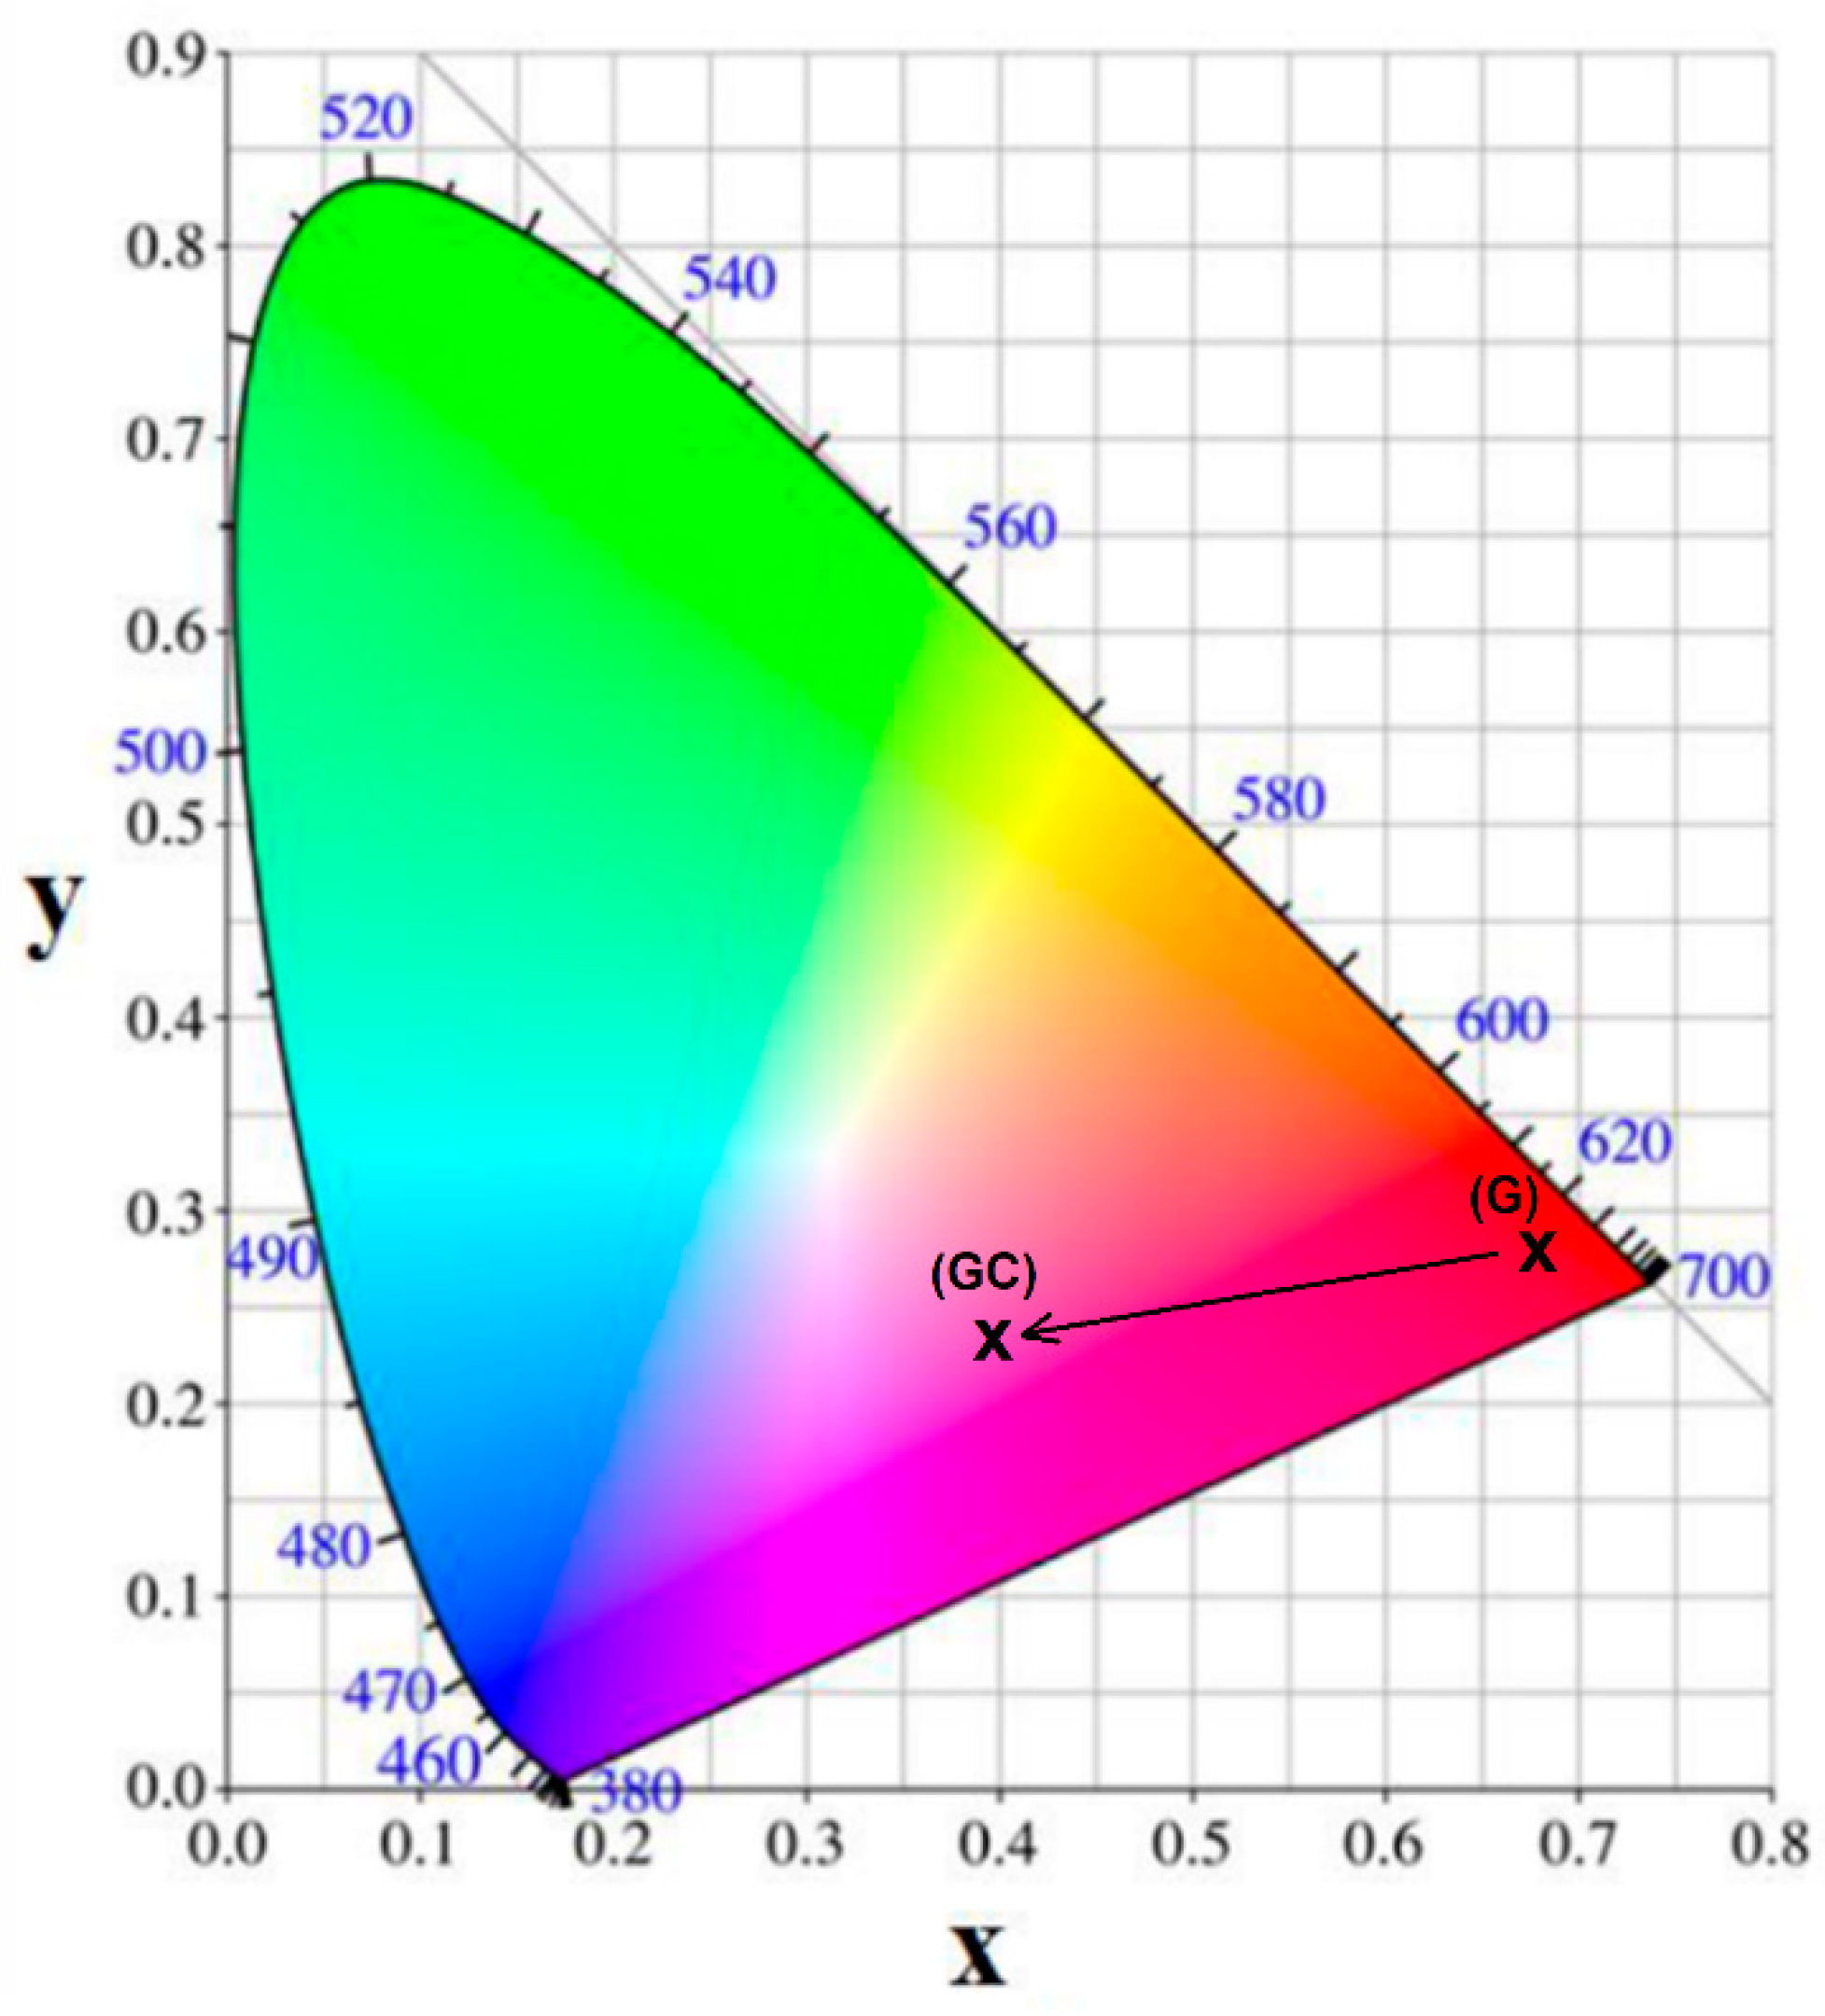
3.5. Colorimetry Analysis

The color impression of the samples was influenced by the glass processing. Figure 7 shows the Commission Internationale de l’Eclairage (CIE) chromaticity diagram of the initial and glass-ceramized (in an air or reducing atmosphere) Eu-doped chloroborate samples, respectively. Under 345 nm excitation, the coordinates x = 0.677 and y = 0.274 corresponded to the region of red Eu3+ luminescence, but after glass ceramization (in air or reducing atmosphere), these changed to x = 0.404 and y = 0.244 as a consequence of the Eu2+ blue luminescence. The photoluminescence quantum efficiency was about 16% for the glass, but decreased to only 4% for the glass-ceramic due to the scattering losses [13].

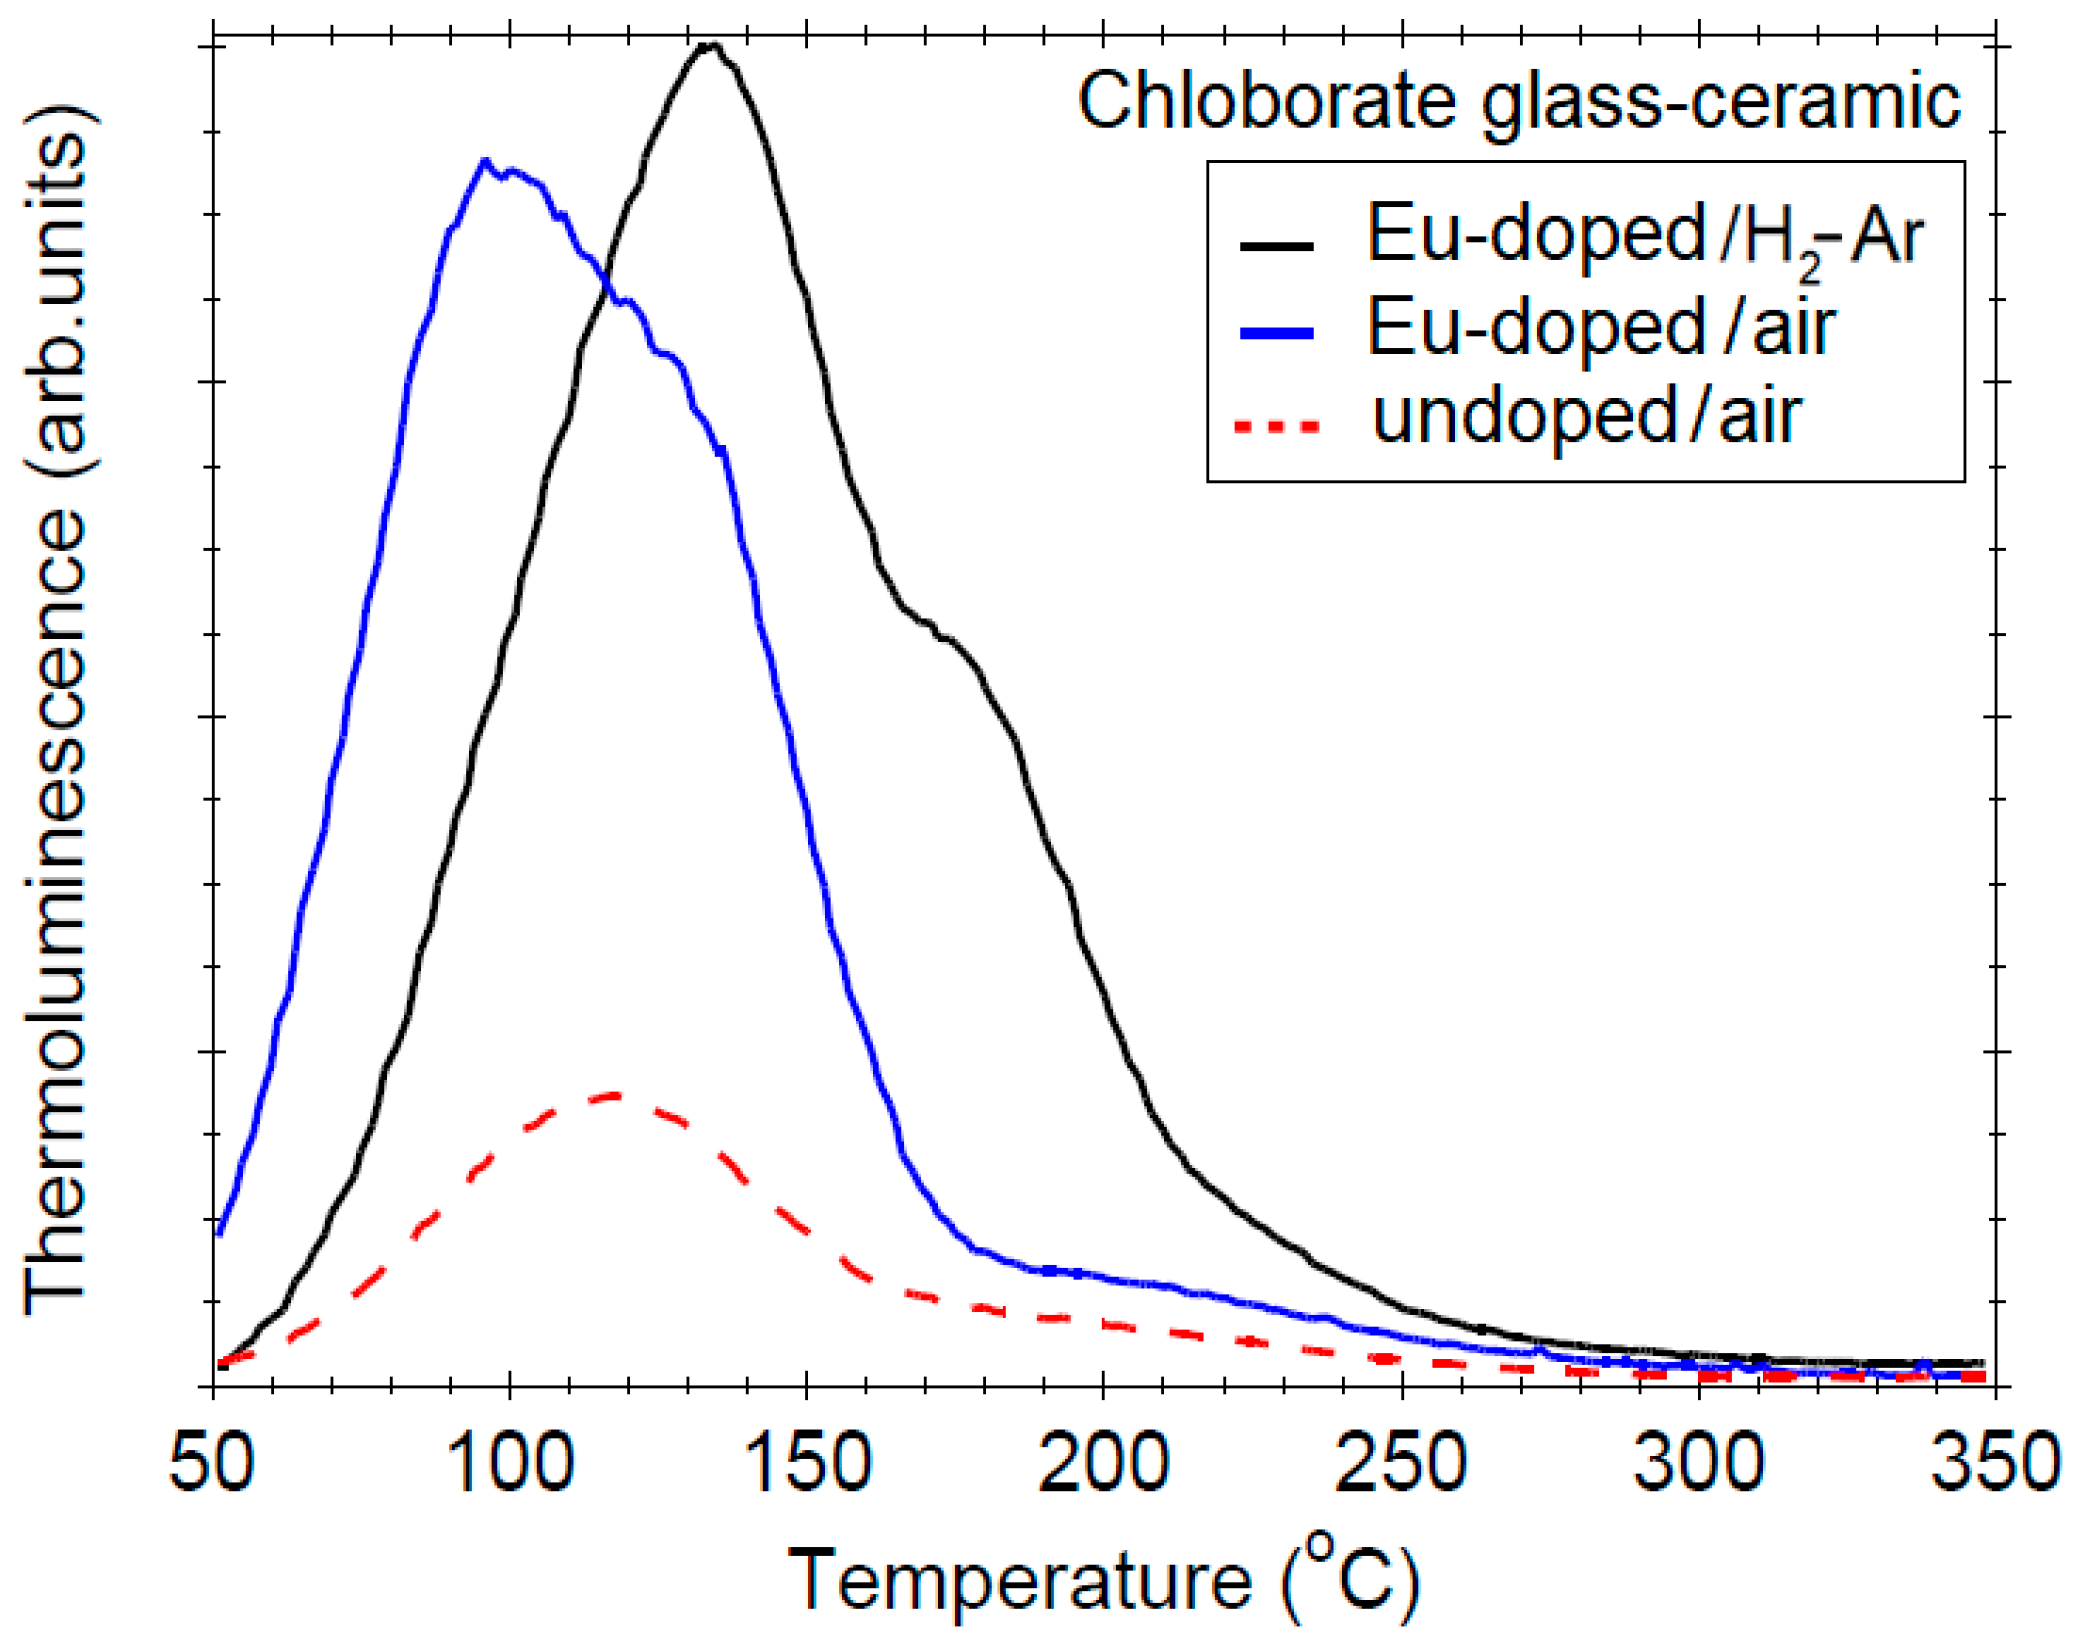
3.6. Thermoluminescence Properties

Thermoluminescence (TL) represents the light emission by a solid sample when it is heated after irradiation by ionizing radiation such as UV light, x-rays, gamma-rays, etc. [40]. According to the basic model of TL, charge carriers (electrons and holes) are produced during the irradiation, which are subsequently trapped on local energy levels (such as vacancies, interstitials, or impurities) within the band gap; during heating, their recombination is thermally activated, resulting in the emission of light (i.e., TL) [40,41].
Thermoluminescence curves recorded on undoped and Eu-doped chloroborate glass-ceramics are depicted in Figure 8. The glow curve recorded on undoped glass ceramic and BaB2O4 showed a broad band between 75 and 400 °C [42], which was assigned to the thermal recombination of defects within the BaB2O4 nanocrystalline phase. The glow curve recorded on the Eu-doped glass-ceramic (annealed in air) showed two peaks at 97 and 134 °C with a higher magnitude than in the undoped sample, but much weaker than in the Eu2+-doped BaCl2 nanocrystalline powder. The same glow peaks were observed in the glass-ceramic annealed in a reducing atmosphere, where 134 °C was the dominant feature, accompanied by a shoulder at about 180 °C. The high temperature peak at 134 °C has been observed on Eu2+-doped BaCl2 nanocrystalline powder, and it has been assigned to the recombination of F(Cl) centers in the BaCl2 crystalline lattice [21]. During the heating, the electrons are thermally released from the F(Cl) trapping centers and recombine with holes trapped as Eu3+/(Eu2+- hole) centers giving rise to the excited (Eu2+)* ions and radiative emission according to:
(Eu2+- hole) + é–kBT(Eu2+)*→Eu2+ + hν
The nature of the 97 and 180 °C glow peaks remains unclear, but it might be related to the recombination of F-type centers perturbed by impurities [43] or other structural defects, as was inferred from the XRD analysis.

4. Conclusions

An europium doped BaO–B2O3–BaCl2 chloroborate glass-ceramic was produced by melt-quenching followed by glass crystallization at T = 570 °C. X-ray diffraction and scanning electron microscopy measurements revealed the formation of orthorhombic BaCl2 nanocrystals of about tens of nm size accompanied by a smaller amount of BaB2O4 nanocrystals. Structural analysis indicated strong distortions of the BaCl2 crystalline lattice, which was associated with the ionic impurities and other defects during the nanocrystal growth process in the glass matrix.
The photoluminescence properties analysis showed that in the glass-ceramics, the Eu3+ ions are incorporated dominantly in the glass matrix. In addition, a reduction process of Eu3+ to Eu2+ was revealed by the presence of broad blue luminescence peaks at 407 and 480 nm, assigned to the Eu2+ ion luminescence in different environments: perturbed sites in the BaCl2 nanocrystals and in the glass matrix, respectively.
Thermoluminescence curves recorded on the Eu-doped glass-ceramic showed two glow peaks at 97 and 134 °C. The high temperature peak was due to the F(Cl) center recombination in the BaCl2 nanocrystals, and the low temperature peak at 97 °C was tentatively assigned to the recombination of perturbed F-centers.
In conclusion, glass-ceramic materials based on stabilized rare-earth doped BaCl2 nanoparticles embedded in a glass matrix were demonstrated as attractive potential candidates for phosphor related applications. They offer a viable solution to overcome the disadvantages of the BaCl2 crystal phosphor: raw material purification, clean environment control requirements during crystal growth, and chemical instability to water. Hence, its remarkable performances as a scintillator, x-ray storage phosphor, or thermoluminescence dosimeter can be used for practical applications of radiation detection. In particular, new developed chloroborate glass-ceramics can be processed at lower temperature and in an open atmosphere compared to the fluorozirconate glass-ceramics. However, further improvements of the optical properties and transparency through a better control of the processing parameters are required as a prerequisite condition for future applications.

Author Contributions

Both authors M.S. and C.E.S. cooperated on the physical characterization and analysis of all the data: C.E.S. was involved specifically involved in sample preparation, photoluminescence, and thermoluminescence measurements; M.S. was involved in the structural analysis and colorimetric characterization. The manuscript was written by C.E.S. and M.S. in collaboration. They contributed to discussions and reviewed the manuscript and All authors have read and agreed to the published version of the manuscript.

Funding

This research was funded by the Romanian Ministry of Research and Innovation (MCI) through the grant PFE no. 12/2018 and PN19-03 Core Program of NIMP (2020).

Acknowledgments

The authors acknowledge Elena Matei for her help and useful discussions regarding the SEM measurements.

Conflicts of Interest

The authors declare no conflict of interest.

References

  1. Liu, X.; Zhou, J.; Zhou, S.; Yue, Y.; Qiu, J. Transparent glass-ceramics functionalized by dispersed crystals. Prog. Mater. Sci. 2018, 97, 38–96. [Google Scholar] [CrossRef]
  2. De Pablos-Martín, A.; Durán, A.; Pascual, M.J. Nanocrystallisation in oxyfluoride systems: Mechanisms of crystallisation and photonic properties. Int. Mater. Rev. 2018, 57, 165–186. [Google Scholar] [CrossRef]
  3. Fedorov, P.P.; Luginina, A.A.; Popov, A.I. Transparent oxyfluoride glass ceramics. J. Fluor. Chem. 2015, 172, 22–50. [Google Scholar] [CrossRef]
  4. Paßlick, C.; Ahrens, B.; Henke, B.; Johnson, J.A.; Schweizer, S. Crystallization behavior of rare-earth doped fluorochlorozirconate glasses. J. Non-Cryst. Solids 2011, 357, 2450–2452. [Google Scholar] [CrossRef] [PubMed] [Green Version]
  5. Alvarez, C.J.; Leonard, R.L.; Gray, S.K.; Johnson, J.A.; Petford, A.K. Structural and Kinetic Analysis of BaCl2 Nanocrystals in Fluorochlorozirconate Glass-Ceramics. J. Am. Ceram Soc. 2015, 98, 1099–1104. [Google Scholar] [CrossRef]
  6. Pfau, C.; Skrzypczak, U.; Ahrens, B.; Schweizer, S. Multiphonon relaxation of rare-earth ions in fluorozirconate-based glass ceramics. J. Phys. Condens. Matter 2014, 26, 025406. [Google Scholar] [CrossRef]
  7. Johnson, J.A.; Schweizer, S.; Henke, B.; Chen, G.; Woodford, J.; Newman, P.; MacFarlane, D. 2006 Eu-activated from fluorochlorozirconate glass-ceramic scintillators. J. Appl. Phys. 2006, 100, 034701. [Google Scholar] [CrossRef]
  8. Schweizer, S.; Hobbs, L.W.; Secu, M.; Spaeth, J.M.; Edgar, A.; Hamlin, J. Photostimulated luminescence fluorochlorozirconate glass ceramics and the effect of crystallite size. J. Appl. Phys. 2005, 97, 083522. [Google Scholar] [CrossRef]
  9. Pfau, C.; Paßlick, C.; Gray, S.K.; Johnson, J.A.; Johnson, C.E.; Schweizer, S. Mössbauer spectroscopy of europium-doped fluorochlorozirconate glasses and glass ceramics: Optimization of storage phosphors in computed radiography. J. Phys. Condens. Matter 2013, 25, 205402. [Google Scholar] [CrossRef] [Green Version]
  10. Yan, Z.; Gundiah, G.; Bizarri, G.A.; Samulon, E.C.; Derenzo, S.E.; Bourret-Courchesne, E.D. Eu2+ -activated BaCl2, BaBr2 and BaI2 scintillators revisited. Nucl. Instrum. Methods Phys. Res. Sect. A 2014, 735, 83–87. [Google Scholar] [CrossRef]
  11. Secu, M.; Kalchgruber, R.; Schweizer, S.; Spaeth, J.M.; Edgar, A. Photostimulated luminescence in BaX 2: Eu 2+(X=Br, Cl) X-ray storage phosphors. Radiat. Eff. Defects Solids 2002, 157, 957. [Google Scholar] [CrossRef]
  12. Margha, F.H.; Abdel-Hameed, S.A.M.; Ghonim, N.A.; Saad, E.A.; Satokawa, S.; Kojima, T. Crystallization behavior of new transparent glass-ceramics based on barium borate glasses. J. Ceram. Soc. Jpn. 2008, 116, 624–631. [Google Scholar] [CrossRef] [Green Version]
  13. Steudel, F.; Rimbach, A.C.; Loos, S.; Ahrens, B.; Schweizer, S. Effect of induced crystallization in rare-earth doped lithium borate glass. Radiat. Meas. 2016, 90, 274–278. [Google Scholar] [CrossRef]
  14. Dwivedi, Y.; Rai, S.B. Blue and Red Luminescence from Europium-Doped Barium Tetra-Borate Crystals. J. Am. Ceram. Soc. 2010, 93, 727–731. [Google Scholar] [CrossRef]
  15. Kao, Y.H.; Yi, H.; Zheng, H.; Mackenzie, J.D.; Perry, K.; Bourhill, G.; Perry, J.W. Second harmonic generation in transparent barium borate glass-ceramics. J. Non-Cryst. Solids 1994, 167, 247–254. [Google Scholar] [CrossRef]
  16. Brekhovskikh, M.N.; Voronko, Y.u.K.; Dmitruk, L.N.; Moiseeva, L.V.; Petrova, O.B.; Popov, A.V.; Fedorov, V.A. Synthesis and glass formation in the BaO-B2O3-BaCl2 system. Inorg. Mater. 2010, 46, 1391–1395. [Google Scholar] [CrossRef]
  17. Appleby, G.A.; Edgar, A.; Williams, G.V.M.; Bos, A.J.J. Photostimulated luminescence from BaCl2:Eu2+ nanocrystals in lithium borate glasses following neutron irradiation. Appl. Phys. Lett. 2006, 89, 101902. [Google Scholar] [CrossRef] [Green Version]
  18. Krause, W.; Nolze, G. PowderCell a program for the representation and manipulation of crystal structures and calculation of the resulting X-ray patterns. J. Appl. Cryst. 1996, 29, 301–303. [Google Scholar] [CrossRef]
  19. Kapoor, S.; Bola, G.H.; Betzen, A.; Affatigato, M.; Feller, S. Physical Properties of Barium Borate Glasses determined over a Wide Range of Compositions. J. Non-Cryst. Solids 2000, 270, 215–222. [Google Scholar] [CrossRef]
  20. Hull, S.; Norberg, S.T.; Ahmed, I.; Eriksson, S.G.; Mohn, C.E. High temperature crystal structures and superionic properties of SrCl2, SrBr2, BaCl2 and BaBr2. J. Solid State Chem. 2011, 184, 2925–2935. [Google Scholar] [CrossRef]
  21. Secu, C.; Rostas, A.M. Investigations of BaCl2:Eu2+ nanophosphor using electron paramagnetic resonance, structural analysis and thermoluminescence. J. Alloy Compd. 2020, 815, 152400. [Google Scholar] [CrossRef]
  22. Shannon, R.D. Revised effective ionic radii and systematic studies of interatomic distances in halides and chalcogenides. Acta Cryst. Sect. A 1976, 32, 751–767. [Google Scholar] [CrossRef]
  23. Schweizer, S.; Hobbs, L.W.; Secu, M.; Spaeth, J.-M.; Edgar, A.; Williams, G.V.M. Photostimulated luminescence in Eu-doped fluorochlorozirconate glass ceramics. Appl. Phys. Lett. 2003, 83, 449. [Google Scholar] [CrossRef]
  24. Aronne, A.S.; Esposito, S.; Pernice, P. FTIR and DTA study of Structural Transformations and Crystallisation in BaO–B2O3–TiO2 Glasses. Phys. Chem. Glasses 1999, 40, 63–68. [Google Scholar]
  25. Dejneka, M.; Snitzer, E.; Riman, R.E. Blue, green and red fluorescence and energy-transfer of Eu3+ in fluoride glasses. J. Lumin. 1995, 65, 227–245. [Google Scholar] [CrossRef]
  26. Edgar, A.; Williams, G.V.M.; Hamelin, J. Optical scattering in glass ceramics. Curr. Appl. Phys. 2006, 6, 355–358. [Google Scholar] [CrossRef]
  27. Secu, C.E.; Bartha, C.; Polosan, S.; Secu, M. Thermally activated conversion of a silicate gel to an oxyfluoride glass ceramic: Optical study using Eu3+ probe ion. J. Lumin. 2014, 146, 539–543. [Google Scholar] [CrossRef]
  28. Gorller-Walrand, C.; Binnemans, K. Spectral Intensities of f-f Transition. In Handbook on the Physics and Chemistry of Rare Earths; Gshneidner, K.A., Jr., Eyring, L., Eds.; Elsevier: North-Holland, Amsterdam, 1988; Volume 25, Chapter 167; pp. 101–264. [Google Scholar]
  29. Kodaira, C.A.; Brito, H.F.; Malta, O.L.; Serra, O.A. Luminescence and energy transfer of the europium(III) tungstate obtained via the Pechini method. J. Lumin. 2003, 101, 11–21. [Google Scholar] [CrossRef]
  30. Hreniak, D.; Strek, W.; Amami, J.; Guyot, Y.; Boulon, G.; Goutaudier, C.; Pazik, R. The size-effect on luminescence properties of BaTiO3:Eu3+ nanocrystallites prepared by the sol–gel method. J. Alloy Compd. 2004, 380, 348–351. [Google Scholar] [CrossRef]
  31. de Silva, G.F.; Malta, O.L.; Donega, C.M.; Simas, A.M.; Longo, R.L.; Santa-Cruz, P.A.; Silva, E.F., Jr. degradation temperatures for the lanthanide ion complexes PA. Coord. Chem. Rev. 2000, 196, 165–195. [Google Scholar]
  32. Wen, H.; Duan, C.; Jia, G.; Tanner, P.A.; Brik, M.G. Glass composition and excitation wavelength dependence of the luminescence of Eu3+ doped lead borate glass. J. Appl. Phys. 2011, 110, 033536. [Google Scholar] [CrossRef]
  33. Dorenbos, P. Energy of the first 4f7→ 4f65d transition of Eu2+ in inorganic compounds. J. Lumin. 2003, 104, 239–260. [Google Scholar] [CrossRef]
  34. Pei, Z.W.; Su, Q.; Zhang, J.Y. The Valence Change from RE3+ to RE2+ (RE = Eu, Sm, Yb) in SrB4O7: RE Prepared in Air and the Spectral Properties of RE2+. J. Alloy Compd. 1993, 198, 51–53. [Google Scholar] [CrossRef]
  35. Pei, Z.; Zeng, Q.; Su, Q. The Application and a Substitution Defect Model for Eu3+-Eu2+ Reduction in Non Reducing Atmospheres in Borates Containing BO4 Anion Groups. J. Phys. Chem. Solids 2000, 61, 9–12. [Google Scholar] [CrossRef]
  36. Secu, M.; Secu, C.E.; Polosan, S.; Aldica, G.; Ghica, C. Crystallization and spectroscopic properties of Eu doped CaF2 nanocrystals in transparent oxyfluoride glass-ceramics. J. Non-Cryst. Solids 2009, 355, 1869–1872. [Google Scholar] [CrossRef]
  37. Gawande, A.B.; Sonekar, R.P.; Omanwar, S.K. Photoluminescence Properties of Eu2+ in BaB2O4. Elixir Chem. Phys. 2014, 75, 27993–27995. [Google Scholar]
  38. Kobayasi, K.; Mroczkowski, S.; Owen, J.F.; Brixner, L.H. Fluorescence Lifetime and Quantum Efficiency for 5d-4f Transitions in Eu2+ Doped Chloride and Fluoride Crystals. J. Lumin. 1980, 21, 247–257. [Google Scholar] [CrossRef]
  39. Secu, C.E.; Negrila, C.; Secu, M. Investigation of sol-gel derived BaCl2:Eu2+ luminescent nanophosphor and the corresponding PVP@ BaCl2:Eu2+ polymer nanocomposite. J. Phys. D Appl. Phys. 2018, 51, 305302. [Google Scholar] [CrossRef]
  40. McKeever, S.W.S. Thermoluminescence of Solids; Cambridge University Press: New York, NY, USA, 1985. [Google Scholar]
  41. Bos, A.J.J. Theory of thermoluminescence. Radiat Meas 2006, 41, 45–56. [Google Scholar] [CrossRef]
  42. Iflazoglu, S.; Yilmaz, A.A.; Bulur, E. Structural, photo, optical and thermal luminescent properties of beta barium metaborate. J. Alloy Compd. 2020, 829, 154430. [Google Scholar] [CrossRef]
  43. Robinson, J. A Photo and Thermally Stimulated Luminescence Study of BaCl2:Eu2+ with Application to Neutron Imaging. Master’s Thesis, Victoria University of Wellington, Wellington, New Zealand, 2008. [Google Scholar]
Figure 1. Thermal analysis curves of the thermogravimetry (TG)/differential scanning calorimetry (DSC) recorded on Eu-doped chloroborate glass.
Crystals 10 01101 g001
Figure 2. X-ray diffraction (XRD) patterns of the initial Eu-doped chloroborate glass and glass-ceramic after subsequent annealing at indicated temperatures by comparison to orthorhombic BaCl2 (PDF 00-024-094; the peak assignments of β-BaB2O4 and Al2O3 are indicated).
Crystals 10 01101 g002
Figure 3. Scanning electron microscopy (SEM) image (cross-section) of the chloroborate glass-ceramic annealed at 555 °C (left) and the corresponding EDX analysis with the characteristic x-ray lines assignment (right).
Crystals 10 01101 g003
Figure 4. Optical absorption spectra of initial Eu-doped chloroborate glass and glass-ceramic after 570 °C annealing; the doted curve represents the λ−4 Rayleigh scattering dependence curve.
Crystals 10 01101 g004
Figure 5. Photoluminescence spectra of the initial Eu-doped chloroborate glass and glass-ceramic annealed at 570 °C in an air and reducing atmosphere (H2–Ar) under a 350 nm excitation wavelength.
Crystals 10 01101 g005
Figure 6. Photoluminescence excitation spectra recorded on the Eu-doped chloroborate glass-ceramic after annealing at 570 °C in a reducing atmosphere (H2–Ar).
Crystals 10 01101 g006
Figure 7. The chromaticity coordinates of the Commission Internationale de l’Eclairage (CIE) chromaticity diagram of the Eu-doped chloroborate glass (G) and glass-ceramic (GC) samples.
Crystals 10 01101 g007
Figure 8. Normalized thermoluminescence curves recorded on undoped and Eu-doped chloroborate glass-ceramics after x-ray irradiation at room temperature.
Crystals 10 01101 g008
Table 1. The results of the x-ray diffraction (XRD) pattern analysis of Eu-doped chloroborate glass-ceramic annealed at 570 °C in an air and reducing atmosphere (H2–Ar); the lattice parameters for BaCl2 [20] and BaCl2:Eu2+ nanocrystals [21] are included for comparison.
Samplea (Å)b (Å)c (Å)Cell Volume (Å3)
Annealed in air7.9034.7519.422353.9
Annealed in H2-Ar7.9064.7529.426354.2
BaCl2 [20]7.8813 (2)4.7369 (1)9.4360 (2)352.27
BaCl2:Eu2+ [21]7.878 (5)4.735 (8)9.428 (1)351.68
Table 2. The results of the J-O parameter analysis of the Eu-doped chloroborate glass and glass-ceramic annealed at 570 °C in an air and reducing atmosphere (H2–Ar); the J-O parameters for the (29PbO–70B2O3-0.5Eu2O3) lead borate glass are included [32] for comparison.
SampleΩ2 (×10−20 cm2)Ω4 (×10−20 cm2)PL Lifetime (ms)
Initial glass5.93.91.86 ± 0.02
Annealed in air5.83.92.20 ± 0.02
Annealed in H2-Ar5.13.92.20 ± 0.02
Lead borate glass [32]6.034.29
Publisher’s Note: MDPI stays neutral with regard to jurisdictional claims in published maps and institutional affiliations.

