Article

UVB LEDs Grown by Molecular Beam Epitaxy Using AlGaN Quantum Dots

1
French National Centre for Scientific Research, Université Côte d’Azur, CEDEX 2, 06108 Nice, France
2
Laboratoire Charles Coulomb and Université Montpellier 2, UMR 5221, 34095 Montpellier, France
*
Author to whom correspondence should be addressed.
Crystals 2020, 10(12), 1097; https://doi.org/10.3390/cryst10121097
Submission received: 11 November 2020 / Revised: 23 November 2020 / Accepted: 28 November 2020 / Published: 30 November 2020
(This article belongs to the Special Issue Nitride Compound Light Emitting Diodes)

Abstract

:
AlGaN based light emitting diodes (LEDs) will play a key role for the development of applications in the ultra-violet (UV). In the UVB region (280–320 nm), phototherapy and plant lighting are among the targeted uses. However, UVB LED performances still need to be improved to reach commercial markets. In particular, the design and the fabrication process of the active region are central elements that affect the LED internal quantum efficiency (IQE). We propose the use of nanometer-sized epitaxial islands (i.e., so called quantum dots (QDs)) to enhance the carrier localization and improve the IQE of molecular beam epitaxy (MBE) grown UVB LEDs using sapphire substrates with thin sub-µm AlN templates. Taking advantage of the epitaxial stress, AlGaN QDs with nanometer-sized (≤10 nm) lateral and vertical dimensions have been grown by MBE. The IQE of the QDs has been deduced from temperature dependent and time resolved photoluminescence measurements. Room temperature IQE values around 5 to 10% have been found in the 290–320 nm range. QD-based UVB LEDs were then fabricated and characterized by electrical and electroluminescence measurements. On-wafer measurements showed optical powers up to 0.25 mW with external quantum efficiency (EQE) values around 0.1% in the 305–320 nm range.

Graphical Abstract

1. Introduction

Nitride based light emitting diodes (LEDs) can emit in the ultra-violet (UV) range from the near UV [1], which is a part of the UVA region (400 nm ≤ λUVA ≤ 320 nm), down to the UVC region (280 nm ≤ λUVC ≤ 100 nm) reaching a minimum wavelength emission of 210 nm achieved by using an AlN p-i-n junction [2]. Compared to the other existing UV sources, LEDs offer strong advantages such as low power consumption, compactness and long lifetimes. Furthermore, they are an environmentally-friendly solution to the commonly used mercury (Hg) lamps, which bring toxicity and recycling issues. Indeed, the replacement of Hg lamps has been planned to start from 2020 by the Minamata Convention on mercury [3]. Aluminum gallium nitride (AlxGa1−xN) based LEDs are expected to be the new UV technology and their development has attracted very important research activities over the last decade [4]: In particular, the fabrication of UVB and UVC-LEDs represent major topics. The UVC spectral region is targeting strategic applications for sterilization, water purification and surface disinfection, by inducing bacteria cell inactivation [5]. Another region of interest is the UVB for medical and environmental applications, such as skin treatment and plant growth [4]. In this spectral region, external quantum efficiencies (EQEs) of 4.4% and 2.2% at a current of 20 mA and 50 mA were demonstrated recently for LEDs emitting at 295 nm [6] and 310 nm [7], respectively. Therefore, the EQEs of UVB LEDs remain limited to few percent [8] and novel processes are required to improve these values.
AlxGa1−xN LEDs are mainly grown on sapphire, which is well adapted to both UV applications, due to its transparency, and to high temperature growth processes that can play a central role for the reduction of threading dislocation densities (TDD) induced by the low mobility of Al species [9]. EQEs of LEDs are the result of the product of the injection efficiency (IE), the internal quantum efficiency (IQE) and the extraction efficiency (EE) [10]. Therefore, it is crucial to develop processes to improve these parameters to reach high EQEs: Among these, the material crystalline quality plays a central role and the presence of threading dislocations and point defects, which are non-radiative centers, have been shown to strongly decrease the IQE of LEDs [11]. Several methods have been successfully proposed to reach TDD in the low 10−9 cm−2 range or below, including an increase of the growth temperatures [12], post-growth high-temperature annealing [13], migration enhanced epitaxy by ammonia pulse-flow method [14], or epitaxial lateral overgrowth [15]. Another way to improve the IQE of LEDs is to favor radiative recombination by an enhancement of the carrier confinement in the active region: This structure design can be obtained by using specific growth conditions to create band structure potential fluctuations [16] or the formation of quantum dots (QDs) [17,18,19,20].
Regarding the use of QDs, molecular beam epitaxy (MBE) has been shown to be an efficient approach to control their fabrication process: The use of in situ reflexion high energy electron diffraction (RHEED) allows for a real-time monitoring of the growth front morphology. Indeed, the QD formation is evidenced by a spotty RHEED pattern coming from the presence of 3 dimensional (D) nanometer-sized islands and eventually chevrons originating from a specific orientation of QD facets [21,22]. Taking advantage of the epitaxial stress in the hetero-epitaxial growth of AlyGa1−yN on AlxGa1−xN (with y < x), it was shown that AlyGa1−yN based nanostructures could be spontaneously formed during growth [23,24] and their shape (i.e., dot or dash) controlled by performing a post-growth step [25,26]. In addition, adjusting the QD growth parameters (Al composition, deposited amount) has allowed covering a broad range from the UVA to the UVC [27,28], and the potential of AlyGa1−yN QDs (with y between 0.1 and 0.4) on AlxGa1−xN (with x between 0.5 and 0.7) was also shown in the case of very high dislocation densities (above 10−10 cm−2) with IQEs reaching almost 20% [28]. In this study, using QD active regions made of Al0.2Ga0.8N QDs in Al0.7Ga0.3N cladding layers, we have designed and fabricated LEDs and studied their main electro-optical characteristics. First, the structural and photoluminescence (PL) properties of Al0.2Ga0.8N QDs were investigated. It was found that the QDs have average heights and diameters varying between 2 nm and 3 nm and between 5 nm and 15 nm, respectively, depending on growth parameters. Regarding photoluminescence (PL), an emission ranging between 300 nm and 340 nm was observed at room temperature. Then, by performing time-resolved and temperature dependent measurements, the IQE has been found between 5% and 10%. Next, QD based LEDs with two different active region designs have been fabricated. The devices electrical and optical properties were characterized and compared: The LEDs show a broad electroluminescence (EL) emission peak centered between 305 nm and 345 nm, depending on the current density and the active region design. The optical power, measured directly on-wafer, is increasing as a function of the current density up to a value of around 0.25 mW at 100 A/cm2 for both type of LEDs. At this current density, an EQE of 0.06 % is found for an EL emission peak centered in the UVB region, i.e., in the 305–320 nm range.

2. Materials and Methods

The LED structures were grown on (0001) sapphire substrates by molecular beam epitaxy (MBE) in a RIBER 32 P reactor. Solid sources were used for the III-elements (Al, Ga) and the dopants (Si for n-type layers and Mg for p-type layers). Concerning the nitrogen source, ammonia (NH3) was chosen as the precursor for the growth except for the fabrication of the QD active region for which a RIBER RF nitrogen (N2) plasma source was used. This specificity is related to the surface energy contribution during the QD formation process [29]: The use of NH3 promotes a 2 dimensional (D) growth mode and inhibits the formation of 3D islands and QDs, whereas under N2 a 2D-3D “Stranski–Krastonov” growth mode can be observed [30]. Two structures (referred as LED-A and LED-B) were fabricated as described in Figure 1. A similar fabrication process was used for both cases except for the active region. At first, a 130 nm-thick AlN buffer layer was grown following the growth conditions described in [31]: A 3 nm thick AlN nucleation layer was initially grown at 500 °C and followed by the growth of an AlN layer at a temperature of 1000 °C. Next, the p-i-n structure was fabricated by first growing a 0.7 µm thick Si-doped n-Al0.7Ga0.3N layer at 870 °C, with a Si concentration estimated at around 1 × 1019 cm-3, and an active region consisting of three (LED-A) and five (LED-B) (Al,Ga)N QD planes with an Al nominal composition (n.c.) of 0.2, separated by Al0.7Ga0.3N barriers lattice matched to the Al0.7Ga0.3N template.The Al0.2Ga0.8N (n.c.) QDs 2D equivalent thickness is 8 MLs (i.e., about 2 nm with 1 ML being equal to half the c lattice parameter, i.e., 0.257 nm for Al0.2Ga0.8N considering a variation of the lattice parameter following Vegard’s law between GaN and AlN). In the case of LED-A, a 10 nm thick cladding layer was grown in between the QD planes whereas the thickness was set to 5 nm for the cladding layer of LED-B. After the deposition of the last QD plane, a 20 nm thick Al0.7Ga0.3N layer was grown at 870 °C. This was followed by the p-type region composed of a 10 nm Al0.8Ga0.2N:Mg electron blocking layer and a 10 nm Al0.7Ga0.3N:Mg layer, by using a Mg flux of 2 × 10⁻⁹ Torr and deposited at 820 °C and 800 °C, respectively. Finally, a 30 nm GaN:Mg contact layer was grown at 770 °C using a Mg flux of 4 × 10⁻⁹ Torr. The Mg concentrations in each layer, based on calibrations by secondary ion mass spectroscopy on reference samples, are estimated to be about 5 × 10¹⁹ atoms·cm−3 in both Al0.7Ga0.3N and Al0.8Ga0.2N layers and 1 × 10²⁰ atoms·cm−3 in the top GaN layer. From the growth processes used to fabricate the LED structures and previous studies that are based on X-ray diffraction and transmission electron microscopy measurements performed on reference samples [32], the TDD in the LED structures is estimated to be ranging between: TDD ~ 6-8 × 1010 cm−2 for the AlN template and TDD ~3–6 × 1010 cm−2 for the Al0.7Ga0.3N/Al0.2Ga0.8N QD structures [31].
To investigate the optical properties of Al0.2Ga0.8N QDs, samples composed of a buried Al0.2Ga0.8N QD plane grown in an Al0.7Ga0.3N cladding layer were grown and the influence of the Al0.2Ga0.8N deposited amount was investigated by changing it from 8 to 12 MLs. In addition, an Al0.2Ga0.8N QD plane was grown at the surface of the top cladding layer. The surface QD plane was investigated by atomic force microscopy (AFM) to study the QD morphology. Concerning the optical characteristics, they were studied by photoluminescence (PL) and time-resolved PL (TRPL). The AFM measurements have been done in tapping mode using a diamond coated tip with a typical radius of 5 nm. The PL measurements were carried out in a closed cycle He cryostat using a frequency-doubled Ar laser at 244 nm (5.08 eV) and an excitation power of 20 mW. TRPL measurements were performed at 8K using a mode-locked frequency-tripled titanium–sapphire laser with a wavelength of 260 nm (4.77 eV). The laser excitation power was about 200 μW.
After the growth, LEDs with a squared geometry were processed by using photolithography and reactive ion etching. The mesas are covered by a thin Ni/Au (5/5 nm) semi-transparent current spreading layer plus a Ni/Au (5/200 nm) contact as top electrode to p-GaN. The contact on n-Al0.7Ga0.3N consists of a stacking of Ti/Al/Ni/Au (30/180/40/200 nm). LEDs with a squared mesa size of 310 µm (corresponding to mesa areas of ~96000 µm2) have been studied. The LEDs were characterized at room temperature by performing on wafer current–voltage (I–V) and electroluminescence (EL) measurements. The EL was measured from the backside of the LED chips by collecting the light extracted from the sapphire substrate side in an UV-grade optical fiber connected to a linear CCD spectrometer with a spectral resolution of 2.5 nm. The optical power (Popt) was also measured from the backside of the chips by using a calibrated UV enhanced Si photodiode.

3. Results

In the first part of this section, theAl0.2Ga0.8N (n.c.) QDs main structural and optical properties are presented. The second part is dedicated to the investigation of the QD-based LEDs including PL, I–V, and EL measurements.

3.1. Al0.2Ga0.8N QDs Structural and Optical Properties

A typical AFM image of Al0.2Ga0.8N (n.c.) QDs grown at the surface of an Al0.7Ga0.3N layer is shown in Figure 2a. Similarly to previous results [28,33], the QD densities determined from AFM measurements have been found between 2 × 10¹¹ and 6 × 10¹¹/cm2 and their diameter varies between 5 and 15 nm. From previous transmission electron microscopy measurements [28], the average QD height is estimated to be of the order of the Al0.2Ga0.8N (n.c.) deposited amount ranging from 2 nm (for 8 MLs) to 3 nm (for 12 MLs), with a height distribution of ±20%. In Figure 2b are presented PL spectra at 300 K of a series of samples of Al0.2Ga0.8N (n.c.) QDs with deposited amounts ranging from 8 to 12 MLs. Each spectrum is characterized by a broad peak originating from the QD emission: Decreasing the amount of Al0.2Ga0.8N from 12 MLs to 8 MLs induces a UV shift of the main PL maximum intensity from 324 to 308 nm (3.83 to 4.02 eV). The PL spectra full width at half maximum (FWHM) are similar and found between 12 and 15 nm (≈150 to 190 meV). This broadening reflects alloy disorder in (Al,Ga)N and QD sizes inhomogeneity, i.e., confinement energies and Stark effect inhomogeneities as discussed in Section 4 below. Next, TRPL measurements are presented in Figure 2c, along with the temperature dependent PL measurement in insert (measured in a temperature range between 8 K and 300 K). At first, it is found that the PL transients exhibit a two-exponential decay behavior. This particular decrease of the PL intensity is attributed to the presence of non-radiative recombination channels unsaturated in the photo-injection conditions. As detailed in [26,34], the time dependence of the PL intensity I(t) can be fitted by considering fast (τfast) and long (τslow) decay times using the equation:
I ( t ) = A f a s t exp ( t τ f a s t ) + A s l o w exp ( t τ s l o w )
with Afast and Aslow the fast (non radiative) and slow (radiative) decay coefficients, respectively. This bi-exponential behavior is attributed to two different types of regions within the QD plane, i.e., regions with predominant radiative channels and other ones with additional competing non-radiative recombination centers [35]. τslow defines the radiative lifetime, while τfast is a combination of both radiative and non-radiative lifetimes. Values in the range of 2–2.2 ns and 16.8-18 ns have been determined for τfast and τslow, respectively, while Afast and Aslow have values in the 930–970 and 170–185 range, respectively. From these data, it is possible to determine the IQE of Al0.2Ga0.8N (n.c.) QDs in Al0.7Ga0.3N cladding layers which will be used as the active region of UV LEDs presented in the following section. The IQE at low temperature (LT) can then be calculated as follows:
I Q E L T = A f a s t τ f a s t + A s l o w τ s l o w ( A f a s t + A s l o w ) τ s l o w
and IQE-LT values between 24% and 28% are obtained. In order to estimate the IQE at room temperature (300 K), temperature dependent PL measurements have also been realized and the evolution of the integrated PL intensity as a function of temperature determined (insert of Figure 2(c)). As discussed in a previous study [28], the IQE at 300 K is obtained by considering the relation:
IQE = IQE-LT × IPL(300 K)/IPL(LT)
with IPL(300 K) the integrated PL intensity at 300 K and IPL(LT) the integrated PL intensity at 8 K. The ratio IPL(300 K)/IPL(LT) is found to be between 0.2 and 0.3, giving IQE values at room temperature for Al0.2Ga0.8N (n.c.) QDs in Al0.7Ga0.3N cladding layers in the range of 4.8%–8.4% in agreement with previous results and confirming the robustness of QDs in structures with high dislocation densities (> 1010 cm−2) [28]. Using similar active regions, QD-LED structures (LED-A and LED-B) were then fabricated as described in Figure 1 and Section 2 and are presented in the next section.

3.2. QD-Based LEDs Characteristics

The LEDs have a squared mesa size of 310 µm and were characterized at room temperature by performing on wafer I–V measurements as well as EL determined from the backside of the device (i.e., extracted from the sapphire substrate).

3.2.1. Photoluminescence

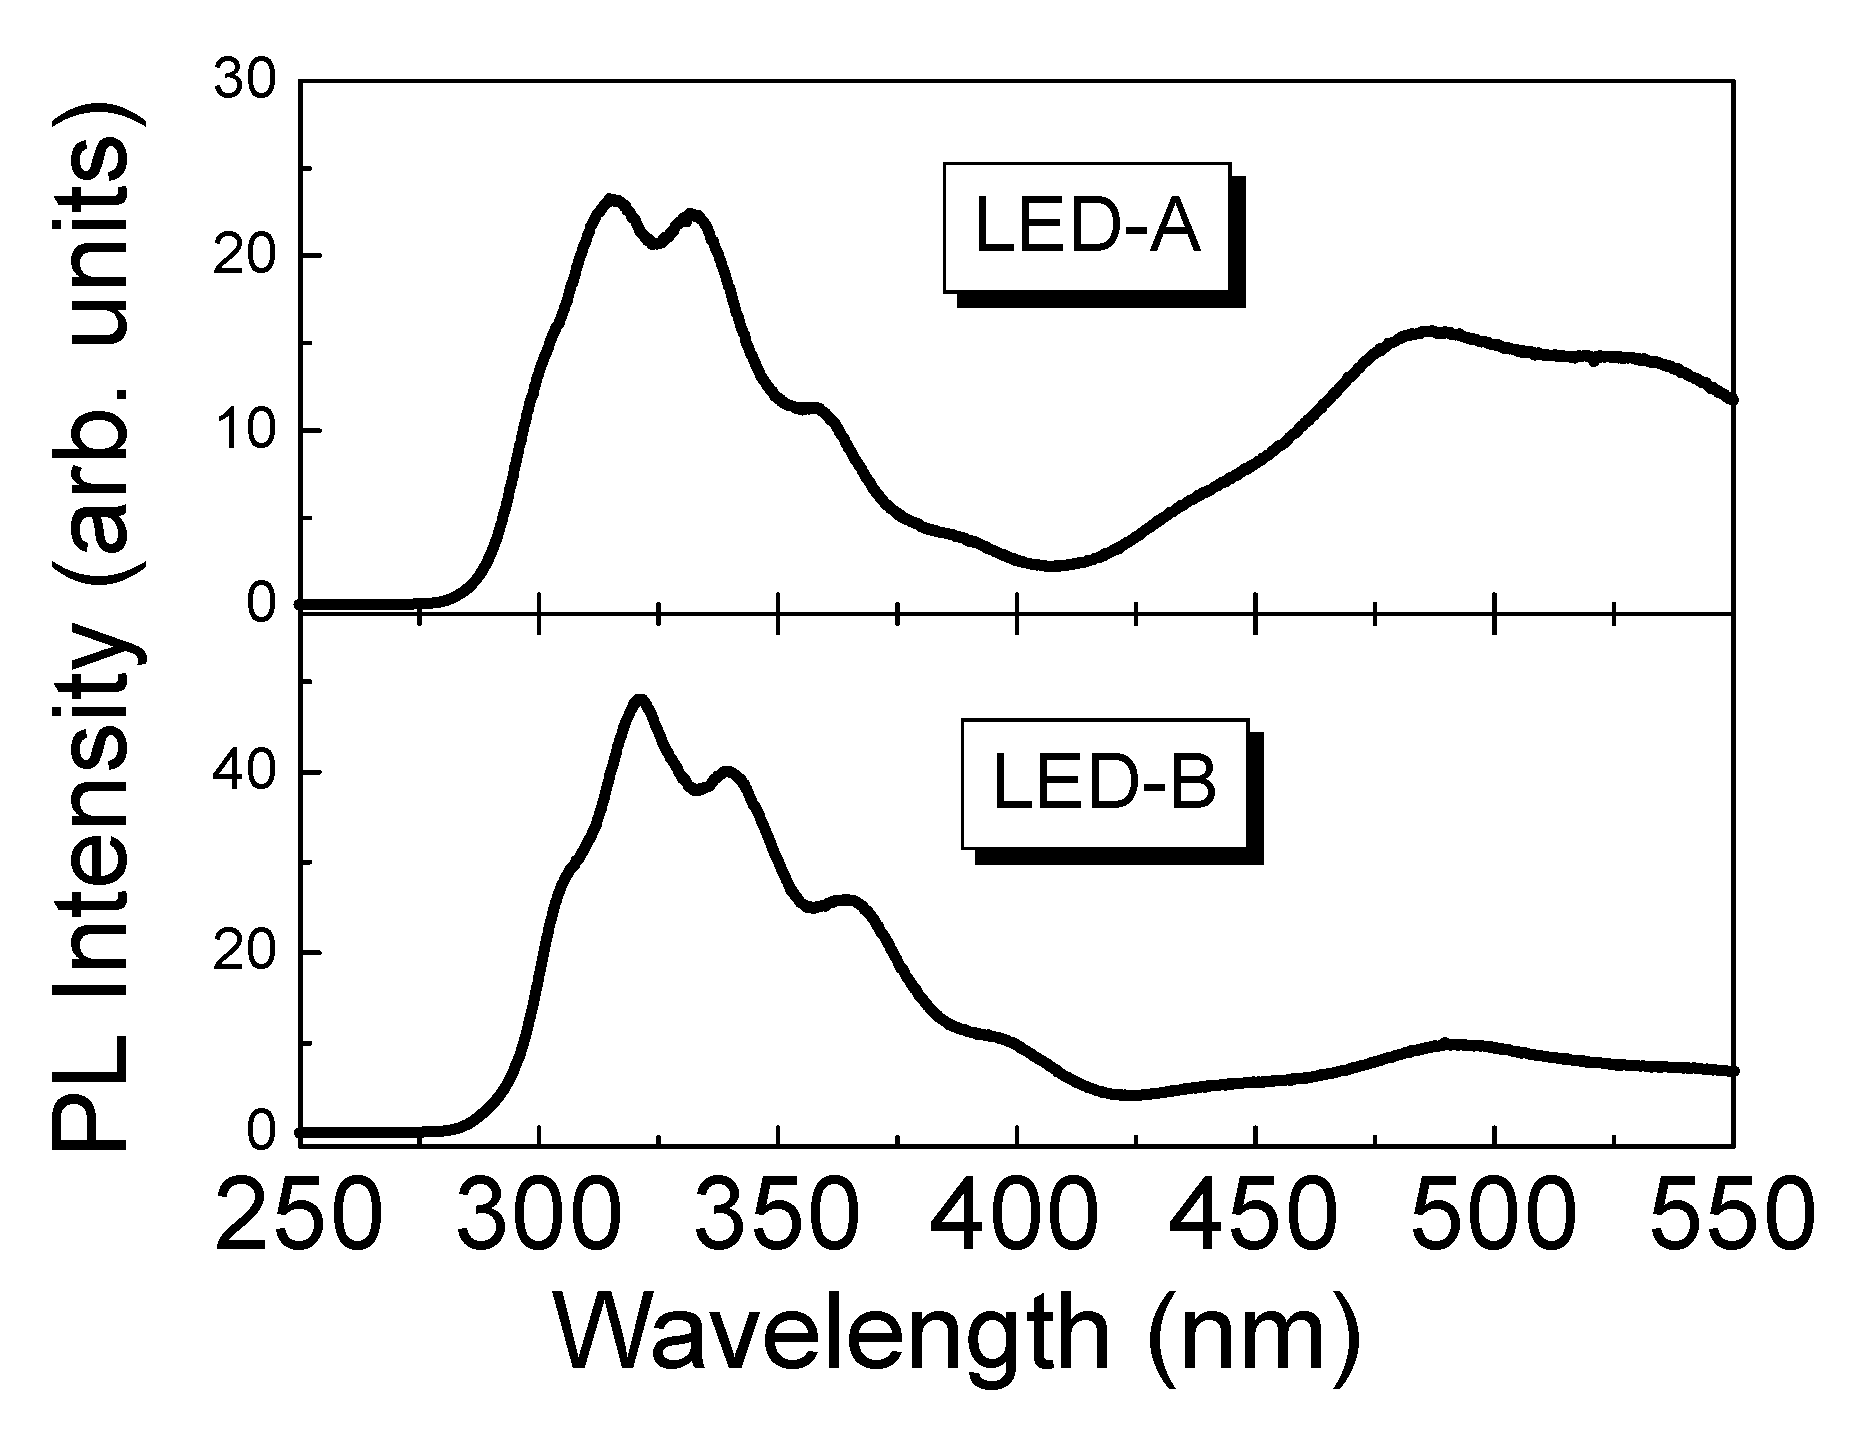
Before processing the heterostructures, their optical properties were studied at room temperature using the frequency-doubled Ar laser at 244 nm. The results for LED-A and LED-B structures are shown and compared in Figure 3. In each spectrum, the photoluminescence covers a very large spectral range spanning wavelengths from 280 nm to above 550 nm. More precisely, the emission is separated between two regions: The most intense one is made of multi-peaks in the UV range with a maximum peak intensity at 314 nm for LED-A and at 320 nm for LED-B. The FWHM of this emission is very broad, with a value of 50 nm and 67 nm (i.e., 630 and 810 meV) for LED-A and LED-B, respectively. This is much broader than the PL bands of single QD planes shown in Figure 2b, and reflects in our opinion the QD size and composition variations between the QD planes along the growth direction. In fact, for both structures, the emission ranges from about 280 nm to 400 nm. Yet, the band gap of Al0.2Ga0.8N is estimated at an energy of 3.89 eV that corresponds to a wavelength of 319 nm [32]. Therefore, the broadening of the PL spectrum is attributed to the QD sizes and/or Al compositions fluctuations [24]. Regarding the presence of multi-peaks, it is mainly due to the Fabry–Perot effect resulting from the high refractive index contrasts in the heterostructures. Regarding the emission in the visible (blue–green) range, it is attributed to defects/impurities below the Al0.7Ga0.3N cladding layer band gap, p- and n-type, as commonly observed in AlxGa1−xN materials [36] and corroborated by the EL measurements for which no emission is observed in this wavelength range due to the electrical injection of carriers in the QD active layers only (not shown).

3.2.2. Electrical Properties

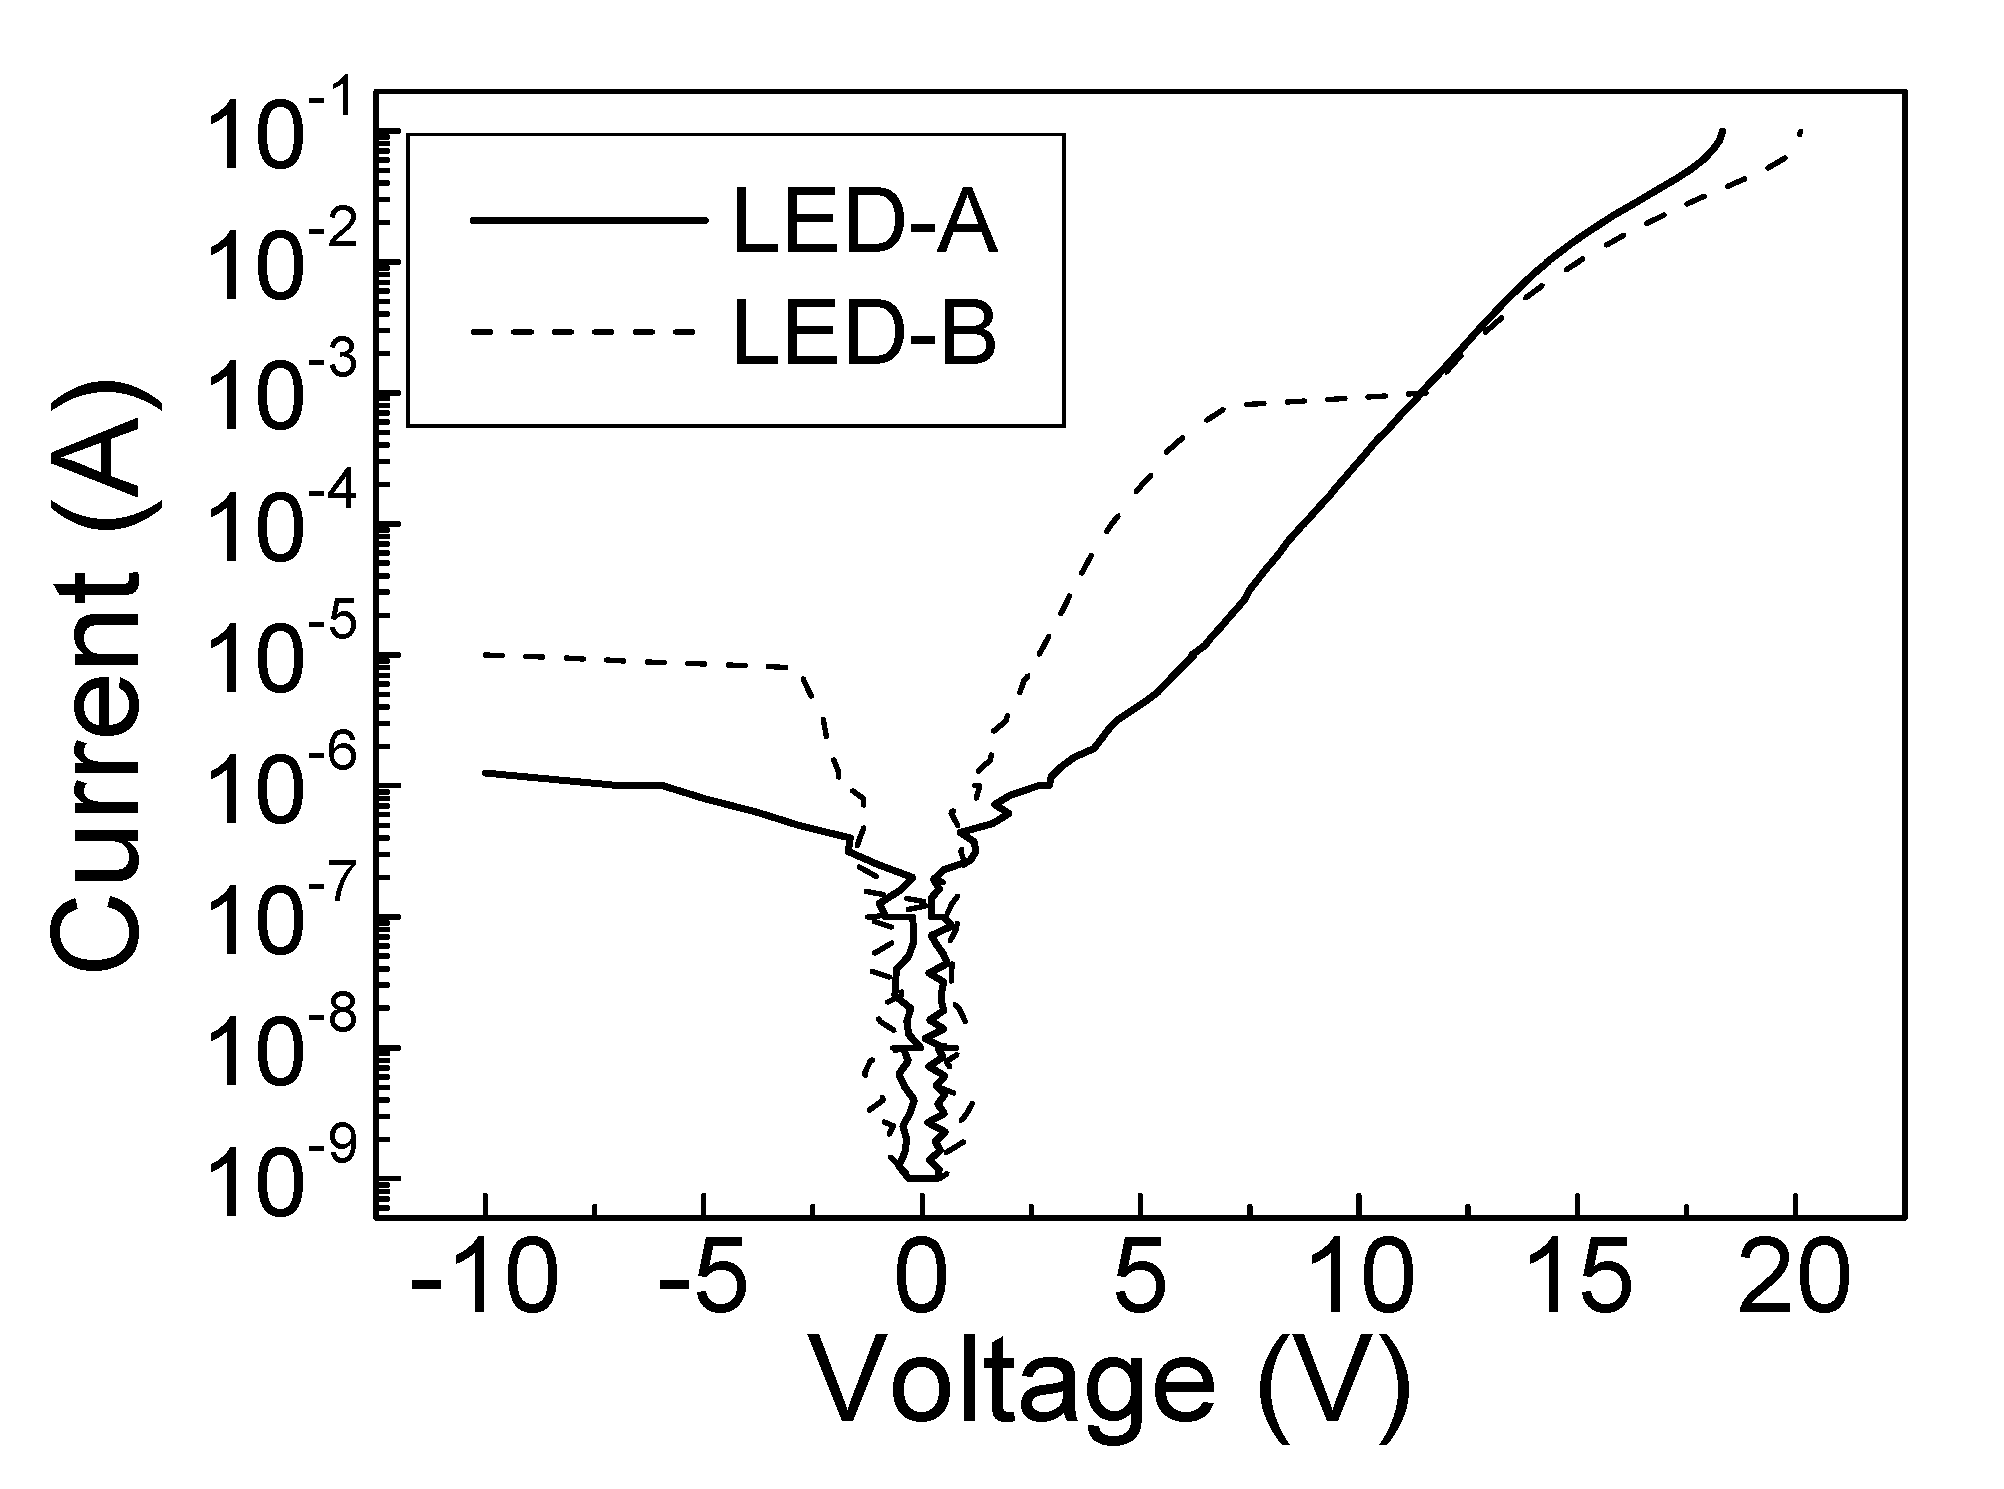
The I–V curves of both devices are presented and superimposed on a semi-log plot in Figure 4. Starting from the characteristics under forward bias conditions, similar turn-on voltages are found around 12 ± 1 V and voltage values of around 15 ± 1 V are measured at 20 mA (i.e., at a current density (J) of 20.8 A/cm2). The high operating voltages are attributed to low conductivities in the doped Al0.7Ga0.3N and Al0.8Ga0.2N layers, in particular the p-type ones characterized by very high activation energies (≥400 meV) of the Mg dopants [37]. Parasitic resistances have also been extracted and series resistance (Rs) values at around 60 Ω have been determined for both LEDs with a slightly higher one in the case of LED-B. They are the result of excessive contact resistances. Under reverse bias conditions, a leakage current of 1 µA (1 mA/cm2) is found at –6.5 V for LED-A and at –3.3 V for LED-B. The significant reverse saturation current are due to leakage paths in the devices which could be related to the high dislocation densities in our devices (>1010 cm−2). An unusual behavior of the I–V characteristics at low voltages (between ± 1 V) is observed with important variations of voltage values at low currents (<1 µA) attributed to unwanted transport mechanisms caused by structural defects. In addition, sub-threshold turn-on can be seen, in particular in the case of LED-B, which is caused by carrier transport (leakage) caused by surface states or deep levels and resulting in a shunt effect.

3.2.3. Electroluminescence

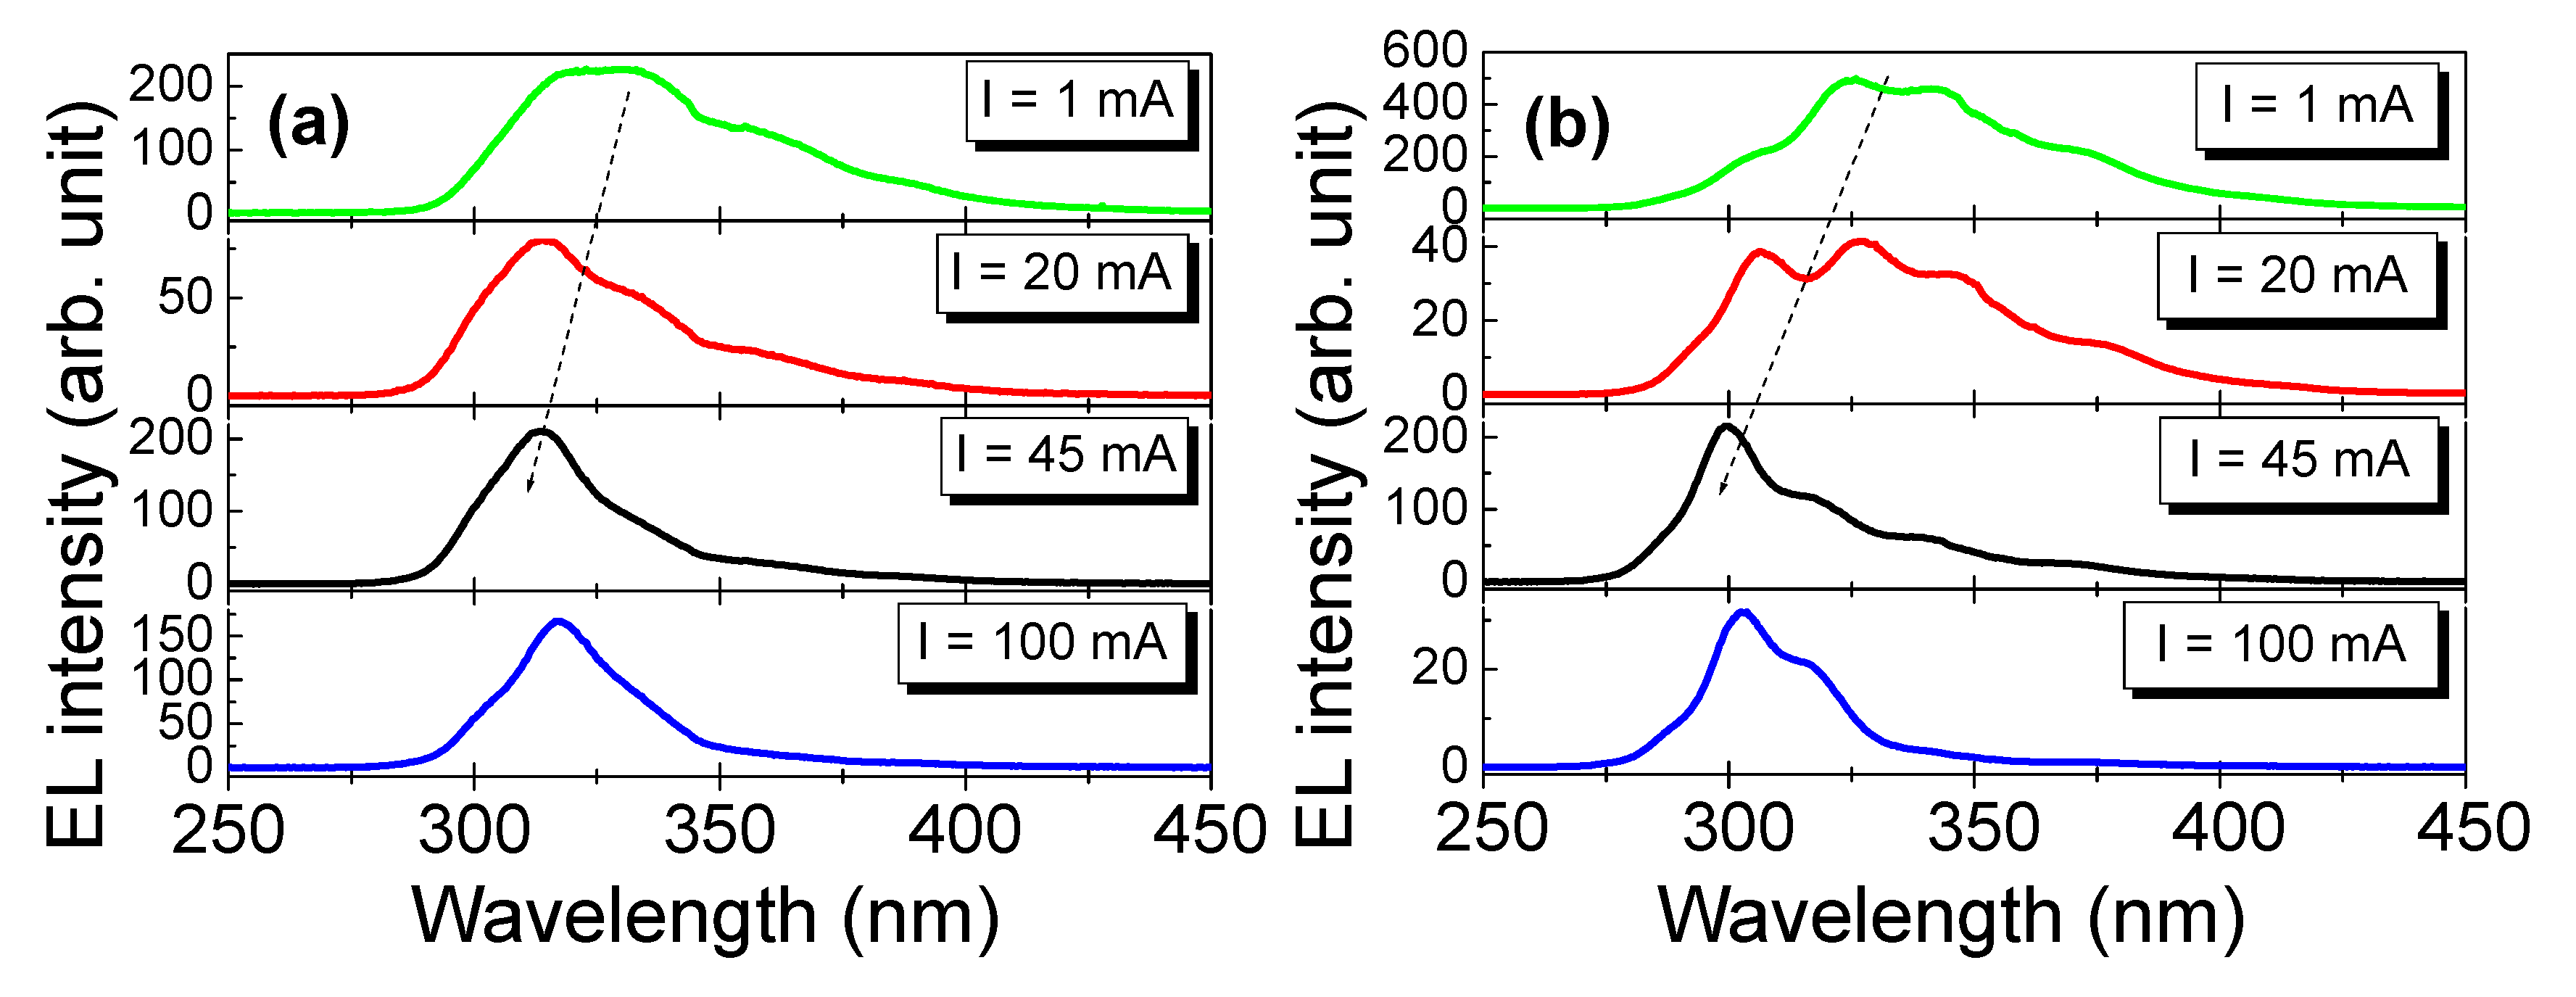
Electroluminescence (EL) measurements of the two types of LEDs as a function of the input current have been performed and a comparison of the results at four different current values is presented in Figure 5. As observed by PL (Figure 3), a multi-peak emission in the UV spectral range is found, in particular at lower current values for which a wavelength spectral range from nearly 280 nm to 400 nm is covered. In addition, a shift towards shorter wavelengths of the maximum intensity EL peak is occurring when the input current increases.
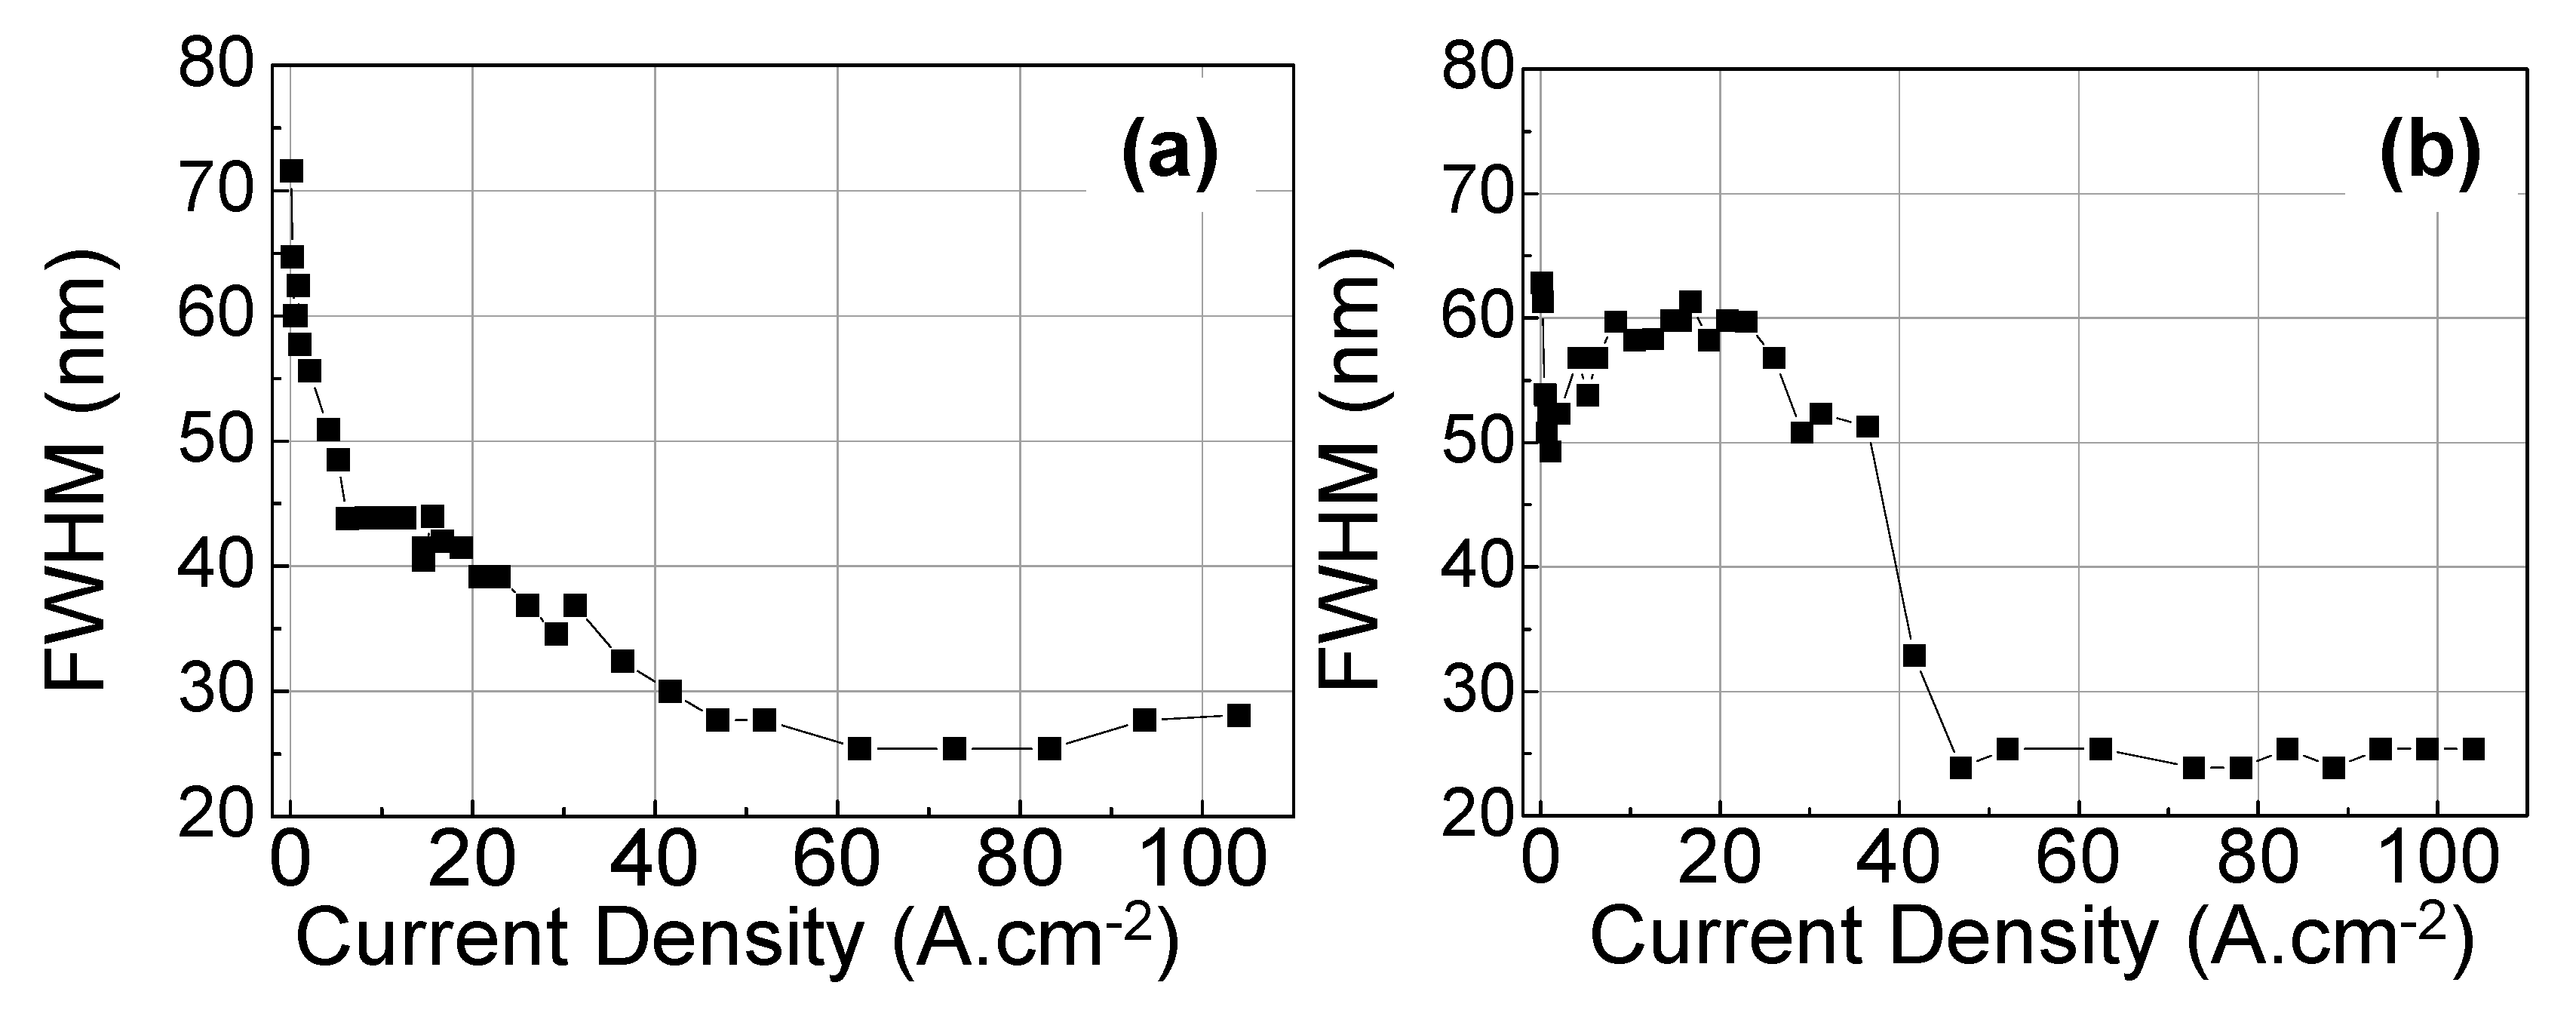
In order to have more insight into the dependence of the EL emission as a function of the input current density, the variation of the average EL wavelength is reported in Figure 6 and the variation of the full width at half maximum (FWHM) in Figure 7. In fact, since the EL spectra are broad and made of several peaks, the emitted wavelength has been arbitrarily defined as the arithmetic mean between the two wavelength values measured at full width at half maximum of each EL spectrum. For both LEDs, a similar behavior of the wavelength dependence is observed, which involves three distinct regimes (labelled with numbers from 1 to 3 in Figure 6): (1) A fast reduction of the wavelength at lower J (i.e., from 0.1 A/cm2 to 40 A/cm2); (2) a saturation of the wavelength at a minimum value (λmin) for J between 40 A/cm2 and 70A/cm2; and (3) an increase of the wavelength at higher J (above 70 A/cm2). Actually, the abrupt wavelength jump at 40 A/cm2 in the case of LED B is mainly attributed to a change of Fabry–Perot mode (see Figure 5b).
Regarding the FWHM, two regimes can be distinguished between lower and higher J. At low J (<40 A·cm−2), a difference is observed between the two types of LEDs since the FWHM strongly decreases with J for LED-A by 40 nm (from 70 nm to 30 nm), whereas it remains very high (around 50–60 nm) and fairly current independent in the case of LED-B. Actually, below 40 A/cm2, the EL spectra of LED B is mainly structured by two Fabry Perrot modes, and only one at higher current which leads to the strong difference in the spectra FWHM. At high J (>40 A·cm−2), identical behaviors are found for both LEDs characterized by an almost independence of the FWHM with J and a stabilization at a minimum value around 25 ± 3 nm. This characteristic implies a severe reduction (drop) of the FWHM for LED-B from 51 nm to 24 nm for a variation range of J from 37 to 47 A·cm−2. In addition, this FWHM narrowing corresponds to an important UV shift of the EL emission from 322 nm to 304 nm (corresponding to the minimum wavelength λmin). This shift is enhanced by the structuration of the spectra by interferences.

3.2.4. Optical Power and External Quantum Efficiency

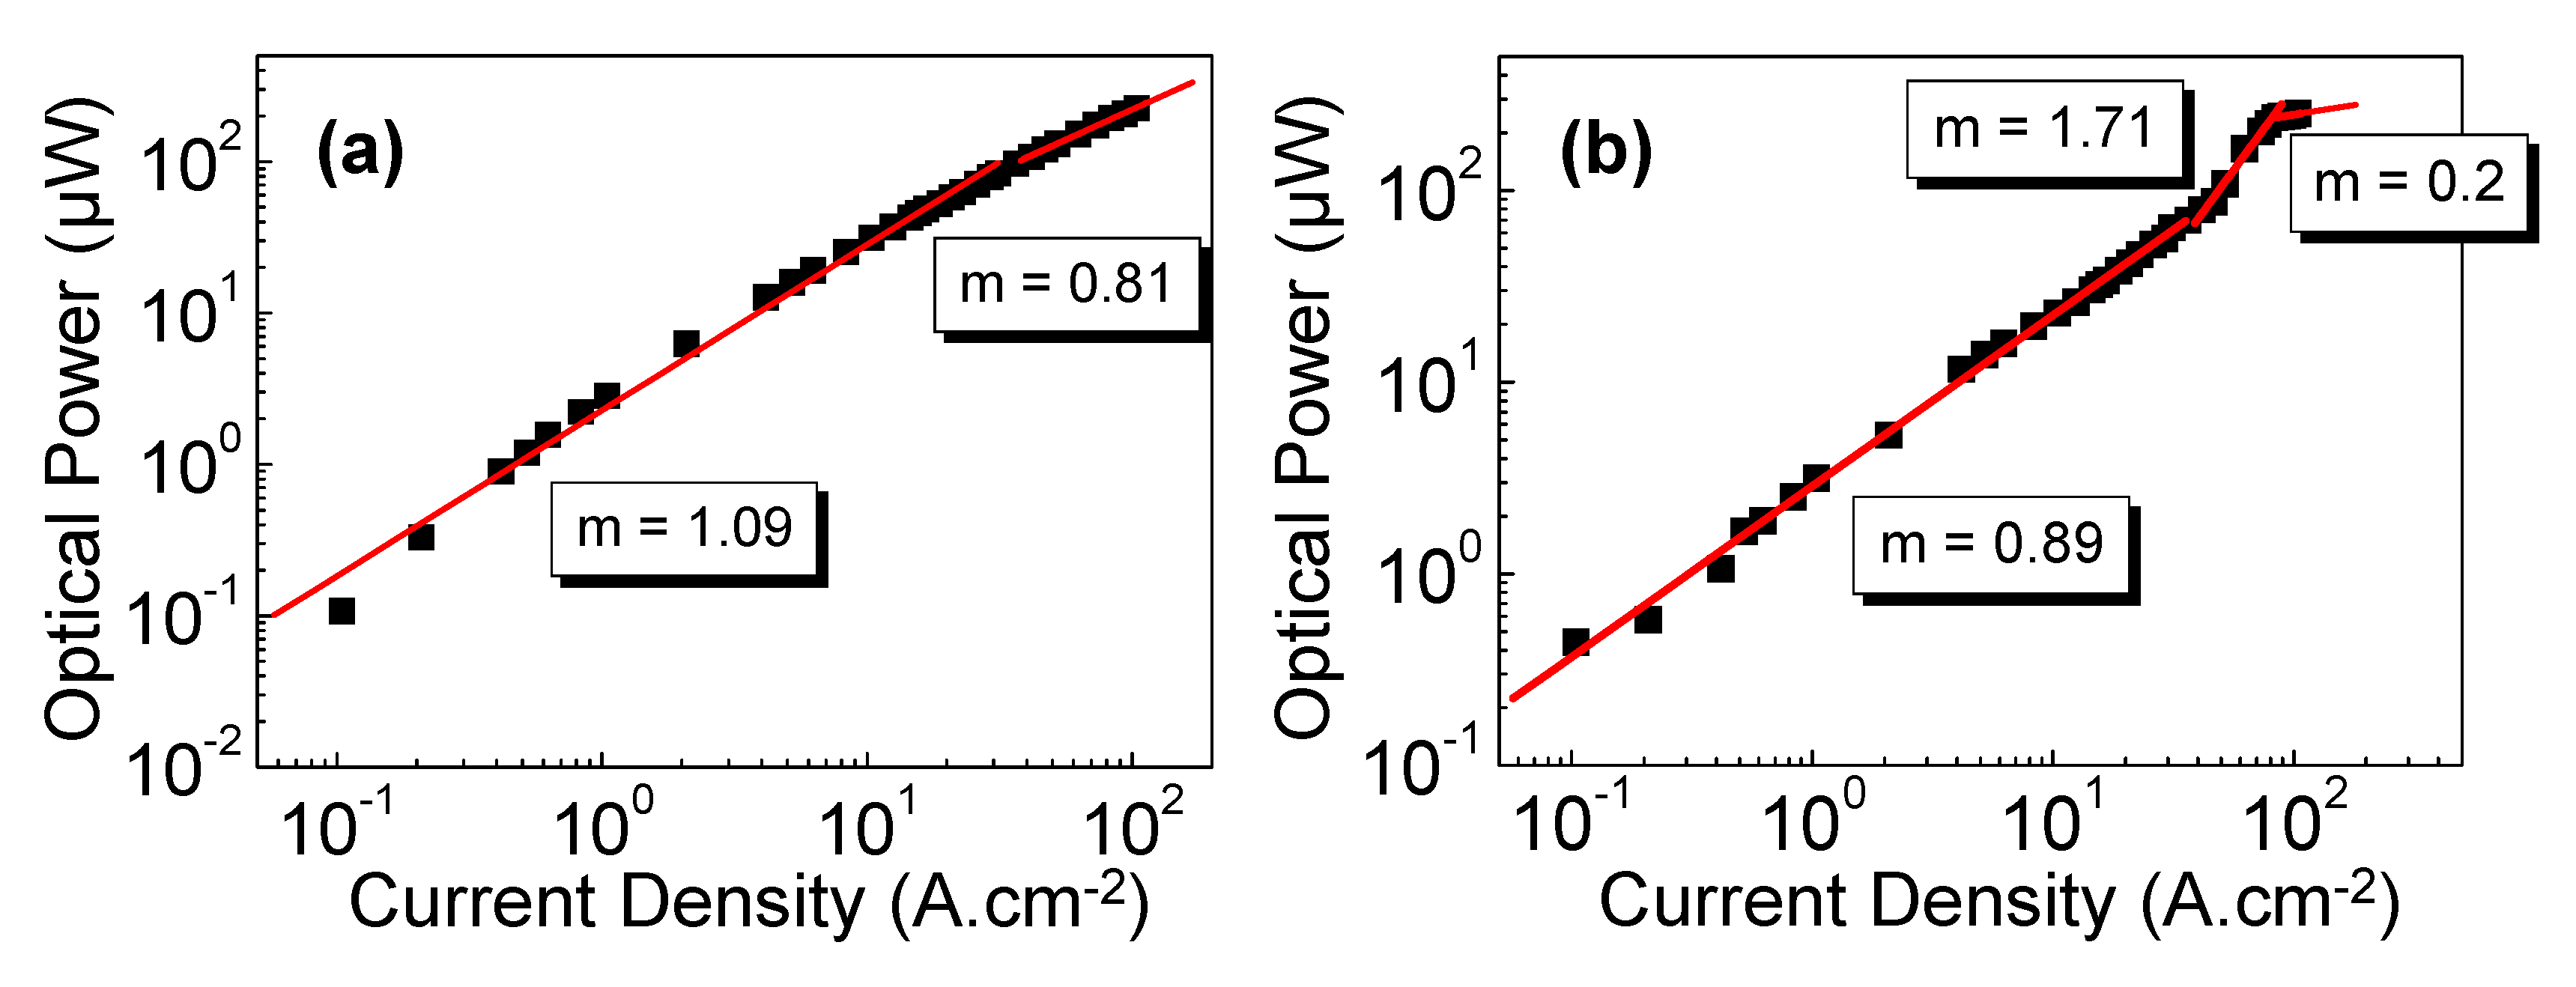
The performances of the LEDs as a function of J have been further investigated by analyzing the light power–current density (L–J) characteristics of LED-A and LED-B. The measurements are presented in Figure 8. For both LED, Popt is in the µW range for current densities of 2 A·cm−2 or below, around 100 µW in the 40–50 A·cm−2 range and reaches 230–250 µW at 100 A·cm−2. However, this increase is not constant as a function of J. Actually, Popt varies as a function of J at a constant power m, i.e., it is proportional to Jm, and the value of m depends on the current density range. At lower J, below 40–50 A/cm2, a linear variation of Popt is found (m = 1), whereas at higher J an under linear variation (m < 1) is observed. In the case of LED-A, a value of 0.8 is determined for J above 50 A·cm−2. In the case of LED-B, a much smaller value of 0.2 is found for J above 80 A·cm−2. However, the behavior is more complex for this device, since between 50 and 80 A·cm−2, a super linear dependence (m > 1) of Popt is observed with a value of 1.56, corresponding to an increase of the emitted power from 100 µW to 230 µW.
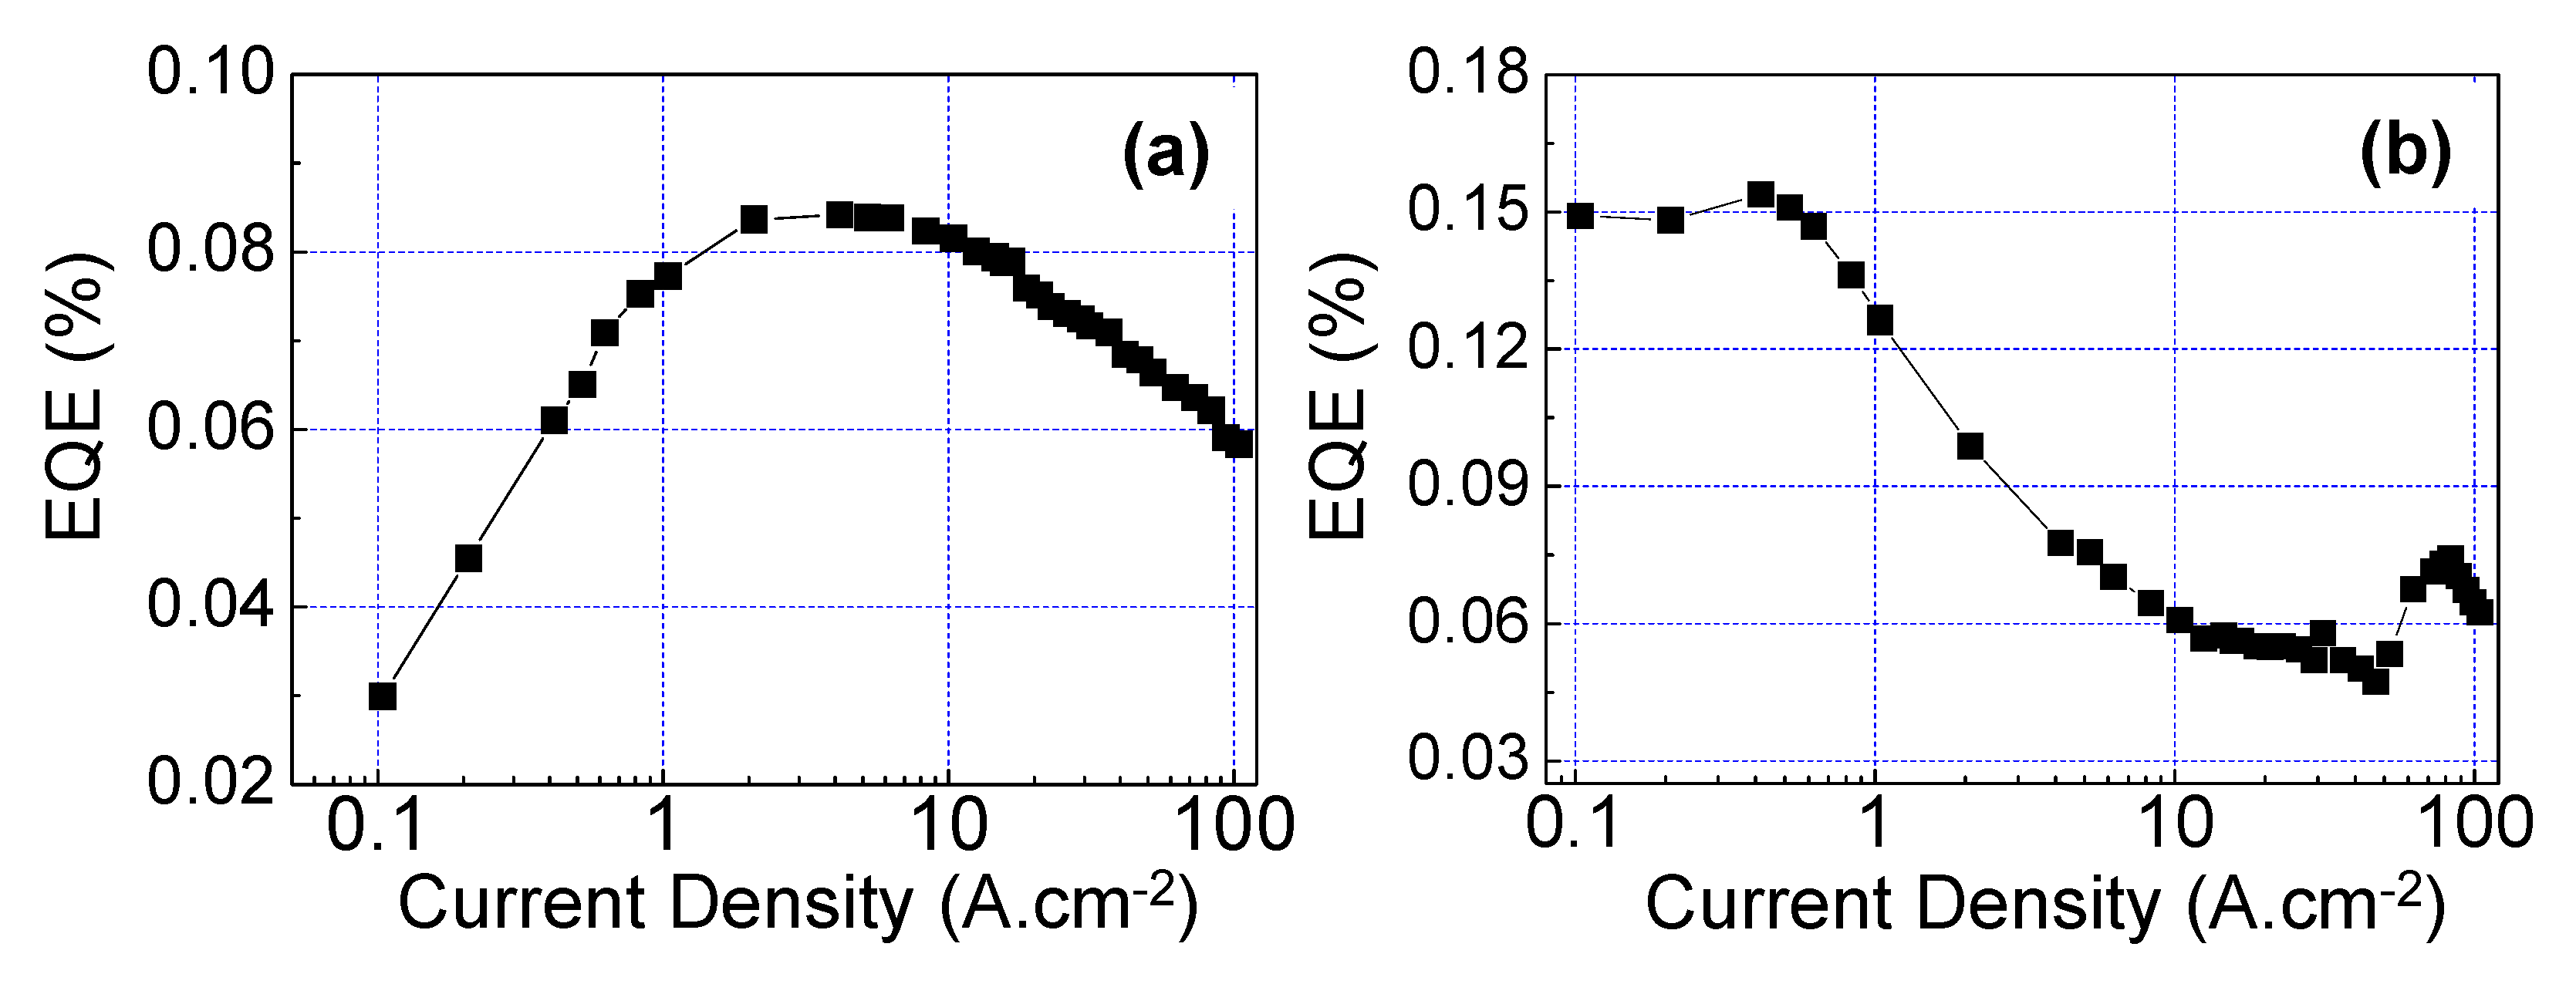
In Figure 9, the EQE of both LEDs has been reported as a function of J, following the well-known equation:
E Q E =   P o p t e ( h c λ ) I  
with h the Planck constant, c the speed of light, λ the emitted wavelength, e the electron charge, and I the injected current.
As a general result, EQE values between 0.03% and 0.15% have been found with higher ones at lower J (below 4 A·cm−2). The decrease of EQE at high operating current density is commonly observed in LEDs and known as the “efficiency droop”, whose origin is mainly attributed to Auger recombination and to a lesser extend electron leakage contribution [38]. Differences are observed between both LED EQE characteristics, with higher EQEs found for LED-B at J below 4 A·cm−2 whereas LED-A shows higher ones for J between 4 A·cm−2 and 60 A·cm−2. For J above 60 A·cm−2, fairly similar values are obtained around 0.06–0.07%.

4. Discussion

From the LED characteristics presented above, several points deserve to be commented. At first, the PL emission coming from the QDs, which intensity is maximum in the UVB range at 314 nm and 320 nm for LED-A and LED-B, respectively, is covering a broad emission range from 280 nm up to 400 nm. This feature is in agreement with the EL spectra which show large FWHMs up to 60–70 nm at low J. It is the consequence of fluctuations in the QD active regions in terms of QD size (i.e., mainly the QD height since lateral confinement effects in AlyGa1−yN QDs are weak compared to those along the <0001> direction due to a height over diameter ratio of the order of 4 [28]) and Al composition including the intrinsic alloy inhomogeneous broadening as discussed in previous works [24,32]. Regarding the EL and the PL intensity modulation, it is influenced by a Fabry–Perot effect resulting from the high refractive index contrasts at the AlGaN/sapphire and the air/AlGaN interfaces.
It should be noted that the broad spectral range emission is also a direct consequence of the presence of an internal electric field (Fint) in the heterostructures. This field is originating from the interfacial polarization discontinuities, leading to the quantum confined Stark effect (QCSE) in AlyGa1−yN/AlxGa1−xN heterostructures. Indeed, the large values of Fint, that can reach several MV/cm in GaN-based QDs [26,39], have been shown to lead to an important red-shift of the QD emission, i.e., at much longer wavelengths than the QD material band gap energy and up to the visible spectral range [25]. However, as presented in Figure 6 and Figure 7, the QD emitted average wavelength as well as the emission range (FWHM) strongly depends on the injected carrier density at lower J (< 40 A·cm−2): A blueshift from 345 nm to 315 nm for LED-A and from 345 nm to 305 nm for LED-B is observed, together with a reduction of the FWHM from more than 60 nm down to 25 nm. In fact, for J typically above 30–40 A·cm−2, the LEDs emit, as expected, in the UVB range below 320 nm. This result means that under these conditions, carriers are injected in the main AlyGa1−yN QD population with y close to the n.c. of 0.2, since the band gap energy of Al0.2Ga0.8N corresponds to a wavelength of 319 nm. The QD emission below the band gap energy of Al0.2Ga0.8N is the consequence of the quantum confinement effect together with a minimized influence of Fint as the Al concentration of AlyGa1−yN QDs increases (due to the reduction of the piezoelectric polarization originating from the lattice-mismatch between AlyGa1−yN QDs and the Al0.7Ga0.3N cladding layer). Whereas, at lower J, carriers are preferentially injected in QDs with lower Al concentrations which represent deeper localization potentials, i.e., larger band offsets with the Al0.7Ga0.3N cladding layers. Differences in the LED characteristics between the two devices, that are attributed to the design of the active region made of 3 QD planes (LED-A) or 5 QD planes (LED-B), are observed at lower current densities (< 40 A·cm−2). In this regime, the wavelength and EL spectrum FWHM values are characterized by a strong dependence on J (which varies from 0.1 to 40 A·cm−2). For both LEDs, a progressive shift towards shorter wavelengths is observed, which is the consequence of: (i) The partial screening of Fint due to an increase of the electron and hole concentrations in the QDs [26,40], (ii) the progressive injection into higher Al concentration AlyGa1−yN QDs at larger J and (iii) a band-filling effect in the QDs [41,42,43]. The main difference between LED-A and LED-B is seen in the FWHM dependence of the EL spectra as a function of J: In the case of LED-A, a progressive reduction of the FWHM is observed (from 70 nm down to 30 nm) whereas for LED-B is remains large (between 50 and 60 nm) and fairly independent of J. This feature is attributed to a reduced value of the internal electric field in the active region of LED-B as a consequence of thinner barrier layers (5 nm) compared to LED-A (10 nm), limiting the influence of its partial screening when increasing carrier densities in the QDs with the use of larger J. Then, as J is increased above 40 A·cm−2 and the carriers are mainly injected in AlyGa1−yN QDs with y close to the n.c. of 0.2, a strong reduction of the FWHM down to around 25 nm is observed. It should be noted that the minimum FWHM value of 24 nm, compared to 25.5 nm (for similar J) in the case of LED-A, can also be seen as a consequence of a smaller value of Fint in the case of LED-B inducing a smaller inhomogeneous broadening of the QD EL emission [44].
Regarding the variation of the optical power as a function of the current density J, once again similarities and differences are observed between the two types of LEDs. Two or three different regimes are seen in Figure 8 from the variation of Popt as a function of J at a constant power m. This parameter m is related to the recombination mechanisms involved in LEDs [45]. At lower J, i.e., up to 40 A/cm2, a (quasi-)linear dependence (m = 1 ± 0.1) of Popt is observed for LED-A and LED-B. Such a variation indicates that the IQE of the LEDs is constant in this regime. At larger J, two different behaviors are obtained. A specific regime is seen in the case of LED-B with a super linear dependence (m > 1) of Popt between 40 and 80 A/cm2. It is attributed to an increase of the hole concentration in the active region due to a hole activation mechanism as the LED junction temperature increases with higher J. Above 80 A/cm2 for LED-B and 40 A/cm2 for LED-A, m is found below 1, i.e., the LED output power increases sub-linearly as a function of J. While in the case of LED-A, the saturation of Popt is rather limited with a value of 0.8, it is much stronger in the case of LED-B with a value of 0.2. Since this characteristic coincides with the redshift variation of the EL peak as a function of the injection current (Figure 6), it is related to important thermal effects caused by low injection efficiencies and poor current spreading [32]. More insight in the LED performances can be obtained by considering the EQE of the LEDs presented in Figure 9. This value is the product of the IQE, the IE, and the EE, and since the EE is constant and independent of J, the variation of the EQE gives additional information on the current density dependence of the IQE and IE. Therefore, at lower J when the IQE has been found to be constant, the EQE increase in the case of LED-A is related to an increase of the IE whereas in the case of LED-B its decrease involves on the opposite a decrease of the IE which is maximum at the minimum J value of 0.1 A/cm2. The EQE of LED-A then reaches a plateau above 0.08% between 1 and 10 A/cm2 and starts decreasing for higher J as a consequence of the presence of non-radiative mechanisms attributed to defect states localized in the cladding layers or band gap states in the QD active layers leading to a reduction of the IQE, and thermal effects at larger J leading to a decrease of the IE. For LED-B, an unconventional behavior is observed since after a first decrease of the EQE until 40 A/cm2, a sudden increase is observed between 40 and 80 A/cm2, which is the consequence of a higher IE as discussed above. Then, a strong reduction is found at larger J which is caused by a drop in the IE. Finally, a similar EQE value of 0.06 % at 100 A/cm2 is measured for both devices giving a maximum optical power of 225–250 µW.
The sublinear dependency of the light output at higher current densities indicates the presence of non-radiative mechanisms which are directly related to the high TDDs in the heterostructures and reduce the IQE. In fact, considering the high operating voltages of the LEDs (i.e., in the 10–20V range) heat is certainly the main reason for the EQE decrease observed at 2–3 A/cm2, whereas the high TDD is the main origin of the overall low IQE. Therefore, using AlGaN/AlN heterostructures with lower TDDs should enable to further improve the IQE of QD-based LEDs. Concerning the active region design, the insertion of 5 QD planes together with a reduction of the capping layer thickness seem to be an interesting approach to favor carrier injection in the QDs as well as to increase the light output, as observed for LED-B (in the intermediate J regime between 40 and 80 A/cm2). Finally, improvements are required for thermal management, in particular at larger J since a severe drop of the IE has been observed above 80 A/cm2. Indeed, considering average values for the different efficiencies in our devices, i.e., with an IQE of 20%, an EE of 8% (estimated from the extraction cone at the sapphire/air interface) and an EQE of 0.05–0.1%, it is then possible to estimate the IE which is in the range of 3 to 6% only. Inefficient hole injection due to low hole concentration and mobility in high Al concentration AlxGa1−xN layers leads to electron leakage and overflow out of the active region and will require different layer designs such as tunnel junctions which have been shown as an attractive solution to improve the IE and avoid the use of an absorbing p-type GaN contact [46,47].

5. Conclusions

Al0.2Ga0.8N QD-based LEDs emitting in the UVB range have been fabricated by MBE using two different designs for the active region: 3 QD planes separated by 10-nm thick barrier layers (LED-A) and 5 QD planes separated by 5-nm thick barrier layers (LED-B). Despite TDDs above 10−10 cm−2, IQE values around 5–10% have been estimated on reference samples as a consequence of the 3D carrier confinement in the QDs. Electro-optical characterizations have pointed out at some differences in the LED performances: (1) Higher EQE below 1A/cm2 and above 40 A/cm2, an emission at shorter wavelengths and an increase in the carrier injection efficiency in the QDs as well as in the optical power (between 40 and 80 A/cm2) were observed for LED-B compared to LED-A; (2) higher EQE between 5 and 40 A/cm2 and a reduction of the EL FWHM between 0.1 and 40 A/cm2 were found for LED-A. At current densities above 80 A/cm2, similar characteristics were found with EQE around 0.06% and optical power in the 0.2–0.25 mW range. Further improvements in the IE together with a reduction of the TDDs are suggested for future research directions to reach higher performances.

Author Contributions

LED design was done by M.A.K and J.B.; QD and LED fabrication process was done by S.M. and J.B.; M.L. and S.M. carried out PL experiments and T.H.N. and P.V. performed TRPL measurements; T.H.N., B.G., and M.L. analyzed and interpreted the optical data; S.C. optimized and realized the LED fabrication processes; LED measurements and analysis were done by M.A.K and J.B.; J.B. and B.G. conceived this project and obtained the funding; J.B. supervised this project; J.B., M.A.K., and B.G. wrote the manuscript with contributions from all co-authors. All authors have read and agreed to the published version of the manuscript.

Funding

This research was funded by ANR Project (ANR-14-CE26-0025) “NANOGANUV” and the support from GANEX (ANR-11-LABX-0014) is also acknowledged. GANEX belongs to the publicly funded “Investissements d’Avenir” program managed by the French ANR agency.

Acknowledgments

The authors would like to thank D. Lefebvre, S. Vézian, A. Courville and B. Poulet for their precious and decisive technical and scientific assistance. B. Damilano, J. -Y. Duboz and J. Massies are greatly acknowledged for fruitful discussions throughout the project.

Conflicts of Interest

The authors declare no conflict of interest. The funders had no role in the design of the study; in the collection, analyses, or interpretation of data; in the writing of the manuscript, or in the decision to publish the results.

References

  1. Mukai, T.; Morita, D.; Nakamura, S. High-power UV InGaN/AlGaN double-heterostructure LEDs. J. Cryst. Growth 1998, 189/190, 778–781. [Google Scholar] [CrossRef]
  2. Taniyasu, Y.; Kasu, M.; Makimoto, T. An aluminium nitride light-emitting diode with a wavelength of 210 nanometres. Nature 2006, 441, 325–328. [Google Scholar] [CrossRef] [PubMed]
  3. Minamata Convention on Mercury. Available online: http://www.mercuryconvention.org/ (accessed on 30 August 2019).
  4. Kneissl, M. A Brief Review of III-Nitride UV Emitter Technologies and Their Applications. In III-Nitride Ultraviolet Emitters; Kneissl, M., Rass, J., Eds.; Series in Materials Science; Springer International Publishing: Cham, Switzerland, 2016; Volume 227, pp. 1–25. [Google Scholar]
  5. Santos, A.L.; Oliveira, V.; Baptista, I.; Henriques, I.; Gomes, N.C.M.; Almeida, A.; Correia, A.; Cunha, A. Wavelength dependence of biological damage induced by UV radiation on bacteria. Arch. Microbiol. 2013, 195, 63–74. [Google Scholar] [CrossRef] [PubMed]
  6. Ajmal Khan, M.; Maeda, N.; Jo, M.; Akamatsu, Y.; Tanabe, R.; Yamada, Y.; Hirayama, H. 13 mW operation of a 295–310 nm AlGaN UV-B LED with a p-AlGaN transparent contact layer for real world applications. J. Mater. Chem. C 2019, 7, 143–152. [Google Scholar] [CrossRef] [Green Version]
  7. Ajmal Khan, M.; Matsuura, E.; Kashima, Y.; Hirayama, H. Overcoming the current injection issue in the 310 nm band AlGaN UVB light-emitting diode. Jpn. J. Appl. Phys. 2020, 59, SAAD01. [Google Scholar] [CrossRef] [Green Version]
  8. Ding, K.; Avrutin, V.; Özgür, Ü.; Morkoç, H. Status of Growth of Group III-Nitride Heterostructures for Deep Ultraviolet Light-Emitting Diodes. Crystals 2017, 7, 300. [Google Scholar] [CrossRef] [Green Version]
  9. Nitta, S.; Yukawa, Y.; Watanabe, Y.; Kamiyama, S.; Amano, H.; Akasaki, I. Mass Transport of AlxGa1—xN. Phys. Status Solidi (a) 2002, 194, 485–488. [Google Scholar] [CrossRef]
  10. Kneissl, M.; Seong, T.-Y.; Han, J.; Amano, H. The emergence and prospects of deep-ultraviolet light-emitting diode technologies. Nat. Photonics 2019, 13, 233–244. [Google Scholar] [CrossRef]
  11. Kohno, T.; Sudo, Y.; Yamauchi, M.; Mitsui, K.; Kudo, H.; Okagawa, H.; Yamada, Y. Internal Quantum Efficiency and Nonradiative Recombination Rate in InGaN-Based Near-Ultraviolet Light-Emitting Diodes. Jpn. J. Appl. Phys. 2012, 51, 072102. [Google Scholar] [CrossRef]
  12. Imura, M.; Nakano, K.; Fujimoto, N.; Okada, N.; Balakrishnan, K.; Iwaya, M.; Kamiyama, S.; Amano, H.; Akasaki, I.; Noro, T.; et al. High-Temperature Metal-Organic Vapor Phase Epitaxial Growth of AlN on Sapphire by Multi Transition Growth Mode Method Varying V/III Ratio. Jpn. J. Appl. Phys. 2006, 45, 8639–8643. [Google Scholar] [CrossRef]
  13. Miyake, H.; Lin, C.H.; Tokoro, K.; Hiramatsu, K. Preparation of high-quality AlN on sapphire by high-temperature face-to-face annealing. J. Cryst. Growth 2016, 456, 155–159. [Google Scholar] [CrossRef] [Green Version]
  14. Hirayama, H. 231–261 nm AlGaN deep-ultraviolet light-emitting diodes fabricated on AlN multilayer buffers grown by ammonia pulse-flow method on sapphire. Appl. Phys. Lett. 2007, 91, 071901. [Google Scholar] [CrossRef]
  15. Kneissl, M.; Kolbe, T.; Chua, C.; Kueller, V.; Lobo, N.; Stellmach, J.; Knauer, A.; Rodriguez, H.; Einfeldt, S.; Yang, Z.; et al. Advances in group III-nitride-based deep UV light-emitting diode technology. Semicond. Sci. Technol. 2011, 26, 014036. [Google Scholar] [CrossRef]
  16. Liao, Y.; Thomidis, C.; Kao, C.-k.; Moustakas, T.D. AlGaN based deep ultraviolet light emitting diodes with high internal quantum efficiency grown by molecular beam epitaxy. Appl. Phys. Lett. 2011, 98, 081110. [Google Scholar] [CrossRef] [Green Version]
  17. Tanaka, S.; Lee, J.-S.; Ramvall, P.; Okagawa, H. A UV Light-Emitting Diode Incorporating GaN Quantum Dots. Jpn. J. Appl. Phys. 2003, 42, L885. [Google Scholar] [CrossRef]
  18. Hirayama, H.; Fujikawa, S. Quaternary InAlGaN quantum-dot ultraviolet light-emitting diode emitting at 335 nm fabricated by anti-surfactant method. Phys. Status Solidi (C) 2008, 5, 2312–2315. [Google Scholar] [CrossRef]
  19. Brault, J.; Damilano, B.; Kahouli, A.; Chenot, S.; Leroux, M.; Vinter, B.; Massies, J. Ultra-violet GaN/Al0.5Ga0.5N quantum dot based light emitting diodes. J. Cryst. Growth 2013, 363, 282–286. [Google Scholar] [CrossRef]
  20. Verma, J.; Kandaswamy, P.K.; Protasenko, V.; Verma, A.; Grace, X.H.; Jena, D. Tunnel-injection GaN quantum dot ultraviolet light-emitting diodes. Appl. Phys. Lett. 2013, 102, 041103. [Google Scholar] [CrossRef] [Green Version]
  21. Huault, T.; Brault, J.; Natali, F.; Damilano, B.; Lefebvre, D.; Nguyen, L.; Leroux, M.; Massies, J. Blue-light emission from GaN/Al0.5Ga0.5N quantum dots. Appl. Phys. Lett. 2008, 92, 051911. [Google Scholar] [CrossRef]
  22. Brault, J.; Rosales, D.; Damilano, B.; Leroux, M.; Courville, A.; Korytov, M.; Chenot, S.; Vennéguès, P.; Vinter, B.; DeMierry, P.; et al. Polar and semipolar GaN/Al0.5Ga0.5Nnanostructures for UV light emitters. Semicond. Sci. Technol. 2014, 29, 084001. [Google Scholar] [CrossRef]
  23. Himwas, C.; den Hertog, M.; Bellet-Amalric, E.; Songmuang, R.; Donatini, F.; Dang, L.S.; Monroy, E. Enhanced room-temperature mid-ultraviolet emission from AlGaN/AlN Stranski-Krastanov quantum dots. J. Appl. Phys. 2014, 116, 023502. [Google Scholar] [CrossRef]
  24. Matta, S.; Brault, J.; Ngo, T.-H.; Damilano, B.; Leroux, M.; Massies, J.; Gil, B. Photoluminescence properties of (Al,Ga)N nanostructures grown on Al0.5Ga0.5N (0001). Superlattices Microstruct. 2018, 114, 161–168. [Google Scholar] [CrossRef]
  25. Brault, J.; Huault, T.; Natali, F.; Damilano, B.; Lefebvre, D.; Leroux, M.; Korytov, M.; Massies, J. Tailoring the shape of GaN/AlxGa1−xN nanostructures to extend their luminescence in the visible range. J. Appl. Phys. 2009, 105, 033519. [Google Scholar] [CrossRef]
  26. Matta, S.; Brault, J.; Ngo, T.H.; Damilano, B.; Korytov, M.; Vennéguès, P.; Nemoz, M.; Massies, J.; Leroux, M.; Gil, B. Influence of the heterostructure design on the optical properties of GaN and Al0.1Ga0.9N quantum dots for ultraviolet emission. J. Appl. Phys. 2017, 122, 085706. [Google Scholar] [CrossRef]
  27. Himwas, C.; Songmuang, R.; Dang, L.S.; Bleuse, J.; Rapenne, L.; Sarigiannidou, E.; Monroy, E. Thermal stability of the deep ultraviolet emission from AlGaN/AlN Stranski-Krastanov quantum dots. Appl. Phys. Lett. 2012, 101, 241914. [Google Scholar] [CrossRef]
  28. Brault, J.; Matta, S.; Ngo, T.-H.; Al Khalfioui, M.; Valvin, P.; Leroux, M.; Damilano, B.; Korytov, M.; Brändli, V.; Vennéguès, P.; et al. Internal quantum efficiencies of AlGaN quantum dots grown by molecular beam epitaxy and emitting in the UVA to UVC ranges. J. Appl. Phys. 2019, 126, 205701. [Google Scholar] [CrossRef]
  29. Damilano, B.; Brault, J.; Massies, J. Formation of GaN quantum dots by molecular beam epitaxy using NH3 as nitrogen source. J. Appl. Phys. 2015, 118, 024304. [Google Scholar] [CrossRef]
  30. Daudin, B.; Widmann, F.; Feuillet, G.; Samson, Y.; Arlery, M.; Rouvière, J.L. Stranski-Krastanov growth mode during the molecular beam epitaxy of highly strained GaN. Phys. Rev. B 1997, 56, R7069–R7072. [Google Scholar] [CrossRef]
  31. Matta, S.; Brault, J.; Korytov, M.; Phuong Vuong, T.Q.; Chaix, C.; Al Khalfioui, M.; Vennéguès, P.; Massies, J.; Gil, B. Properties of AlN layers grown on c-sapphire substrate using ammonia assisted MBE. J. Cryst. Growth 2018, 499, 40–46. [Google Scholar] [CrossRef]
  32. Nemoz, M.; Dagher, R.; Matta, S.; Michon, A.; Vennéguès, P.; Brault, J. Dislocation densities reduction in MBE-grown AlN thin films by high temperature annealing. J. Cryst. Growth 2017, 461, 10–15. [Google Scholar] [CrossRef]
  33. Brault, J.; Al Khalfioui, M.; Matta, S.; Damilano, B.; Leroux, M.; Chenot, S.; Korytov, M.; Nkeck, J.E.; Vennéguès, P.; Duboz, J.Y.; et al. UVA and UVB light emitting diodes with AlyGa1-yN quantum dot active regions covering the 305 nm–335 nm range. Semicond. Sci. Technol. 2018, 33, 075007. [Google Scholar]
  34. Brault, J.; Matta, S.; Ngo, T.H.; Korytov, M.; Rosales, D.; Damilano, B.; Leroux, M.; Vennéguès, P.; Al Khalfioui, M.; Courville, A.; et al. Investigation of AlyGa1-yN/Al0.5Ga0.5N Quantum Dot Properties for the Design of Ultraviolet Emitters. Jpn. J. Appl. Phys. 2016, 55, 05FG06. [Google Scholar] [CrossRef]
  35. Iwata, Y.; Banal, R.G.; Ichikawa, S.; Funato, M.; Kawakami, Y. Emission mechanisms in Al-rich AlGaN/AlN quantum wells assessed by excitation power dependent photoluminescence spectroscopy. J. Appl. Phys. 2015, 117, 075701. [Google Scholar] [CrossRef]
  36. Nepal, N.; Nakarmi, M.L.; Lin, J.Y.; Jiang, H.X. Photoluminescence studies of impurity transitions in AlGaN alloys. Appl. Phys. Lett. 2006, 89, 092107. [Google Scholar] [CrossRef] [Green Version]
  37. Liang, Y.-H.; Towe, E. Progress in efficient doping of high aluminum-containing group III-nitrides. Appl. Phys. Rev. 2018, 5, 011107. [Google Scholar] [CrossRef]
  38. Piprek, J. How to decide between competing efficiency droop models for GaN-based light-emitting diodes. Appl. Phys. Lett. 2015, 107, 031101. [Google Scholar] [CrossRef]
  39. Leroux, M.; Brault, J.; Kahouli, A.; Elmaghraoui, D.; Damilano, B.; de Mierry, P.; Korytov, M.; Kim, J.-H.; Cho, Y.-H. Stark effect in ensembles of polar (0001) Al0.5Ga0.5N/GaN quantum dots and comparison with semipolar (11-22) ones. J. Appl. Phys. 2014, 116, 034308. [Google Scholar] [CrossRef]
  40. Bretagnon, T.; Kalliakos, S.; Lefebvre, P.; Valvin, P.; Gil, B.; Grandjean, N.; Dussaigne, A.; Damilano, B.; Massies, J. Time dependence of the photoluminescence of GaN/AlN quantum dots under high photoexcitation. Phys. Rev. B 2003, 68, 205301. [Google Scholar] [CrossRef]
  41. Ji, L.-W.; Su, Y.K.; Chang, S.J.; Chang, C.S.; Wu, L.W.; Lai, W.C.; Du, X.L.; Chen, H. InGaN/GaN multi-quantum dot light-emitting diodes. J. Cryst. Growth 2004, 263, 114–118. [Google Scholar] [CrossRef]
  42. Brault, J.; Damilano, B.; Vinter, B.; Vennéguès, P.; Leroux, M.; Kahouli, A.; Massies, J. AlGaN-Based Light Emitting Diodes Using Self-Assembled GaN Quantum Dots for Ultraviolet Emission. Jpn. J. Appl. Phys. 2013, 52, 08JG01. [Google Scholar] [CrossRef]
  43. Park, I.-K.; Kwon, M.-K.; Seo, S.-B.; Kim, J.-Y.; Lim, J.-H.; Park, S.-J. Ultraviolet light-emitting diodes with self-assembled InGaN quantum dots. Appl. Phys. Lett. 2007, 90, 111116. [Google Scholar] [CrossRef] [Green Version]
  44. Kahouli, A.; Kriouche, N.; Brault, J.; Damilano, B.; Vennéguès, P.; de Mierry, P.; Leroux, M.; Courville, A.; Tottereau, O.; Massies, J. GaN/Al0.5Ga0.5N (11-22) semipolar nanostructures: A way to get high luminescence efficiency in the near ultraviolet range. J. Appl. Phys. 2011, 110, 084318. [Google Scholar] [CrossRef]
  45. Cao, X.A.; Topol, K.; Shahedipour-Sandvik, F.; Teetsov, J.; Sandvik, P.M.; LeBoeuf, S.F.; Ebong, A.; Kretchmer, J.; Stokes, E.B.; Arthur, S.; et al. Influence of defects on electrical and optical characteristics of GaN/InGaN-based light-emitting diodes. Proc. SPIE 2002, 4776, 105–113. [Google Scholar]
  46. Zhang, Y.; Krishnamoorthy, S.; Akyol, F.; Bajaj, S.; Allerman, A.A.; Moseley, M.W.; Armstrong, A.M.; Rajan, S. Tunnel-injected sub-260 nm ultraviolet light emitting diodes. Appl. Phys. Lett. 2017, 110, 201102. [Google Scholar] [CrossRef] [Green Version]
  47. Fan Arcara, V.; Damilano, B.; Feuillet, G.; Vézian, S.; Ayadi, K.; Chenot, S.; Duboz, J.-Y. Ge doped GaN and Al05Ga0.5N-based tunnel junctions on top of visible and UV light emitting diodes. J. Appl. Phys. 2019, 126, 224503. [Google Scholar] [CrossRef]
Figure 1. Schematics of the two (Al,Ga)N quantum dot (QD)-based light emitting diode (LED) structures grown on sapphire substrates. (a) LED-A made of three QD planes and (b) LED-B made of five QD planes.
Crystals 10 01097 g001
Figure 2. (a) 3D view of a topographic atomic force microscopy (AFM) image of a reference Al0.2Ga0.8N (n.c.) QD plane grown on Al0.7Ga0.3N (0001). (b) PL measurements at room temperature of Al0.2Ga0.8N (n.c.) QDs grown on Al0.7Ga0.3N (0001) for deposited amounts of Al0.2Ga0.8N (n.c.) varying from 8 to 12 MLs. (c) Time-resolved photoluminescence (PL) measurements (in semilog scale) at 8 K of Al0.2Ga0.8N (n.c.) QDs grown on Al0.7Ga0.3N (diamond symbols). Fast and slow decay time slopes are indicated by black segments and the fit of the PL intensity variation is represented by a dark grey line. The variation of the PL integrated intensity as a function of temperature is shown in inset by an Arrhenius plot.
Crystals 10 01097 g002
Figure 3. Photoluminescence spectra of the LED structures (LED-A and LED-B) at 300 K.
Crystals 10 01097 g003
Figure 4. Current-Voltage measurements of LED-A and LED-B.
Crystals 10 01097 g004
Figure 5. Evolution of the electroluminescence (EL) emission as a function of the input current (I), corresponding to injected current densities (J) of ~1, 21, 47, and 104 A·cm−2 for (a) LED-A and (b) LED-B. The dotted arrow in each figure is a guide for the eyes indicating the variation of the EL average peak wavelength with increasing J.
Crystals 10 01097 g005
Figure 6. Variation of the average EL peak wavelength value with increasing input current density J for (a) LED-A and (b) LED-B. The dashes lines are guides for the eyes, including an exponential fit of the wavelength variation at lower current densities (region 1).
Crystals 10 01097 g006
Figure 7. Variation of the F full width at half maximum (FWHM) of the EL peak with increasing input current density J for (a) LED-A and (b) LED-B.
Crystals 10 01097 g007
Figure 8. Variation of the optical power as a function of the current density J for (a) LED-A and (b) LED-B. The open circles are experimental measurements and the segments represent fits of the variation of Popt with Jm, where m is a power law coefficient.
Crystals 10 01097 g008
Figure 9. Variation of external quantum efficiency as a function of the current density J for (a) LED-A and (b) LED-B.
Crystals 10 01097 g009
Publisher’s Note: MDPI stays neutral with regard to jurisdictional claims in published maps and institutional affiliations.