Article

Large Delta T Thermal Cycling Induced Stress Accelerates Equilibrium and Transformation in Super DSS

1
Department of Mechanical and Mechatronic Engineering, National Taiwan Ocean University, Keelung 20224, Taiwan
2
Department of Materials Science and Engineering, National Taiwan University, Taipei 10617, Taiwan
3
Department of Marine Engineering, National Taiwan Ocean University, Keelung 20224, Taiwan
4
Taiwan Instrument Research Institute, National Applied Research Laboratories, Hsinchu 30076, Taiwan
*
Author to whom correspondence should be addressed.
Crystals 2020, 10(11), 962; https://doi.org/10.3390/cryst10110962
Submission received: 3 September 2020 / Revised: 18 October 2020 / Accepted: 20 October 2020 / Published: 23 October 2020
(This article belongs to the Special Issue Investigation of Duplex Stainless Steel)

Abstract

:
Based on the predicted phase diagram of super duplex stainless steel (DSS) calculated by Thermo-Calc, the maximum peak temperature 1100 °C was selected to ensure no σ phase existence. This target temperature fell into the two-phase solid solution (SS) region. A series of different thermal cycling tests were carried out with the notations of 2SS, 2SS + 3 cycles, 2SS + 7 cycles, 2SS + 13 cycles, and 2SS + 20 cycles. It was found that the trend of two-phase volume ratio variation by thermal cycling followed the predicted thermodynamic equilibrium trend. After 2SS + 7 cycles, the ratio of two-phase δ/γ tended toward the ideal 1:1. According to the electron backscatter diffraction (EBSD) analysis, the δ phase crystal orientation changed from the most frequent directions of <001> and <111> of the as-received sample to the most frequent orientation of <113> after two SS treatments. While the γ phase grain always remained at <101> orientation. The grain boundary misorientation angles of the γ grains were relatively stable, ranging from 53° to 63°, but those of the δ grains were widely distributed actively presuming the lattice rotation. The Kernel Average Misorientation (KAM) value of the local strain in face center cubic (fcc) γ grains was varied and greater than that of the body center cubic (bcc) δ phase, indicating that the former, with a large grain boundary misorientation had larger local deformation than the latter, which possesses wide random misorientation angle distribution.

Graphical Abstract

1. Introduction

Duplex stainless steel (DSS) is a two-phase stainless steel comprising equal volumes of the δ phase and γ phase. The austenite ensures good ductility, toughness, and weldability. The ferrite raises the corrosion resistance mainly against pitting, stress, and crevice corrosion. It has high strength and superior corrosion resistance due to the presence of alloying chromium (Cr), molybdenum (Mo) and nickel (Ni). SAF 2507 (S32750) is developed mainly for chloride-containing environments, like seawater. Therefore, it contains higher amounts of Cr, Mo and N, which also improve the microstructural stability [1,2,3]. The high Cr alloying can increase the corrosion resistance and the Ni improves the toughness. The N can increase the strength and resistance against pitting corrosion [3]. The optimization of the corrosion resistance and the mechanical properties of DSS rely on the precise control of the microstructural evolution during hot deformation and the subsequent process of solid solution [4]. The thermal expansion coefficients between the austenite phase and ferrite phase are different and prominent in DSS. A remarkable thermal stress can be generated, resulting from variations in temperature [5,6] during thermal cycling. On the other hand, an appropriate treatment is required to avoid the existence of undesirable intermetallic phases (such as σ and χ) [4]. The sigma phase among the intermetallic precipitates is the most detrimental, because it can cause considerable drops in corrosion resistance and toughness [7].
According to reports, the strain partitioning of heterogeneous internal stresses at the phase boundaries between ferrite and austenite and the impurity segregation may cause the crack formation [3,8]. When DSSs have an approximately equal proportion of ferrite and austenite, they exhibit higher stress corrosion cracking resistance and higher strength than do single phase austenitic stainless steels [9,10]. In extreme environments, the attractive combination of corrosion resistance and mechanical strength leads to many applications, mostly in the offshore and chemical industries [11]. Numerous investigations have examined the effects of the sigma phase on the corrosion resistance and mechanical properties [12,13]. Besides ferrite and austenite, several secondary phases can form in the range of temperature from 300 °C to 1000 °C. The formation of the precipitation relies on the factors of temperature, time and the chemical composition in DSS. Different intermetallic phases, such as σ, χ, R, G, π and τ [14] often coexist with carbides, nitrides and secondary austenite. Sigma is the most important among all these phases, because its formation kinetics are fast at a wide temperature range. Many studies have shown that sigma can induce severe embrittlement [15]. Dramatic deterioration of toughness and ductility occurs from a small percentage of the sigma phase [10]. By either slow heating or cooling, the sigma phase can form at the thermo-dynamical stability from 600 °C to 1000 °C by passing through this temperature range [10,16]. Furthermore, the sigma formation induces a pronounced variation, between the ferrite and austenite, in partitioning of Cr, Mo and Ni. This alloy partitioning cuts down the pitting and crevice corrosion resistance in chloride environments especially [10].
Thermal cycling is the alternated heating and cooling of a material until it experiences atomic diffusion to reach the equilibrium, relieving stresses and homogenization [17]. AISI 316L stainless steel, after four cycles between 900 °C and 25 °C, exhibits fine 0.8–1.2 μm grains that confer an increase in material strength greater than that of the original 90–120 μm grain size after solid solution treatment for 1 h at 1060 °C [18]. In an aluminum-killed (AIK) grade steel sheet, the kinetics of phase transformation, recrystallization, and grain growth [19] can be accelerated for samples cyclically annealed at temperatures of 465–525 °C with a ramp rate of 3 °C·min−1 for 5 h. The high nickel content of AISI 304L was utilized to study polycrystalline materials in a surge of activity on enhancing the mechanical properties through the transformation of ultrafine grains and nanostructures. A higher content of Ni prevents the generation of delta ferrite and simultaneously prevents or delays the occurrence of martensite (α’) by deformed strain. Before the thermal cycling tests, 304L steel was solid solution treated for one hour at 1060 °C. Nano-sized grains of 260 nm to 500 nm were obtained by thermal processing of four cycles between 25 °C and 775 °C with 30 s of holding. Cycling between 25 °C and 925 °C for two cycles with 30 s of holding yielded the finest average grain size of approximately 240 nm [20]. Overall, an ultrafine grain austenite microstructure can be obtained with the appropriate cyclic temperature range ΔT (the difference between the peak and the bottom temperature) combined with the appropriate number of cycles. The good strength combined favorable ductility of the nanostructured stainless steel is attributed to its ability to be work hardened through the transformation of strain induced martensite (SIM) during deformation [20]. Two kinds of reversion processes in low-carbon steels: (1) cyclic transformation between martensite and austenite, the so-called thermal cycling, and (2) reversion from tempered and cold-rolled lath martensite, can refine the austenite grain sizes smaller than 5 μm. Eventually, fine-grained austenite structures with grain sizes of 1–2 μm were obtained from both processes [21,22,23].
The motivation of this study is to seek an innovative manufacturing process for improving the strength and toughness of structural materials by the largest temperature difference between 25 °C and 1100 °C to generate the largest thermal stress, in order to investigate the un-expected microstructure transformation. The object of this study was to study the variations in the volume fraction, grain size, grain orientation, and grain boundary angle distribution in SAF 2507 duplex stainless steel (DSS) through large-ΔT (large temperature range) thermal cycling. The variations in these factors followed the tendency of the thermodynamic equilibrium state.

2. Materials and Methods

The chemical composition of super duplex stainless steel (DSS) SAF 2507 made in a 4 mm thick plate by SANDVIK was detected by a Glow Discharge Spectrometer (GDS) and is listed in Table 1. The plate of DSS SAF 2507 was cut into small coupons with dimensions of 4 mm (H) × 5 mm (W) × 10 mm (L). The coupons of super DSS were placed in a vacuum system with 1.7 × 10⁻³ torr, heated to a solid solution (SS) temperature of 1100 °C, held for 15 min, and then quenched in 25 °C oil. The above process was repeated twice and termed 2SS. A series of subsequent different thermal cycling tests were carried out following 2SS. The specimen was heated at 1100 °C for 1 min, then rapidly quenched in oil at 25 °C for 1 min, heated again to 1100 °C and quenched again. The same process was repeated 3 times and termed 2SS + 3 cycles. Other thermal cycling parameters were employed, such as 2SS + 7 cycles, 2SS + 13 cycles, and 2SS + 20 cycles. A schematic illustration of the thermal cycling is presented in the plot of Figure 1 [24]. A short holding period of 1 min at the peak temperature was selected mainly to inhibit the grain growth [20]. Short soaking periods at the annealing temperature of about 1 min are generally recommended for reducing costs from an industrial viewpoint [18,25].
To study the crystalline constituent evolution of this material during thermal cycling, X-ray diffraction (XRD) was conducted with the Bruker D2 Phaser at 30 kV with Cu Kα (λ = 0.154056 nm) to identify various crystalline phases. The scan rate was 0.04°/s with 0.5°/s steps from 35° to 95° (2θ) [16,26].
The samples for electron backscatter diffraction (EBSD) analysis were mechanically polished to a smooth surface through a series of grit papers with different numbers, and then further polished with 0.05 μm alumina powder before being electropolished with an electrolyte of 5% perchloric acid, 20% glycerol and 75% ethanol under a voltage of 35 V for approximately 30 s at a temperature of −5 °C to −10 °C. Thermal cycling samples for EBSD examination placed in the scanning electron microscope (SEM) were tilted approximately 70° and the Kikuchi patterns created by the back-scattered electrons were recorded. The EBSD scans using the secondary electron imaging mode were performed under the SEM at 20 kV. The EBSD maps were acquired by using a step size of 0.25 μm. The crystallography mapping was performed by SEM with EBSD in a JEOL JSM-7800f Prime field emission gun SEM equipped with a NordlysNano EBSD detector. The mapping results have a detection rate of above 90%. The grain size was determined in the EBSD system by the mean linear intercept method. Raw datasets were processed in the software HKL Channel 5 and collected by the software AZTEC 3.2.

3. Results

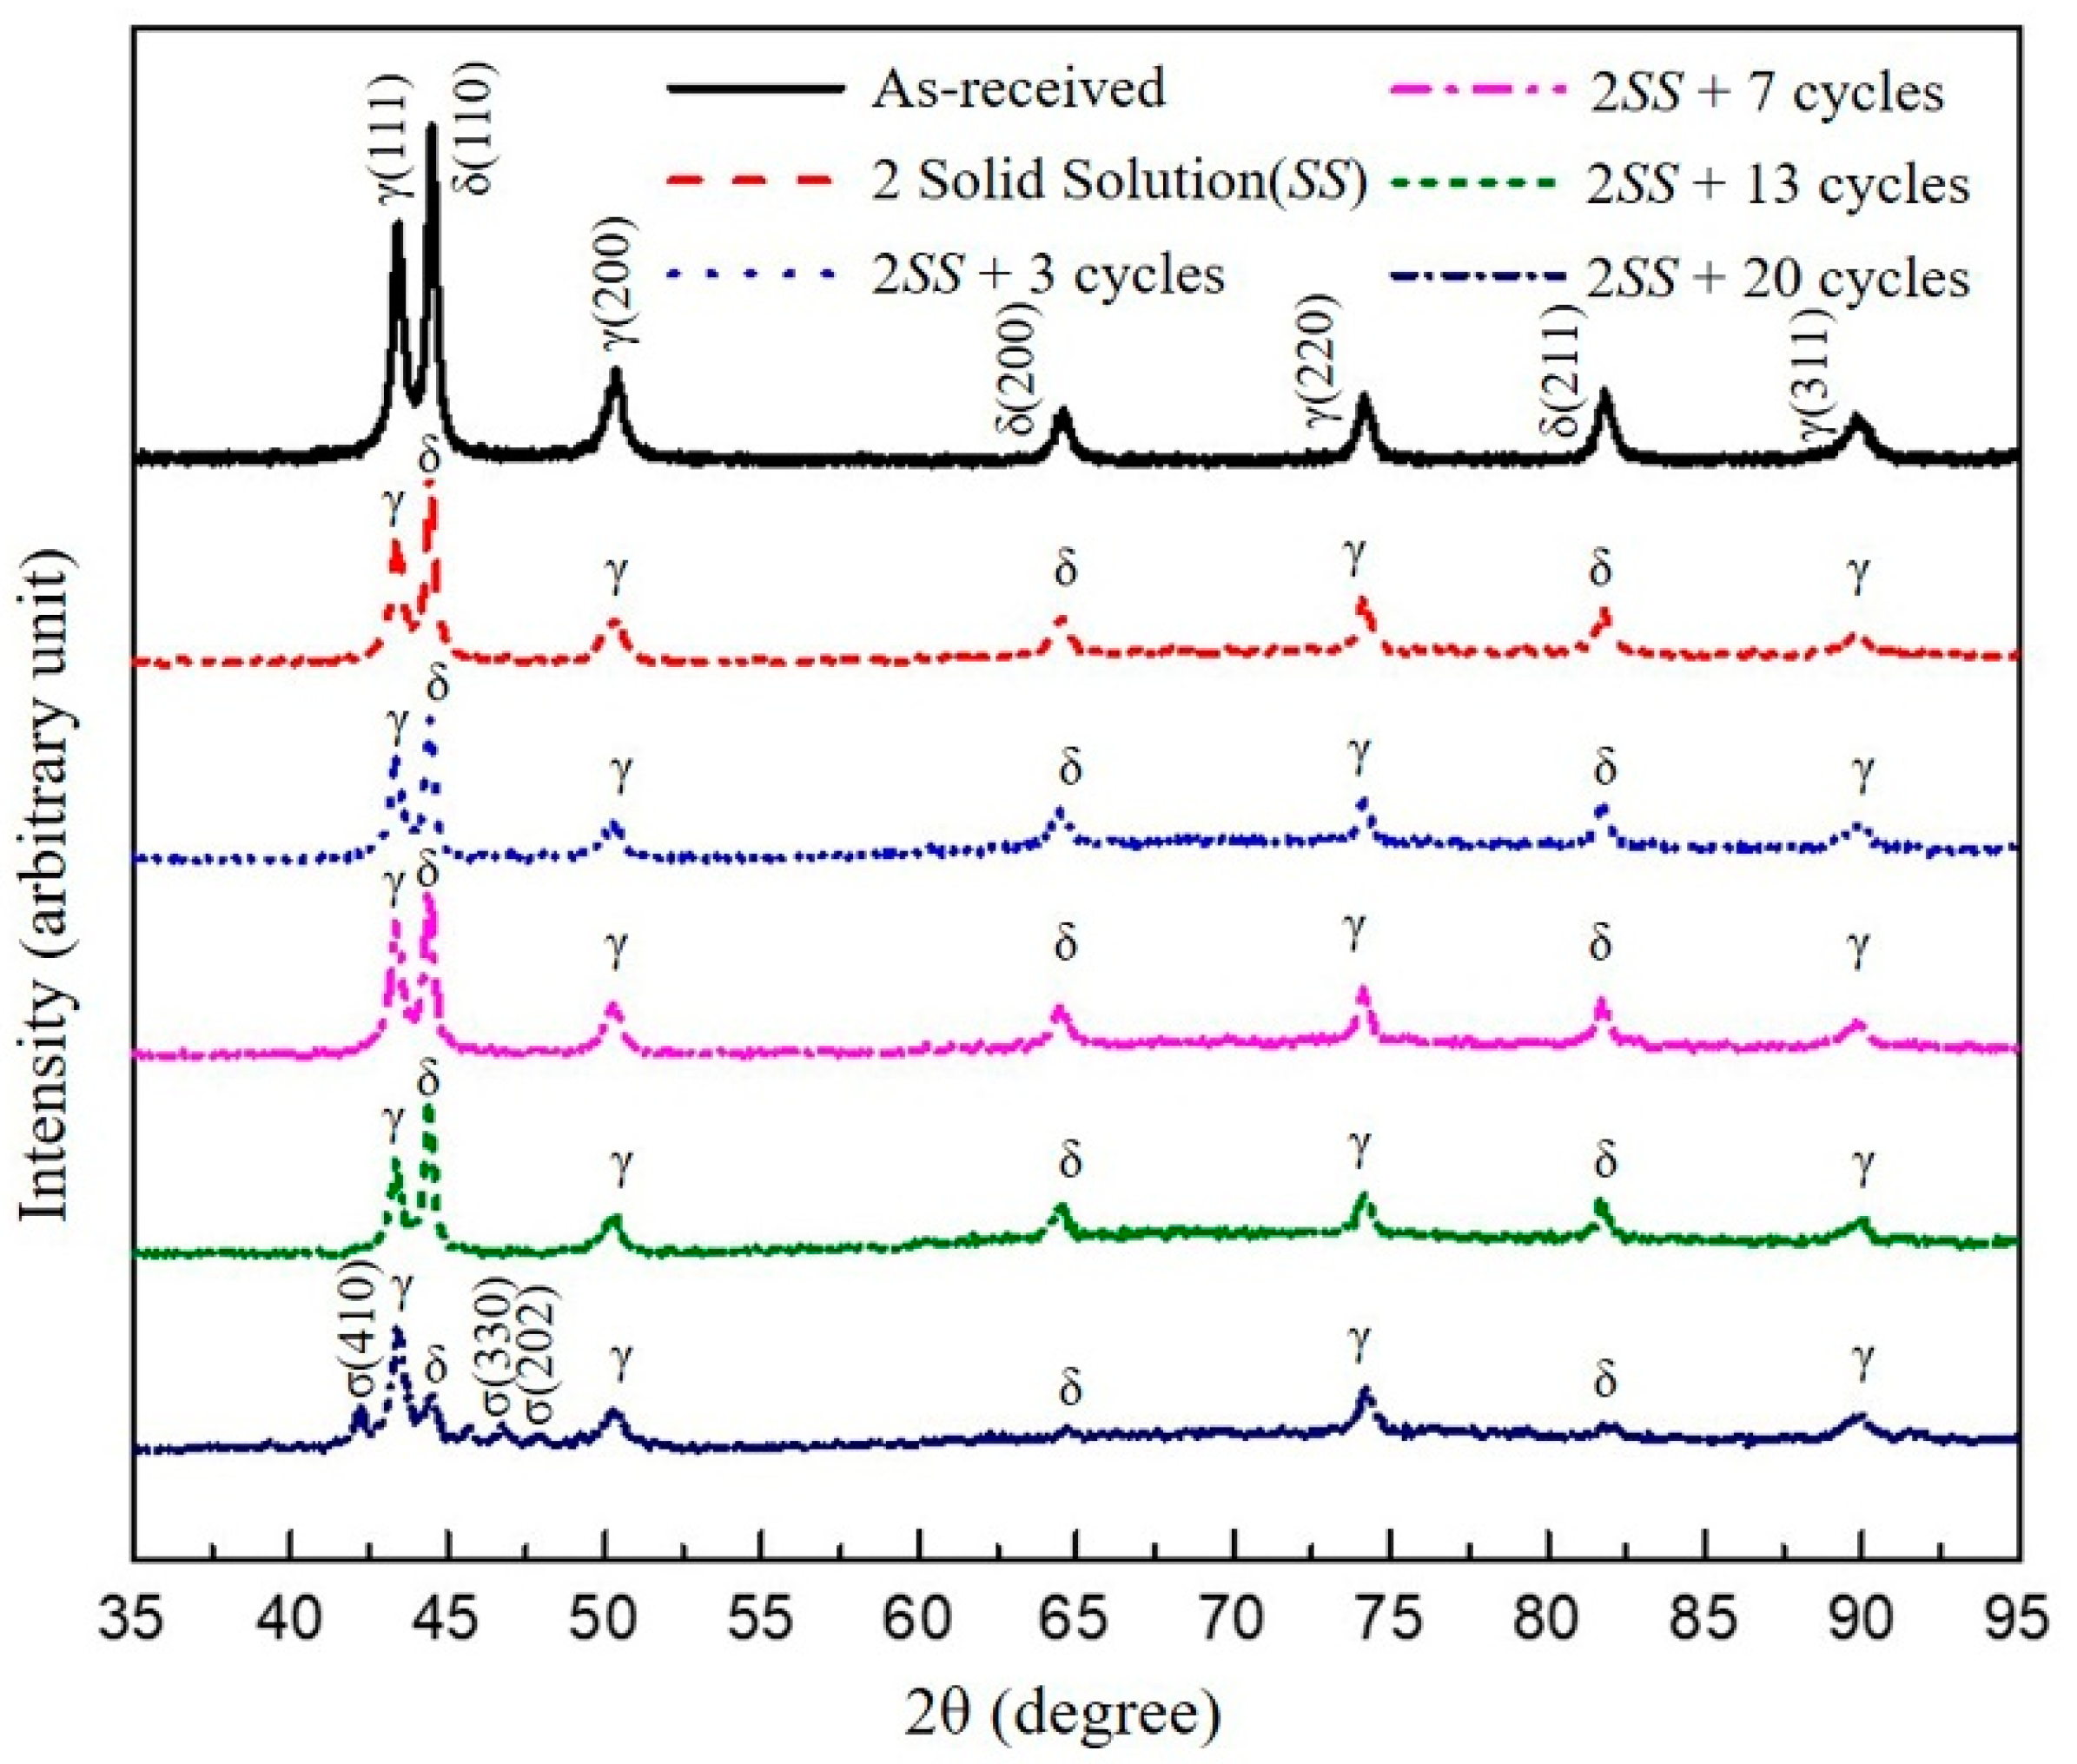
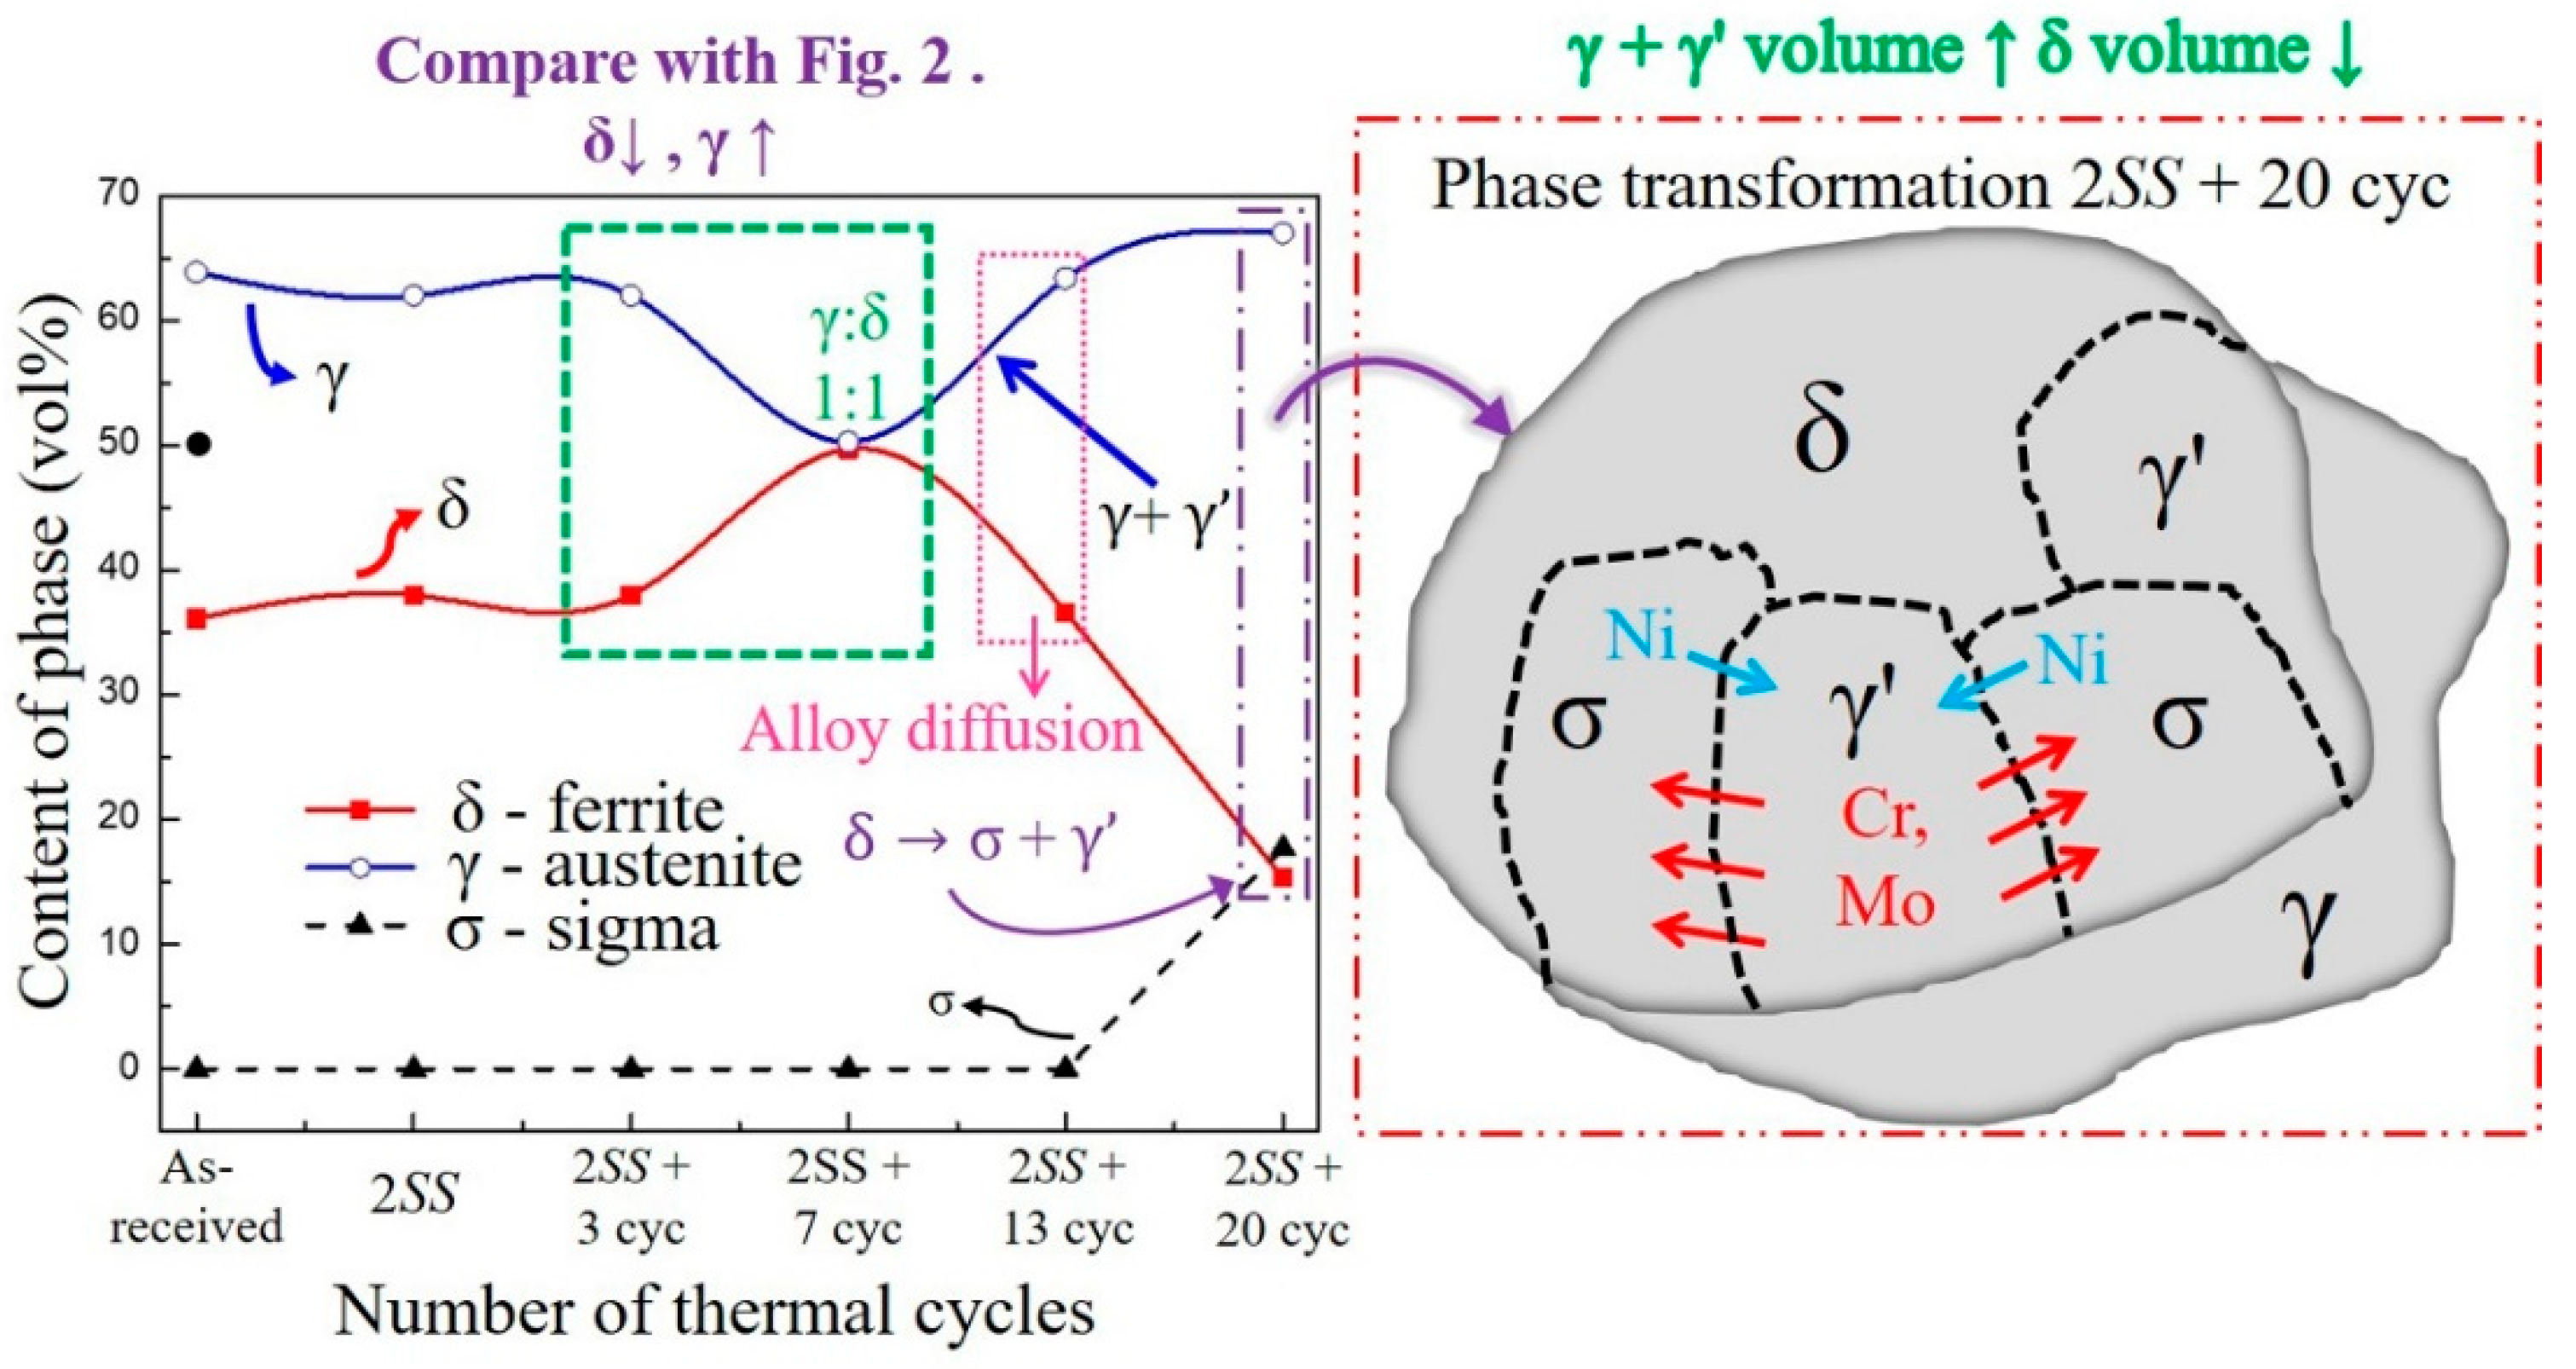
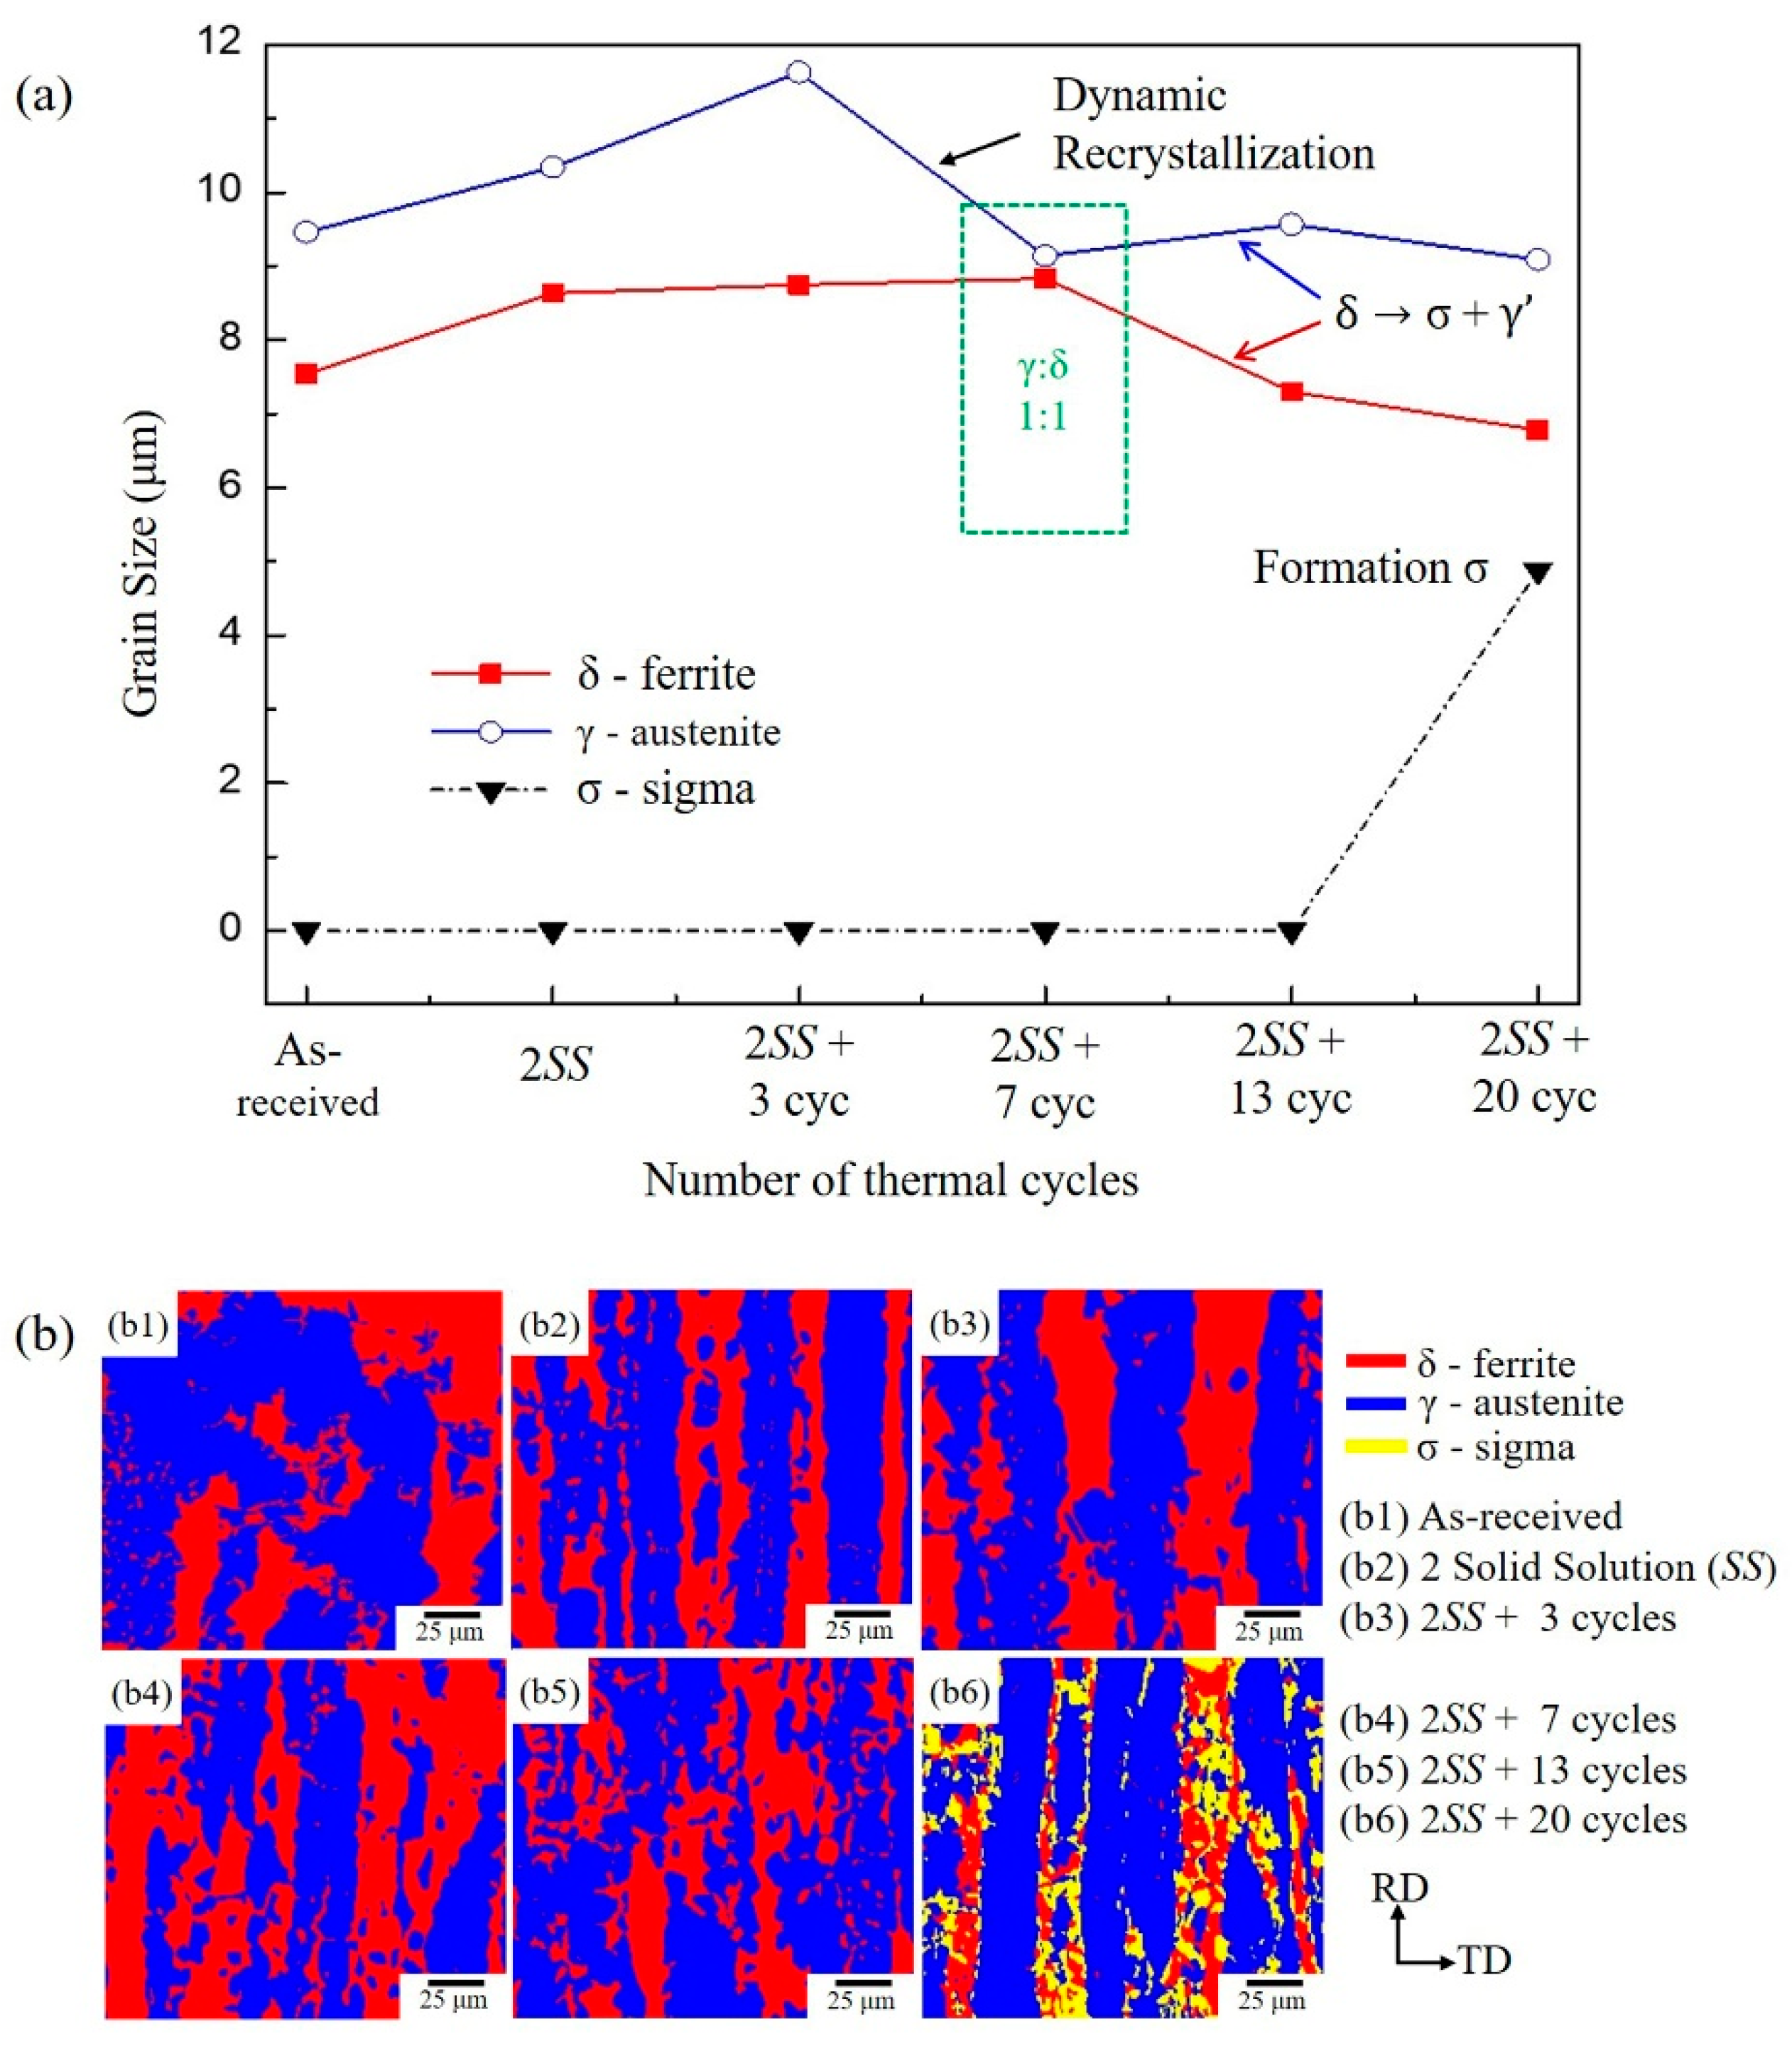
3.1. The Microstructure of XRD and EBSD

The correlation between the phase fraction and temperature in DSS are exhibited in Figure 2, which was calculated by Thermo-Calc. As shown in that figure, only two phases, δ and γ, coexisted above 980 °C, and there was no intermediate σ phase. Therefore, a high temperature of 1100 °C was chosen as the temperature of the SS treatment and the peak temperature (Tmax) of thermal cycling to achieve the study goal of the largest ΔT in the cyclic thermal process. To verify the evolution of the crystalline constituent after the cyclic thermal process, the results of the XRD are plotted in Figure 3. The only ferrite and austenite were observed in the as-received, 2SS, 2SS + 3 cycles, 2SS + 7 cycles, and 2SS + 13 cycles specimens. Moreover, the δ phase XRD peak intensity decreased and the σ phase peak intensity appeared only at 2SS + 20 cycles (Figure 3).
The volume changes of the various phases are shown in Figure 4 as a function of thermal cycles. It was found that the γ volume decreased and the δ volume increased from 2SS + 3 cycles to 2SS + 7 cycles, consistently with the thermodynamic prediction in the temperature range of 850 °C to 1000 °C in Figure 2, to achieve the ideal equilibrium ratio of δ:γ = 1:1 at 2SS + 7 cycles, as depicted in the green square in Figure 4. After the intersection point at 2SS + 7 cycles in Figure 4, the γ phase volume inversely increased and the δ volume decreased with increasing numbers of cycles (2SS + 13 cycles and 2SS + 20 cycles), causing the formation of small γ’ grains, indicated by the fine dotted pink rectangle and purple rectangle in Figure 4, based on the δ phase eutectoid decomposition of δ → σ + γ’ [5,27]. This so-called secondary γ’ with high nickel and low chromium content is generated from the eutectoid decomposition of δ. The total γ volume increase resulted from the eutectoid γ′ merging into the original γ phase grain, as indicated by the fine dotted pink narrow rectangle in Figure 4.
In addition, the grain sizes of the δ and γ phases were influenced by the cycles, as shown in Figure 5a. The grain sizes of γ and δ initially increased due to grain growth. After that, the γ grain size decreased from 2SS + 3 cycles to 2SS + 7 cycles due to the dynamic recrystallization of the γ phase (Figure 5). During thermal cycling, heterogeneous stresses and strains that developed between the δ phase and γ phase favored recrystallization over grain growth, thus leading to grain refinement [18,28]. The eutectoid decomposition of the δ phase resulted in the γ grain size increasing slightly due to the merged γ’ and the δ grain size shrinkage at 2SS + 13 cycles and 2SS + 20 cycles, as depicted in Figure 5a.
When the correct constituent phases are provided, EBSD analysis can easily identify crystalline structures and quantify phase volumes. The orientation of the crystalline lattice planes and the crystal structure were dependent on the positions of the Kikuchi lines in an EBSD pattern. The basis of phase quantification is the fraction of the area covered by a single phase and proportional to the given phases volume (area fraction) in EBSD phase maps. The corresponding EBSD phase map is presented in Figure 5b for different cycle numbers of thermal processes. Red represents the δ phase; blue, the γ phase; and yellow, the σ phase. An intermetallic phase of the σ phase is a tetragonal crystal structure that is formed in the range of 600–1000 °C in SAF 2507 [13,14]. At this temperature, the phase χ, which is the precursor of phase σ, may occur in DSS. Phase χ is associated with negative effects on mechanical properties [24]. Most δ ferrite (red) grains shrank and were replaced by the σ phase (yellow) at 2SS + 20 cycles in Figure 5b.

3.2. Misorientation Angle and KAM Analysis

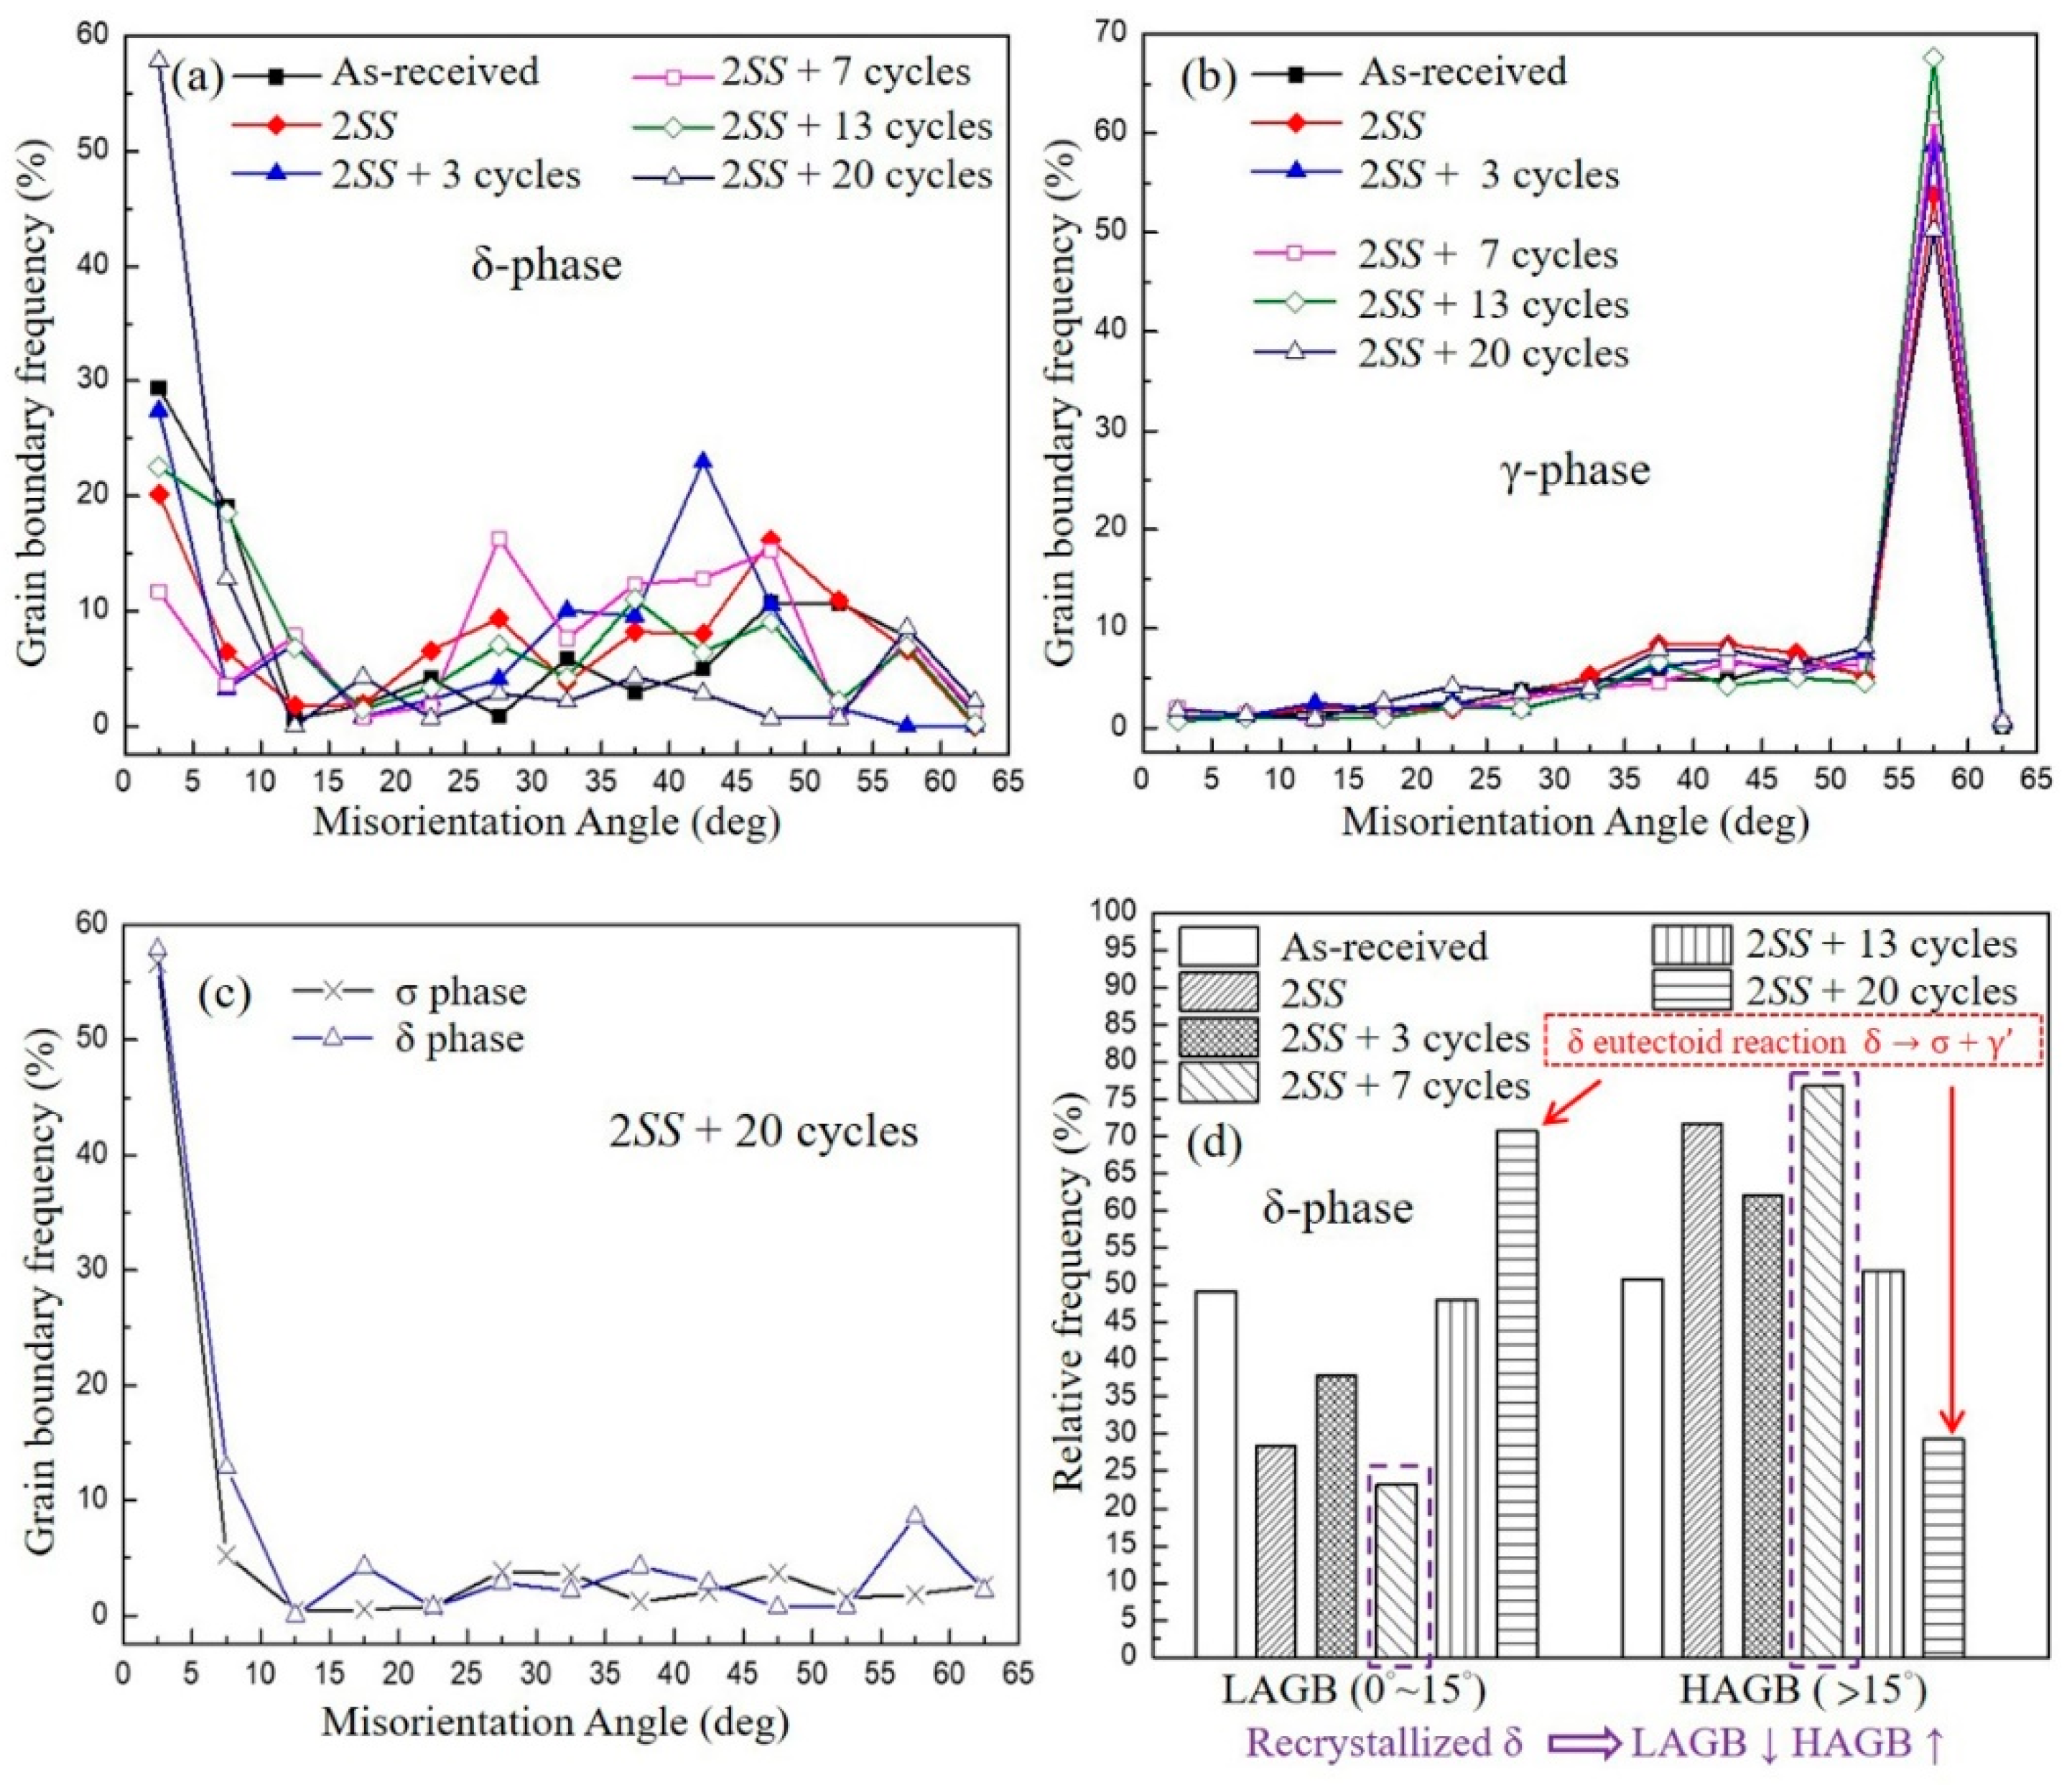
3.2.1. Misorientation Angle Analysis

A low angle grain boundary (LAGB) is assigned as the definition of misorientation, θ < 15°. During plastic deformation, the free dislocations generated can readily rearrange themselves and lead to the development of LAGB for quite a lot of grains [25] in Figure 6a. However, θ > 15° is termed a HAGB (high angle grain boundary). A misoriented angle distribution was observed in all grains after different numbers of thermal cycles, as summarized in Figure 6a–d. The grain boundary angle changed with the thermal cyclic number. Particularly, the grain boundary angles of most γ grains were concentrated between 53° and 63°; they were not affected by the thermal cyclic number (Figure 6b). It has been reported that newly reverted γ assembles the lath martensite at high-angle boundaries after repeated thermal cycles [20,24]. The complexity increases because of the simultaneous presence of δ and γ phases in DSS. Some reports have indicated that the ferrite phase of DSS exhibits dynamic recovery (DRV) at high temperatures, and the austenite phase of DSS dynamic recrystallization (DRX) [29,30]. Because γ has a lower yield stress than δ in DSS, thermal stress-induced plastic deformation occurred earlier at the γ grains. Thus, most HAGBs higher than 50° triggered DRX in the γ grains, including annealing twins after annealing, and led to a buildup of higher misorientation between neighboring sub-grains [31,32,33] in Figure 6b. In contrast, all the misorientation angles of the δ phase exhibited a random wide distribution from 2° to 63° for all the different thermal cycling parameters, such as as-received, 2SS, 2SS + 3 cycles, 2SS + 7 cycles, 2SS + 13 cycles, and 2SS + 20 cycles in Figure 6a,d. It was noted that the misorientation angle distributions of the δ and σ grains were very similar, as depicted in Figure 6c. This plausibly confirmed that the σ grains originated from δ grains in situ by eutectoid decomposition in the 2SS + 20 cycles condition. Intrinsically, the bcc δ phase had high stacking fault energy (SFE), and the fcc γ phase had low SFE [25,34]. The δ ferrite showed DRV, with high stacking fault energy, by the rearrangement of accumulating lattice dislocations through slip systems to form the substructures and subgrains. The γ austenite, with lower stacking fault energy, showed DRX to generate some HAGB and twin boundaries at around 57.5° [31,34], as shown in Figure 6b. Recrystallization caused most grains with misoriented HAGB to be driven by the thermal cycling induced thermal stress assisted thermodynamic equilibrium, as shown in Figure 4 and Figure 6d (dotted vertical rectangle) at 2SS + 7 cycles. Consequently, the number of HAGB grains increased and the δ:γ ratio was the ideal 1:1, in contrast to the unchanged misoriented angles of γ grains in Figure 6b. It is noted that the misorientation angle distributions do not account for boundaries with misorientations below 2° because of the intrinsic limitations of the EBSD technique [35].

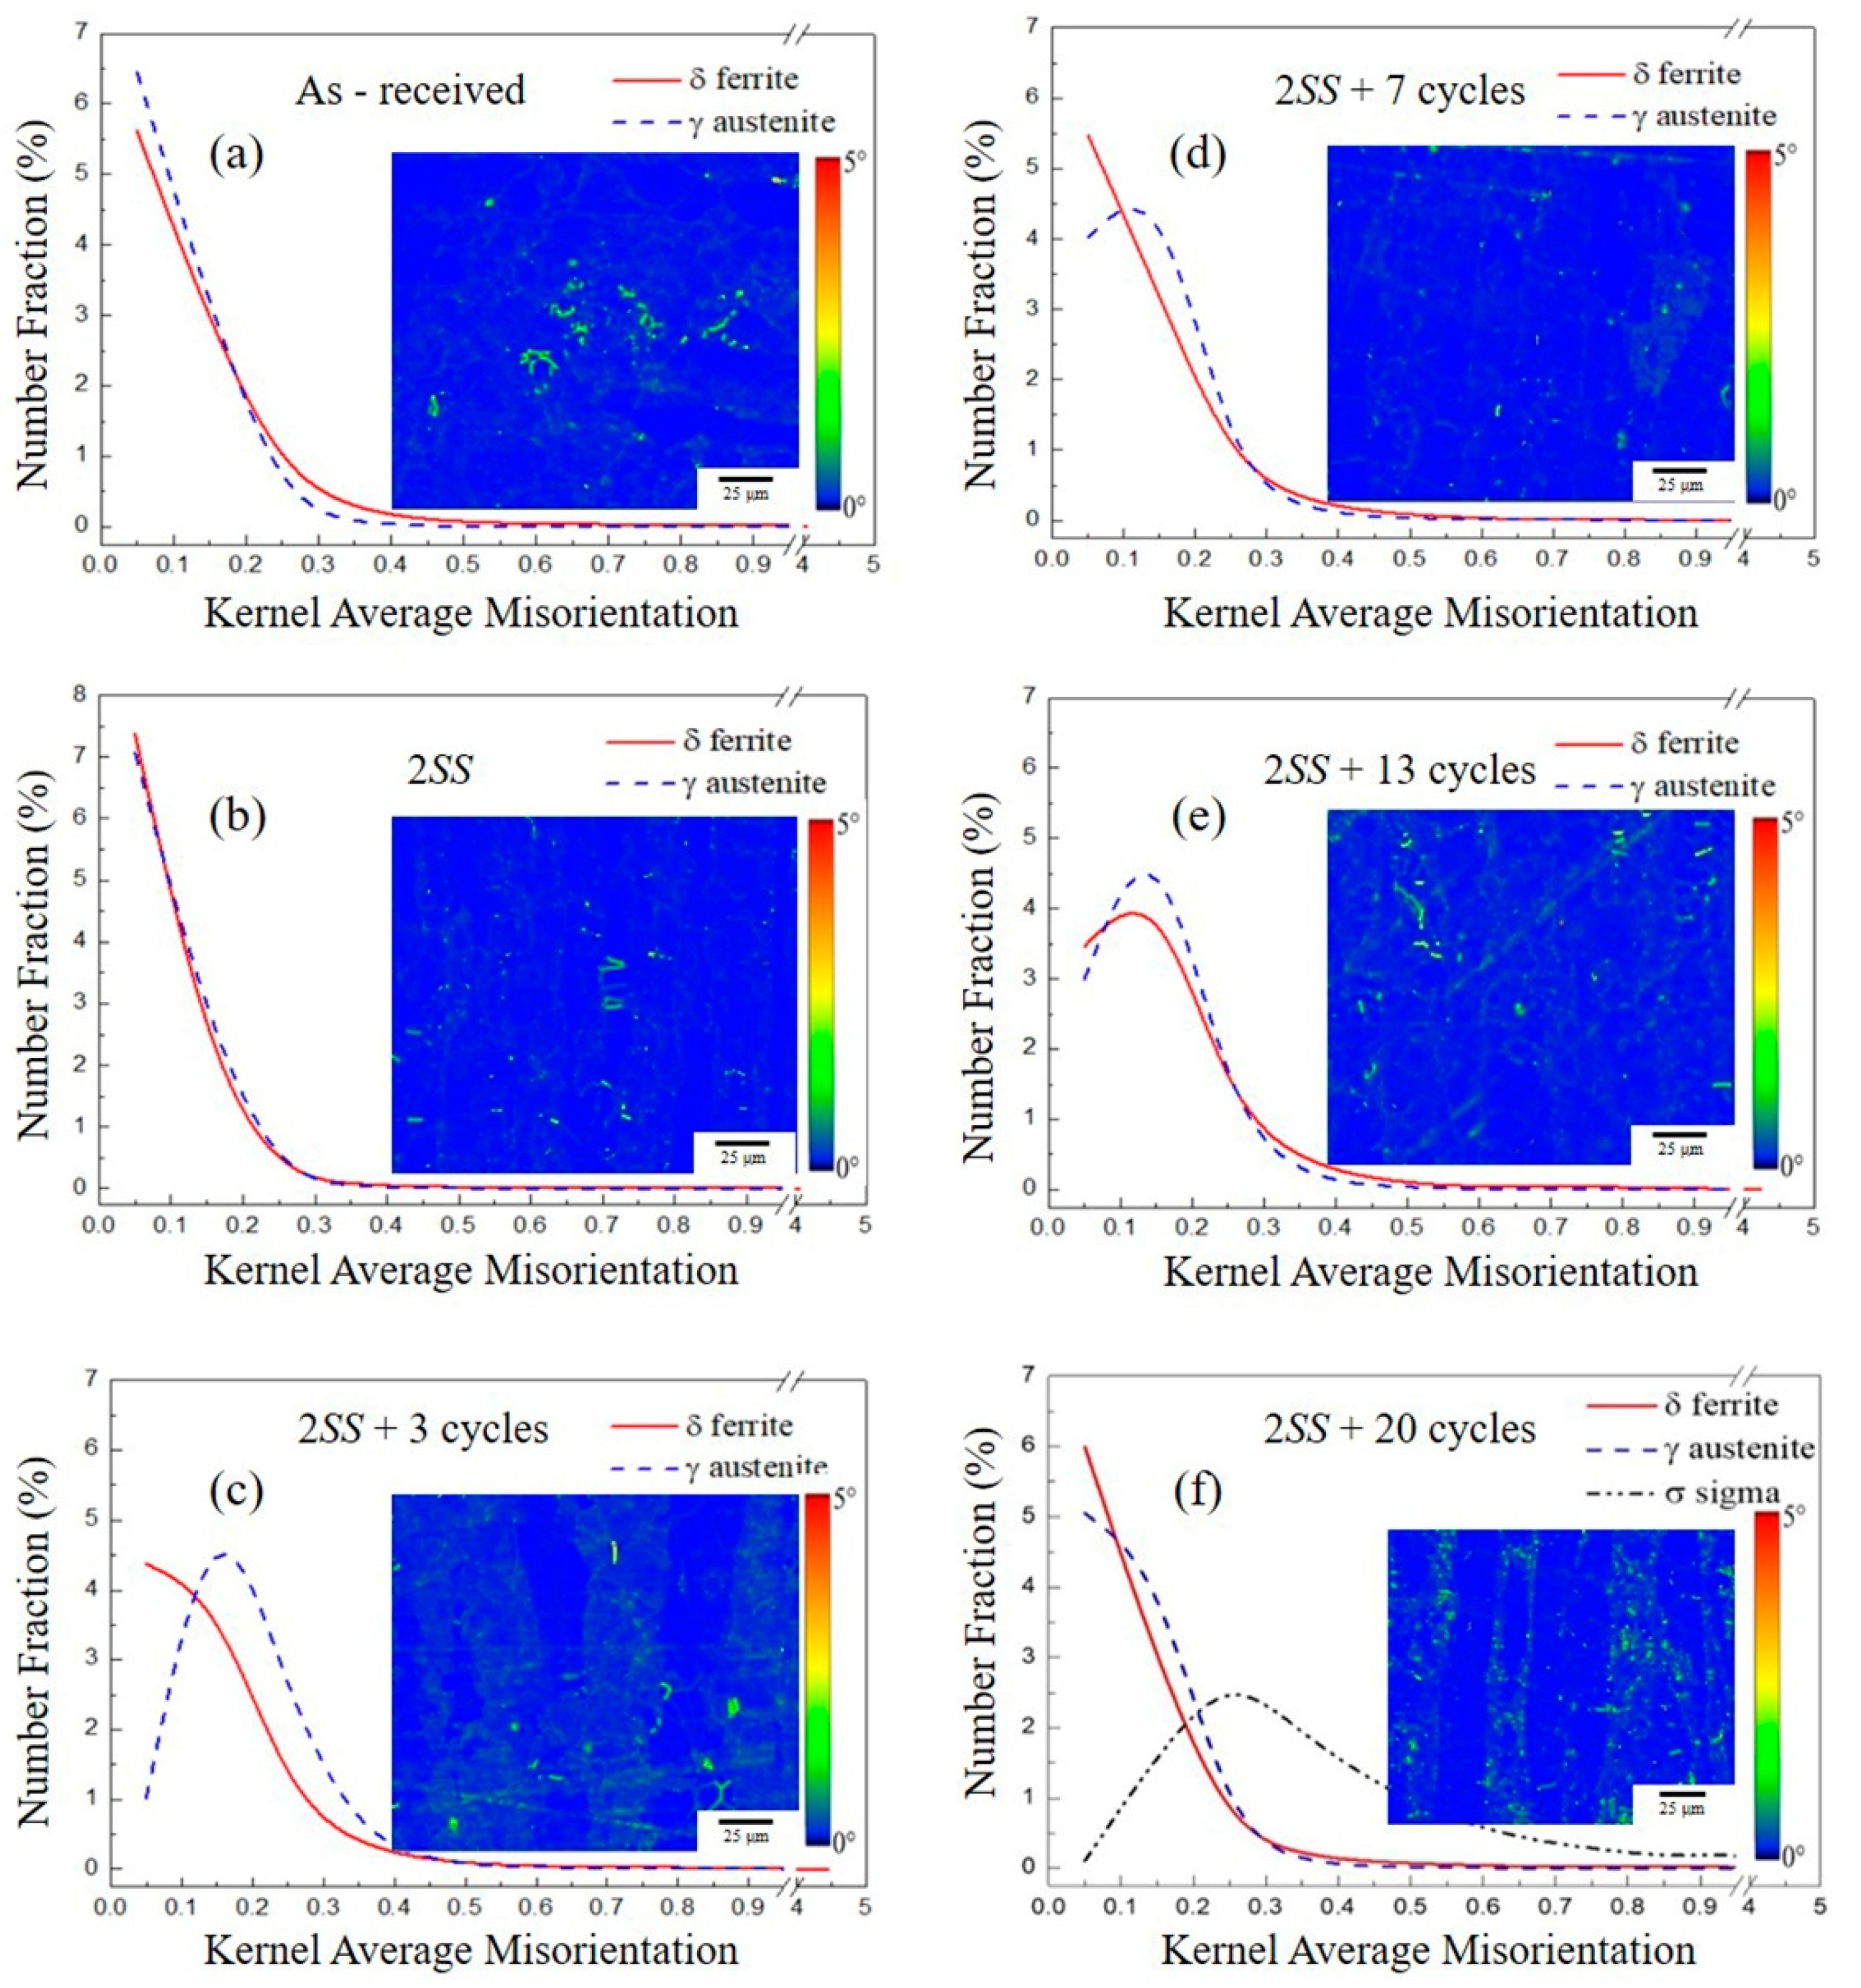
3.2.2. Kernel Average Misorientation (KAM) Analysis

KAM analysis is helpful to understand local lattice distortion, local deformation, and high dislocation density, which indicate the strain energy stored in the grain [36,37]. KAM maps express the misorientation between data points and their neighbors. The extent of deformation in grains can be estimated from KAM maps. Without considering misorientations higher than 5°, KAM scans were measured by calculating the misorientation of each point up to its third neighbor [38,39]. Detailed KAM of less than 5° under different thermal cycles for each phase is plotted in Figure 7. The misorientation between the grain boundaries and interior grains was elucidated based on this limit on misorientation values chosen. The degree of local crystalline misorientation within each grain was determined by the illustrated color-typed code. Red (5°) corresponds to the highest misorientation, whereas blue (0°) corresponds to the grains without any misorientation [29]. In Figure 7, the KAM maps show the misorientation at the interfaces between the γ, δ, and σ phases, in an order of the as-received (Figure 7a), 2SS (Figure 7b), 2SS + 3 cycles (Figure 7c), 2SS + 7 cycles (Figure 7d), 2SS + 13 cycles (Figure 7e), and 2SS + 20 cycles (Figure 7f) from 0° to 5°. The KAM distribution shifted from a low angle in blue to higher angles in other colors as the cycle number increased, which indicated changes in the misfit between grain boundaries. High degrees of misorientation are expressed by bright green and yellow on the key bar (Figure 7).
The KAM mapping and the distribution of number fractions versus KAM below 5° represented local plastic strain in green in mapping under the thermal cycling condition. A solid red line indicated the δ grains with lower local misorientation (less plastic strain), comparing with a dotted blue line indicated the γ grains with higher local misorientation, both at different thermal cycles, as depicted in the line plot of Figure 7. The δ and γ KAM curves were coincident after two solid solution cycles (Figure 7b) and better than that of the as-received material (Figure 7a). Compared with the low local strain in the as-received and solid solution treated samples, the KAM of the δ and γ grains had a tendency for high local strain caused by thermal cycling, as shown in Figure 7c–f. The blue dotted line shape of the γ KAM curves varied significantly more than the red solid line shape of the δ KAM curves after thermal cycling because DRX occurred in the γ phase in Figure 7c,d. The same trend of both the red-line shape for δ and the blue dotted line shape for γ plausibly resulted from the initiation and nucleation of δ eutectoid decomposition at 2SS + 13 cycles in Figure 7e. In the 2SS + 20 cycles condition, the σ formation induced a higher KAM strain at the σ grain boundary than at the δ and γ grain boundaries, as shown in Figure 7f. The blue mapping inset in Figure 7 represents the grain region adjacent to the boundary with a very low dislocation density [29]. Generally, the high dislocation density results in a subgrain angle > 1° [40,41,42,43] which can lead to the deformed grains having KAM > 1°, whereas the recrystallized grains have KAM < 1°. The newly formed grains during recrystallization revealed a random texture. The local dislocation density distribution and the recrystallization fraction [44,45] might be examined from KAM results. In the DSS, the misorientations (>15°) among grains also dominated the location of σ formation. The σ precipitation sites were favored at high crystallographic misorientation sites between the γ/δ and δ/δ boundaries. Meanwhile, the amount of σ content increased and the minimum critical deviation angle for σ phase formation was reduced [46] as the annealing time increased.

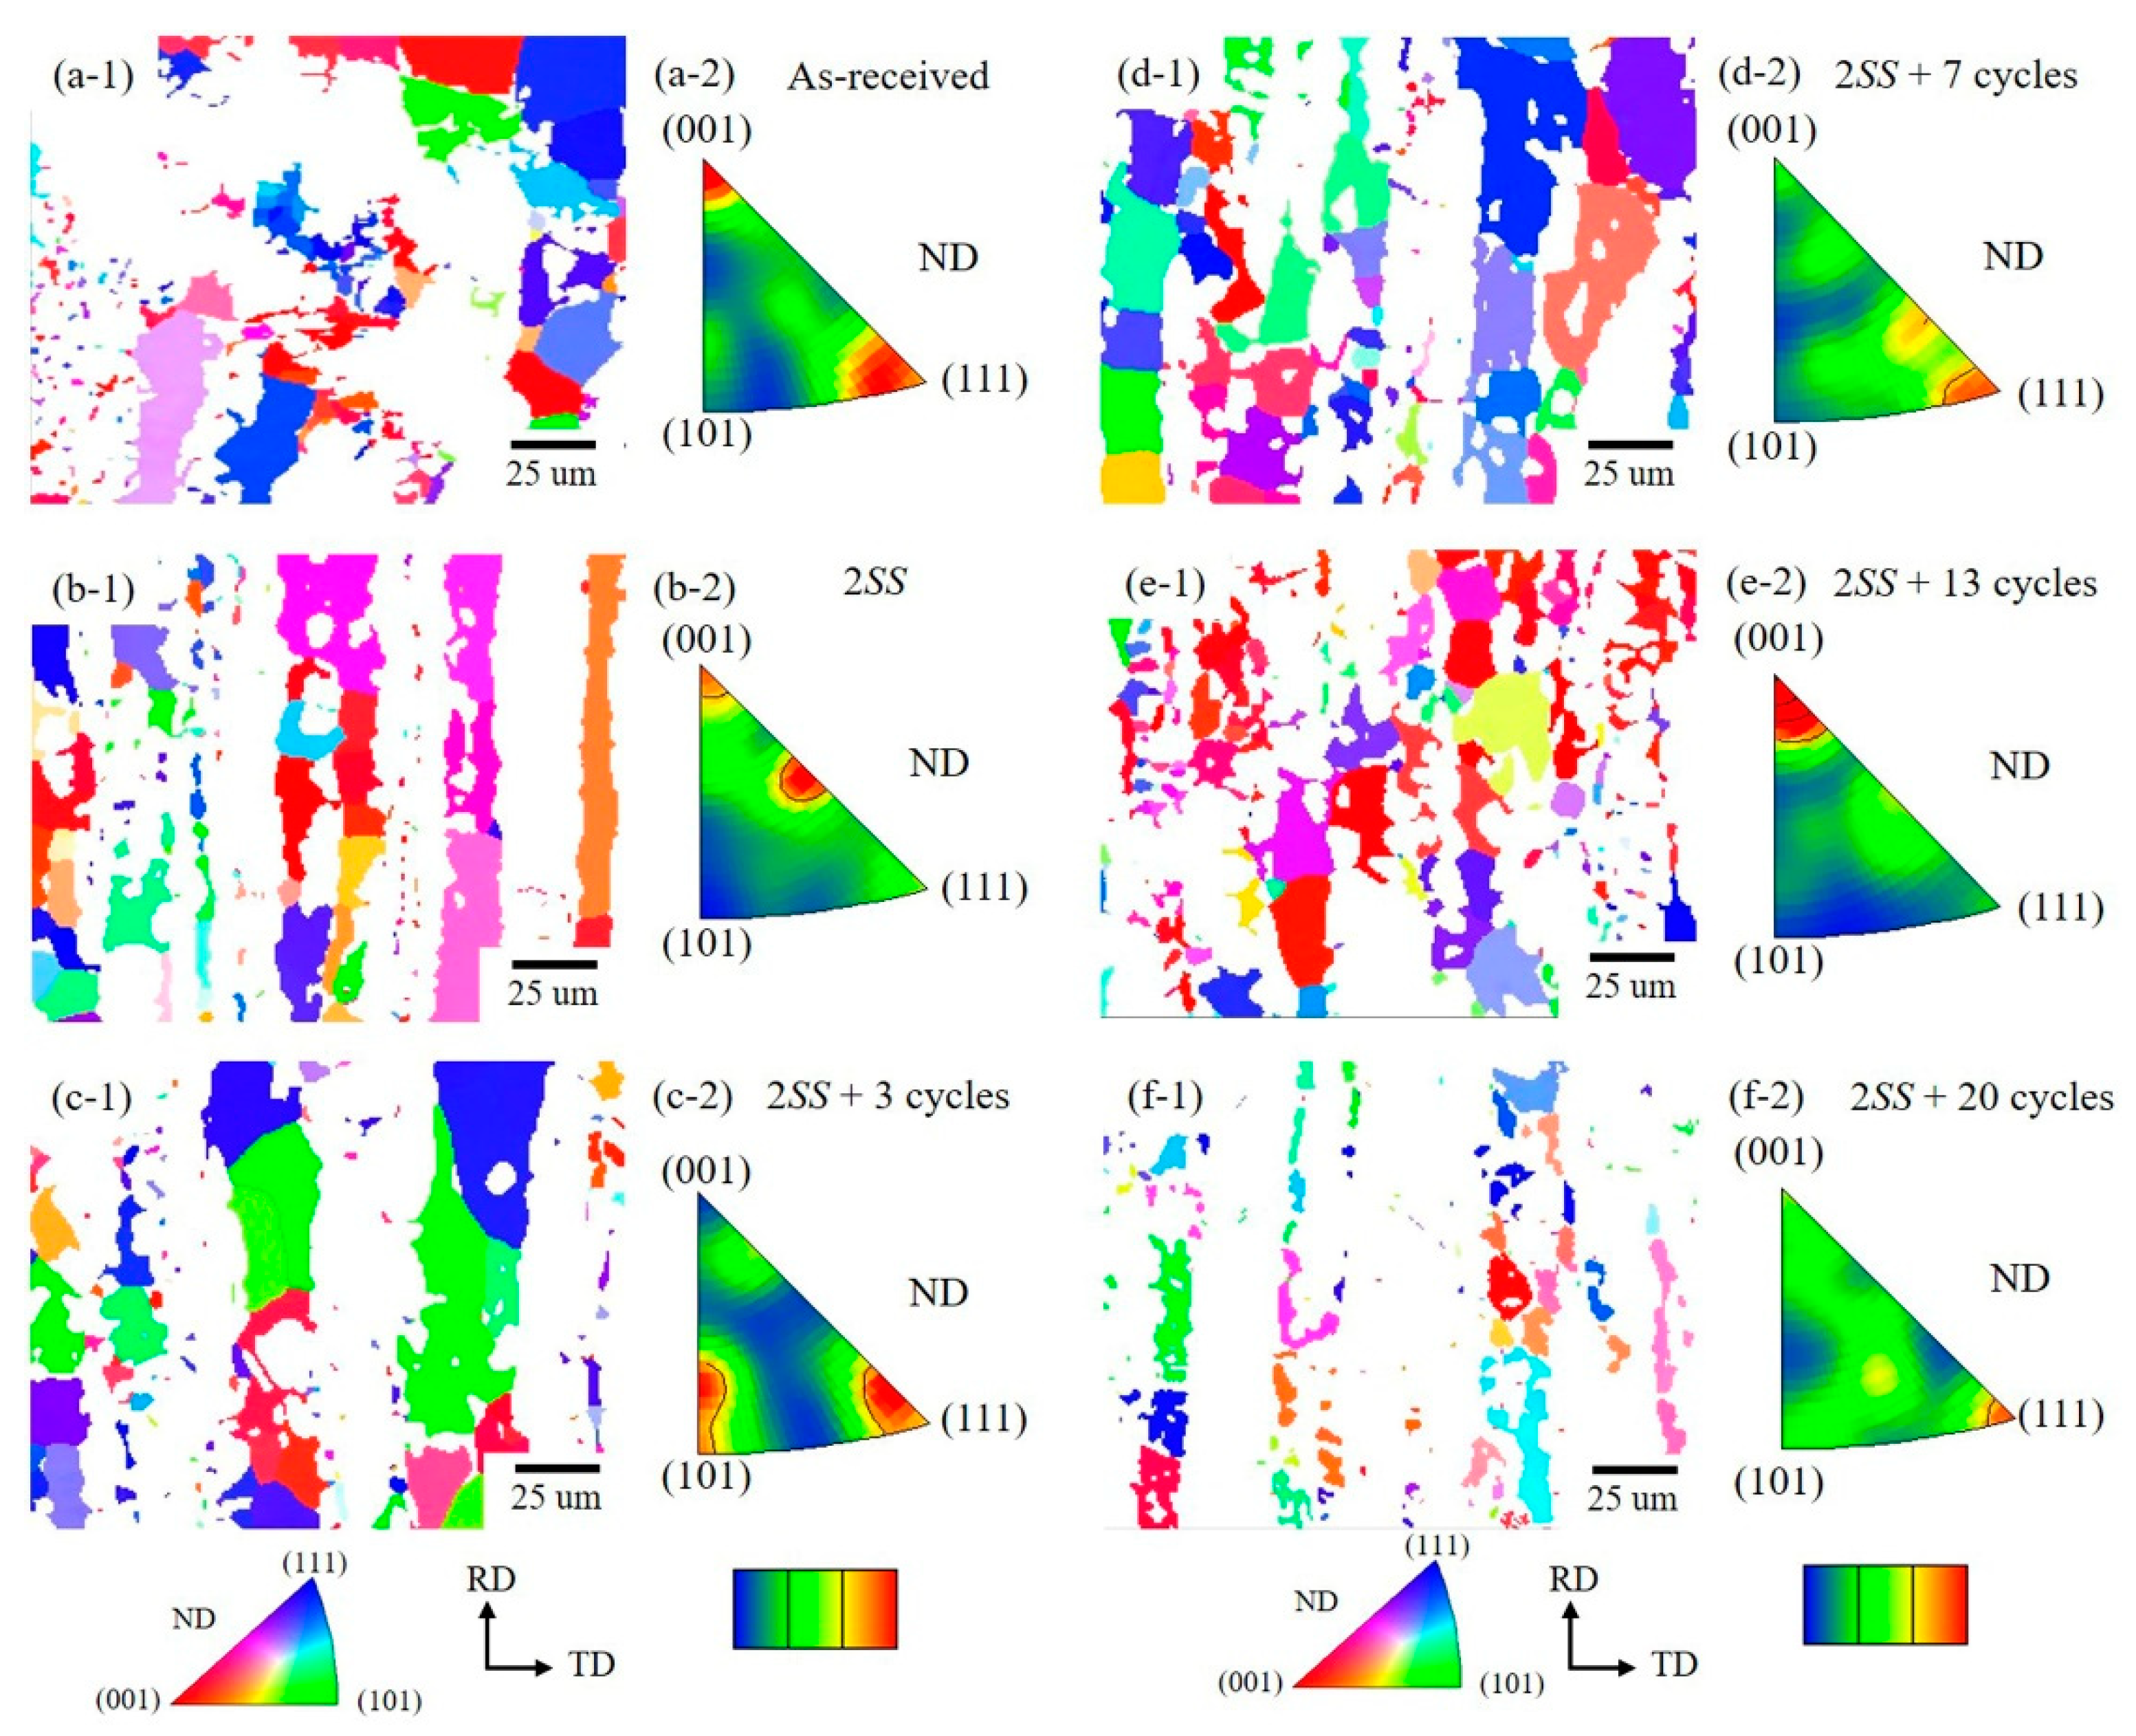
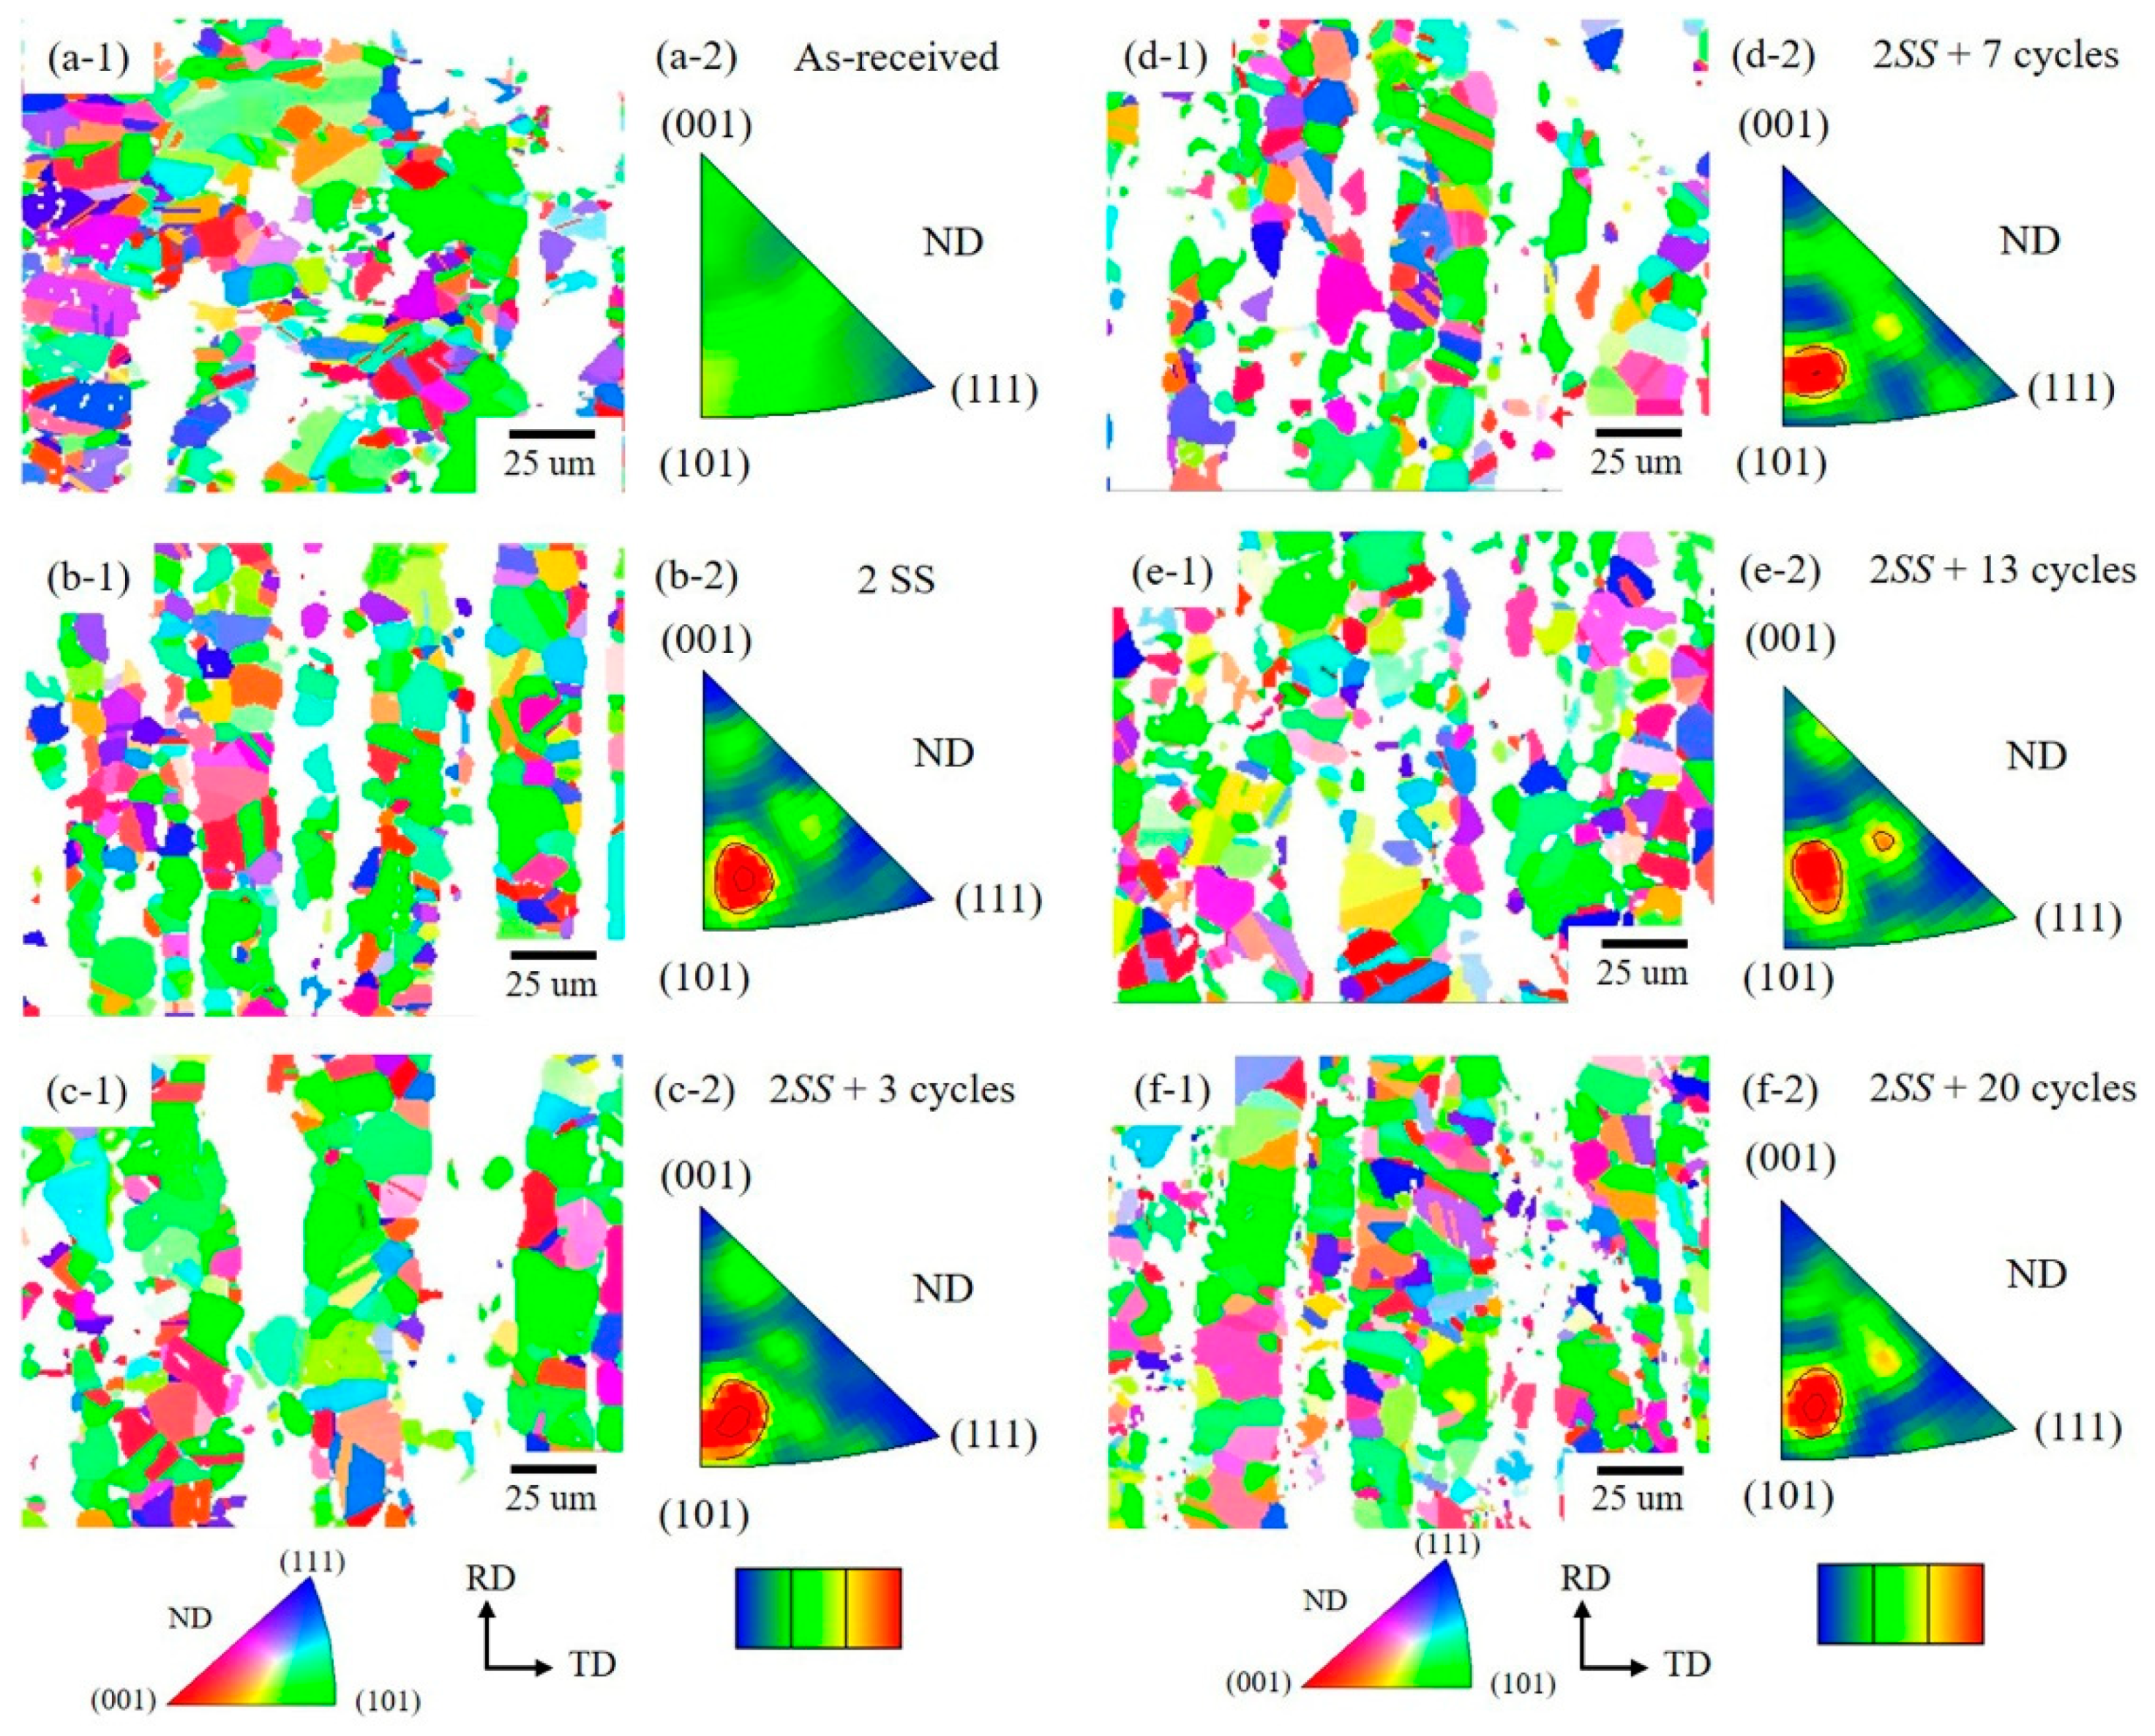
3.3. Grain Orientation Variation

The inverse pole figure (IPF) obtained by EBSD exhibited the most frequent grain orientation analysis on normal direction (ND) planes, as shown in Figure 8 and Figure 9 for different thermal cycles. The δ phase grain orientation changed in the order shown in Figure 8(a-1–f-2) as follows. The most frequent δ orientations of most grains in the as-received material were <001> and <111>, which changed to close to <113> and <001> orientation and <111> disappeared at 2SS. The most frequent orientations transferred to <101> and <111> at 2SS + 3 cycles, then to the most frequent orientation <111> with a few grains at <112> at 2SS + 7 cycles and the most frequent orientation was <001> at 2SS + 13 cycles. Consequently, most grains had random orientation, with few grains of the most frequent <111> at 2SS + 20 cycles. This can plausibly be explained by either recrystallization of δ or the new σ grain formation by the eutectoid reaction at 2SS + 20 cycles.
On the other hand, the grain orientation of the γ phase in the texture changed in Figure 9(a-1–f-2) as follows. The grains showed an arbitrary oriented distribution for as-received materials, then formed a most frequent <315> orientation close to <101> at 2SS and 2SS + 3 cycles, then turned to <315> orientation slightly away from <101> at 2SS + 7 cycles, and stayed at <315> orientation nearby <101> with a few <213> grains at 2SS + 13 and 2SS + 20 cycles. In comparison, the grain orientation of the δ phase was variable, but the grain orientation of the γ phase was relatively stable around <315> close to <101> and was not affected by the number of thermal cycles or the precipitation of the σ phase caused by the eutectoid reaction.

4. Discussion

The insight into microstructure variation needs to understand, furthermore, the thermal stress induced transformation mechanism. The γ phase volume decreased and the δ phase volume increased, corresponding to the trend of the Thermo-Calc thermodynamic equilibrium plot in Figure 2 (σ purple dotted line frames at 2SS + 3 cycles). The ratio of the δ phase to the γ phase reached the ideal 1:1 at 2SS + 7 cycles. Conversely, the volume of the γ phase began to increase due to the constituents of the γ phase plus the γ’ phase from the eutectoid reaction of δ grains at 2SS + 13 cycles and at 2SS + 20 cycles. The σ grains were rich in Cr and Mo, resulting in the depletion of passivating alloy in the adjacent phases. Meanwhile, this process led to a local relative increase in the Ni concentration in the adjacent phases, assisting the secondary austenite (γ’) formation in a lamellar structure in the vicinity of the sigma phase [47]. This phase transformation resulted from diffusion of the alloying elements, such as Mo and Cr, and led to new phase formation through thermal cycling. A small-sized σ phase appeared at 2SS + 20 cycles and was presumed to have resulted from the insufficient holding time at 1100 °C during the thermal cycles, leading to the easy nucleation of the σ phase, as depicted in Figure 10b. The high susceptible σ phase formation in DSS is attributed to a higher content of the ferrite-stabilizing alloy, Cr, Mo, and Si, in the δ phase, accompanying the austenite-stabilizing elements of C, N, and Ni which are less soluble [48]. The σ phase generation results from the δ phase having high affinity of Cr and Mo and higher diffusivity in the body center open structure than that in the γ phase of close packed structure. This process occurs through a eutectoidal decomposition of δ-ferrite transformation: δ → σ + γ′. Cr and Mo were absorbed by the σ phase during the migration of the phase boundary, whereas Ni was rejected by the adjacent transformed γ′ [49], as illustrated on the right side of Figure 4. This is called second austenite γ′ transformation because of the accompanying Ni enrichment. Moreover, the σ phase nucleated at either the γ/δ or δ/δ grain boundaries and grew into ferrite grains until the end of the transformation in Figure 10b [27].
The grain sizes of variously-oriented γ and δ grains are plotted at the top of Figure 10 for 2SS (blue bar) and 2SS + 20 cycles (red bar). The γ phase map in blue at 2SS + 20 cycles revealed numerous twins (twin boundaries depicted with green lines in Figure 10b embedded among the large γ grains, some of which attracted small γ’ grains. No twins were found inside the δ and σ grains in Figure 10b. It was found that the γ and δ grain sizes were both refined significantly by the large ΔT thermal cycling process, as shown in Figure 10a.
The fine grain size formation was caused by the thermal stress induced by the thermal cycling [28]. In addition, the equivalent isothermal temperature T iso , T iso   =   T minimum   +   0.63   ( T maximum     T minimum ) , of the cyclic temperature is a more conservative reference temperature than the mean temperature [ T mean   =   1 2   ( T maximum   +   T minimum ) ] of the cyclic profile [50].
The KAM mapping represented local plastic strain generated under the thermal cycling condition in Figure 7c–f. After local plastic deformation from thermal cycling, two dislocation configurations were theoretically observed in the deformed microstructure [51], i.e., (i) statically stored dislocations (SSDs) and (ii) geometrically necessary dislocations (GNDs). Comparing the KAM results of δ and γ grains with the low local strain in the as-received and solid solution treated samples, a tendency of high local strain was caused by the thermal cycling in Figure 7. With increases in strain, dislocations produced by deformation spontaneously assemble into boundaries with large misorientation, which can accommodate the lattice rotation inside the grain [52]. The lower dislocation density provided a small misorientation with lower stored strain energy. Therefore, the stored-energy difference between dislocation-poor areas was pretty low. The above comments are consistent with the KAM results shown in Figure 7.

5. Conclusions

The variations of different phase grain orientations and KAM grain boundary misorientations were investigated after different cyclic numbers of thermal processes with large ΔT. The grains initially grew and then shrank as the cyclic numbers of thermal process increased. The average γ and δ grain sizes were reduced due to recrystallization and the small γ’ grain formation by the eutectoid reaction.
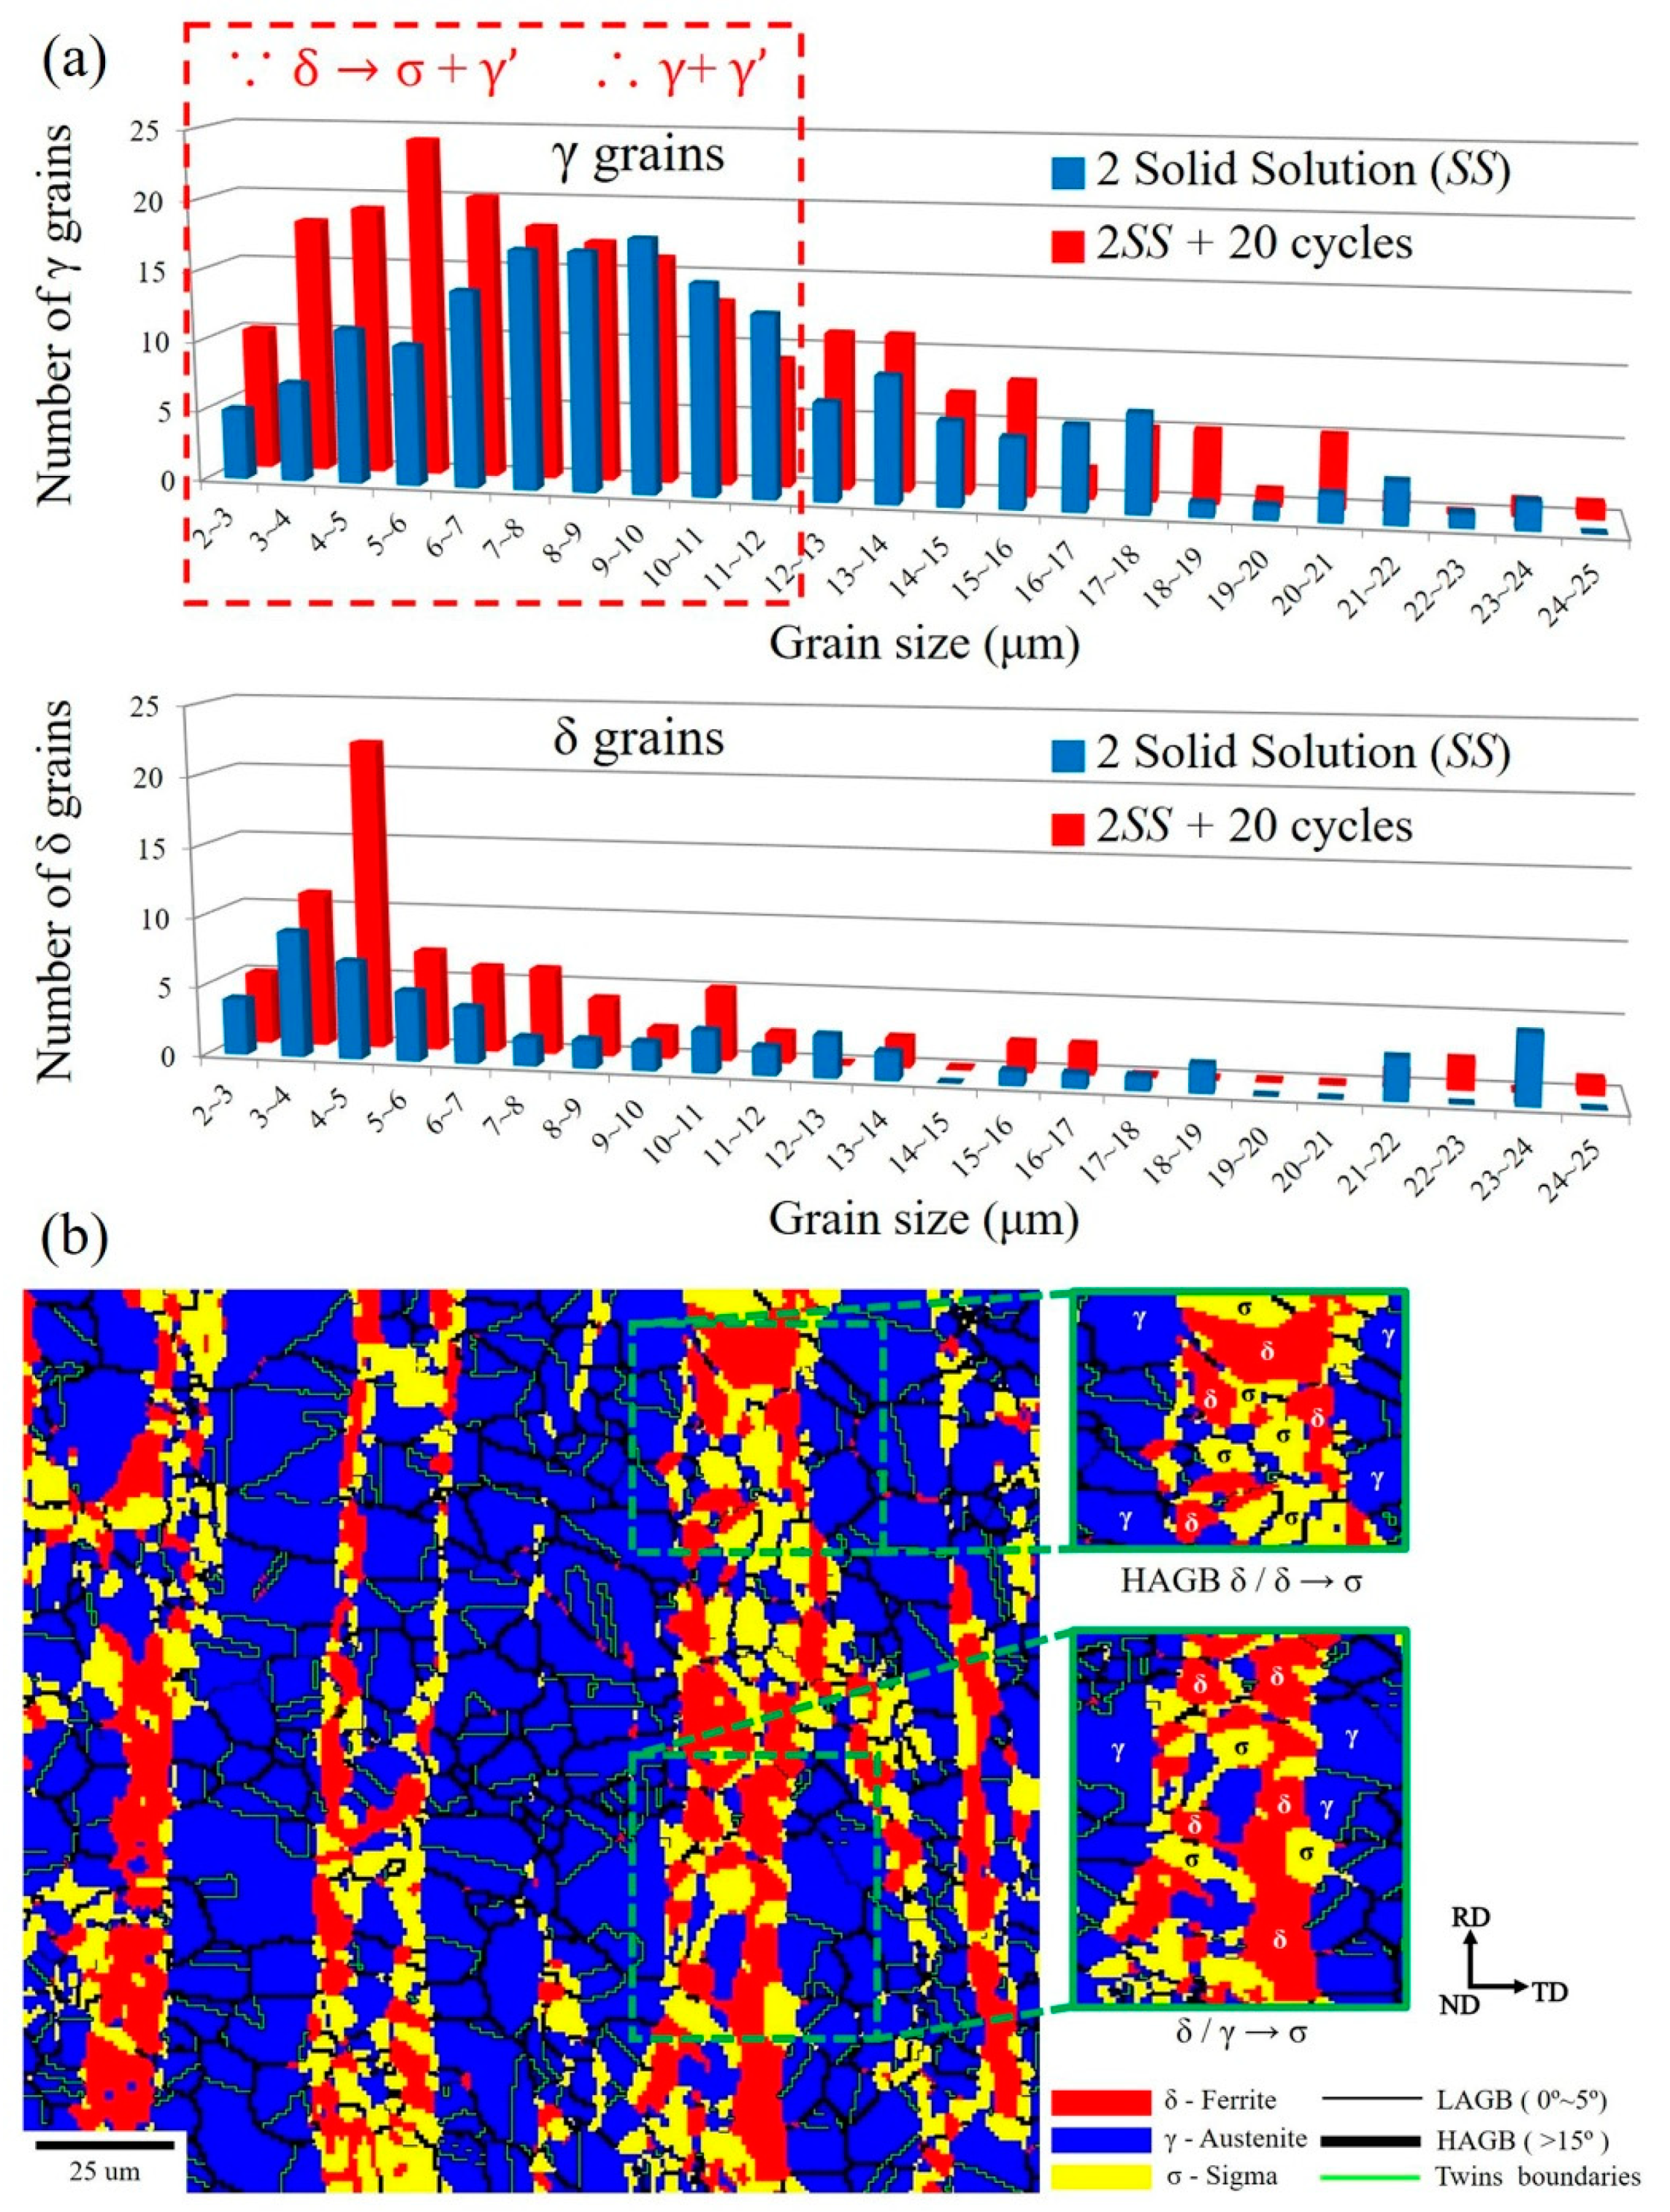
  • The volumes of the δ phase and the γ phase reached the ideal ratio of 1:1 at 2SS + 7 cycles, following the thermodynamic equilibrium. The grain boundary misorientation angles of most γ grains ranged between 53° and 63° and were not affected by the thermal cycles. In contrast, the misorientation angles of δ grains were widely distributed from 3° to 63°.
  • The KAM value was affected by the thermal cycles, and its distribution of γ grain change was always significantly greater than that of the δ grains because of the γ recrystallization and twin formation.
  • However, the most frequent orientation of δ varied from as-received <001> and <111> to <001> and <113> → <101> and <111> → <111> with few <112> → <001> → few <111> as the cycle numbers increased. This was attributed to the grain rotation during growth and the recrystallization of δ grains.
  • In contrast, the most frequent orientation of the γ phase was stable and stayed at <315> orientation close to <101>.
  • The σ formation generated a wider KAM angle distribution than did the γ and δ grains at 2SS + 20 cycles, representing the high local strain produced between σ and γ, or between σ and δ, or between σ and σ.

Author Contributions

Investigation, Methodology, Writing–original draft, Formal analysis, P.-J.Y.; Methodology, Data curation, Validation, S.-C.C. and H.-W.Y.; conceptualization, Visualization, H.-Y.C.; Conceptualization, Writing—review and editing, Project administration, Funding acquisition, Supervision, S.-H.W.; Conceptualization, Writing—Review and Editing, J.-R.Y.; Resources, Visualization, P.-K.C.; Resources, Conceptualization, T.-R.L. All authors have read and agreed to the published version of the manuscript.

Funding

This research was conducted with financial support from the Ministry of Science and Technology (MOST) of Taiwan under grant MOST 109-2221-E-019-047.

Conflicts of Interest

The authors declare that they have no conflict of interest.

References

  1. Sahu, J.; Krupp, U.; Ghosh, R.; Christ, H.-J. Effect of 475 °C embrittlement on the mechanical properties of duplex stainless steel. Mater. Sci. Eng. A 2009, 508, 1–14. [Google Scholar] [CrossRef]
  2. Chail, G.; Kangas, P. Super and hyper duplex stainless steels: Structures, properties and applications. Procedia Struct. Integr. 2016, 2, 1755–1762. [Google Scholar] [CrossRef] [Green Version]
  3. Varbai, B.; Májlinger, K. Physical and Theoretical Modeling of the Nitrogen Content of Duplex Stainless Steel Weld Metal: Shielding Gas Composition and Heat Input Effects. Metals 2019, 9, 762. [Google Scholar] [CrossRef] [Green Version]
  4. Tehovnik, F.; Arzensek, B.; Arh, B.; Skobir, D.; Pirnar, B.; Zuzek, B. Microstructure evolution in SAF 2507 super duplex stainless steel. Mater. Technol. 2011, 45, 339–345. [Google Scholar]
  5. Siegmund, T.; Werner, E.; Fischer, F. The irreversible deformation of a duplex stainless steel under thermal cycling. Mater. Sci. Eng. A 1993, 169, 125–134. [Google Scholar] [CrossRef]
  6. Berecz, T.; Mészáros, I.; Szabó, P.J. Decomposition of the ferritic phase in isothermally aged SAF 2507 duplex stainless steel. Mater. Sci. Forum 2008, 589, 185–190. [Google Scholar] [CrossRef]
  7. Ahn, Y.; Kang, J. Effect of aging treatments on microstructure and impact properties of tungsten substituted 2205 duplex stainless steel. Mater. Sci. Technol. 2000, 16, 382–388. [Google Scholar] [CrossRef]
  8. Balancin, O.; Hoffmann, W.A.M.; Jonas, J.J. Influence of microstructure on the flow behavior of duplex stainless steels at high temperatures. Met. Mater. Trans. A 2000, 31, 1353–1364. [Google Scholar] [CrossRef]
  9. Sato, Y.; Nelson, T.; Sterling, C.; Steel, R.; Pettersson, C.O. Microstructure and mechanical properties of friction stir welded SAF 2507 super duplex stainless steel. Mater. Sci. Eng. A 2005, 397, 376–384. [Google Scholar] [CrossRef]
  10. Fargas, G.; Mestra, A.; Mateo, A. Effect of sigma phase on the wear behavior of a super duplex stainless steel. Wear 2013, 303, 584–590. [Google Scholar] [CrossRef]
  11. Sridhar, N.; Kolts, J.; Flasche, L.H. A Duplex Stainless Steel for Chloride Environments. JOM 1985, 37, 31–35. [Google Scholar] [CrossRef]
  12. Chen, T.; Weng, K.; Yang, J. The effect of high-temperature exposure on the microstructural stability and toughness property in a 2205 duplex stainless steel. Mater. Sci. Eng. A 2002, 338, 259–270. [Google Scholar] [CrossRef]
  13. Angelini, E.; De Benedetti, B.; Rosalbino, F. Microstructural evolution and localized corrosion resistance of an aged superduplex stainless steel. Corros. Sci. 2004, 46, 1351–1367. [Google Scholar] [CrossRef]
  14. Fargas, G.; Anglada, M.; Mateo, A. Effect of the annealing temperature on the mechanical properties, formability and corrosion resistance of hot-rolled duplex stainless steel. J. Mater. Process. Technol. 2009, 209, 1770–1782. [Google Scholar] [CrossRef]
  15. Nilsson, J.-O.; Kangas, P.; Wilson, A.; Karlsson, T. Mechanical properties, microstructural stability and kinetics of σ-phase formation in 29Cr-6Ni-2Mo-0.38N superduplex stainless steel. Met. Mater. Trans. A 2000, 31, 35–45. [Google Scholar] [CrossRef]
  16. Li, J.-S.; Cheng, G.-J.; Yen, H.-W.; Yang, Y.-L.; Chang, H.-Y.; Wu, C.-Y.; Wang, S.-H.; Yang, J.-R. Microstrain and boundary misorientation evolution for recrystallized super DSS after deformation. Mater. Chem. Phys. 2020, 246, 122815. [Google Scholar] [CrossRef]
  17. Agbadua, S.A.; Nezhad, H.Y.; Mgbemena, C.E.; Chima, L.O. Thermal cycling effects on the fatigue behaviour of low carbon steel. J. Miner. Mater. Charact. Eng. 2011, 10, 1345–1357. [Google Scholar] [CrossRef]
  18. Nanda, T.; Kumar, B.R.; Singh, V. A Thermal Cycling Route for Processing Nano-grains in AISI 316L Stainless Steel for Improved Tensile Deformation Behaviour. Def. Sci. J. 2016, 66, 529. [Google Scholar] [CrossRef]
  19. Kumar, B.R.; Das, S.; Sharma, S.; Sahu, J. Effect of thermal cycles on heavily cold deformed AISI 304L austenitic stainless steel. Mater. Sci. Eng. A 2010, 527, 875–882. [Google Scholar] [CrossRef]
  20. Kumar, B.R.; Mahato, B.; Sharma, S.; Sahu, J. Effect of cyclic thermal process on ultrafine grain formation in AISI 304L austenitic stainless steel. Met. Mater. Trans. A 2009, 40, 3226–3234. [Google Scholar] [CrossRef]
  21. Furuhara, T.; Kikumoto, K.; Saito, H.; Sekine, T.; Ogawa, T.; Morito, S.; Maki, T. Phase transformation from fine-grained austenite. ISIJ Int. 2008, 48, 1038–1045. [Google Scholar] [CrossRef] [Green Version]
  22. Sellars, C.M.; Whiteman, J.A. Recrystallization and grain growth in hot rolling. Met. Sci. 1979, 13, 187–194. [Google Scholar] [CrossRef]
  23. Tokizane, M.; Ameyama, K.; Takao, K. Ultra-fine austenite grain steel produced by thermomechanical processing. Scr. Met. 1988, 22, 697–701. [Google Scholar] [CrossRef]
  24. Li, J.S.; Cheng, G.J.; Yen, H.W.; Wu, L.T.; Yang, Y.L.; Wu, R.T.; Yang, J.R.; Wang, S.H. Thermal cycling induced stress–assisted sigma phase formation in super duplex stainless steel. Mater. Des. 2019, 182, 108003. [Google Scholar] [CrossRef]
  25. Kumar, B.R.; Gujral, A. Plastic deformation modes in Mono- and bimodal-type ultrafine-grained austenitic stainless steel. Met. Microstruct. Anal. 2014, 3, 397–407. [Google Scholar] [CrossRef]
  26. Ashrafi, H.; Najafizadeh, A. Fabrication of the ultrafine grained low carbon steel by cold compression and annealing of martensite. Trans. Indian Inst. Met. 2015, 69, 1467–1473. [Google Scholar] [CrossRef]
  27. Fellicia, D.M.; Sutarsis; Kurniawan, B.A.; Wulanari, D.; Purniawan, A.; Wibisono, A.T. Study of sigma phase in duplex SAF 2507. Mater. Sci. Eng. 2017, 202, 12039. [Google Scholar] [CrossRef] [Green Version]
  28. Ghaemifar, S.; Mirzadeh, H. Refinement of banded structure via thermal cycling and its effects on mechanical properties of dual phase steel. Steel Res. Int. 2018, 89, 1700531. [Google Scholar] [CrossRef]
  29. Trusov, P.V.; Kondratev, N.S. Crystal plasticity modeling of duplex steels at high temperatures. Adv. Mater. Res. 2014, 1040, 455–460. [Google Scholar] [CrossRef]
  30. Jimenez, J.; Frommeyer, G.; Carsí, M.; Ruano, O.A. Superplastic properties of a δ/γ stainless steel. Mater. Sci. Eng. A 2001, 307, 134–142. [Google Scholar] [CrossRef]
  31. Maki, T.; Furuhara, T.; Tsuzaki, K. Microstructure development by thermomechanical processing in duplex stainless steel. ISIJ Int. 2001, 41, 571–579. [Google Scholar] [CrossRef]
  32. Jinlong, L.; Tongxiang, L.; Chen, W.; Limin, D. Effect of ultrafine grain on tensile behaviour and corrosion resistance of the duplex stainless steel. Mater. Sci. Eng. C 2016, 62, 558–563. [Google Scholar] [CrossRef] [PubMed]
  33. Eghlimi, A.; Shamanian, M.; Eskandarian, M.; Zabolian, A.; Nezakat, M.; Szpunar, J.A. Evaluation of microstructure and texture across the welded interface of super duplex stainless steel and high strength low alloy steel. Surf. Coat. Technol. 2015, 264, 150–162. [Google Scholar] [CrossRef]
  34. Furuhara, T.; Maki, T. Variant selection in heterogeneous nucleation on defects in diffusional phase transformation and precipitation. Mater. Sci. Eng. A 2001, 312, 145–154. [Google Scholar] [CrossRef]
  35. Bernardi, H.H.; Sandim, H.R.Z.; Zilnyk, K.D.; Verlinden, B.; Raabe, D. Microstructural stability of a niobium single crystal deformed by equal channel angular pressing. Mater. Res. 2017, 20, 1238–1247. [Google Scholar] [CrossRef] [Green Version]
  36. Saraf, L. Kernel average misorientation confidence index correlation from FIB sliced Ni-Fe-Cr alloy surface. Microsc. Microanal. 2011, 17, 424–425. [Google Scholar] [CrossRef] [Green Version]
  37. Tayon, W.; Crooks, R.; Domack, M.; Wagner, J.; Elmustafa, A.A. EBSD study of delamination fracture in Al–Li alloy 2090. Exp. Mech. 2008, 50, 135–143. [Google Scholar] [CrossRef]
  38. Calcagnotto, M.; Ponge, D.; Demir, E.; Raabe, D. Orientation gradients and geometrically necessary dislocations in ultrafine grained dual-phase steels studied by 2D and 3D EBSD. Mater. Sci. Eng. A 2010, 527, 2738–2746. [Google Scholar] [CrossRef]
  39. Fujiyama, K.; Mori, K.; Matsunaga, T.; Kimachi, H.; Saito, T.; Hino, T.; Ishii, R. Creep-damage assessment of high chromium heat resistant steels and weldments. Mater. Sci. Eng. A 2009, 510, 195–201. [Google Scholar] [CrossRef]
  40. Li, H.; Hsu, E.; Szpunar, J.; Utsunomiya, H.; Sakai, T. Deformation mechanism and texture and microstructure evolution during high-speed rolling of AZ31B Mg sheets. J. Mater. Sci. 2008, 43, 7148–7156. [Google Scholar] [CrossRef]
  41. Choi, J.Y.; Ji, J.H.; Hwang, S.W.; Park, K.-T. TRIP aided deformation of a near-Ni-free, Mn–N bearing duplex stainless steel. Mater. Sci. Eng. A 2012, 535, 32–39. [Google Scholar] [CrossRef]
  42. Wright, S.I.; Nowell, M.M.; De Kloe, R.; Chan, L. Orientation precision of electron backscatter diffraction measurements near grain boundaries. Microsc. Microanal. 2014, 20, 852–863. [Google Scholar] [CrossRef] [PubMed]
  43. Braga, F.V.; Escobar, D.P.; De Oliveira, N.J.L.; Andrade, M.S. Hot deformation behavior of a ferritic stainless steel stabilized with Nb during hot rolling simulation at different temperature ranges. J. Mater. Res. 2016, 31, 635–645. [Google Scholar] [CrossRef]
  44. Lin, H.P.; Chen, D.; Kuo, J.C. Grain Boundary Evolution of Cold-Rolled FePd Alloy during Recrystallization at Disordering Temperature. Materials 2015, 8, 3254–3267. [Google Scholar] [CrossRef] [Green Version]
  45. Lin, H.P.; Chen, Y.C.; Chen, D.; Kuo, J.C. Effect of cold deformation on the recrystallization behavior of FePd alloy at the ordering temperature using electron backscatter diffraction. Mater. Charact. 2014, 94, 138–148. [Google Scholar] [CrossRef]
  46. Sato, Y.S.; Kokawa, H. Preferential precipitation site of sigma phase in duplex stainless steel weld metal. Scr. Mater. 1999, 40, 659–663. [Google Scholar] [CrossRef]
  47. Shockley, J.M.; Horton, D.J.; Wahl, K. Effect of aging of 2507 super duplex stainless steel on sliding tribocorrosion in chloride solution. Wear 2017, 380, 251–259. [Google Scholar] [CrossRef]
  48. Villanueva, D.M.E.; Junior, F.C.P.; Plaut, R.L.; Padilha, A.F. Comparative study on sigma phase precipitation of three types of stainless steels: Austenitic, superferritic and duplex. Mater. Sci. Technol. 2006, 22, 1098–1104. [Google Scholar] [CrossRef]
  49. Maetz, J.Y.; Cazottes, S.; Verdu, C.; Kleber, X. Precipitation and phase transformations in 2101 lean duplex stainless steel during isothermal aging. Met. Mater. Trans. A 2015, 47, 239–253. [Google Scholar] [CrossRef]
  50. Sahay, S.S.; Joshi, K.B. Heating rate effects during non-isothermal annealing of AlK steel. J. Mater. Eng. Perform. 2003, 12, 157–164. [Google Scholar] [CrossRef]
  51. Nye, J. Some geometrical relations in dislocated crystals. Acta Met. 1953, 1, 153–162. [Google Scholar] [CrossRef]
  52. Ashby, M.F. The deformation of plastically non-homogeneous materials. Philos. Mag. 1970, 21, 399–424. [Google Scholar] [CrossRef]
Figure 1. Schematic illustration of the cyclic thermal process. Modified according to [24].
Crystals 10 00962 g001
Figure 2. Various phase fractions versus temperature in SAF 2507 super duplex stainless steel predicted by Thermo-Calc.
Crystals 10 00962 g002
Figure 3. Analysis of X-ray diffraction patterns for various thermal cycling processes.
Crystals 10 00962 g003
Figure 4. Schematic illustration of the thermodynamic equilibrium and phase transformation mechanism. (Note that ● represents the γ:δ volume ratio of as-received material in metallographic analysis).
Crystals 10 00962 g004
Figure 5. (a) Grain size variation of various phases versus the number of thermal cycles; (b) electron backscatter diffraction (EBSD) images for phase identification.
Crystals 10 00962 g005
Figure 6. Distribution of grain boundary misorientation angles at different thermal cycles for (a) δ phase; (b) γ phase; (c) the condition of 2SS + 20 cycles; (d) a statistical histogram of delta ferrite grain boundary angle classification.
Crystals 10 00962 g006
Figure 7. Kernel average misorientation (KAM) for different thermal cycles at (a) as-received; (b) 2SS; (c) 2SS + 3 cycles; (d) 2SS + 7 cycles; (e) 2SS + 13 cycles; (f) 2SS + 20 cycles.
Crystals 10 00962 g007
Figure 8. The grain most frequent orientations of δ varied unstably with the increased cycle numbers from <001> and <111> in (a) → <001> and <113> in (b) → <101> and <111> in (c) → <111> in (d) → some <112> → <001> in (e) → random with a few <111> in (f).
Crystals 10 00962 g008
Figure 9. The grain most frequent orientation of γ was relatively stable at <315> orientation close to <101> under different thermal cycles from (b) to (f), except the random distribution for as-received.
Crystals 10 00962 g009
Figure 10. (a) Comparison of grain size distribution for the γ and δ phases under thermal cycles at 2SS and 2SS + 20 cycles; (b) EBSD images for twin boundaries depicted with green lines, the δ, γ and σ phases at 2SS + 20 cycles.
Crystals 10 00962 g010
Table 1. Chemical composition of super duplex stainless steel (DSS) SAF 2507 (wt. %) by Glow Discharge Spectrometer.
CCrNiMoMnSiCuNPFe
0.0124.86.253.740.620.430.330.2430.02Bal.
Publisher’s Note: MDPI stays neutral with regard to jurisdictional claims in published maps and institutional affiliations.

