Article

Bridging the Gap between Bulk Compression and Indentation Test on Room-Temperature Plasticity in Oxides: Case Study on SrTiO3

1
Department of Materials and Earth Sciences, Technical University of Darmstadt, 64287 Darmstadt, Germany
2
Department of Materials Physics, Nagoya University, Furo-cho, Chikusa-ku, Nagoya 464-8603, Japan
3
PRESTO, Japan Science and Technology Agency (JST), 7, Gobancho, Chiyoda-ku, Tokyo 102-0076, Japan
*
Authors to whom correspondence should be addressed.
Equal Contribution.
Crystals 2020, 10(10), 933; https://doi.org/10.3390/cryst10100933
Submission received: 19 September 2020 / Revised: 8 October 2020 / Accepted: 12 October 2020 / Published: 14 October 2020
(This article belongs to the Special Issue Crystal Plasticity)

Abstract

:
Dislocation-based functionalities in inorganic ceramics and semiconductors are drawing increasing attention, contrasting the conventional belief that the majority of ceramic materials are brittle at room temperature. Understanding the dislocation behavior in ceramics and advanced semiconducting materials is therefore critical for the mechanical reliability of such materials and devices designed for harvesting the dislocation-based functionalities. Here we compare the mechanical testing between indentation at nano-/microscale and bulk uniaxial deformation at macroscale and highlight the dislocation plasticity in single crystal SrTiO3, a model perovskite. The similarities and differences as well as the advantages and limitations of both testing protocols are discussed based on the experimental outcome of the crystal plasticity, with a focus on the pre-existing defect population being probed with different volumes across the length scales (“size effect”). We expect this work to pave the road for studying dislocation-based plasticity in various advanced functional ceramics and semiconductors.

Graphical Abstract

1. Introduction

Dislocations, one-dimensional line defects, are one of the major carriers of plastic deformation in crystalline materials. There has been increasing attention on dislocation-based functionality in ceramic materials in recent years [1,2,3,4,5,6,7], albeit the common belief is that the majority of ceramic materials are brittle. In fact, a substantial number of ceramics and semiconductors (single crystal) can be deformed plastically by dislocations at room temperature [8,9,10,11,12,13,14]. Dislocations are, in nature, crystalline imperfections that may impact the mechanical properties of the materials and devices; therefore, understanding the dislocation-based mechanics in such materials is critical for assessing their mechanical reliability. As many applications are processed, used or stored at room temperature, this work will mainly focus on the dislocation behaviors at room temperature.
In general, there are three endeavors being made to introduce dislocations into ceramics. First, dislocations can be produced in a well-arranged manner by interface method via direct bonding like the bi-crystal technique [15,16,17,18]. Another approach is via novel processing techniques such as thin film growth method using plasma-assisted molecular beam epitaxy [4], spark plasma sintering [19], and flash sintering [20], with the latter two methods focusing on bulk materials. The third approach is by mechanical deformation, where most of the efforts have been made at high temperatures [2,7,12,21,22], while for room temperature study, “ductile” ceramics [9,10,12,23,24,25,26,27] have been of particular interest due to their capability of dislocation-mediated plastic deformation. To be more specific, mechanical deformation can be further divided into bulk deformation and micro-/nanoscale (e.g., indentation) testing, with the latter rising rapidly in recent years. The wide range of length scales covered by such testing methods is compatible with the application of the materials and devices spanning from macroscale centimeter size to micro-/nanoscale in MEMS and NEMS (micro and nanoelectromechanical systems).
Bulk deformation has been very often used for high-temperature deformation for ceramics with thermal activation of dislocation mobility, while for room-temperature tests, the focus was mainly on “ductile” ceramics such as SrTiO3 [11,23,28,29], KNbO3 [30], MgO [8], and ZnS [12,14]. The large volume that is probed in bulk tests also gives a much higher chance of encountering the effect of the pre-existing defects such as dislocation, micro-cracks, etc. In addition, due to the limited slip systems in ceramic materials, deforming polycrystalline ceramics is only possible at elevated temperatures and is therefore out of the scope of this work. Bulk deformation on single crystals is demanding and less cost-effective due to the standing challenge for fabricating high-purity bulk single crystals of most advanced materials; hence bulk tests find limitation in investigating the dislocation behaviors of the majority of advanced functional ceramics. Yet, it offers attractive perspectives such as generating well-aligned dislocation arrays to serve functionality evaluation [1,21,22].
On the other hand, in compatibility with the ever-decreasing scale of many functional devices and materials, nano-/micromechanical methods [31] are becoming much more applicable and feasible. Among which, (nano-)indentation method is seen as a highly versatile, high-throughput and cost-effective method [32,33], because the probed volume can be varied easily over many orders of magnitude, e.g., in the range of 10−3 µm3 to 104 µm3 when selecting readily available tip radii between 90 nm and 25 µm [27]. The onset of dislocation activities in indentation is indicated by the “pop-in” event (a sudden excursion of the displacement at nominally constant load), which is usually seen as the signal for incipient plasticity, namely, the onset of plastic deformation. In addition, the highly confined volume being probed using such methods very often is defect-free or with very low defect density. Hence the material may behave differently in comparison to the bulk tests. A well-known phenomenon based on such size effect is termed as “smaller is stronger” [34]. Such a small scale method greatly favors the site-specific investigation, yet it may also find its limitation in the study of dislocation-based functionality due to the very local probed region in sub-micrometer regime.
The comparison discussed above clearly shows a highly desired need to bridge the gap between these two methods across the length scales as well as to overcome the shortcomings of each method. The question posed in this work is how to best combine these two methods (bulk and indentation tests) to better understand the dislocation behaviors. To this end, addressing the similarities and differences of the deformation mechanisms obtained in both methods and at both length scales is required.
In this paper, we propose a new experimental protocol for probing the mechanisms of the incipient plasticity in single crystal SrTiO3 at room temperature via combined bulk compression and indentation tests. SrTiO3 is a prototypical perovskite with cubic structure and has been frequently used in various functional devices. It is also a well-known “ductile” ceramic oxide at room temperature as has been discussed before, with the slip system {110}<110> being activated. The stress and strain analyses, the activation of slip planes at macroscale and micro-/nanoscale, and the effect of pre-existing defect density in different tested volumes have been compared. The differences and similarities as well as the advantages and limitations of both methods are compared to shed light on the dislocation-based plasticity to draw a complete deformation picture in SrTiO3.

2. Experimental Method

2.1. Materials

Single crystal SrTiO3 as a model ceramic oxide is used in the current work. The crystals were grown by the Verneuil method from high purity SrTiO3 powder (99.9 wt % and Sr/Ti = 1.04 [13]) and high purity SrCO3 powder (99.99 wt %) and were used for the present study (Shinkosha Co., Ltd., Yokohama, Japan). Samples used for both bulk deformations have a size of 3 mm × 3 mm × 7.5 mm, and for indentation have a size of 2.6 mm × 2.6 mm × 6.5 mm. All sample faces were polished by diamond abrasives and then finished by polishing with colloidal silica. The surface roughness measured by Atomic Force Microscopy (AFM, Veeco, Plainview, NY, USA) is less than 1 nm.

2.2. Mechanical Testing

Uniaxial bulk compression tests were performed on a uniaxial compression machine (Shimadzu Co. Ltd, Kyoto, Japan, AG-10kNX) along the [310] and [001] axis in air at room temperature with a constant strain rate of 1.0 × 10⁻⁵ s−1 and 1.0 × 10⁻¹ s−1, respectively. A camera (Nikon Co. Ltd, Tokyo, Japan, D7200, 60 frames/sec for high strain rate test, and 24 frames/sec for low strain rate test) is used to capture the real-time deformation information such as slip lines formation on the surface of the samples.
Indentation tests were performed in air at room temperature on the (001) surface, which can be chemically etched to reveal the dislocation structures. The continuous stiffness measurement (CSM) technique is used on G200 (Keysight, Santa Rosa, CA, USA), with a constant indentation strain rate of 0.05 s−1. A harmonic displacement oscillation of 2 nm was applied with a frequency of 45 Hz. A Berkovich diamond indenter and spherical diamond indenters with various tip radii (Synton MDP, Nidau, Switzerland) were used for the indentation tests. The machine compliance was first calibrated on fused silica. The effective tip radius, for simplicity, has been determined by fitting the initial elastic portion of the load-displacement curves using Hertzian elastic contact [35] when the indentation depth (here the pop-in depth) is much smaller than the tip radius. For detailed comparison of different fitting methods for tip radii calibration, it has been described elsewhere by Li et al. [36]. For each test condition, 25 indents were performed to ensure reproducibility.

2.3. Characterization

The specimens were chemically etched for ~20 s in 15 mL 50% HNO3 with 16 drops of 50% HF to reveal the dislocation patterns on the surface before and after deformation. Afterwards, the surface and etch pits were characterized using a scanning electron microscope (SEM, TESCAN MIRA3-XMH, Brno, Czech Republic) with an acceleration voltage of 5 kV.

3. Results

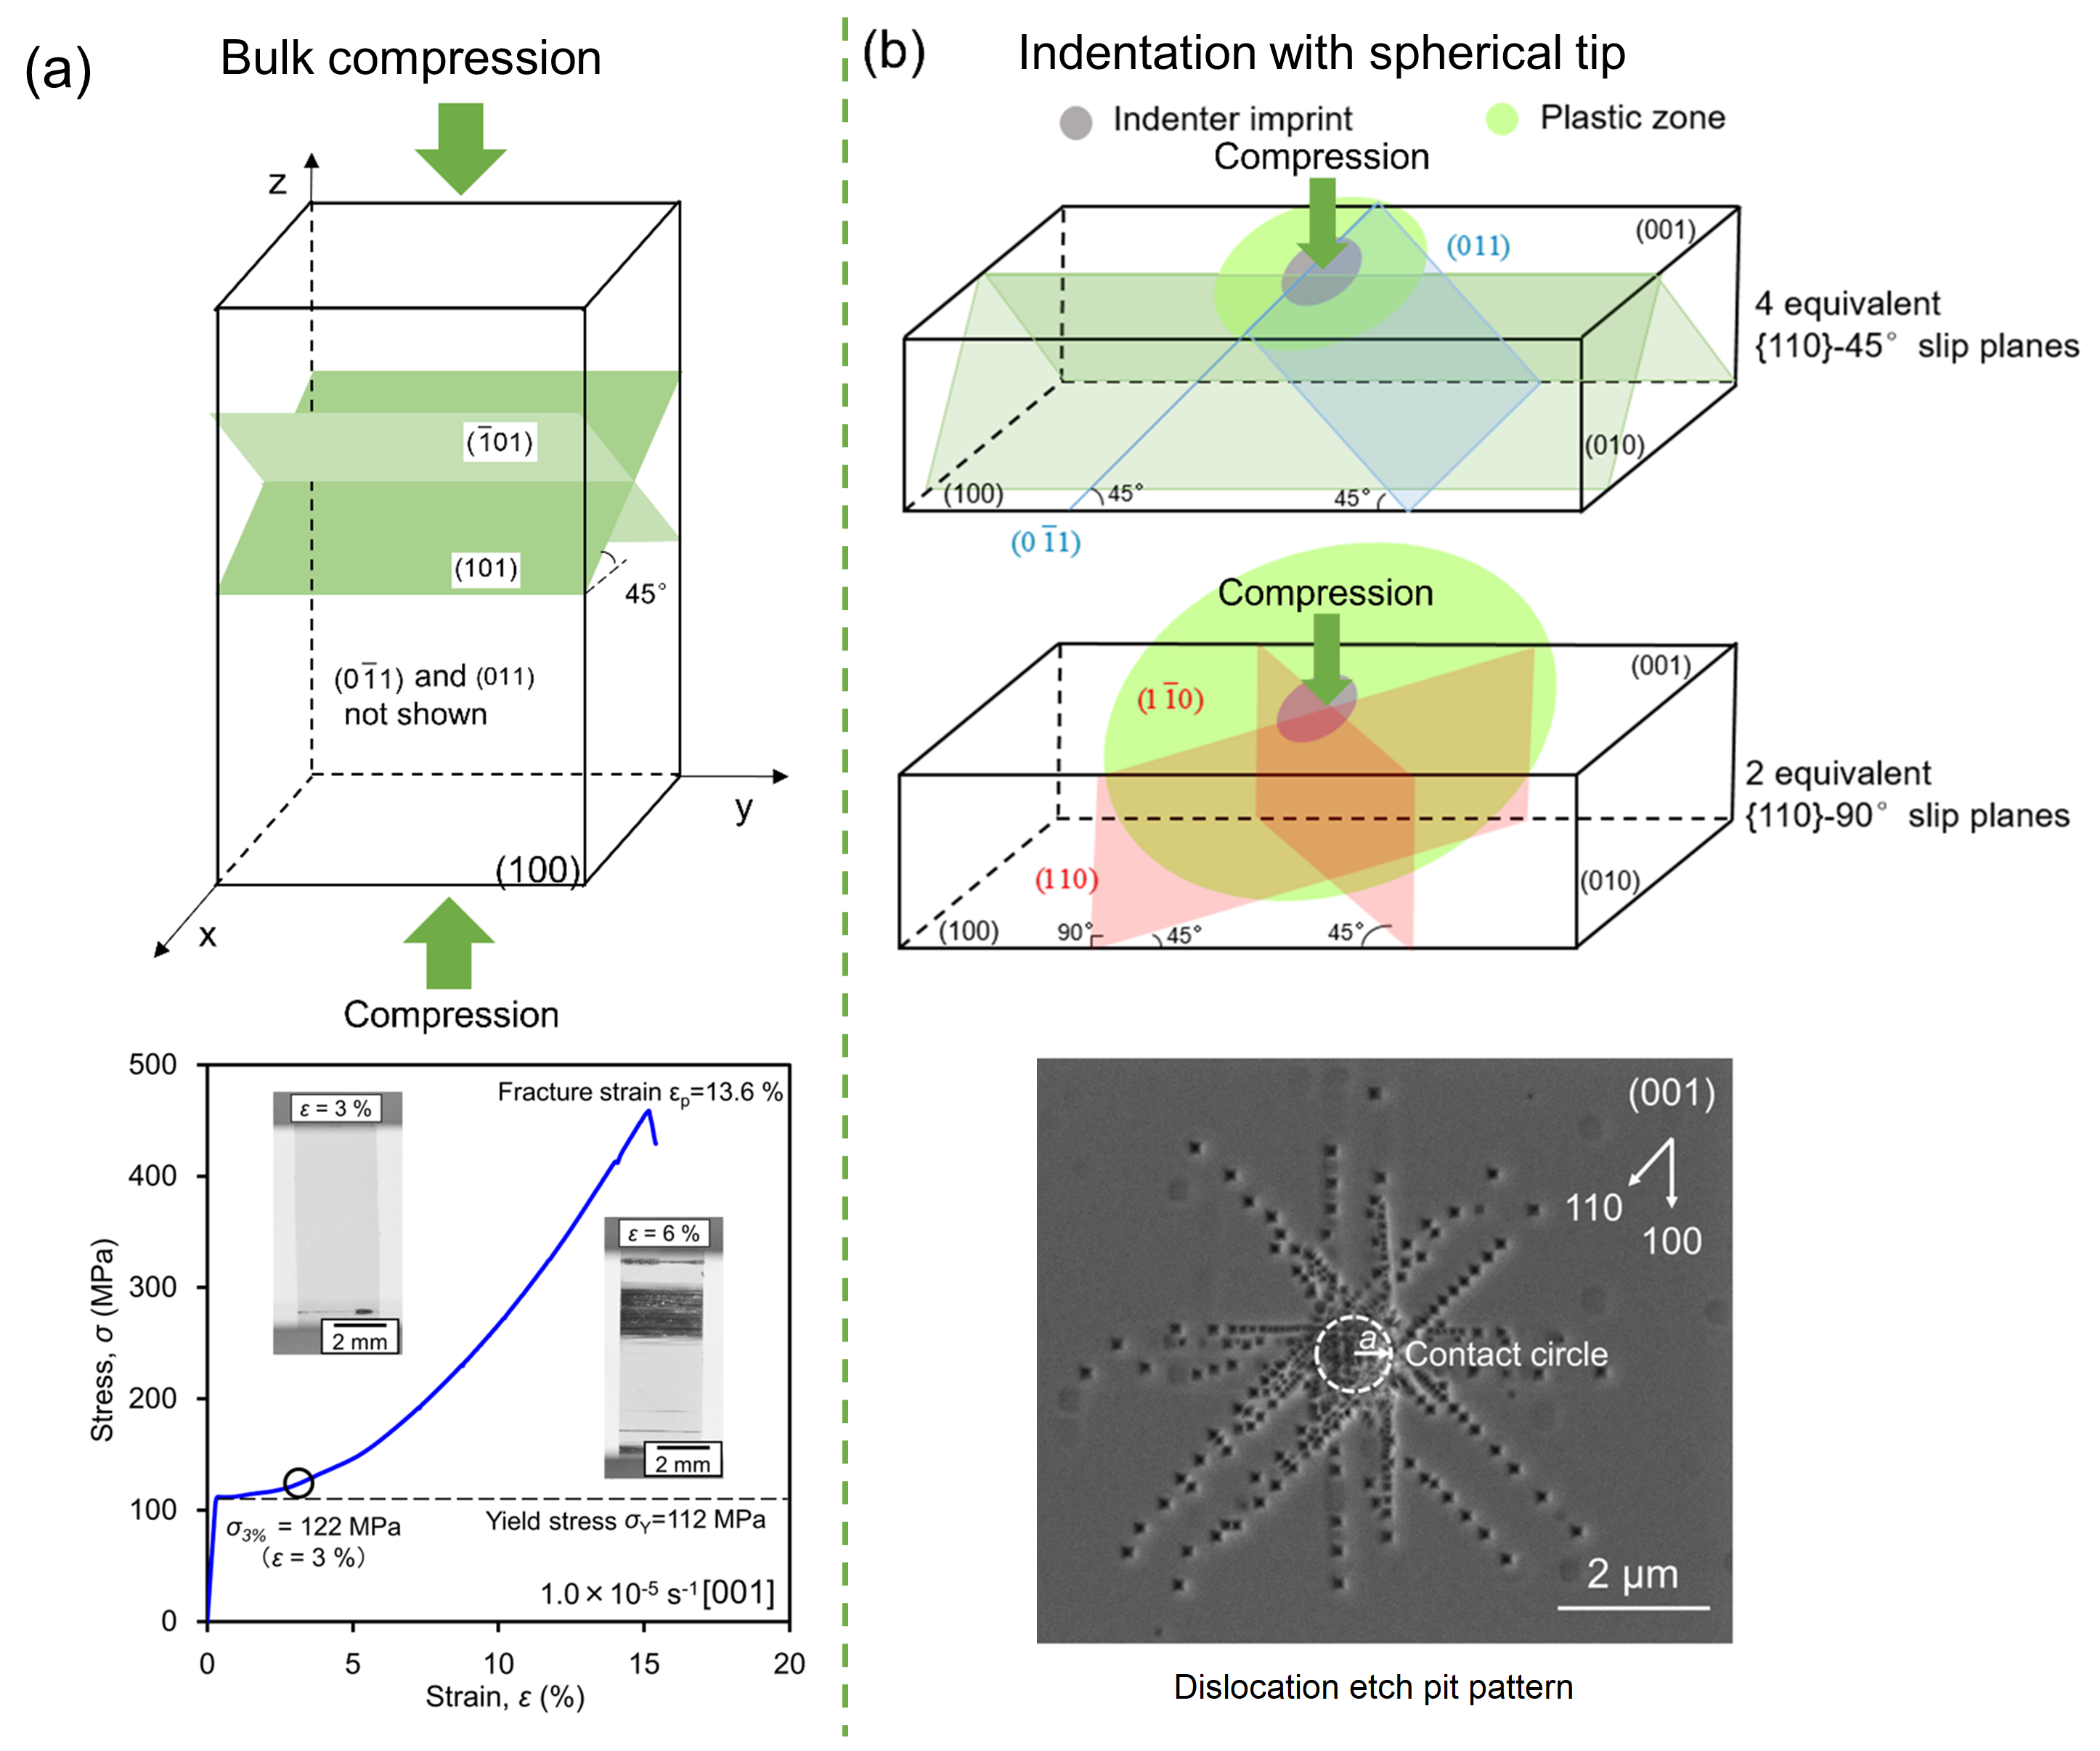
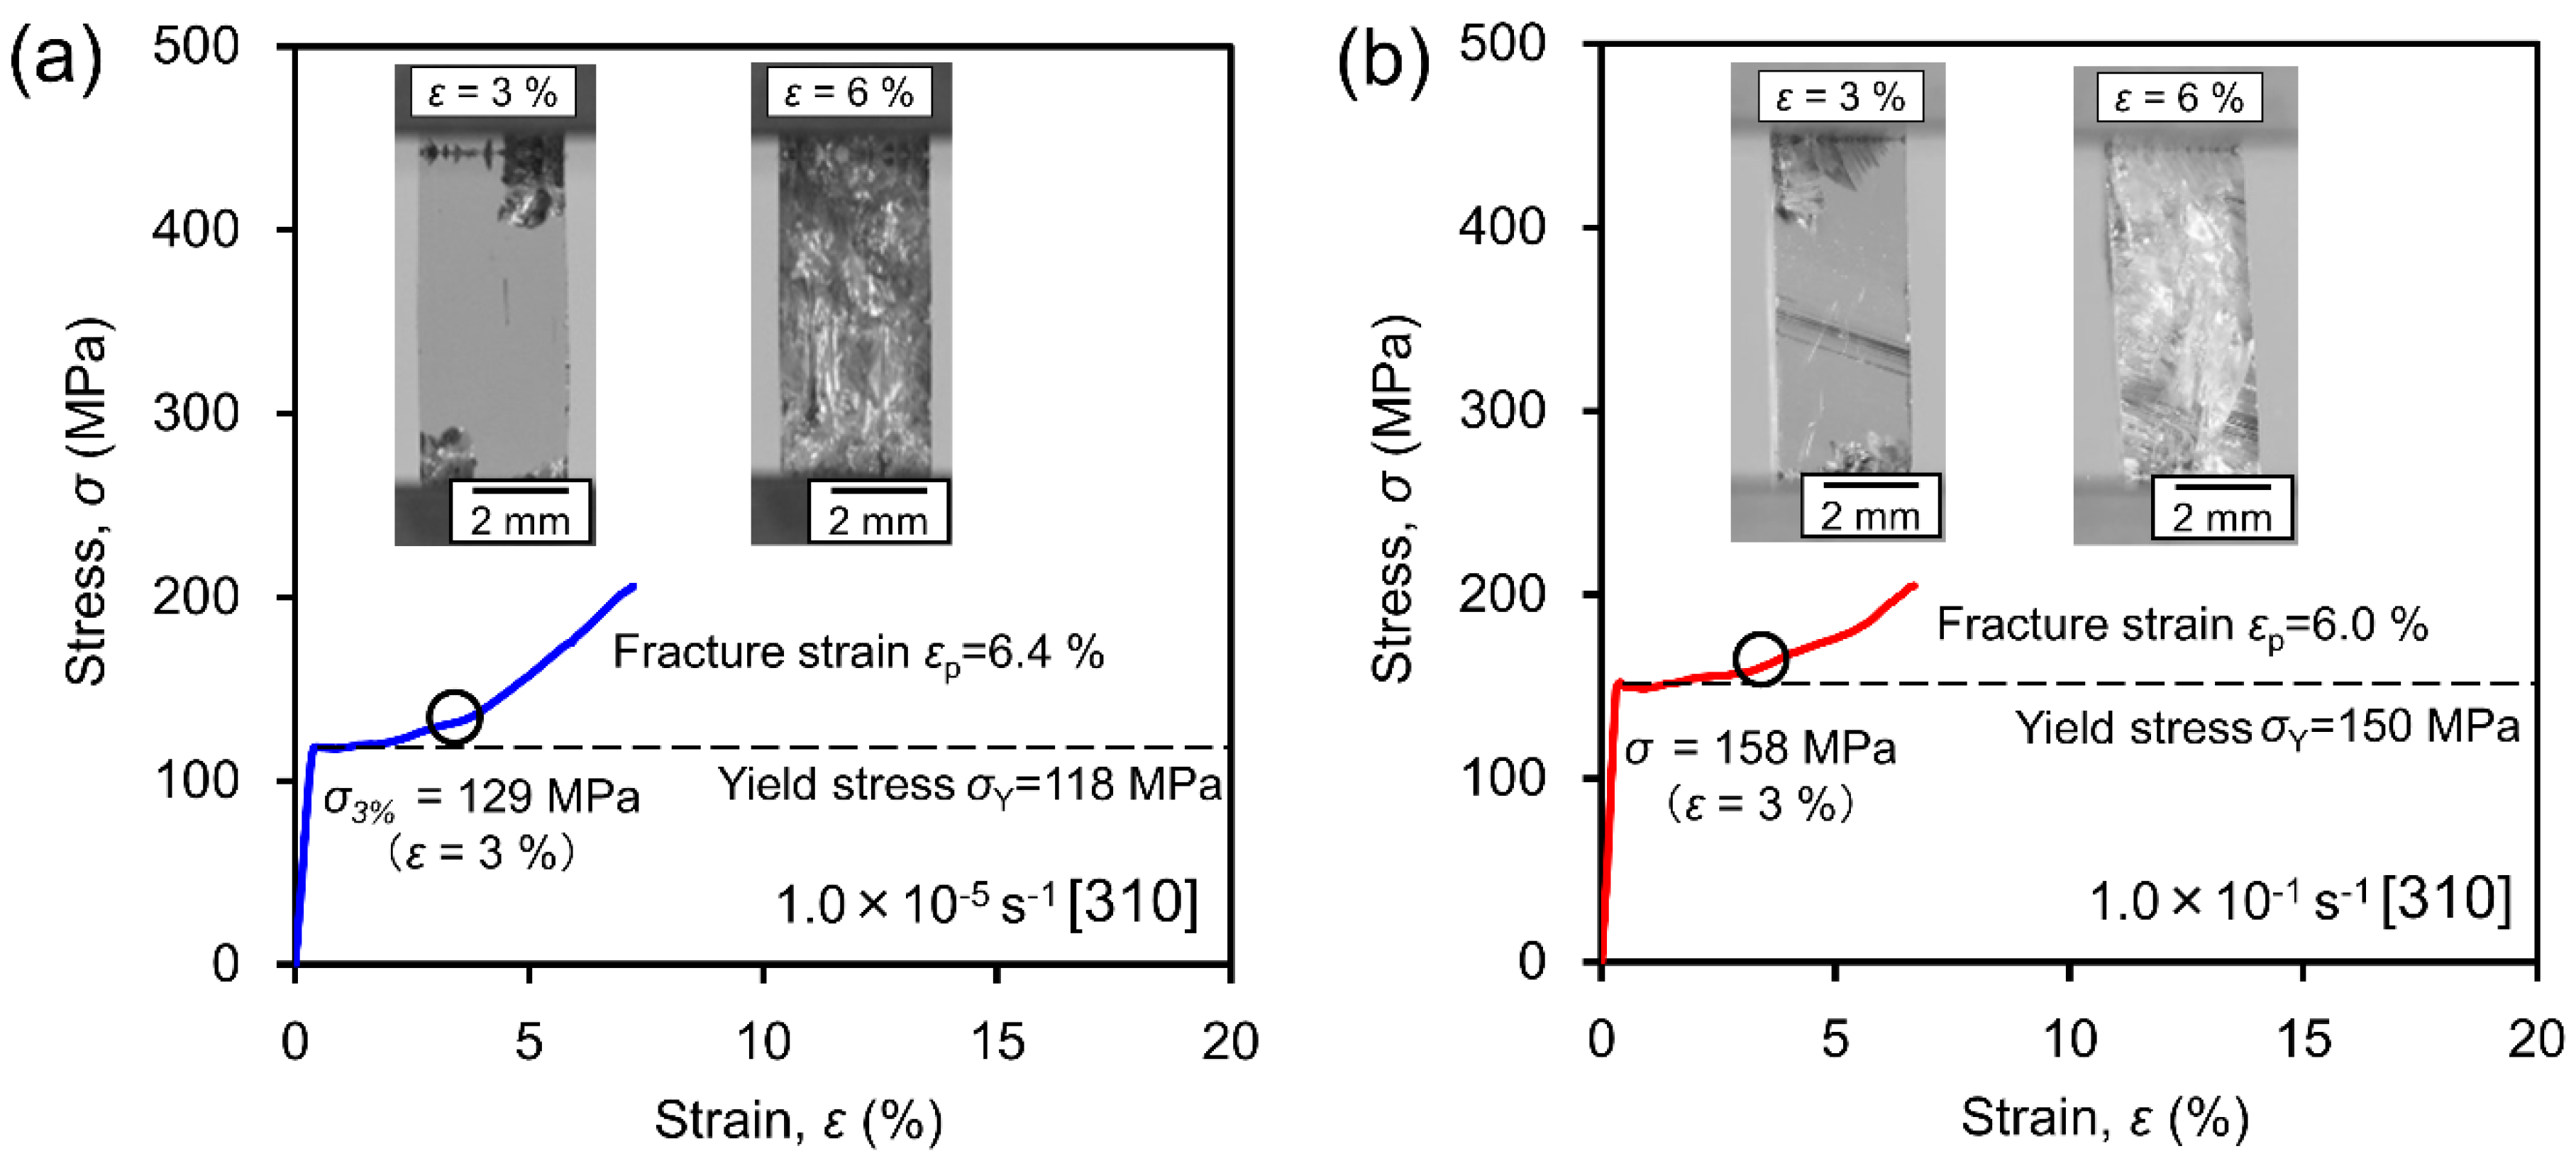
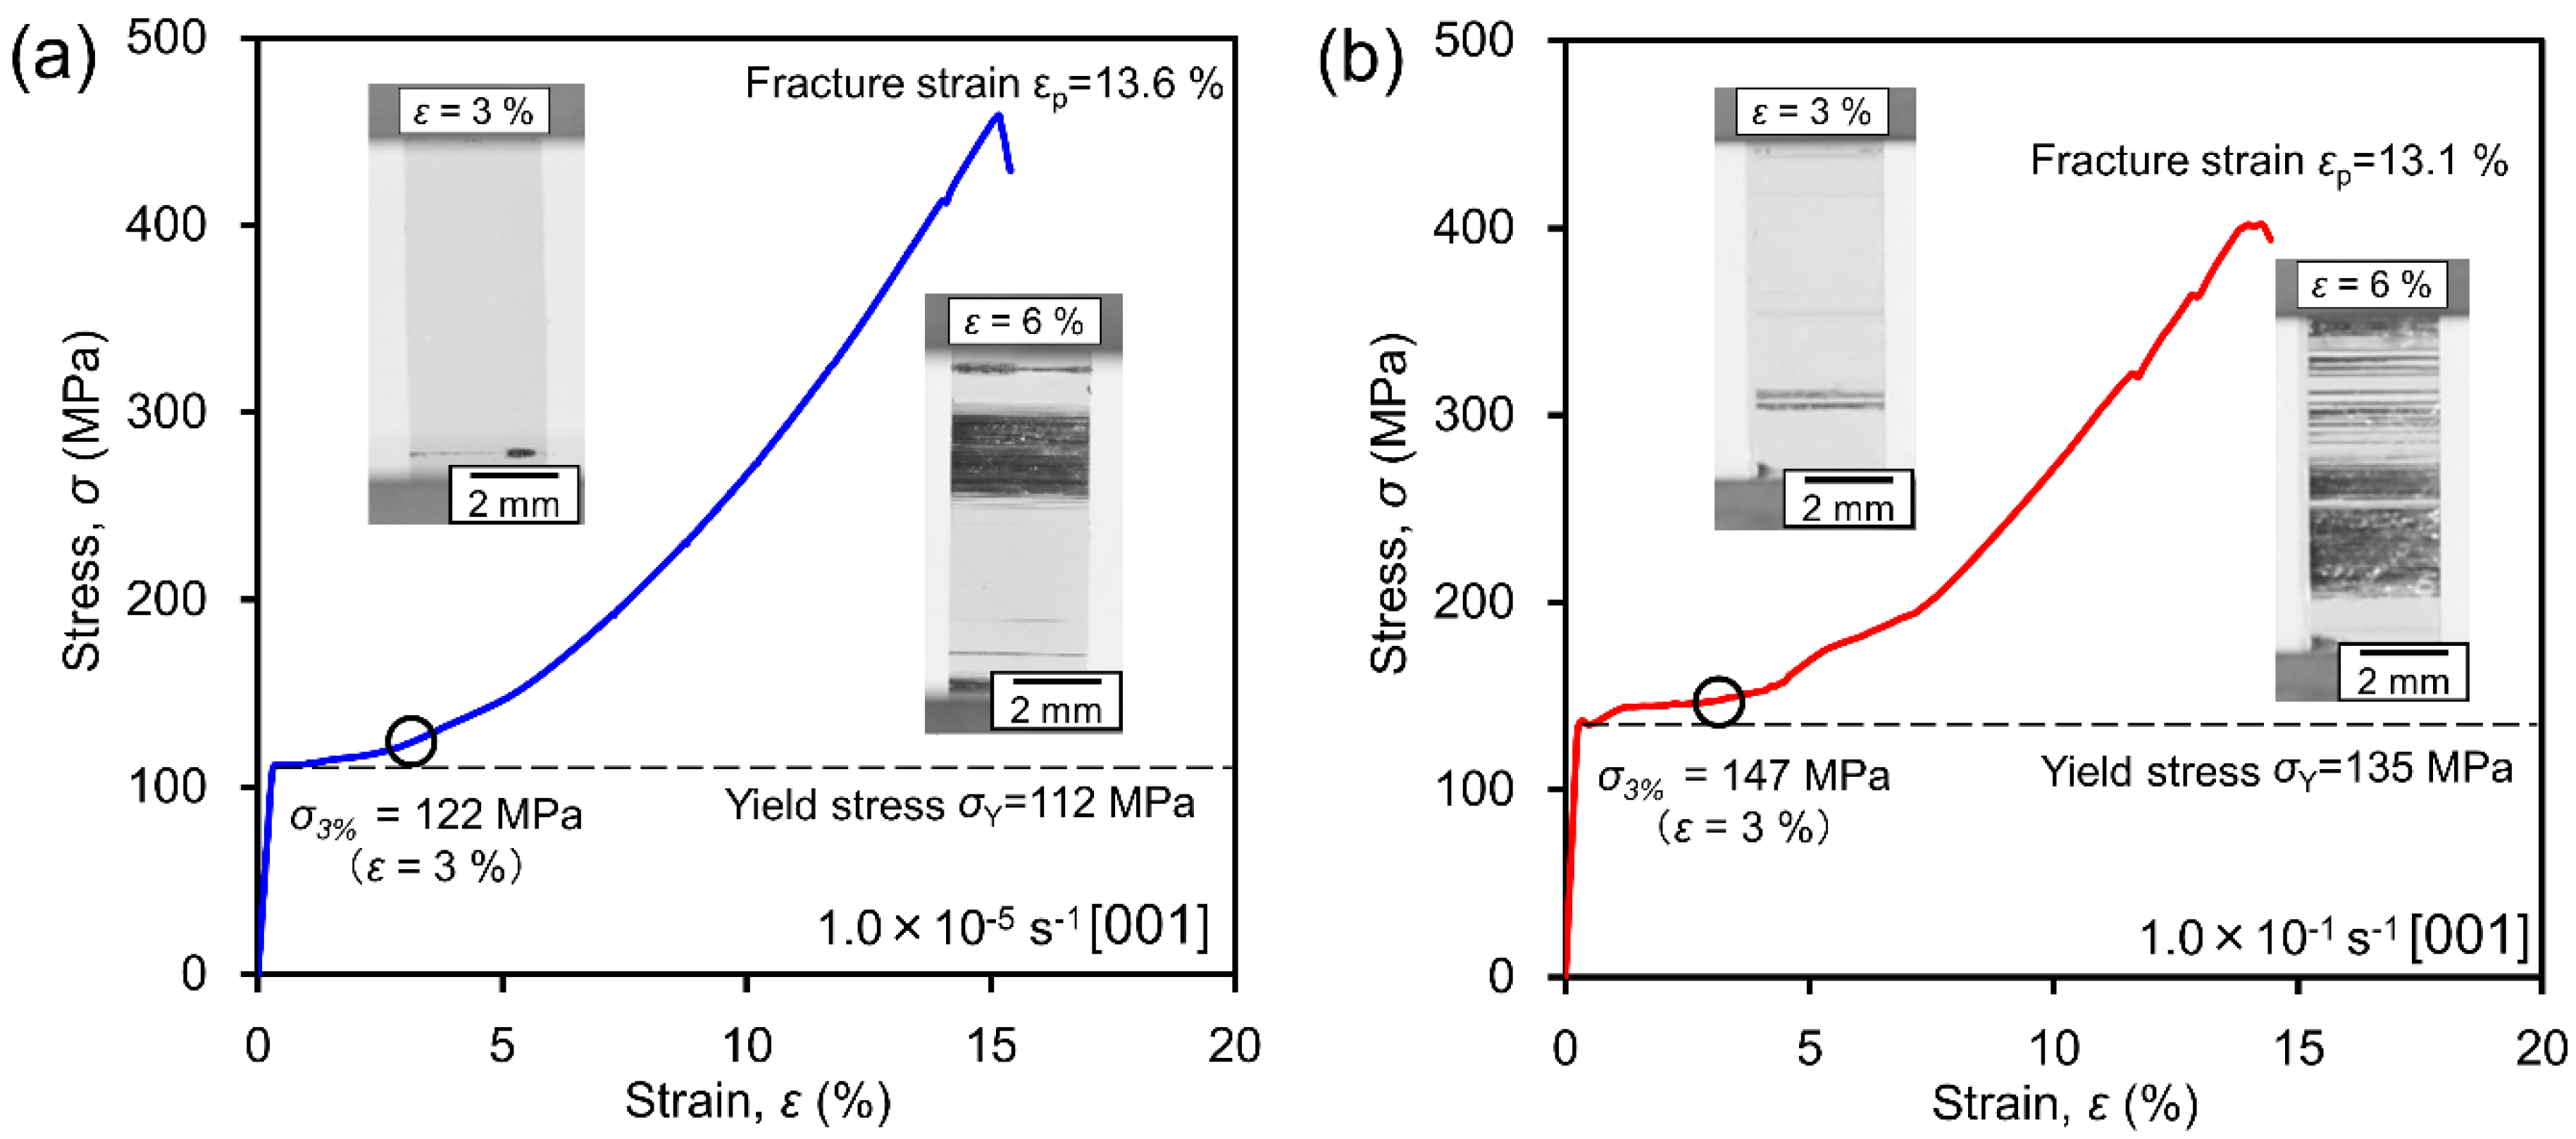
3.1. Bulk Deformation

We begin by presenting the results on samples with a loading axis along the [310] direction. The stress-strain curves in Figure 1 illustrate clearly a linear elastic response of the material deformation prior to the onset of initial yielding (as indicated by the dashed lines), after which the materials deform elasto-plastically. The strain rate effect is evidenced in Figure 1, namely, a higher strain rate leads to a higher yield stress (150 MPa for 1.0 × 10⁻¹ s−1 and 118 MPa for 1.0 × 10⁻⁵ s−1). Meanwhile, the fracture strain is approximately the same and is independent of the strain rate (6.0% for 1.0 × 10⁻¹ s−1 and 6.0% for 1.0 × 10⁻⁵ s−1).
The optical images (insets in Figure 1) demonstrate a few slip lines and some random crack-like features (based on the image contrast and post-mortem examination) inside the crystals. Microcracks, however, contribute only a minor fraction to the overall strain, which is mostly carried by dislocations as long as the cracks are confined locally or predominantly propagate vertically. Even though some cracks may form in the SrTiO3 crystal, which is often inevitable, dislocation-based deformation can continue to a large plastic strain, unless the crystal actually shatters. In addition, the loading direction [310] favors only two slip directions during compression in SrTiO3, whose slip systems at room temperature are {110}<110> (six in total) as reported in bulk compression tests [23,28,29].
In addition, it is evident that in bulk deformation, there is a larger chance of probing pre-existing defects or easily causing local stress concentrations due to the contact issue, which is critical for crack initiation in the majority of ceramic materials with brittle nature, especially for the case of loading in [310] with only one slip direction favored. The crack formation is clearly evidenced by the in situ image captured using a high-speed camera in Figure 1a, where the dark region in the up-right corner indicates localized non-uniform deformation, most likely due to local contact at the sample edge.
The stress-strain curves in Figure 2 correspond to a different loading direction in [001]. Analogous to the results obtained along the [310] direction, a clear linear elastic response and the strain rate effect are observed, namely, a higher strain rate leads to a higher yield stress (135 MPa for 1.0 × 10⁻¹ s−1 and 112 MPa for 1.0 × 10⁻⁵ s−1). The fracture strain again is independent of the strain rate (13.1% for 1.0 × 10⁻¹ s−1 and 13.6% for 1.0 × 10⁻⁵ s−1). However, it is much larger in this case than that shown in Figure 1 along the [310] loading direction, which is less than half of the fracture strain obtained in the [001] loading direction. In addition, the slip patterns can be clearly captured during the deformation along [001] direction, as shown by the parallel black strips, which are perpendicular to the loading directions. This is not surprising based on the calculation of the Schmid factor and the room-temperature slip system in SrTiO3. The plastic deformation therefore is obviously mediated by the slip activation via the motion of pre-existing dislocations and multiplication to general new dislocations, as the homogeneous dislocation nucleation in SrTiO3 would require a shear stress of ~17 GPa (identical to the theoretical strength), which is not occurring in bulk deformation but in nanoindentation with a sharp tip [27]. In comparison to the present result (Figure 2) with only multiple parallel slip lines that are perpendicular to the loading axis, it is interesting to note the different slip patterns observed post-mortem in polarized light microscope [11,23,29], where the 45° intersection of the slip planes was also revealed, which was direct proof for the four equivalent slip planes. A detailed discussion on the deformation mechanisms will be presented later in Section 4.

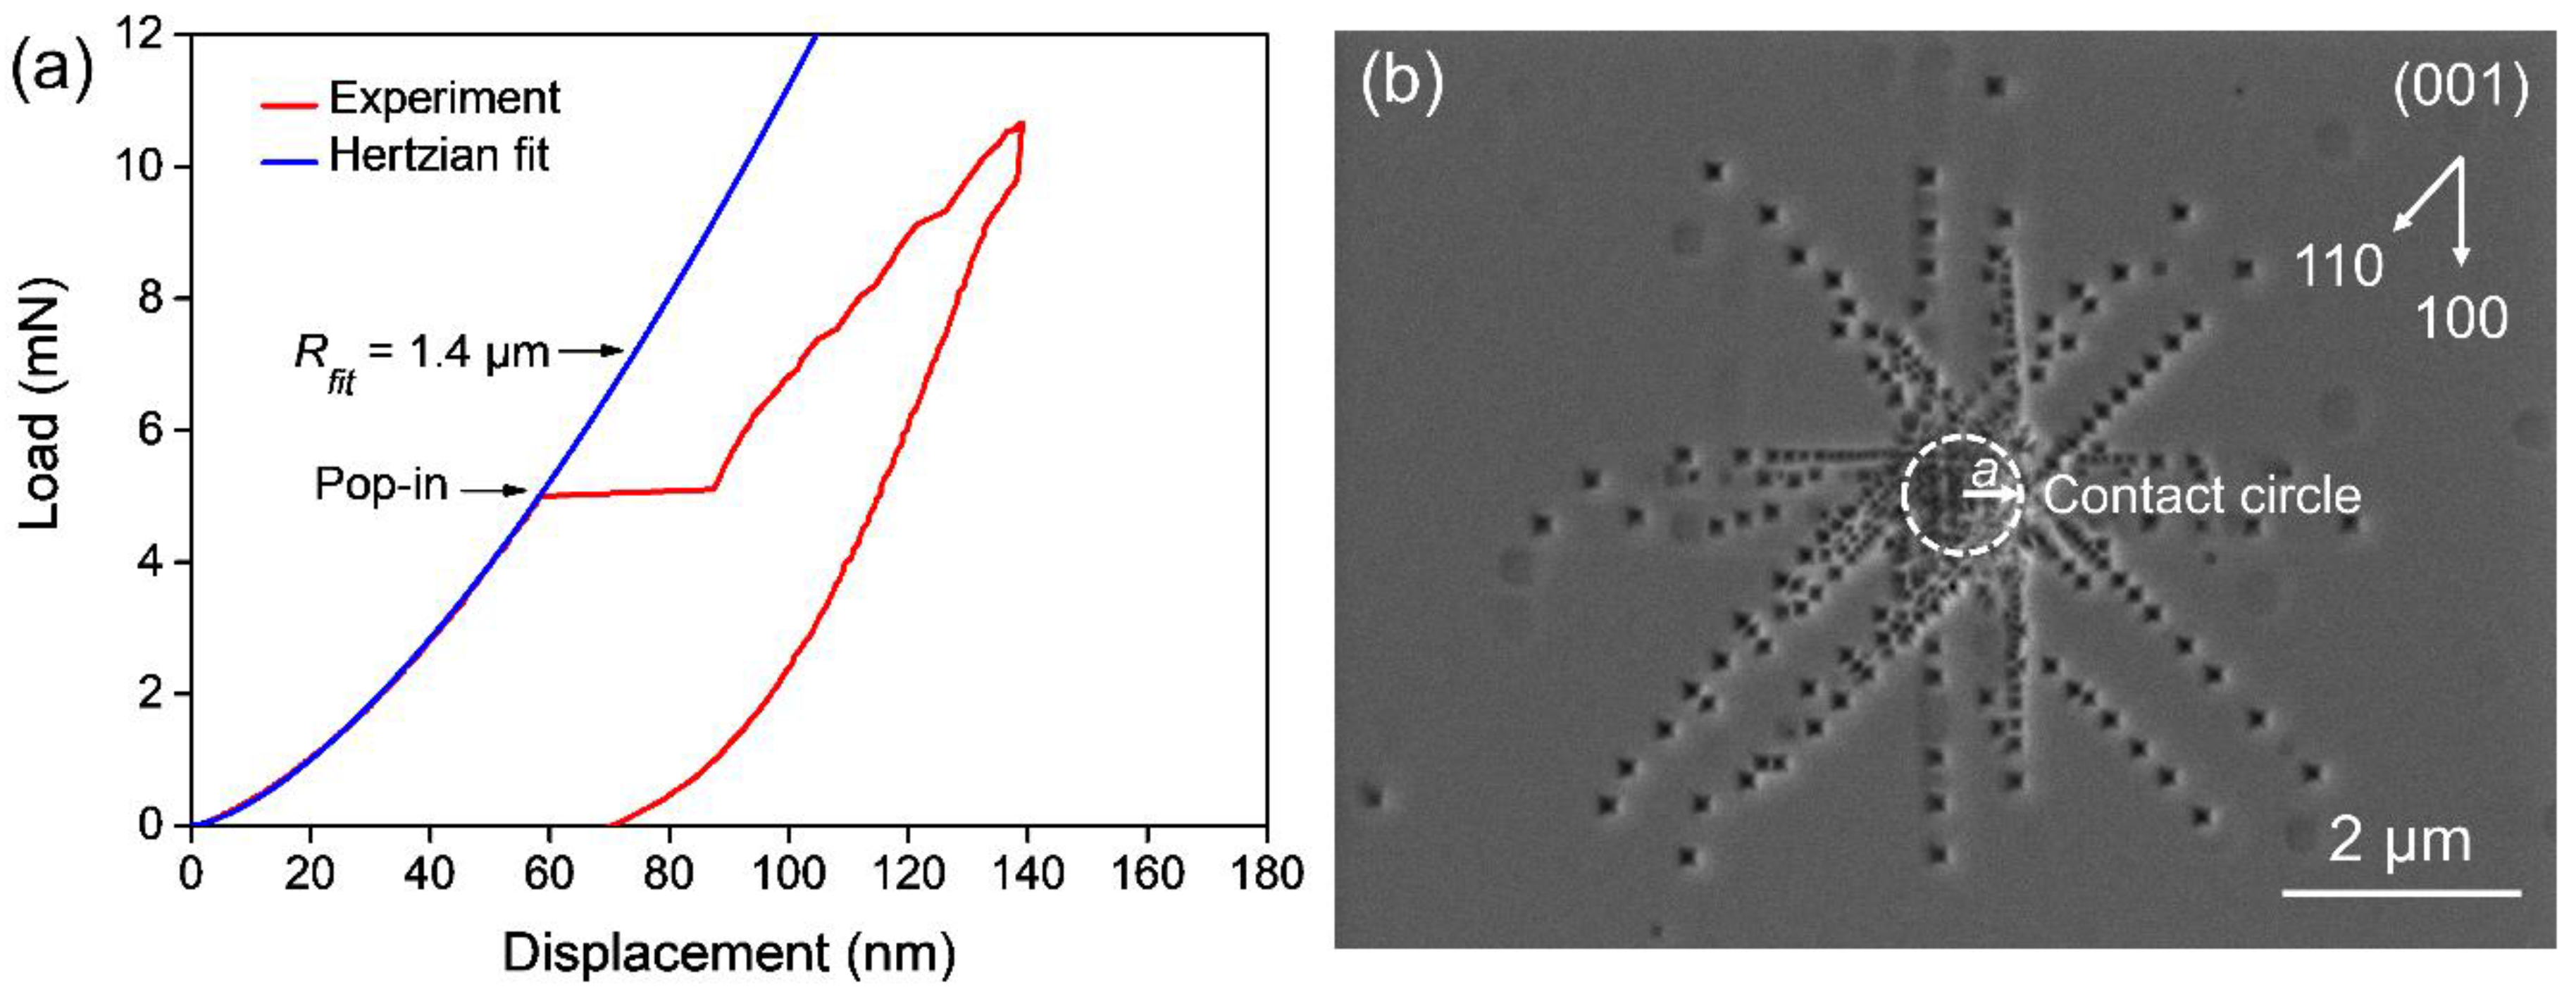
3.2. Indentation Tests

A representative indentation load-displacement curve (red line) is presented in Figure 3a, which clearly depicts the elastic portion (fitted with Hertzian theory, blue line) and the following pop-in event. The pop-in signifies the transition from purely elastic to elasto-plastic deformation, in this case, mediated by the dislocation activation. Here, by dislocation activation it refers to a combination of dislocation nucleation, multiplication and glide motion due to the relatively large tip that was used (Figure 3a, with an effective tip radius of Rfit = 1.4 μm), as revealed by the post-mortem etch pit study and SEM characterization. Strictly speaking, for indentation with larger tips, it remains a great challenge to discern all these three dislocation activities simply based on the load-displacement curve. An in-depth discussion on this point will be presented in Section 4. Note that the indentation depth at pop-in is about 60 nm, which is very small in comparison to the effective tip radius. The corresponding surface etch pits captured by the SEM image in Figure 3b clearly demonstrate the activated slip planes in both <100> and <110> directions, which belong to the {110}-45° planes and {110}-90° planes, respectively. The degrees 45° and 90° indicate the inclined angles between the slip planes and the indented (001) plane, as schematically illustrated in Figure 4.
It is noted that due to the higher confinement of deformation in the indentation test, the crack formation, if there were any, can be better suppressed especially for a small indenter tip, e.g., sharp Berkovich tip at small load [37], under which the maximum shear stress easily reaches the shear strength prior to the fracture strength, was achieved, and thus dislocation nucleation is promoted [27,37].

4. Analyses and Discussions

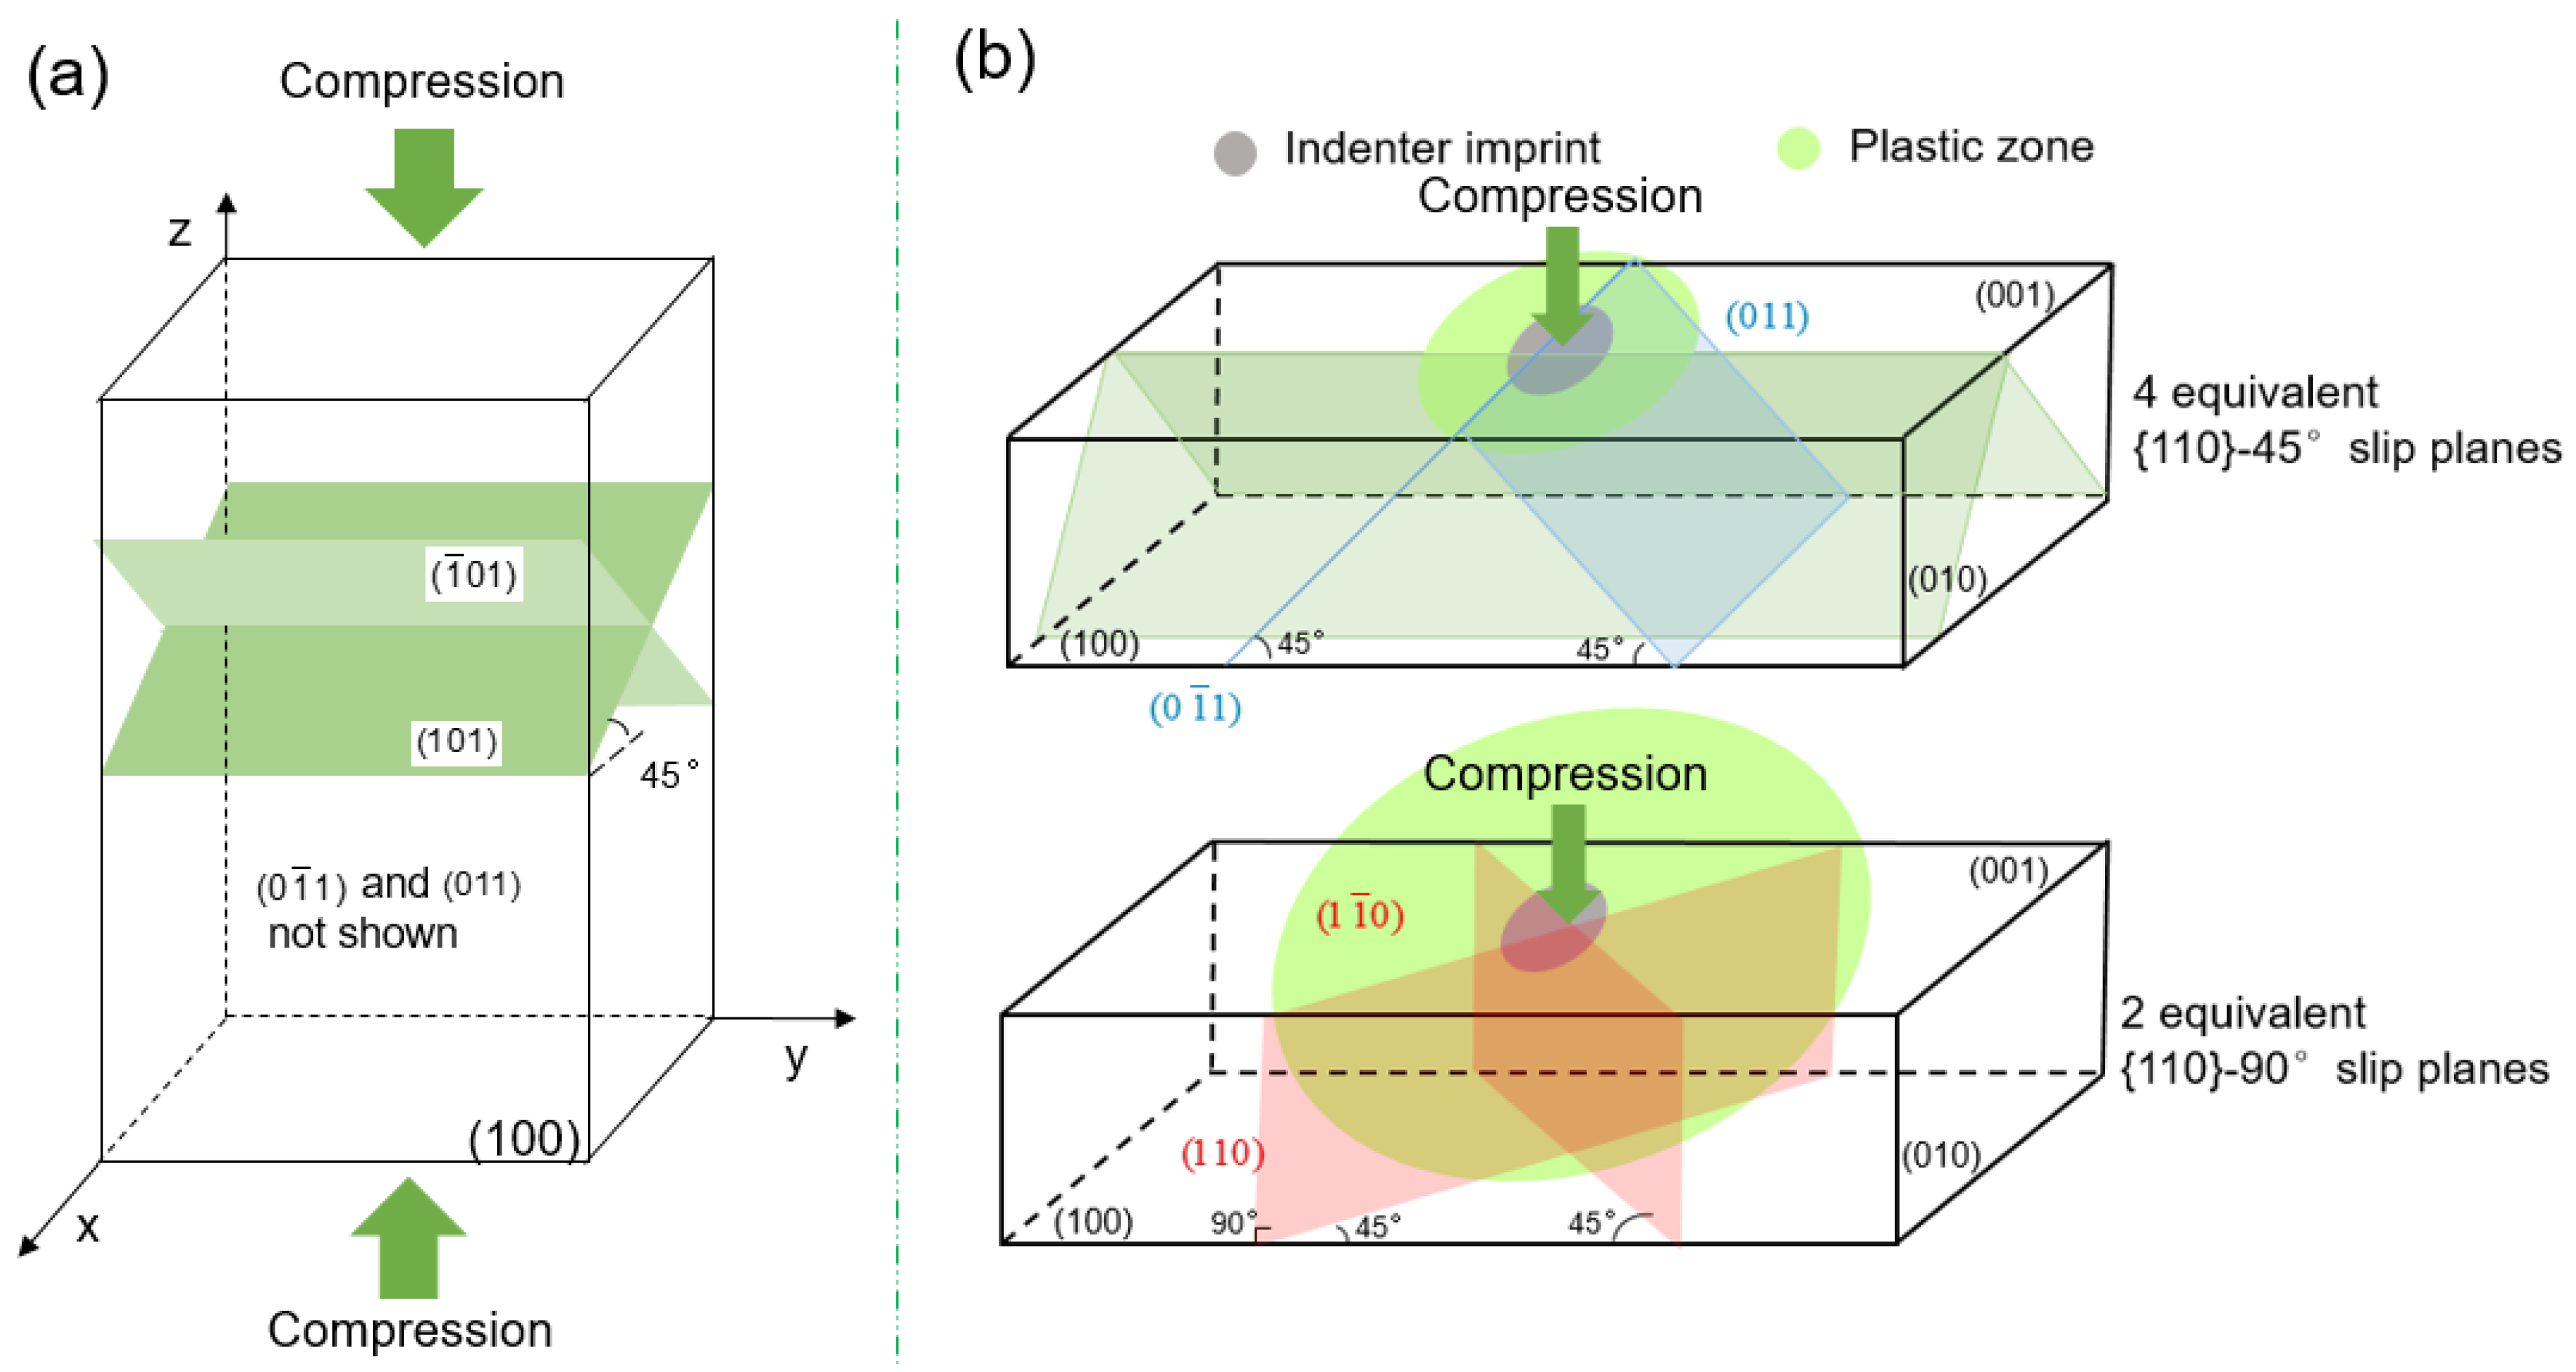
4.1. Stress Comparison and Activation of the Slip Systems

In order to compare the similarities and differences in the dislocation-mediated plasticity, we first compare the slip systems that can be activated during deformation. For simplicity, we consider in both tests the loading direction along the [001] direction. In bulk deformation illustrated in Figure 4a, only two representative slip planes are presented while there are four equivalent slip planes (all of which are inclined 45° to the [001] loading direction) that can be activated. Contrasting the bulk deformation, two additional slip planes that are 90° inclined to the surface can be activated (two red planes in Figure 4b) during indentation due to the non-zero resolved shear stress on these two planes. A detailed analysis is presented later. These additionally activated slip planes comprise one of the major differences between the bulk uniaxial deformation and the indentation tests.
The onset of the plastic deformation can be correlated to dislocation nucleation, multiplication and glide motion at room temperature. Homogeneous dislocation nucleation in a perfect crystal requires that the maximum shear stress reaches the theoretical shear strength, which is about G/2π, with G being the shear modulus. Heterogeneous dislocation nucleation (i.e., dislocation nucleation from pre-existing defects), dislocation multiplication and dislocation glide motion can be activated at a much lower stress as in the case of bulk deformation.
The different stress distribution as well as the stress states in bulk and indentation deformation result in different mechanical responses with respect to the slip plane activation shown in Figure 4. In uniaxial bulk compression, the maximum shear stress is expressed with respect to the normal stress by τ max b u l k = σ u n i a x i a l 2 , with σ u n i a x i a l being the uniaxial stress along the compression direction. In the case of loading in [001] direction (with a Schmid factor of 0.5), the maximum shear stress in bulk compression, in an ideal case, lies along the 45° planes inclined to the [001] loading direction and is equal to the critically resolved shear stress τ C R S S b u l k , as has been validated by Patterson et al. [29].
In indentation, the maximum shear stress is τ max i n d e n t = 0.31 ( 6 E r 2 π 3 R 2 P p o p i n ) 1 / 3 [35]. Here, R is the effective tip radius, and Ppop−in corresponds to the load at the onset of the first pop-in (the elastic limit). The reduced modulus E r is calculated from the elastic constants of the indenter and the specimen by 1 E r = 1 v i 2 E i + 1 v s 2 E s . With E i = 1140 GPa and v i = 0.07 for the diamond tip, E s = 264 GPa and v s = 0.237 for SrTiO3 [29], it gives Er = 224 GPa. Following Swain et al. [38], the resolved maximum shear stress on the {110}-45° slip planes is of 0.46 p0 (with p0 being the mean pressure) at the position of about 0.5 a (a is the contact radius) beneath the indentation surface along the central axis, while the resolved maximum shear stress on the {110}-90° slip planes is 0.33 p0 at a position approximately 0.5 a directly below the circle of the contact. Hence, the activation of the {110}-45° slip planes occurs prior to the {110}-90° slip planes [39], and the dislocations on the {110}-90° slip planes are all initiated from the edge of the contact circle and travel away from the indenter in <110> direction, as illustrated in Figure 3b.
For comparison, the τ C R S S b u l k is the stress for dislocation glide in bulk deformation and should be close to the lattice friction stress, τ f , at the yield of plastic deformation (incipient plasticity in bulk), where the effect of dislocation-dislocation hardening (in later stage with large strain) does not need to be regarded due to a very low dislocation density at this stage in single crystal [29]. In indentation, however, the friction stress τ f must not be correlated to the resolved maximum shear stress at pop-in (as it correlates mainly to dislocation nucleation, being either homogeneous or heterogeneous), but rather can be estimated from the dislocation pile-ups [9,40] as revealed by the etch pit patterns (Figure 3b). A nice correlation between τ C R S S b u l k and τ f i n d e n t has been found in single crystal SrTiO3 [29,40], which gives a value of about 60–90 MPa at room temperature. Consider τ C R S S b u l k = τ max b u l k = σ u n i a x i a l 2 and the obtained yield stress from Figure 2, a good agreement is confirmed by our experiment as well.

4.2. Strain Comparison

The strain in bulk deformation can be directly read from the stress-strain curves, for instance, in Figure 1 and Figure 2. The strain analysis in indentation, however, is less straightforward. The elastic strain under spherical indentation can be estimated according to Field et al. [41] via ε = 0.2   a / R . At the critical condition of pop-in occurrence, there is:
ε c = 0.2   a c / R
where R is the effective tip radius, ac is the contact radius at pop-in and is estimated by [41]:
a c = h c R
With hc = 60 nm being the indentation depth at pop-in and the effective tip radius R = 1.4 μm obtained in Figure 3a, this gives the estimation of the strain at the pop-in:
ε c = 0.2 h c / R 4 %
This strain corresponds to the elastic limit in indentation test and is much larger than the elastic limit in bulk deformation, which is smaller than 0.5% in Figure 1 and Figure 2.
The estimation of plastic strain is more complicated under spherical indentation depending on the deformation stage [41] as well as the tip size with respect to the defect density being probed (Section 4.3). For simplicity, however, we still adopt ε = 0.2   a / R as an upper bound for the estimation of the plastic strain beyond the pop-in. In this case, we take the post-mortem SEM image in Figure 3b and determine the ultimate contact radius a = 500 nm, with R = 1.4 μm it gives ε p 7 % . It is noteworthy that both {110}-45° and {110}-90° slip planes (Figure 4b) have been activated at this plastic strain during indentation, while only the {110}-45° slip planes were activated during bulk compression tests although with a much higher plastic strain (13.6% and 13.1% in Figure 2).

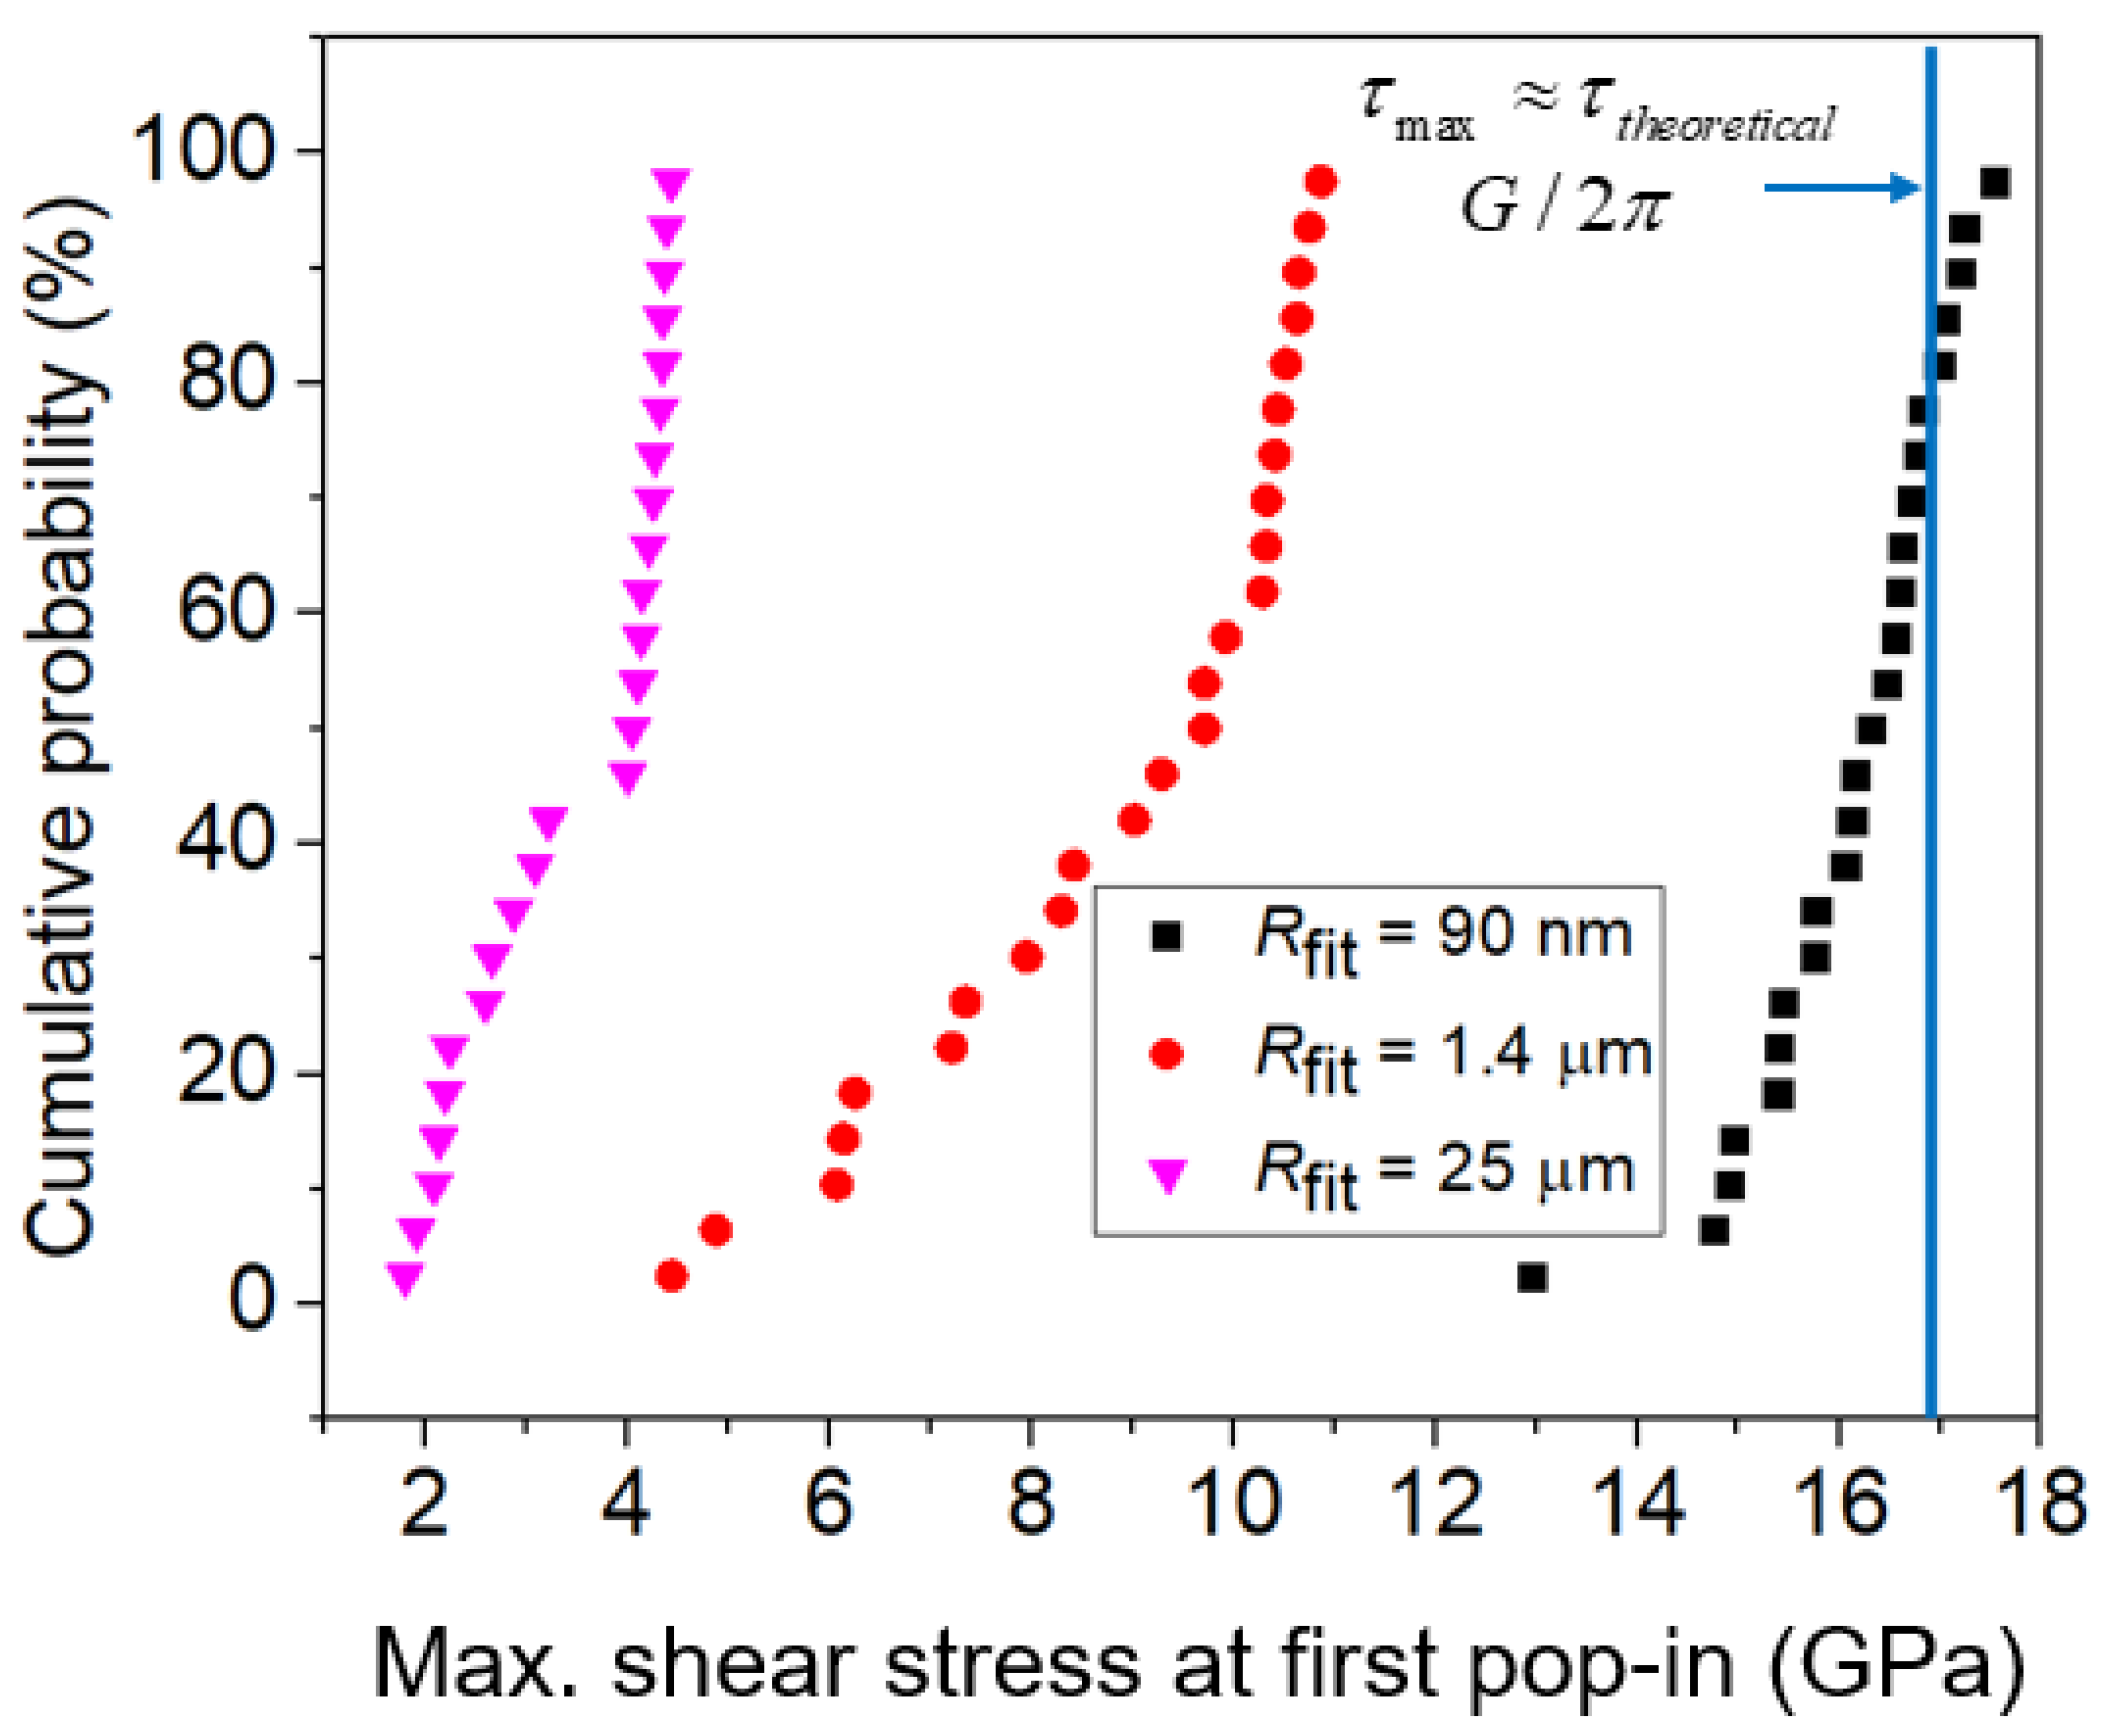
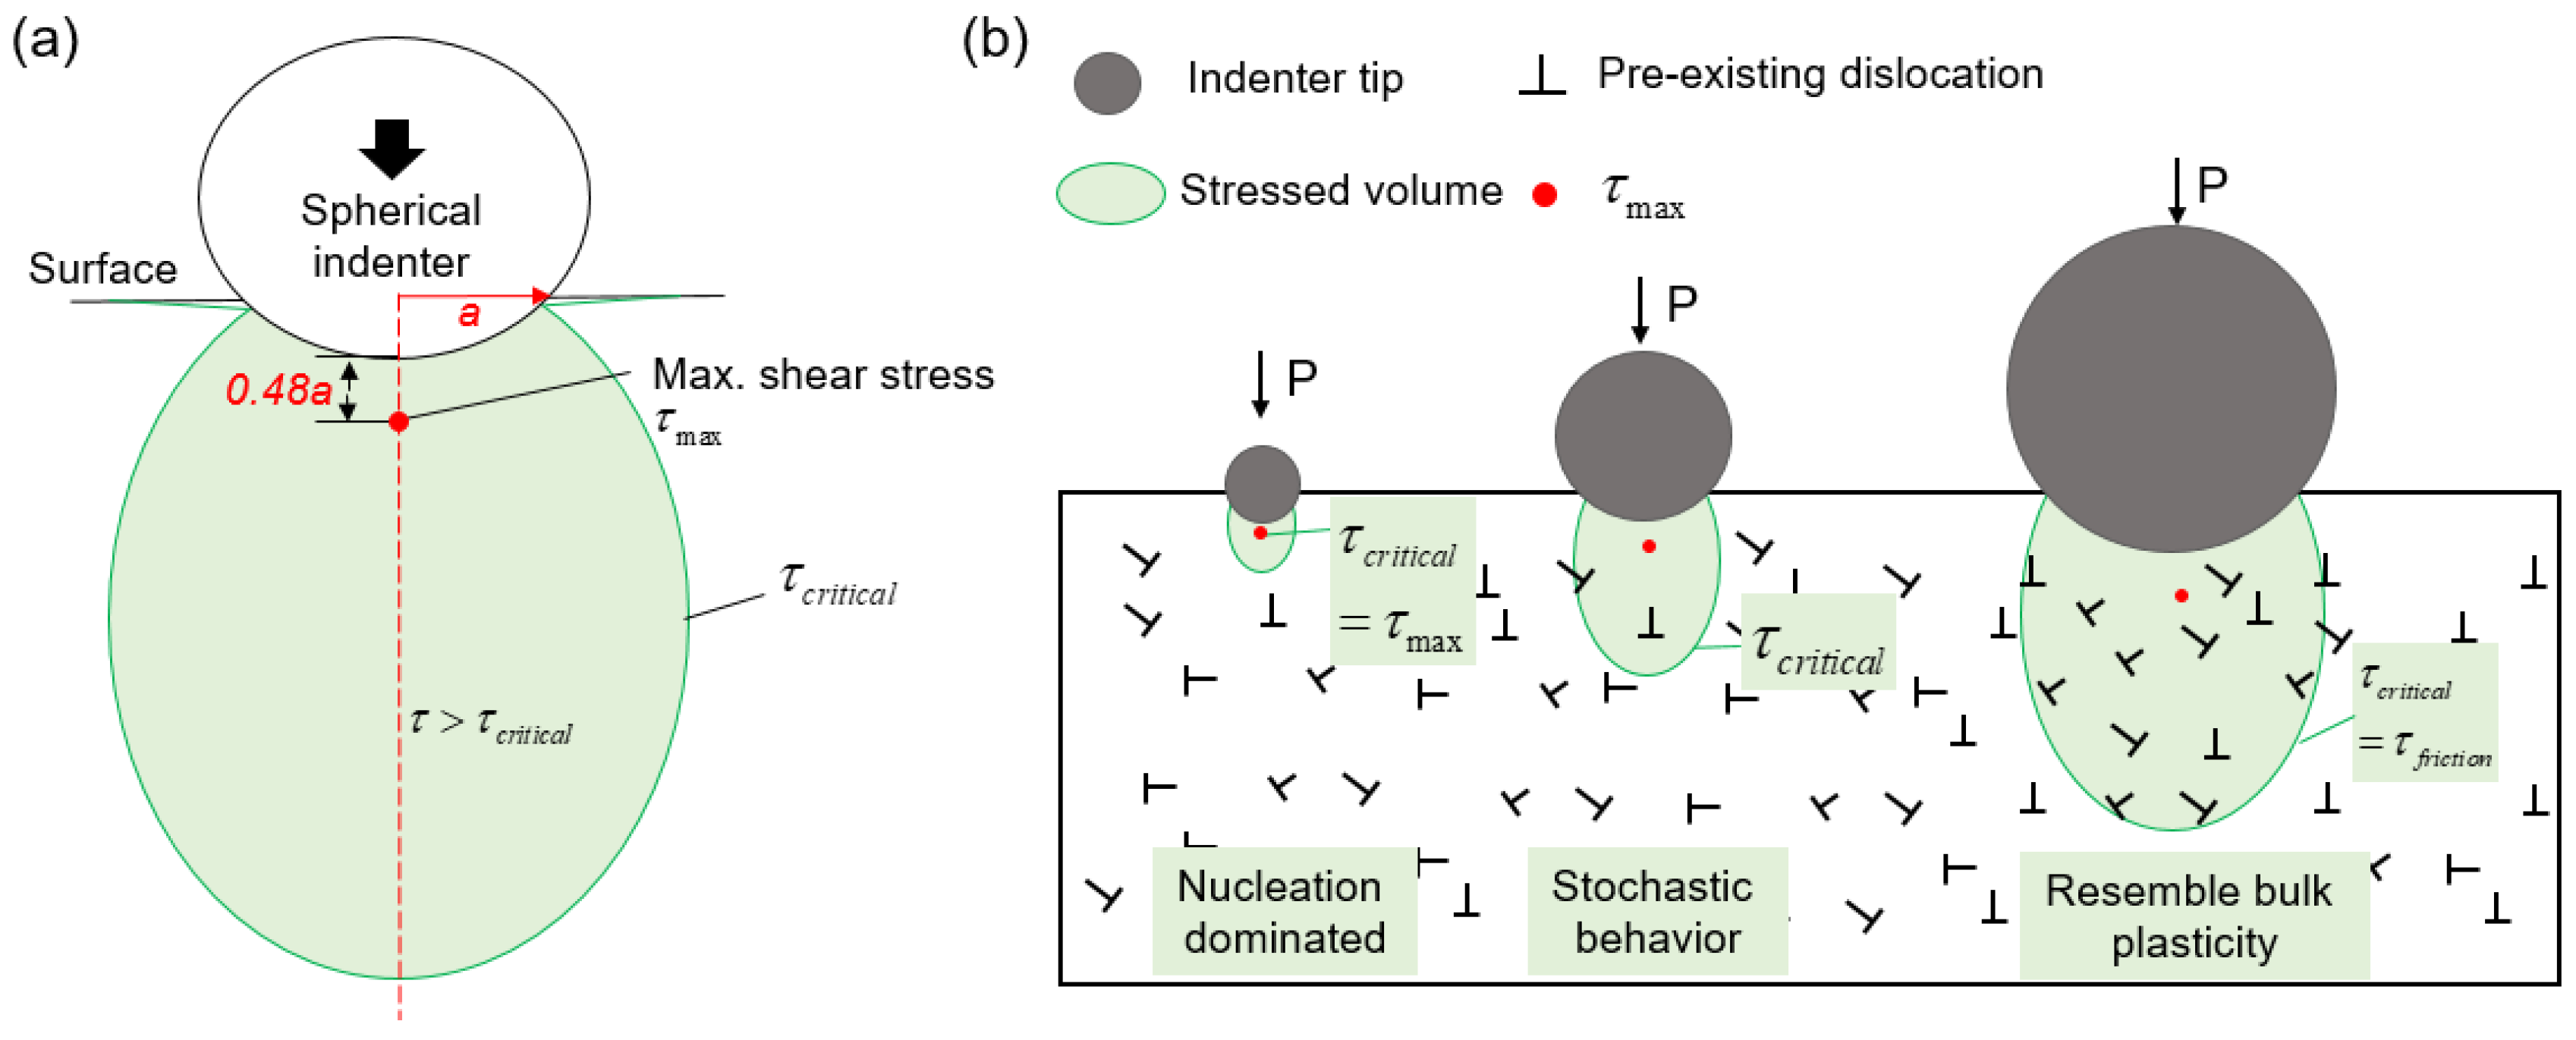
4.3. Indentation Pop-in Related to Defect Population

In comparison to bulk deformation, the indentation pop-in has been frequently used as a powerful tool for understanding the incipient plasticity at micro-/nanoscale, with a focus on the dislocation nucleation as well as multiplication and motion of pre-existing dislocations, as has been extensively studied in metallic materials [42]. In contrast, the pop-in mechanisms in ceramics have been less addressed. Therefore, a detailed discussion on the indentation pop-in is made here.
Considering single crystal ceramic or semiconductor materials, the most relevant defects for the crystal plasticity are the pre-existing dislocations and point defects prior to the mechanical loading. It remains yet a challenging topic to quantify the impact of the defects individually from the pop-in statistics. Nevertheless, these defects present in ceramics, independent of whether they are pre-existing dislocations or point defects, are very often rather far away from the indenter tip and therefore only need rather low stresses in comparison to the homogeneous dislocation nucleation (G/2π), which as discussed above, occurs only at nanoscale testing such as using a sharp indenter [27,43]. As a result, these defects can most likely still be activated before the stress for homogeneous dislocation nucleation is reached underneath the indenter. However, regularly the x-axis of a pop-in statistical distribution is specified by the maximum shear stress available beneath the indenter tip even though this is not actually the critical stress level for the relevant defects to be activated [27,44]. Recent models in metallic materials have been suggested, which effectively and accurately convert pop-in statistics into a defect strength and density [42,44,45]. While these approaches are accurate, their up-front time investment makes them less convenient to accompany the development of understanding.
Instead, we suggest to start with a simple consideration with the basic question: How many defects will be in the volume underneath the indenter? Therefore, both volumetric defect density as well as the relevant volume need to be known. Defect density is either directly specified in volumetric units or can be directly converted to it when approximating line defects, such as dislocations, as point defects with Equation (4).
ρ v o l u m e t r i c = ρ a r e a l 2 / 3
It is tempting to use the areal dislocation density and contrast it to the contact area, which we avoid for two reasons. One, using a volumetric density allows using the approach for all types of defects, which can be helpful later. Two, it is more difficult to reasonably approximate a representative area underneath the indent. In particular, a representative area is not the contact area of the indenter. Instead, it is a much larger area where the stress is sufficient to activate defects. The radius of a reasonable area can be approximated from the half sphere discussed below where we believe it is more intuitive to adopt the volumetric perspective.
Calculating the volume, which is stressed above a certain value, is a bit more cumbersome. It will be approximated here as a half sphere with a radius r, which is defined as the distance from the tip where the stress is lower than the stress required to activate a defect. Here, τ c r i t i c a l is the stress required to activate a defect, τ l o c a l is the stress in the distance from the tip r, and a is the contact radius. The maximum stress underneath the indenter is labeled as τ m a x , where either the experimentally observed maximum stress can be inserted or the theoretical shear stress used, depending on the individual needs.
τ c r i t i c a l = τ l o c a l = τ m a x ( a r ) 2
This equation can be re-arranged as:
r = a τ m a x τ c r i t i c a l
The contact radius can be expressed in two ways. Firstly, it can be calculated according to a = ( 3 P R 4 E r ) 1 / 3 [35], with the tip radius R, reduced modulus Er and indentation load P obtained from the experimental data. This expression has the clear advantage that it can be used for direct comparison with experimental data. Its disadvantage is, however, that it makes comparison between different tip radii difficult because the value of the load P varies with tip radius. Regarding the load P that is needed to reach a particular stress τ , which depends on the tip radius, it will be replaced with an expression that purely relies on tip radius. By combining a = ( 3 P R 4 E r ) 1 / 3 and τ max = 0.31 ( 6 E r 2 π 3 R 2 P ) 1 / 3 , we have:
a = R π τ max 0.62 E r
The contact radius a in dependence on the tip radius is retrieved by relating it to the tip radius R, and the reduced elastic modulus Er = 224 GPa and the maximum shear stress τ max (which is the theoretical shear stress in the case of homogeneous dislocation nucleation) can be inserted.
Combining these equations, the volume can be calculated with an experimental load measured by Equation (8) and for purely theoretical analysis with Equation (9):
V = 2 3 π r 3 = 2 3 π ( ( 3 P R 4 E r ) 1 3 τ m a x τ c r i t i c a l ) 3
V = 2 3 π r 3 = 2 3 π ( R π τ m a x 0.62 E r τ m a x τ c r i t i c a l ) 3
When the volume is known, the number n of expected defects can be estimated by multiplying the volume with the defect density, e.g., by n = ρ V .
As the probed volume is dependent on the tip radius by the third power, the range of the volume can be nicely tuned between e.g., in the range of 10−3 µm3 to 104 µm3 when selecting readily available tip radii over a wide range [27]. For 25 µm tip radius, the volume equals to 10−14–10−13 m3 while the volume for a 1.4 µm tip radius is only 10−17–10−16 m3. Consider the case of pre-existing dislocation analysis, when contrasting the approximated volumetric density of ~1015 m3 for a dislocation density of ~1010 m2 by multiplying volume and density, it becomes clear that in one case dislocations should be readily detectable while in the other case next to no pre-existing dislocations are found. For a 25 µm tip radius, this approximation suggests to find n = 10–100 dislocations, while for a 1.4 µm tip radius, only n = 0.01–0.1 should be found. Hence, the pop-in behavior at 25 µm tip radius should show severe impact by pre-existing dislocations while the pop-in behavior at 1.4 µm tip radius should show next to no impact by pre-existing dislocations. However, it is worthy to note that in Figure 5, the maximum shear stress for 1.4 µm tip radius is yet much lower than the theoretical value (blue line). This is most probably attributed to the free surface being probed by the indenter, and the surface imperfections can serve as heterogeneous dislocation nucleation sites (e.g., surface steps [46]) to dramatically reduce the stress level. In the extreme case of a small volume (e.g., an effective tip radius R = 90 nm [27]), the chance to find a defect in the probed volume will be nearly zero and hence statistically irrelevant, meaning that predominantly homogeneous dislocation nucleation will be observed.
The overall distribution and transition of the maximum shear stress for different tip radii was experimentally demonstrated in Figure 5 by our indentation experiments in single crystal SrTiO3 on the (001) surface. Similar results were reported on metallic material such as Mo single crystal by Bei et al. [45], where a series of different indenter sizes were tested. With the simple calculation suggested above, it is easy for the experimentalists to get a rough idea of which defect density can be best tested with what tip radius.
On the other hand, it should be noted that the maximum shear stress occurs at about 0.5 a below the indenter (Figure 6a). When the tip is sharp and no defect is detected in the probed volume, then the maximum shear stress ( τ max ) is responsible for nucleating dislocations homogeneously. In this case, the maximum shear stress is the critical shear stress ( τ c r i t i c a l ) for dislocation nucleation. However, when the number of defects increases as the probed volume becomes large underneath a larger indenter, it also becomes likely to find defects very close to the tip. Such defects would then already respond to smaller stresses (such as lattice friction stress τ f r i c t i o n ) in order to become mobile (Figure 6b). Thus, the observed force for the “pop-in” becomes low, as shown in Figure 5 for the 25 µm tip radius. In consequence, the response for indentation test with a large tip radius and high density of defect would become very similar to a bulk compression test.

4.4. Pros & Cons between Bulk and Indentation Tests

In order to comprehensively compare the similarities/differences and advantages/limitations between bulk and indentation tests on ceramic materials, we summarize the relevant aspects in Table 1. We expect this table to serve as a primary guideline for designing experiments suiting various purposes at different length scales. We note that in situ indentation tests in SEM and/or TEM are not included, but they can serve as very powerful approaches to directly demonstrate, for instance, dislocation nucleation, dislocation/grain boundary interaction, as well as crack initiation and propagation [47,48,49,50,51,52] for highly site-specific purposes. Another emerging technique using micro-pillar compression for plastic deformation of oxide ceramics has been recently reported on flash sintered TiO2 [20] and yttria-stabilized zirconia [53]. Micro-pillar compression assembles the stress state of bulk compression but exhibits strong size effect [34] and is very often more favorable in metallic materials [31,54,55].
The purpose of this work is to pave the road for understanding dislocation mechanics in ceramics across the length scale using the combinatorial approach of bulk deformation and indentation tests. Both methods are common experimental practices now. Together with other techniques such as etch pit method [9,40], SEM, AFM (atomic force microscopy) [56], ECCI (electron channeling contract imaging) [57] and TEM, the dislocation structures and the slip systems can be quantified to shed light on the crystal plasticity in less studied or new classes of ceramics, with a primary goal to avoid crack formation.

5. Summary

Understanding the dislocation behaviors in advanced functional ceramic and semiconductor materials is one of the greatest challenges in light of the dislocation-based mechanical properties and emerging dislocation-based functionality. This cannot be achieved alone by either conventional bulk deformation testing, which requires either large samples that are very often unavailable, or by nano-/microscale mechanical testing that focuses on limited volume with limitation to account for the effect of the defect population. A better understanding of the crystal plasticity requires the combinatorial approach using both bulk deformation and indentation tests, as is presented and discussed here. The similarities and differences of the deformation mechanisms at the different length scales need to be considered to construct a complete understanding of deformation behavior. While bulk deformation is best for testing bulk properties, indentation is highly versatile in the volume probed and can hence be applied for site-specific testing of individual mechanisms.

Author Contributions

X.F. and A.N. conceived the research idea, X.F. and L.P. drafted the first manuscript. X.F., K.D. and A.N. analyzed the experimental data. All authors discussed the data and commented on the manuscript. All authors have read and agreed to the published version of the manuscript.

Funding

This research was funded by Deutsche Forschungsgemeinschaft: 414179371; Deutsche Forschungsgemeinschaft: 398795637; JST PRESTO: JPMJPR199A; JSPS KAKENHI: JP19H05786, JP17H06094 and JP18H03840.

Acknowledgments

X.F. gratefully acknowledges the financial support of Athene Young Investigator Program (TU Darmstadt) and the Deutsche Forschungsgemeinschaft (DFG, No. 414179371). L.P. is indebted to the funding from DFG (No. 398795637). A.N. thanks the financial support of JST PRESTO Grant Number JPMJPR199A and JSPS KAKENHI Grant Numbers JP19H05786, JP17H06094 and JP18H03840, Japan. We acknowledge the support by the DFG and the Open Access Publishing Fund of Technical University of Darmstadt. We thank Kensuke Yasufuku for his assistance on bulk deformation tests and K. Durst for the access to the indentation equipment. We would like to thank the three anonymous reviewers for their valuable comments.

Conflicts of Interest

The authors declare no conflict of interest.

References

  1. Nakamura, A.; Matsunaga, K.; Tohma, J.; Yamamoto, T.; Ikuhara, Y. Conducting nanowires in insulating ceramics. Nat. Mater. 2003, 2, 453–456. [Google Scholar] [CrossRef]
  2. Ikuhara, Y. Nanowire design by dislocation technology. Prog. Mater. Sci. 2009, 54, 770–791. [Google Scholar] [CrossRef]
  3. Szot, K.; Speier, W.; Bihlmayer, G.; Waser, R. Switching the electrical resistance of individual dislocations in single-crystalline SrTiO3. Nat. Mater. 2006, 5, 312–320. [Google Scholar] [CrossRef] [PubMed]
  4. Sun, B.; Haunschild, G.; Polanco, C.; Ju, J.Z.; Lindsay, L.; Koblmuller, G.; Koh, Y.K. Dislocation-induced thermal transport anisotropy in single-crystal group-III nitride films. Nat. Mater. 2019, 18, 136–140. [Google Scholar] [CrossRef] [PubMed] [Green Version]
  5. Khafizov, M.; Pakarinen, J.; He, L.; Hurley, D.H. Impact of irradiation induced dislocation loops on thermal conductivity in ceramics. J. Am. Ceram. Soc. 2019, 102, 7533–7542. [Google Scholar] [CrossRef]
  6. Kim, S.I.; Lee, K.H.; Mun, H.A.; Kim, H.S.; Hwang, S.W.; Roh, J.W.; Yang, D.J.; Shin, W.H.; Li, X.S.; Lee, Y.H.; et al. Dense dislocation arrays embedded in grain boundaries for high-performance bulk thermoelectrics. Science 2015, 348, 109–114. [Google Scholar] [CrossRef] [Green Version]
  7. Ren, P.; Höfling, M.; Koruza, J.; Lauterbach, S.; Jiang, X.; Frömling, T.; Khatua, D.K.; Dietz, C.; Porz, L.; Ranjan, R.; et al. High Temperature Creep-Mediated Functionality in Polycrystalline Barium Titanate. J. Am. Ceram. Soc. 2019. [Google Scholar] [CrossRef] [Green Version]
  8. Argon, A.S.; Orowan, E. Plastic deformation in mgo single crystals. Philos. Mag. 1964, 9, 1003–1021. [Google Scholar] [CrossRef]
  9. Gaillard, Y.; Tromas, C.; Woirgard, J. Quantitative analysis of dislocation pile-ups nucleated during nanoindentation in MgO. Acta Mater. 2006, 54, 1409–1417. [Google Scholar] [CrossRef]
  10. Johnston, W.G.; Gilman, J.J. Dislocation Multiplication in Lithium Fluoride Crystals. J. Appl. Phys. 1960, 31, 632–643. [Google Scholar] [CrossRef]
  11. Brunner, D.; Taeri-Baghbadrani, S.; Sigle, W.; Rühle, M. Surprising Results of a Study on the Plasticity in Strontium Titanate. J. Am. Ceram. Soc. 2001, 84, 1161–1163. [Google Scholar] [CrossRef]
  12. Oshima, Y.; Nakamura, A.; Matsunaga, K. Extraordinary plasticity of an inorganic semiconductor in darkness. Science 2018, 360, 772–774. [Google Scholar] [CrossRef] [PubMed] [Green Version]
  13. Nakamura, A.; Yasufuku, K.; Furushima, Y.; Toyoura, K.; Lagerlöf, K.; Matsunaga, K. Room-Temperature Plastic Deformation of Strontium Titanate Crystals Grown from Different Chemical Compositions. Crystals 2017, 7, 351. [Google Scholar] [CrossRef] [Green Version]
  14. Oshima, Y.; Nakamura, A.; Lagerlöf, K.P.D.; Yokoi, T.; Matsunaga, K. Room-temperature creep deformation of cubic ZnS crystals under controlled light conditions. Acta Mater. 2020, 195, 690–697. [Google Scholar] [CrossRef]
  15. Feng, B.; Ishikawa, R.; Kumamoto, A.; Shibata, N.; Ikuhara, Y. Atomic Scale Origin of Enhanced Ionic Conductivity at Crystal Defects. Nano Lett. 2019, 19, 2162–2168. [Google Scholar] [CrossRef]
  16. Furushima, Y.; Nakamura, A.; Tochigi, E.; Ikuhara, Y.; Toyoura, K.; Matsunaga, K. Dislocation structures and electrical conduction properties of low angle tilt grain boundaries in LiNbO3. J. Appl. Phys. 2016, 120. [Google Scholar] [CrossRef]
  17. Lee, H.S.; Mizoguchi, T.; Mistui, J.; Yamamoto, T.; Kang, S.J.L.; Ikuhara, Y. Defect energetics in SrTiO3 symmetric tilt grain boundaries. Phys. Rev. B 2011, 83. [Google Scholar] [CrossRef]
  18. Ikuhara, Y.; Nishimura, H.; Nakamura, A.; Matsunaga, K.; Yamamoto, T.; Lagerloef, K.P.D. Dislocation Structures of Low-Angle and Near-Sigma 3 Grain Boundaries in Alumina Bicrystals. J. Am. Ceram. Soc. 2003, 86, 595–602. [Google Scholar] [CrossRef]
  19. Adepalli, K.K.; Kelsch, M.; Merkle, R.; Maier, J. Enhanced ionic conductivity in polycrystalline TiO2 by “one-dimensional doping”. Phys. Chem. Chem. Phys. Pccp 2014, 16, 4942–4951. [Google Scholar] [CrossRef]
  20. Li, J.; Wang, H.; Zhang, X. Nanoscale stacking fault–assisted room temperature plasticity in flash-sintered TiO2. Sci. Adv. 2019, 5, eaaw5519. [Google Scholar] [CrossRef] [Green Version]
  21. Johanning, M.; Porz, L.; Dong, J.; Nakamura, A.; Li, J.-F.; Rödel, J. Influence of dislocations on thermal conductivity of strontium titanate. Appl. Phys. Lett. 2020, 117, 021902. [Google Scholar] [CrossRef]
  22. Nakamura, A.; Lagerlöf, K.P.D.; Matsunaga, K.; Tohma, J.; Yamamoto, T.; Ikuhara, Y. Control of dislocation configuration in sapphire. Acta Mater. 2005, 53, 455–462. [Google Scholar] [CrossRef]
  23. Gumbsch, P.; Taeri-Baghbadrani, S.; Brunner, D.; Sigle, W.; Ruhle, M. Plasticity and an inverse brittle-to-ductile transition in strontium titanate. Phys. Rev. Lett. 2001, 87, 085505. [Google Scholar] [CrossRef] [PubMed]
  24. Johnston, W.G.; Gilman, J.J. Dislocation Velocities, Dislocation Densities, and Plastic Flow in Lithium Fluoride Crystals. J. Appl. Phys. 1959, 30, 129–144. [Google Scholar] [CrossRef]
  25. Gaillard, Y.; Tromas, C.; Woirgard, J. Pop-in phenomenon in MgO and LiF: Observation of dislocation structures. Philos. Mag. Lett. 2010, 83, 553–561. [Google Scholar] [CrossRef]
  26. Tromas, C.; Gaillard, Y.; Woirgard, J. Nucleation of dislocations during nanoindentation in MgO. Philos. Mag. 2006, 86, 5595–5606. [Google Scholar] [CrossRef] [Green Version]
  27. Fang, X.; Ding, K.; Janocha, S.; Minnert, C.; Rheinheimer, W.; Frömling, T.; Durst, K.; Nakamura, A.; Rödel, J. Nanoscale to microscale reversal in room-temperature plasticity in SrTiO3 by tuning defect concentration. Scr. Mater. 2020, 188, 228–232. [Google Scholar] [CrossRef]
  28. Taeri, S.; Brunner, D.; Sigle, W.; Rühle, M. Deformation behaviour of strontium titanate between room temperature and 1800 K under ambient pressure. Z. Met. 2004, 95, 433–446. [Google Scholar] [CrossRef]
  29. Patterson, E.A.; Major, M.; Donner, W.; Durst, K.; Webber, K.G.; Rodel, J. Temperature-Dependent Deformation and Dislocation Density in SrTiO3 (001) Single Crystals. J. Am. Ceram. Soc. 2016, 99, 3411–3420. [Google Scholar] [CrossRef]
  30. Mark, A.F.; Castillo-Rodriguez, M.; Sigle, W. Unexpected plasticity of potassium niobate during compression between room temperature and 900 °C. J. Eur. Ceram. Soc. 2016, 36, 2781–2793. [Google Scholar] [CrossRef]
  31. Dehm, G.; Jaya, B.N.; Raghavan, R.; Kirchlechner, C. Overview on micro- and nanomechanical testing: New insights in interface plasticity and fracture at small length scales. Acta Mater. 2017, 142, 248–282. [Google Scholar] [CrossRef]
  32. Pharr, G.M.; Oliver, W.C. Measurement of Thin Film Mechanical Properties Using Nanoindentation. Mrs Bull. 1992, 17, 28–33. [Google Scholar] [CrossRef]
  33. Oliver, W.C.; Pharr, G.M. An improved technique for determining hardness and elastic modulus using load and displacement sensing indentation experiments. J. Mater. Res. 1992, 7, 1564–1583. [Google Scholar] [CrossRef]
  34. Greer, J.R.; De Hosson, J.T.M. Plasticity in small-sized metallic systems: Intrinsic versus extrinsic size effect. Prog. Mater. Sci. 2011, 56, 654–724. [Google Scholar] [CrossRef]
  35. Johnson, K.L. Contact Mechanics; Cambridge University Press: Cambridge/London, UK, 1985. [Google Scholar]
  36. Li, W.; Bei, H.; Qu, J.; Gao, Y. Effects of machine stiffness on the loading–displacement curve during spherical nano-indentation. J. Mater. Res. 2013, 28, 1903–1911. [Google Scholar] [CrossRef]
  37. Javaid, F.; Bruder, E.; Durst, K. Indentation size effect and dislocation structure evolution in (001) oriented SrTiO3 Berkovich indentations: HR-EBSD and etch-pit analysis. Acta Mater. 2017, 139, 1–10. [Google Scholar] [CrossRef]
  38. Swain, M.V.; Lawn, B.R. A Study of Dislocation Arrays at Spherical Indentations in LiF as a Function of Indentation Stress and Strain. Phys. Stat. Sol. 1969, 35, 909–923. [Google Scholar] [CrossRef]
  39. Javaid, F.; Stukowski, A.; Durst, K. 3D Dislocation structure evolution in strontium titanate: Spherical indentation experiments and MD simulations. J. Am. Ceram. Soc. 2017, 100, 1134–1145. [Google Scholar] [CrossRef]
  40. Javaid, F.; Johanns, K.E.; Patterson, E.A.; Durst, K. Temperature dependence of indentation size effect, dislocation pile-ups, and lattice friction in (001) strontium titanate. J. Am. Ceram. Soc. 2018, 101, 356–364. [Google Scholar] [CrossRef] [Green Version]
  41. Field, J.S.; Swain, M.V. A simple predictive model for spherical indentation. J. Mater. Res. 1993, 8, 297–306. [Google Scholar] [CrossRef]
  42. Gao, Y.; Bei, H. Strength statistics of single crystals and metallic glasses under small stressed volumes. Prog. Mater. Sci. 2016, 82, 118–150. [Google Scholar] [CrossRef] [Green Version]
  43. Morris, J.R.; Bei, H.; Pharr, G.M.; George, E.P. Size Effects and Stochastic Behavior of Nanoindentation Pop In. Phys. Rev. Lett. 2011, 106, 165502. [Google Scholar] [CrossRef] [PubMed] [Green Version]
  44. Jin, K.; Xia, Y.; Crespillo, M.; Xue, H.; Zhang, Y.; Gao, Y.F.; Bei, H. Quantifying early stage irradiation damage from nanoindentation pop-in tests. Scr. Mater. 2018, 157, 49–53. [Google Scholar] [CrossRef]
  45. Bei, H.; Xia, Y.Z.; Barabash, R.I.; Gao, Y.F. A tale of two mechanisms: Strain-softening versus strain-hardening in single crystals under small stressed volumes. Scr. Mater. 2016, 110, 48–52. [Google Scholar] [CrossRef] [Green Version]
  46. Zimmerman, J.A.; Kelchner, C.L.; Klein, P.A.; Hamilton, J.C.; Foiles, S.M. Surface step effects on nanoindentation. Phys. Rev. Lett. 2001, 87, 165507. [Google Scholar] [CrossRef]
  47. Matsunaga, K.; Ii, S.; Iwamoto, C.; Yamamoto, T.; Ikuhara, Y. In situ observation of crack propagation in magnesium oxide ceramics. Nanotechnology 2004, 15, S376–S381. [Google Scholar] [CrossRef]
  48. Kondo, S.; Shibata, N.; Mitsuma, T.; Tochigi, E.; Ikuhara, Y. Dynamic observations of dislocation behavior in SrTiO3 by in situ nanoindentation in a transmission electron microscope. Appl. Phys. Lett. 2012, 100, 181906. [Google Scholar] [CrossRef]
  49. Kondo, S.; Mitsuma, T.; Shibata, N.; Ikuhara, Y. Direct observation of individual dislocation interaction processes with grain boundary. Sci. Adv. 2016, 2, e1501926. [Google Scholar] [CrossRef] [Green Version]
  50. Kondo, S.; Ishihara, A.; Tochigi, E.; Shibata, N.; Ikuhara, Y. Direct observation of atomic-scale fracture path within ceramic grain boundary core. Nat. Commun. 2019, 10, 2112. [Google Scholar] [CrossRef]
  51. Nie, A.; Bu, Y.; Huang, J.; Shao, Y.; Zhang, Y.; Hu, W.; Liu, J.; Wang, Y.; Xu, B.; Liu, Z.; et al. Direct Observation of Room-Temperature Dislocation Plasticity in Diamond. Matter 2020, 2, 1222–1232. [Google Scholar] [CrossRef] [Green Version]
  52. Sernicola, G.; Giovannini, T.; Patel, P.; Kermode, J.R.; Balint, D.S.; Britton, T.B.; Giuliani, F. In situ stable crack growth at the micron scale. Nat. Commun. 2017, 8, 1–9. [Google Scholar] [CrossRef] [PubMed]
  53. Cho, J.; Li, J.; Wang, H.; Li, Q.; Fan, Z.; Mukherjee, A.K.; Rheinheimer, W.; Wang, H.; Zhang, X. Study of deformation mechanisms in flash-sintered yttria-stabilized zirconia by in-situ micromechanical testing at elevated temperatures. Mater. Res. Lett. 2019, 7, 194–202. [Google Scholar] [CrossRef] [Green Version]
  54. Malyar, N.V.; Micha, J.S.; Dehm, G.; Kirchlechner, C. Size effect in bi-crystalline micropillars with a penetrable high angle grain boundary. Acta Mater. 2017, 129, 312–320. [Google Scholar] [CrossRef]
  55. Malyar, N.V.; Micha, J.S.; Dehm, G.; Kirchlechner, C. Dislocation-twin boundary interaction in small scale Cu bi-crystals loaded in different crystallographic directions. Acta Mater. 2017, 129, 91–97. [Google Scholar] [CrossRef]
  56. Gaillard, Y.; Tromas, C.; Woirgard, J. Study of the dislocation structure involved in a nanoindentation test by atomic force microscopy and controlled chemical etching. Acta Mater. 2003, 51, 1059–1065. [Google Scholar] [CrossRef]
  57. Zaefferer, S.; Elhami, N.-N. Theory and application of electron channelling contrast imaging under controlled diffraction conditions. Acta Mater. 2014, 75, 20–50. [Google Scholar] [CrossRef]
  58. Otsuka, K.; Kuwabara, A.; Nakamura, A.; Yamamoto, T.; Matsunaga, K.; Ikuhara, Y. Dislocation-enhanced ionic conductivity of yttria-stabilized zirconia. Appl. Phys. Lett. 2003, 82, 877–879. [Google Scholar] [CrossRef]
  59. Fang, X.; Jia, J.; Feng, X. Three-point bending test at extremely high temperature enhanced by real-time observation and measurement. Measurement 2015, 59, 171–176. [Google Scholar] [CrossRef]
  60. Luo, H.; Lu, W.; Fang, X.; Ponge, D.; Li, Z.; Raabe, D. Beating hydrogen with its own weapon: Nano-twin gradients enhance embrittlement resistance of a high-entropy alloy. Mater. Today 2018, 21, 1003–1009. [Google Scholar] [CrossRef]
  61. Wheeler, J.M.; Armstrong, D.E.J.; Heinz, W.; Schwaiger, R. High temperature nanoindentation: The state of the art and future challenges. Curr. Opin. Solid State Mater. Sci. 2015, 19, 354–366. [Google Scholar] [CrossRef] [Green Version]
  62. Trenkle, J.C.; Packard, C.E.; Schuh, C.A. Hot nanoindentation in inert environments. Rev. Sci. Instrum. 2010, 81, 073901. [Google Scholar] [CrossRef] [PubMed] [Green Version]
  63. Li, Y.; Fang, X.; Xia, B.; Feng, X. In situ measurement of oxidation evolution at elevated temperature by nanoindentation. Scr. Mater. 2015, 103, 61–64. [Google Scholar] [CrossRef]
  64. Li, Y.; Fang, X.; Qu, Z.; Lu, S.; Li, H.; Zhu, T.; Yu, Q.; Feng, X. In situ full-field measurement of surface oxidation on Ni-based alloy using high temperature scanning probe microscopy. Sci. Rep. 2018, 8, 6684. [Google Scholar] [CrossRef] [PubMed] [Green Version]
  65. Minnert, C.; Oliver, W.C.; Durst, K. Newultra-high temperature nanoindentation system for operating at up to 1100 °C. Mater. Des. 2020, 192, 108727. [Google Scholar] [CrossRef]
Publisher’s Note: MDPI stays neutral with regard to jurisdictional claims in published maps and institutional affiliations.
Figure 1. Stress-strain curves and corresponding real-time images captured during deformation for bulk deformation on single crystal SrTiO3 along the [310] direction: (a) Strain rate 1.0 × 10⁻⁵ s−1; (b) Strain rate 1.0 × 10⁻¹ s−1.
Crystals 10 00933 g001
Figure 2. Stress-strain curves and corresponding real-time images captured during deformation for bulk deformation on single crystal SrTiO3 along the [001] direction: (a) Strain rate 1.0 × 10⁻⁵ s−1; (b) Strain rate 1.0 × 10⁻¹ s−1, adopted and modified from [13].
Crystals 10 00933 g002
Figure 3. (a) Indentation load-displacement curves with pop-in event on (001) surface of single crystal SrTiO3; (b) SEM images showing dislocation etch pits.
Crystals 10 00933 g003
Figure 4. Comparison of the activation of slip systems: (a) slip activation in bulk compression along [001] direction; (b) slip activation in indentation test on (001) surface, note the angles 45° and 90° indicate the inclined angle between the slip plane and the indented surface.
Crystals 10 00933 g004
Figure 5. Indentation pop-in statistics on single crystal (001)-SrTiO3 with tip radii of 25 μm, 1.4 μm and 90 nm. The data on 25 μm and 90 nm were adopted from [27].
Crystals 10 00933 g005
Figure 6. Schematic illustration of (a) the maximum shear stress and the critical shear stress under a spherical indenter; (b) effect of the defect population with respect to the volume being probed beneath the indenter tip, image modified based on [45]. Note that the critical shear stress is equal to the maximum shear stress when the stress volume is defect-free, so that homogeneous dislocation is activated. The complication of surface defects on heterogeneous dislocation nucleation is not included in this map.
Crystals 10 00933 g006
Table 1. Comparison of the advantages and limitations between bulk and indentation tests.
Bulk Deformation (Larger than mm Size)(Nano)Indentation (Nano-/Microscale)
Pros
  • Well-established experimental protocol
  • Well-alignment of dislocations [1,2,21] in large deformation to facilitate functional properties study
  • Easy to handle with larger sized samples
  • Relatively easy to conduct tests at high temperature up to 1100 °C and higher [1,22,58,59]
  • Relatively easy to conduct tests at cryogenic temperature in liquid nitrogen at 77 K [60]
  • High-throughput testing on small or low-dimensional sample
  • Fast screening of multiple materials
  • Easy to induce dislocations without cracks below a critical tip radius
  • Site-specific investigation for dislocation interaction with other types of defects such as point defects, pre-existing dislocations and interfaces (grain boundaries, second phase boundary, etc.)
  • Low defect population in small volume
Cons
  • Less cost-effective for large samples
  • Large bulk samples are not always available, especially for many advanced functional ceramics and semiconductors
  • Imperfect alignment easily causes cracking due to the local stress concentration/pre-existing cracks
  • Difficult to activate slip systems (especially secondary slip systems) due to limited stress level
  • High defect population in large volume
  • Limited to local small regions
  • Machine dynamics, especially in load-controlled system for most indentation systems
  • Challenging for high-temperature tests due to tip reaction, thermal drift, etc. [61,62,63,64].
  • State-of-the-art temperature is limited to 1100 °C [65]
  • Challenging for cryogenic temperature tests, e.g., in liquid nitrogen at 77 K

