Article

GTN Model-Based Material Parameters of AZ31 Magnesium Sheet at Various Temperatures by Means of SEM In-Situ Testing

1
Institute of Metal Forming, Technische Universität Bergakademie Freiberg, 09599 Freiberg, Germany
2
Faculty of Mechanical Engineering, Technion, 32000 Haifa, Israel
*
Author to whom correspondence should be addressed.
Crystals 2020, 10(10), 856; https://doi.org/10.3390/cryst10100856
Submission received: 1 September 2020 / Revised: 19 September 2020 / Accepted: 22 September 2020 / Published: 23 September 2020
(This article belongs to the Special Issue Processing and Characterization of Magnesium-Based Materials)

Abstract

:
Magnesium alloys are primarily associated with complex forming mechanisms, which yield ductility at high temperatures. In sheet metal forming, high triaxiality stress states that favor the ductile damage mechanisms of void formation and growth are known to malleable metals. The formulation of coupled damage models has so far failed, due to the incomplete experimental determination of damage parameters for magnesium AZ31 thin sheet. A quantitative investigation was conducted to determine the ductile damage behavior of twin-roll cast, hot rolled, and annealed AZ31 thin sheet. Results on the mechanisms of void nucleation-, coalescence- and growth-rate were established at temperatures ranging from room temperature to 350 °C. In-situ tensile tests were carried out in a scanning electron microscope with three different specimen types: Simple tension specimens, notched specimens for high triaxiality stress state testing, and shear specimens. Through a comparative analysis of local strains measured by digital image correlation and local void volume fractions determined through post-mortem analysis of specimen cross-sections, GTN (Gurson–Tvergaard–Needleman) model-based material parameters were determined by experiment, representing a novel departure in the magnesium research landscape. The procedure developed in this context should also be transferable to other metals in the form of thin sheets.

Graphical Abstract

1. Introduction

The modeling of materials and the simulation of entire process chains are state-of-the-art tools in the development of components and their manufacturing processes. Requirements for high performance and low costs drive the demand for precise material models. Non-linear finite element (FE) programs with failure criteria or simple micromechanics-based models have long since they found their way into industrial developments, mostly because commercially available FE software has progressively implemented several damage models. Meanwhile, these include more complex coupled damage models and can further account for multi-axial and non-proportional loadings [1].
With their great lightweight potential, magnesium alloys are increasingly utilized in the automobile and aeronautical industries. Nevertheless, there are few guidelines for the determination of parameters of complex coupled damage models, and in the area of magnesium (Mg) thin sheet, there is a complete gap. Mg alloys have been of considerable interest for a long time from a scientific point of view, due to the properties associated with their hexagonal crystal lattice structure. At room temperature, the hexagonal close-packed (hcp) structure of Mg exhibits an inadequate amount of operational slip systems and substantial mechanical anisotropy, meaning that it is commonly regarded as a metal with poor ductility [2,3]. However, the ductility of Mg alloys with increasing temperature is mostly underestimated. Numerous studies confirm the strong increase in ductility Mg alloys exhibit at elevated temperatures, as well as the versatile interactions of individual deformation mechanisms in Mg, which may lead to superplasticity [4,5,6,7]. Samples made of Mg and its alloys tend to fail in a ductile manner at low temperatures. As such, the failure mechanisms consist of the nucleation of micro-sized voids, which grow and ultimately coalesce, leading to complete fracture. Nemcko and Wilkinson [8] made use of in-situ x-ray computed micro-tomography (XCT) during tensile tests to demonstrate the ductile failure process of pure Mg. In their work, void nucleation is predominantly evident at twin and grain boundaries, followed by a rapid growth stage leading to final fracture. The nucleation of voids at room temperature is generally understood to take place at grain boundaries, where second-phase particles are located, or due to twinning [9,10]. As what is becoming a popular method to study void development during deformation, XCT provides accurate results for statistical evaluation and overcomes drawbacks of two-dimensional post-mortem studies. In many studies on magnesium-aluminum-zinc alloys, void growth and coalescence are seen to result in apparent acceleration of the damage kinetics [11,12,13,14]. The process of void coalescence leads to an abrupt increase in the overall porosity, as the voids’ growth is accelerated, due to their mutual interactions. Grain boundary sliding (GBS) is associated with complex void shapes [12]. The role of second-phase particles as major nucleation sites for voids is well established, although they do not influence the rate of void growth. Rashed et al. [13] find that with increasing strain, progressively smaller particles induce voids. Furthermore, it remains possible that the material could exhibit pre-existing hydrogen micro-voids resulting from the precipitation of hydrogen during solidification after the casting process. These have a considerable influence on increases in void volume fraction, as they exhibit the same growth rates as strain-induced voids. Compared to voids on grain boundaries, pre-existing grain-interior micro-voids grow quite slowly [14]. Kondori and Benzerga [15] draw attention to the fact that the strong basal texture of rolled magnesium shows greater tolerance to ductile damage accumulation in notched specimens than in smooth ones. Here, a transition from twinning-induced fracture under uniaxial tension to void coalescence fracture under triaxial loading was evident.
In this study, the ductile damage behavior of twin-roll cast, hot rolled, and annealed AZ31 sheet is characterized by in-situ tensile testing, as well as a two-dimensional post-mortem cross-section analysis in a scanning electron microscope (SEM). Then, Gurson–Tvergaard–Needleman (GTN) model-based ductile fracture parameters are proposed as a function of temperatures ranging from room temperature (RT) to 350 °C. These investigations get to the bottom of the current gap in the state-of-the-art to establish a characterization method that allows the experimental determination of damage parameters in thin sheet metal. The GTN model is based on the approach by Gurson [16] and is the most widely used continuum mechanics-based model. In the absence of porosity, the Gurson flow potential reduces to the von Mises potential, while as porosity grows, the Gurson flow potential contracts to express the loss of load-bearing capacity as a function of the evolving void volume fraction. From Tvergaard, Chu, and Needleman [17,18,19], an extension of the Gurson model has proven to offer more accuracy. The resulting flow potential is defined as:
Φ GTN = ( σ v σ y ) 2 + 2 q 1 f cosh ( 3 2 q 2 σ H σ y ) ( 1 + q 3 f 2 )
where σ y is the yield stress of the matrix material, σ v is the von Mises equivalent stress and σ H is the mean stress. Tvergaard, Chu, and Needleman replaced the void volume fraction f by a modified damage parameter f to reflect void coalescence processes after a critical void volume fraction f c is reached:
f = { f , if   f < f c f c + f u f c f f f c ( f f c ) , if   f f c
where f f is the critical void volume fraction at fracture and f u = q 1 + q 1 2 q 3 / q 3 . By adding the material-dependent parameters q 1 , q 2 and q 3 , a better fit of numerical results can be achieved [17,18,19]. The model assumes a homogeneous distribution of spherical voids in an isotropic material. f follows the evolution equation f ˙ = f ˙ nucleation + f ˙ growth = f ˙ nuc + f ˙ gr , with:
f ˙ nuc = f N S N 2 π · exp [ 1 2 ( ε ¯ p ε N S N ) 2 ] · ε ¯ ˙ p
f ˙ gr = ( 1 f ) · trace ( ε ˙ p )
where f N is determined so that the void volume fraction nucleated is consistent with the volume fraction of void-inducing second-phase particles. Furthermore, Tvergaard, Chu, and Needleman assume a normal distribution of void nucleation at second-phase particles with ε N being the mean plastic strain at maximum nucleation and S N the standard deviation.
Publications of successful continuum damage modeling applications in the forming of the AZ31 sheet are quite scarce [20,21,22]. In fact, this study represents a novel departure in the Mg research landscape on experimentally determined GTN model-based damage parameters. The authors investigate the adaptation of the model to use with a hexagonal metal.

2. Materials and Experimental Procedure

For the present work, twin-roll cast, hot rolled, and annealed 1.0 mm-thick AZ31 magnesium sheet was manufactured by the Institute of Metal Forming (Technische Universität Bergakademie Freiberg, 09599 Freiberg, Germany). The chemical composition of the investigated alloy is presented in Table 1. A description of the manufacturing process and the expected final properties of the test material can be found in numerous publications [23,24,25,26,27,28].
First, rough outlines of the tensile specimens were cut from the sheet via waterjet cutting. Subsequently, the stressed parts of the specimen were fine milled to precise dimensions, as shown in Figure 1b–d. The work sequence for the experimental procedure was that of initial surface preparation, then tensile testing, and finally, the reconstruction of the void volume fraction from the sample cross-sections. For the local strain analysis and the observation of near-surface damage phenomena, in-situ (during the experiment) images were taken by means of a MIRA3 scanning electron microscope (SEM) from Tescan (at the Technion, 32000 Haifa, in the lab for Computational and Experimental Micromechanics of Materials).
The tensile tests were carried out with an in-situ tension-compression module from Kammrath and Weiss with a traverse velocity of 5 µm/s (see Figure 1a). The heating stage was located beneath the specimen. The loading direction was parallel to the rolling direction at 20 °C, 150 °C, 250 °C, and 350 °C. The tensile tests were preceded by heating of the specimen at a rate of 1 K/s and a holding time of 20 s.
The surface preparation of the samples was carried out mechanically and chemically. In order to avoid excessive removal of the material on the surface, only three preparation steps were implemented as preparation for the EBSD (electron backscatter diffraction) analysis, as well as for the in-situ testing. The first step involved a grinding stage (with the addition of ethanol) on P4000 grade SiC abrasive paper. The samples were then polished with a SiO2 + iron oxide suspension (particle size 0.06 µm). The last step involved immersing the samples in Nital (95 mL of ethanol and 5 mL of concentrated nitric acid) for not more than 5 s. The Nital treatment removes the slightly deformed polished surface in order to ensure superior EBSD results. The EBSD analysis (15 kV acceleration voltage, 0.6 µm step size) was carried out using Aztec software from Oxford Instruments and subsequent evaluation through an open-source MATLAB toolbox called MTEX (for the calculation of the orientation distribution function and pole figures from the EBSD data) [29]. The correct half-width of 7.5° and bandwidth of 33 was determined by means of the optimal kernel function algorithm calcKernel and the RuleOfThumb method for orientation distribution function (ODF) estimation available in MTEX.
To determine the void volume fraction in a cross-section parallel to the sheet plane, torn samples were ground to half their thickness. Here, the sample holder AccuStop from Struers was used to ensure good planarity. The surface preparation was carried out in the same way as described above. High-resolution SEM images where used to determine the area fraction (see Figure 2), as well as the size distribution of voids and second-phase particles.
Since the present study was carried out over a wide range of temperatures and stress triaxialities, which manifested in rather large variations in local void densities, the authors opted for a method known as Voronoi decomposition [30]. The borders of the Voronoi cells were positioned halfway between the two neighboring void centroids and formed the reference area in which the local void area fraction was determined, as seen in Figure 2a,b. The void area fraction f was determined on the specimen cross-section parallel to the sheet plane. Thus, the simplification was made that the area fraction of visible voids corresponded to the void volume fraction, while the area of the second-phase particles corresponded to the particle volume fraction.
The strain analysis was carried out from the discrete SEM images by means of digital image correlation (DIC, see Figure 2c). The natural surface structure provided the necessary contrast in the present work. The MATLAB tool Ncorr v1.2 used is an open-source, two-dimensional DIC program whose algorithms are described in Reference [31]. A total of 20 profile lines were placed along the loading direction on the local void area fraction data, as well as strain analysis. As demonstrated in Figure 2 mean value graphs were then used to correlate the mean local void area fraction with local strains.

3. Results and Discussion

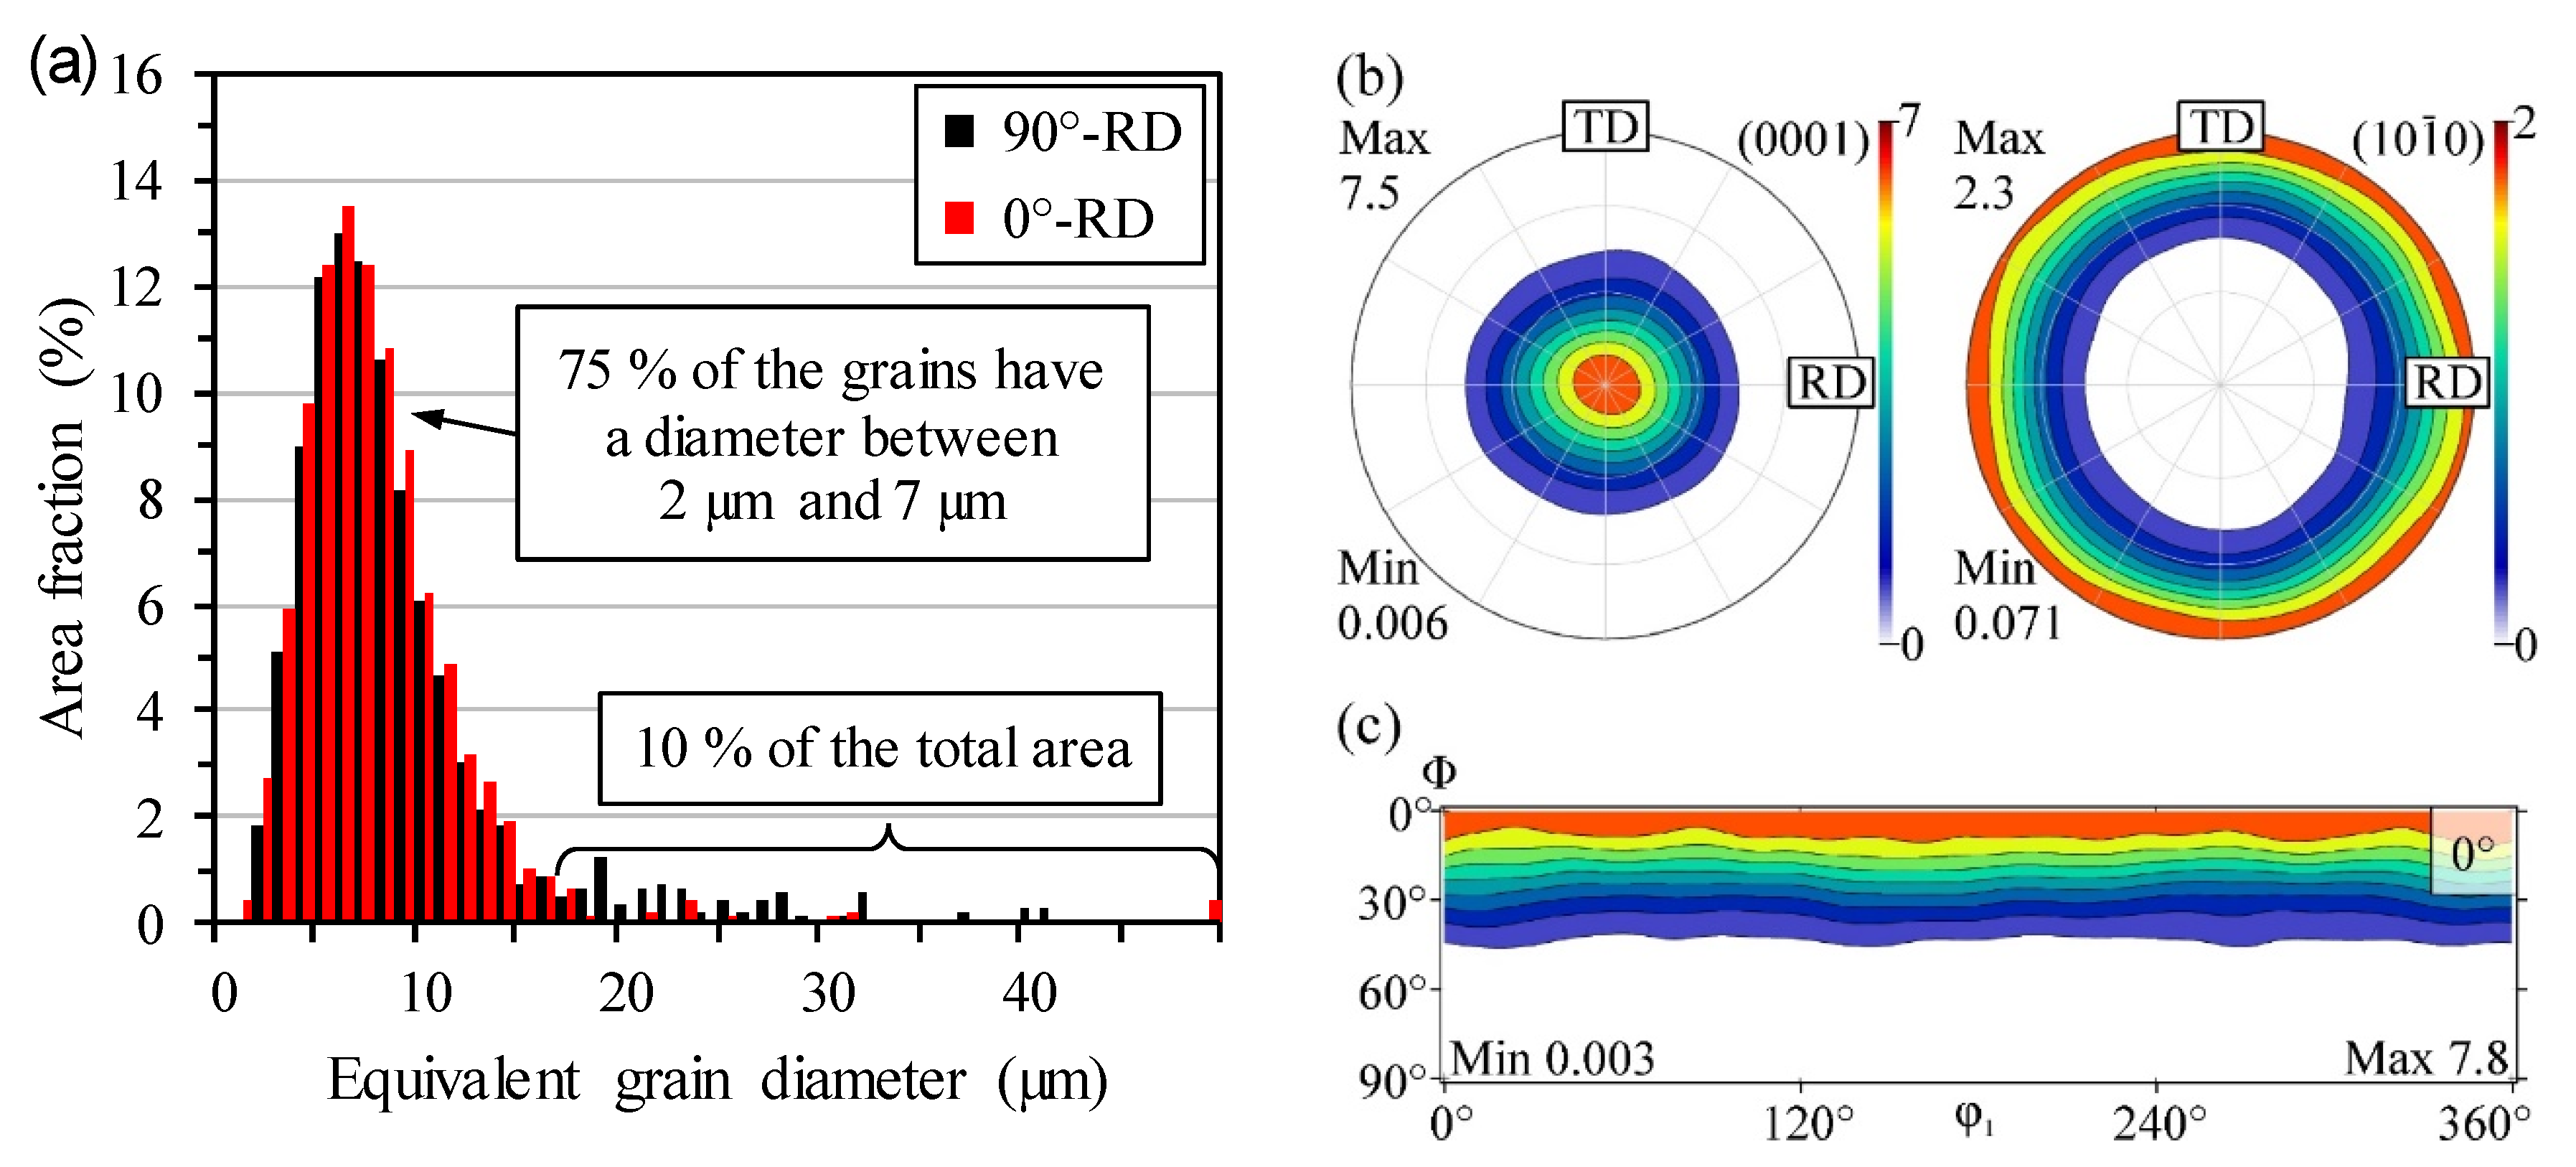
3.1. Materials Characterization

The initial microstructure of the investigated AZ31 magnesium sheet was characterized by globular grains, with an average equivalent grain diameter of 6 µm determined with through-thickness EBSD data (2° grain tolerance angle and 2 µm minimum grain size, see Appendix A, Figure A1). As demonstrated in Figure 3a larger grains (which are predominantly located at the sheet upper and lower surface) have a size of up to 50 µm, and reveal a minor bimodal grain size distribution. The grain size distribution does not vary between cross-sections 0° or 90° to rolling direction (RD).
The presented pole figures in Figure 3b confirm a strong basal texture with the (0001) basal poles showing a high intensity normal to the RD-TD (rolling direction-transverse direction) plane. This is a known phenomenon in rolled Mg sheets, with the basal planes reoriented parallel to the horizontal material flow as basal dislocation slip is activated in the rolling direction [24,32]. Furthermore, the pole figure for the (10-10) prismatic planes shows a random distribution in sheet plane, revealing a typical fiber texture. The calculated ODF sections at φ2 = 0°, shown in Figure 3c, confirm the fiber texture.
The intragranular misorientation angles from the EBSD data was determined to have a median value of 0.3 (map shown in Appendix A, Figure A1). The authors can, therefore, presume that the microstructure was in a completely recrystallized and recovered state prior to tensile testing.

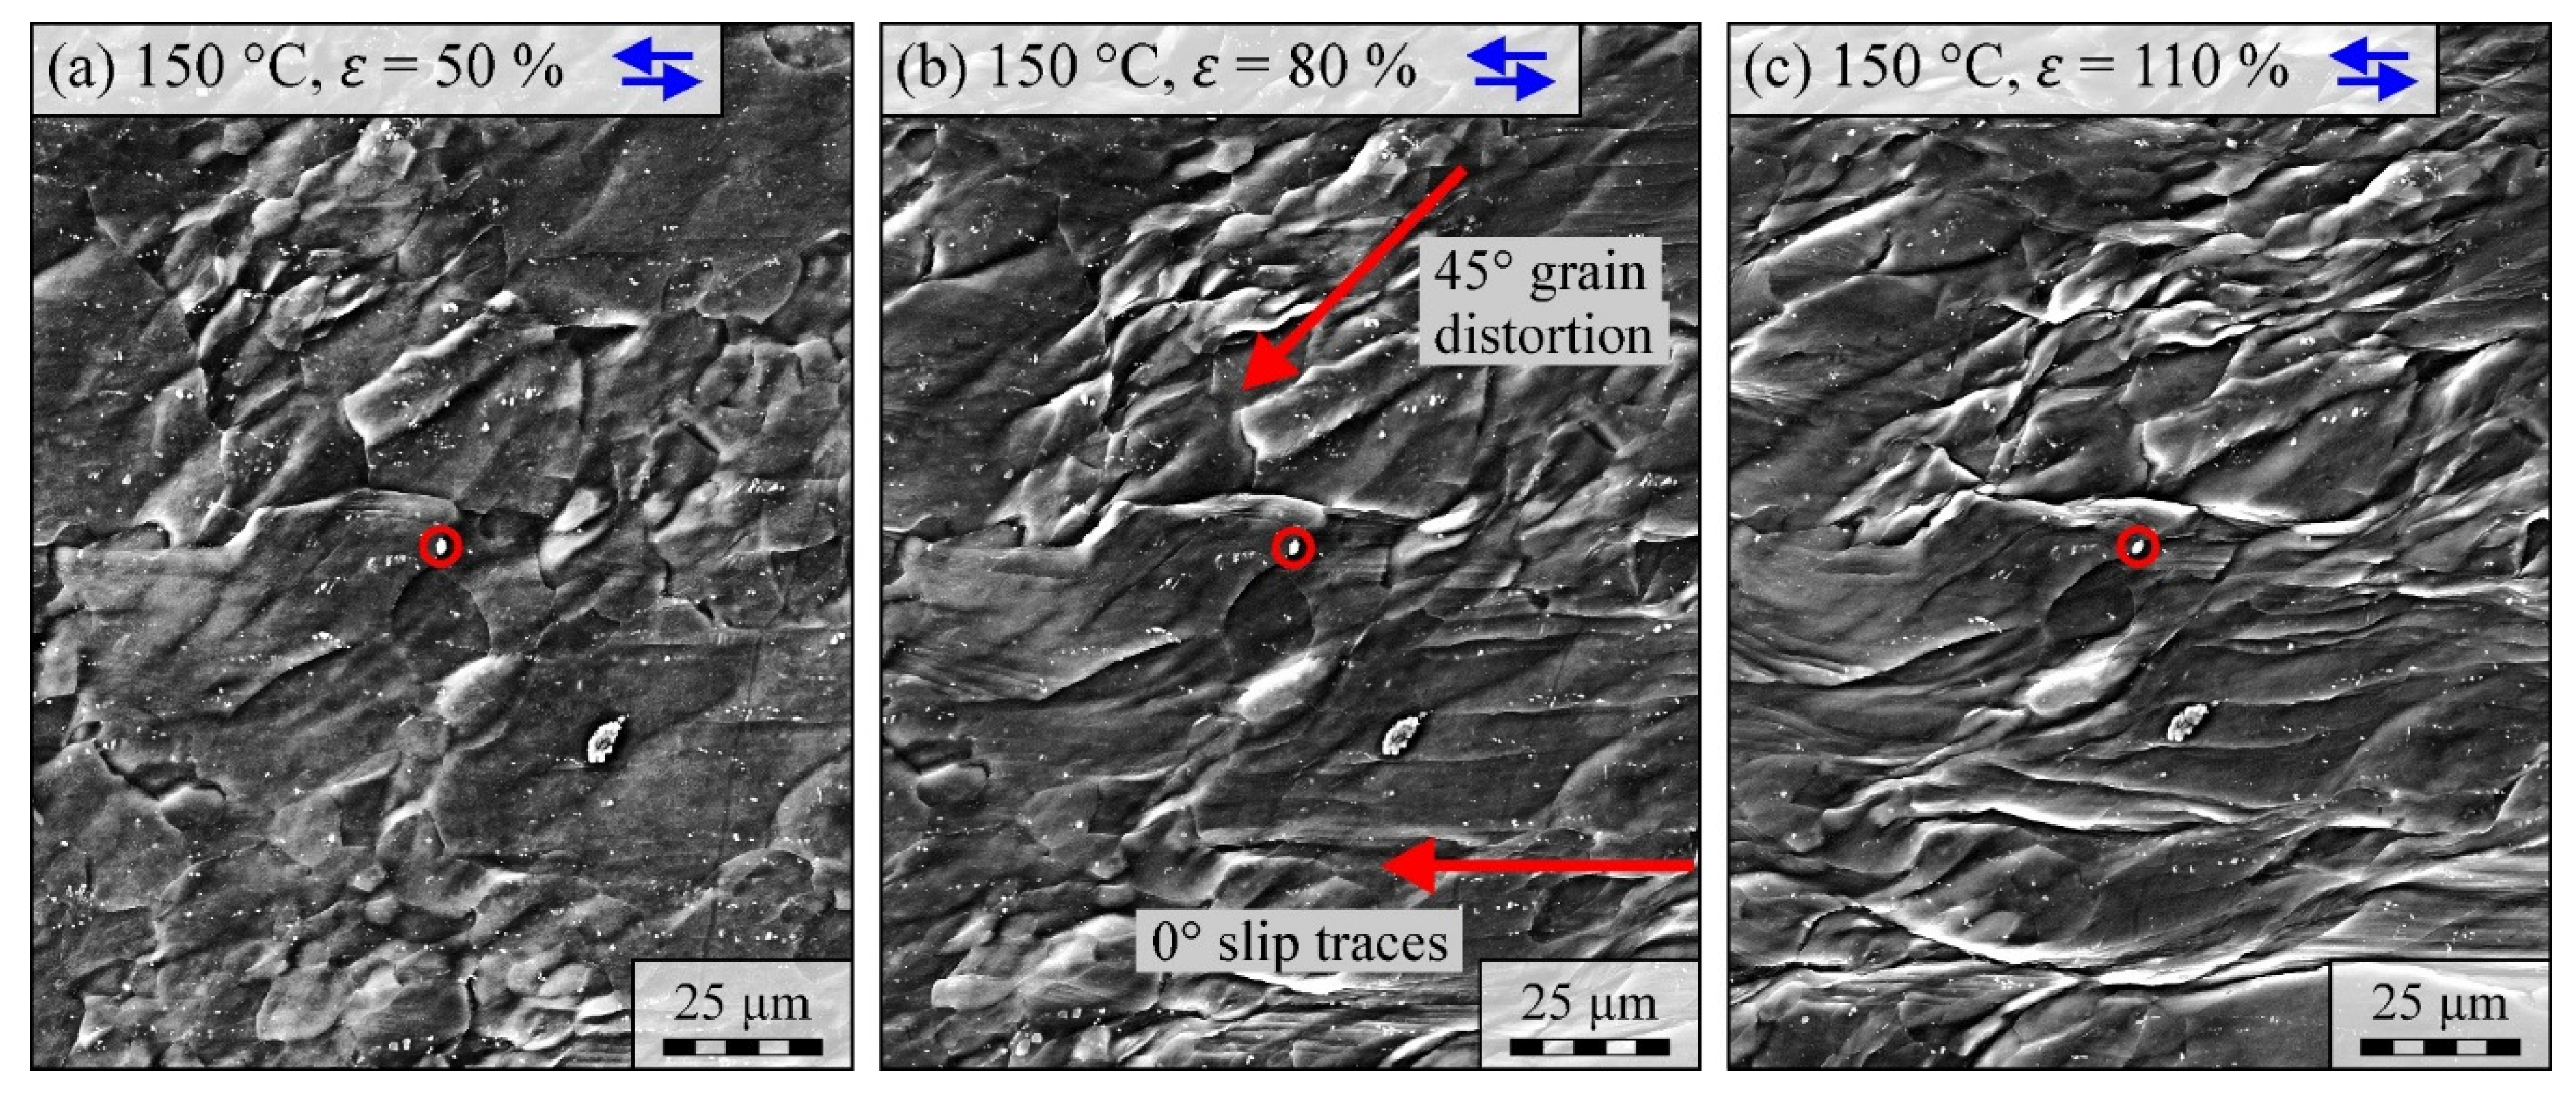
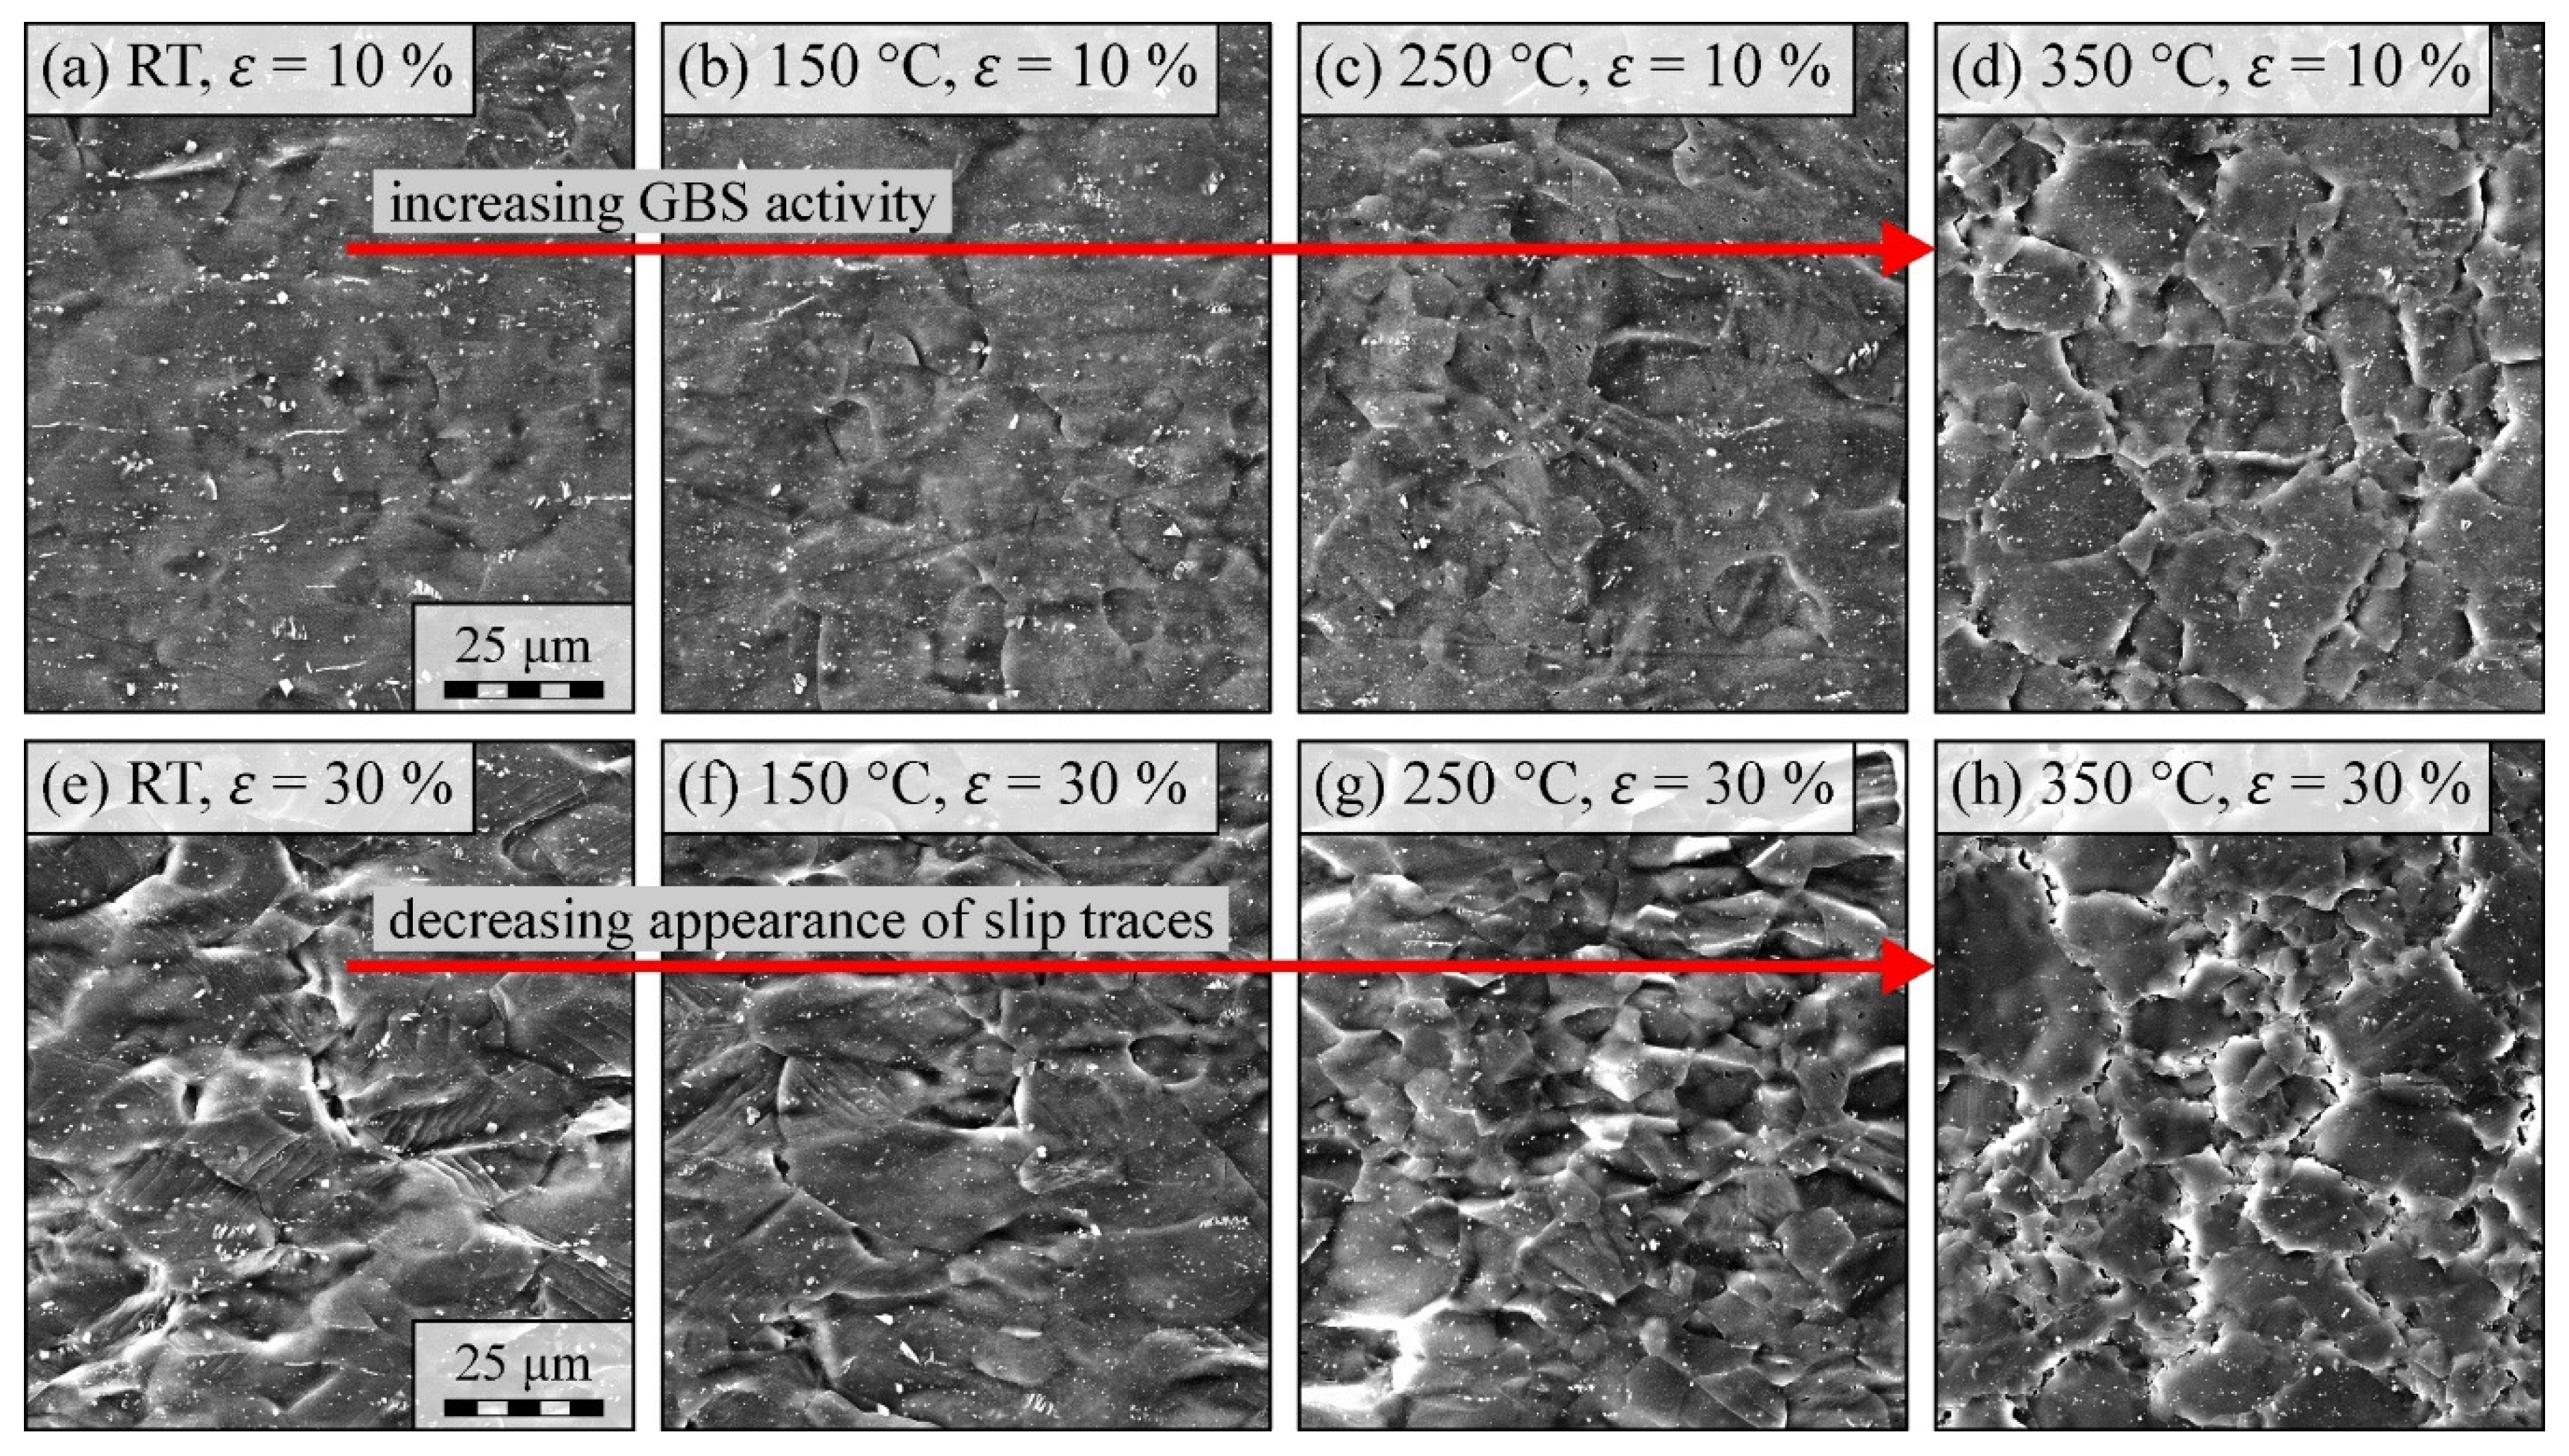
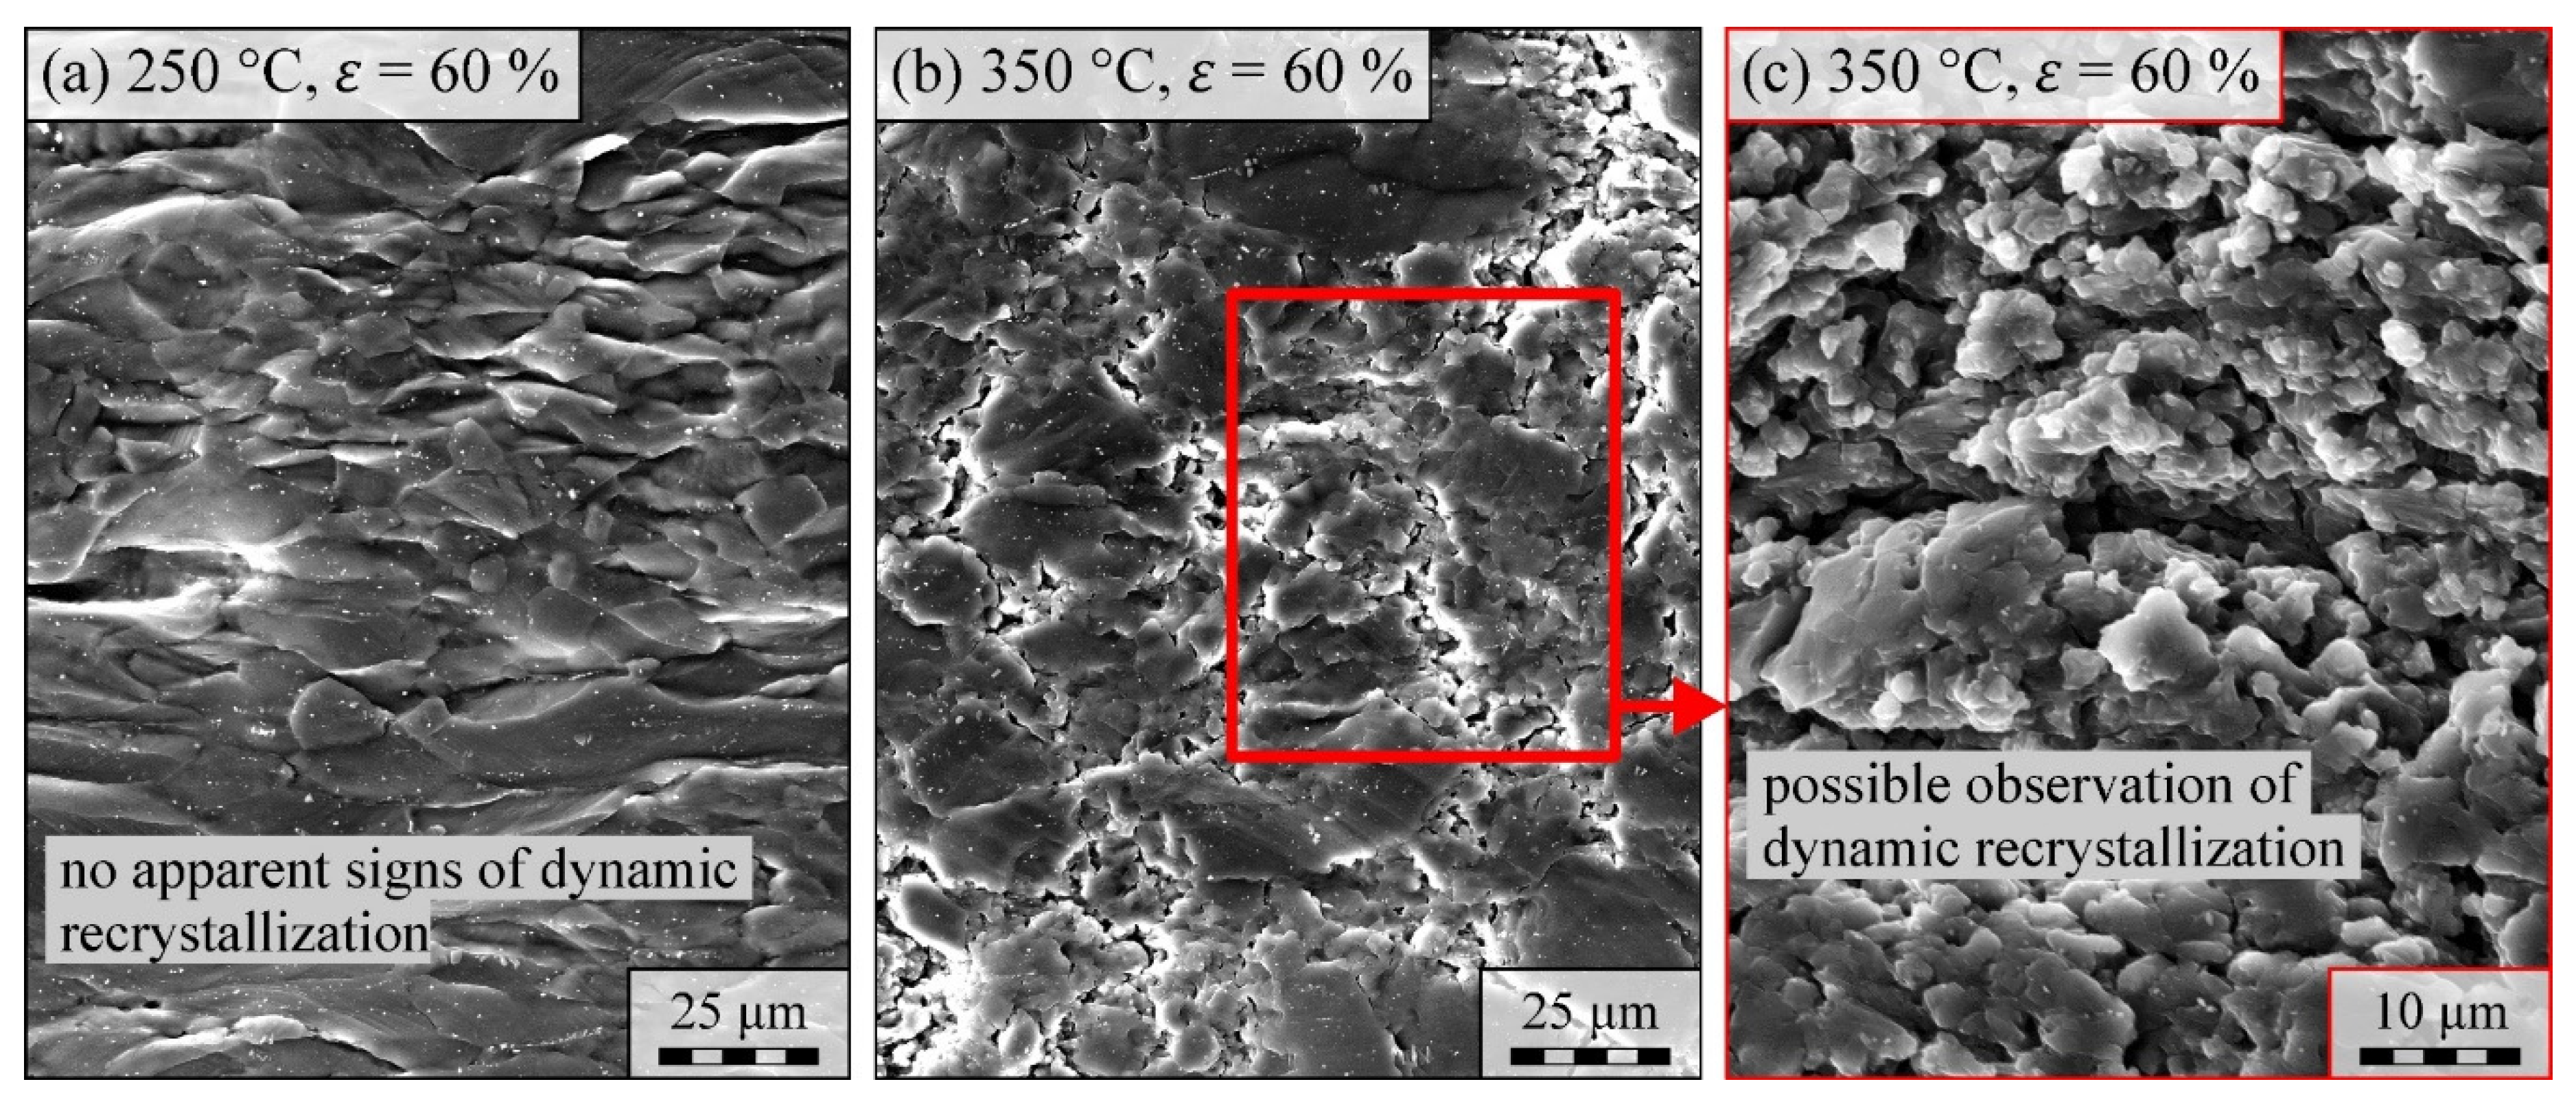
3.2. Deformation Mechanisms

In the following, in-situ SEM images from the specimen surface during loading are discussed. Here, the authors acknowledge that in the present investigations, the observed phenomena at the surface might not quite correspond to the events inside the sample volume. Surface observation represents a shear stress-free interface and offers the opportunity to gain new impressions about material mechanisms. In the unloaded condition, the specimen surface has a dark grey appearance with uniformly distributed second-phase particles in bright contrast ranging from 0.5 to 5 µm in size (see Appendix A, Figure A2). These particles have a composition that matches the alloying elements according to the γ-phase Mg17Al12 (larger particles) or Al-Mn-containing intermetallic compounds (smaller particles at grain boundaries) [33,34]. Due to the short etching time and the selected contrast conditions, no grain boundaries could be identified on the surface. As illustrated in Figure 4a–c for a simple tension specimen at 150 °C, grain distortion, grain reorientation through GBS, and slip traces from dislocation glide can clearly be identified as soon as loading is applied. By tracking individual particles (red circles in Figure 4a–c) the evolution of the surrounding grains could be observed as a function of applied strain. When comparing the sample surfaces in Appendix A, Figure A2, it can be seen that a surface-relief is induced with rising strains attributed to GBS (also see Reference [35]). Features in the images taken from high triaxiality and simple tension specimens did not differ. As indicated in Figure 4b, grain distortion took place along the loading direction, while the slip traces predominantly became visible at an angle of 45°. Especially at RT and 150 °C, these observations could be made quite clearly. In a similar study by Xia et al. [36] with Mg-AZ31 at RT, particular attention was paid to inhomogeneous strain fields, which cause the distortion of grains. In Reference [37], shear bands in AZ31, as well as in pure magnesium [38], are seen to be activated early and incur heavy local strains. As soon as GBS occurs, the grain boundaries, which are dimensionally like the EBSD initial state analysis, become clearly visible.
As can be expected, the simple shear specimen changed the stress mode, inducing an entirely different pattern at the specimen surface than in the tension specimens (see Figure 5a–c). Here, the visible slip traces appeared parallel to the loading direction, while the grains were distorted and rotated 45° away from it. This shows that the specimen geometry had, in fact, induced shear deformation along the loading direction. Nevertheless, the authors could also observe that with increasing deformation of the shear specimen, the grains and slip traces rotated back. At high strains (possible at 250 °C and 350 °C, though not shown Figure 5), this rotation ended in the grains aligning parallel to the loading direction and leaving a similar appearance as simple tension samples (comparable to Figure 4). Twinning could not be identified clearly in the present study, although the results of Reference [39] suggest that the parallel lines could be a sign thereof. If the orientation of slip traces within a grain changes suddenly, Reference [40] determined that this has to do with a local change in the active slip system. According to Reference [41], the change in slip systems during increasing local strains is related to increasing levels of connectivity between favorably oriented grains. It is stated in Reference [38] that twinning observed during in-situ examinations on the grain-scale does not follow the orientation of slip traces and is clearly identifiable. The perpendicular orientation of the loading direction towards the sharp basal texture points out, however, that the Schmid-factor of prismatic and pyramidal slip must be highest. In the present study, the occurrence of both twinning and basal slip is unlikely, especially at elevated temperatures.
The occurrence of both the phenomena of GBS, as well as of slip trace formation, exhibited a clear temperature-dependence (see Figure 6). As soon as loading was applied and as the first visible mechanism of deformation, GBS began to change the surface topography. The temperature-dependence can be observed in Figure 6a–d, where rising temperatures increased the activity, and thus, the contribution of GBS to deformation. As a result, the rising temperature decreased the appearance of slip traces (Figure 6e–h). The authors concluded that due to softening mechanisms, the dislocation density did not increase enough to make slip traces visible. The GBS observed at room temperature was considered to be related to locally inhomogeneous deformation, while pure GBS without shear band formation was the cause of surface undulation at temperatures above 250 °C, as stated by Reference [35]. As the critical resolved shear stresses of non-basal slip systems fall with increasing temperature, the probability of slip traces arising from a single slip mode per grain decreases greatly. According to Reference [41], the influence of grain sizes of neighboring grains has a great influence on the active deformation mechanism, which was why differences between single grains could be observed in this study as well. The authors of the present study further assume that GBS is generally more active at the surface, as these grains have more freedom of movement than grains in the bodies of the samples.
Lastly, a phenomenon that the authors presume to be a sort of dynamic recrystallization became visible in the later stages of 350 °C testing only. While extremely elongated grains and highly roughened topology characterized the surface of the 250 °C specimen (Figure 7a), the surface of the 350 °C specimen (Figure 7b) exhibited relatively equiaxial grains. The low distortion of these equiaxial grains at 350 °C suggested that they were not significantly involved in the deformation process. Leaving the surface open-pored, numerous smaller grains appeared increasingly in the interstices of these grains. As seen in Figure 7c, these smaller grains had angular—and no smooth—edges. These specific in-situ surface observations were unique to this study. Therefore, an unmistakable relation to the well-known mechanism of dynamic recrystallization with reference to supplementary studies could not be made.

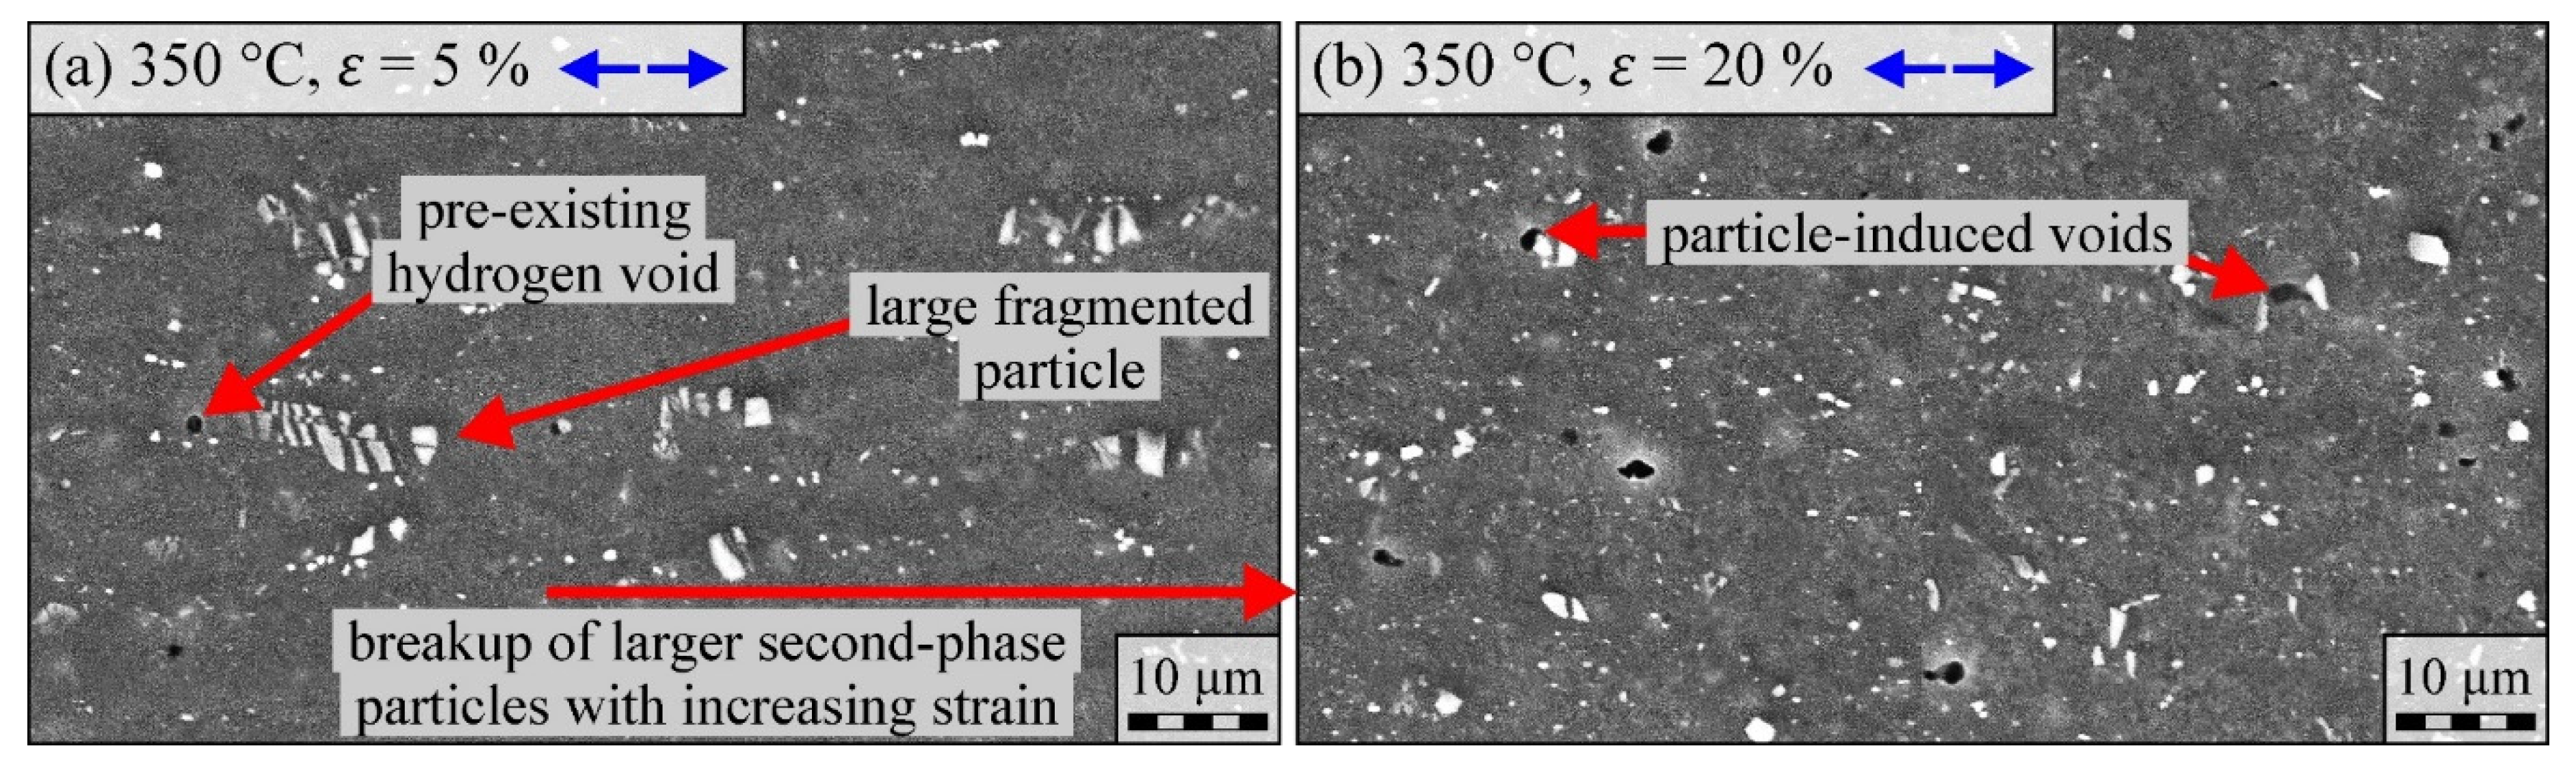
3.3. Damage Mechanisms

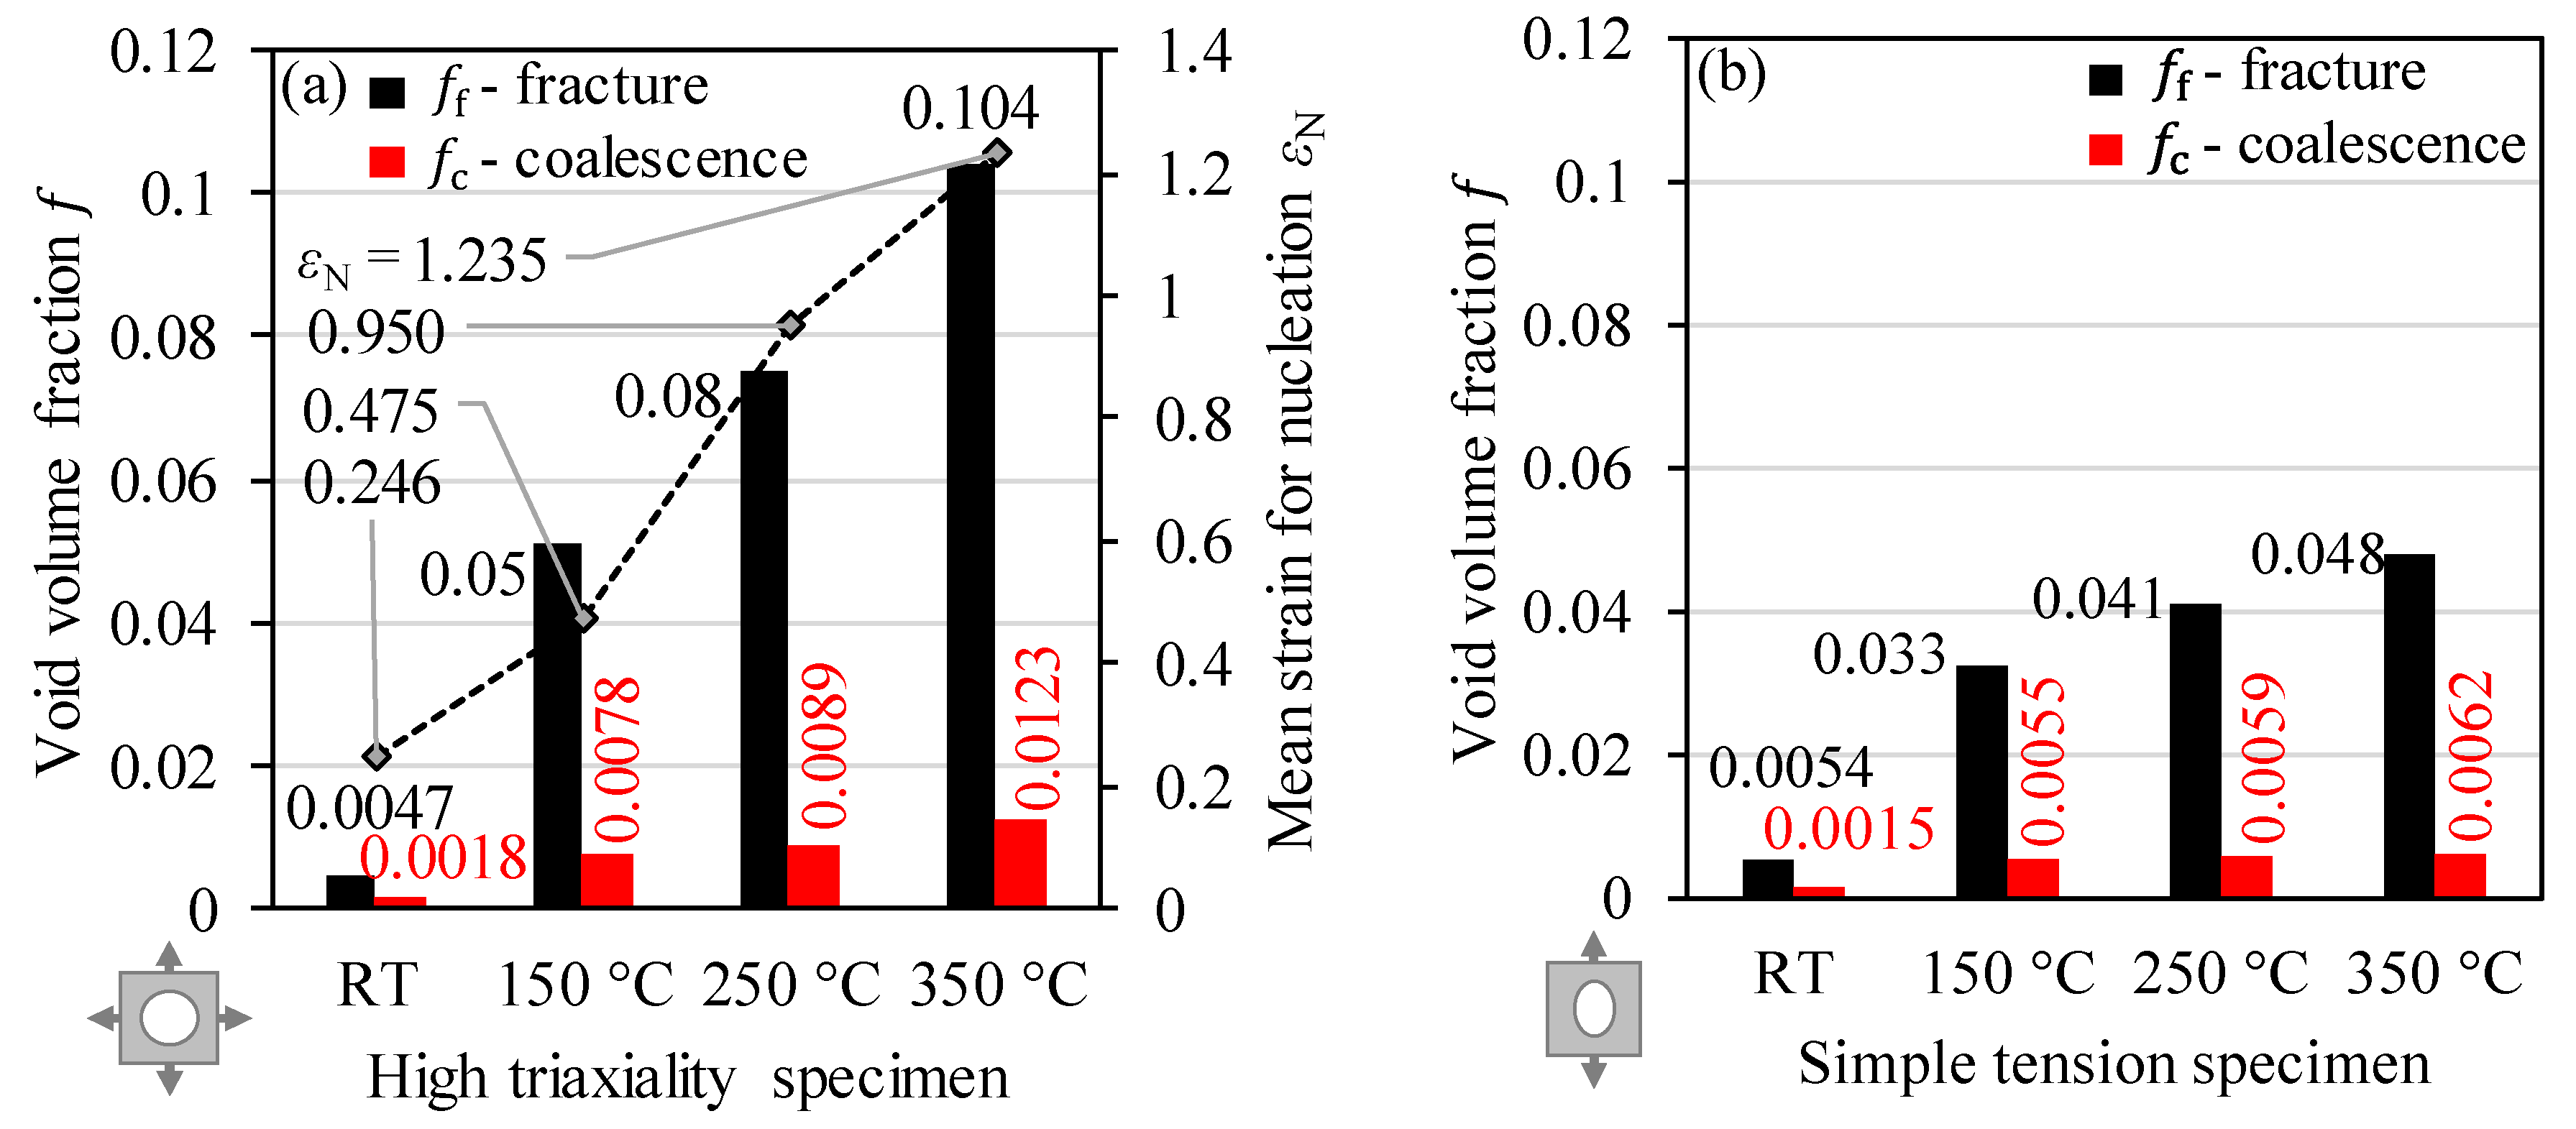
3.3.1. Initial Void Volume Fraction

The initial void volume fraction was determined on a non-loaded sample, with f 0 = 0.0004 ± 0.0001, by surface area fractions of matrix versus voids visible in the sample cross-section. It is reasonable to assume that the voids in f 0 originated from the TRC manufacturing process. This involved a very small proportion of existing micro-voids that result from the precipitation of hydrogen during solidification [14]. These voids were not eliminated in the subsequent hot rolling process. Based on a numerical evaluation, i.e., without experimental investigations, Wang et al. [20] and Zhao et al. [21] apply an initial void volume fraction of 0.001 for AZ31, which is twice as high. However, f 0 represents a property that is strongly dependent on the manufacturing process—e.g., casting or forming—and that should be determined separately for each material investigated.

3.3.2. Void Nucleation

The GTN model considers the dynamics of newly nucleated voids as a function of void-inducing particles. In the present work, this corresponds to the surface area fraction of the second-phase particles f N . The assumption that the totality of these particles could initiate the nucleation of voids corresponds to the definition in the primary literature [17,19]. Minus the initial void volume fraction in the non-loaded cross-section of a sample, f N was determined to be equal to 0.011 ± 0.003. Analogously to the initial void volume fraction, this value is strongly dependent on the microstructure (precipitation, phases, inclusions, etc.) and should not simply be taken from the literature. The mean strain for void nucleation ε N means that half of all voids that could be initiated by second-phase particles were formed at ε ¯ p = ε N . The void nucleation rate f ˙ nuc is subject to a Gaussian normal distribution with the standard deviation S N , see Equation (3). In the present work, ε N and S N were evaluated numerically, since they can only be obtained indirectly from the explicit representation of the void-development function using experimental data (see Figure 2, bottom graphs).

3.3.3. Void Coalescence and Failure

The void volume fraction at the onset of void coalescence f c was determined by means of the mean value of several line sections in the sample cross-section parallel to the direction of loading. Each line section indicated the course of f ( x ) as a function of the location x . As soon as void coalescence occurred, the increase in the curve changed and f c could be read directly from it (see Figure 2). The void volume fraction at the moment of failure f f was determined analogously, as the average value of the maxima of f ( x ) . The locations x for f c and f f are of crucial importance for the calibration of the GTN model because they make the correlation to the local strain possible. After the scales of the SEM images and the DIC analysis were adjusted, it was possible to read ε c and ε f directly. f c and f f were equally temperature-dependent (Figure 8a,b) and followed an almost linear relationship with increasing temperature. At RT, f c and f f assumed the lowest values for both sample types. The results show the largest void volume fraction at 350 °C.
During the determination of the void volume fraction, it was qualitatively evident that the voids became larger and larger from RT to 350 °C. This feature was also apparent in the analysis of the fracture surfaces. In addition, it was found that f c and f f in the notched tensile specimens were about twice as high as in the uniaxial tensile test. The high triaxiality of notched tensile specimens leads to rapid void growth, which explains the higher absolute values [15]. Ray and Wilkinson [9] indicate an f f value at RT of less than 0.005 for AZ31, which is significantly lower than the values found in the present work. Possible reasons for this are that the tensile specimens in Reference [9] had a very large notch radius, the computer tomography used only detected voids with a size of 5 µm or more, and that the tests were stopped. This means that at the time of analysis, the samples were just about to fail; on the contrary, in the present analysis, the specimens have reached failure elongation.

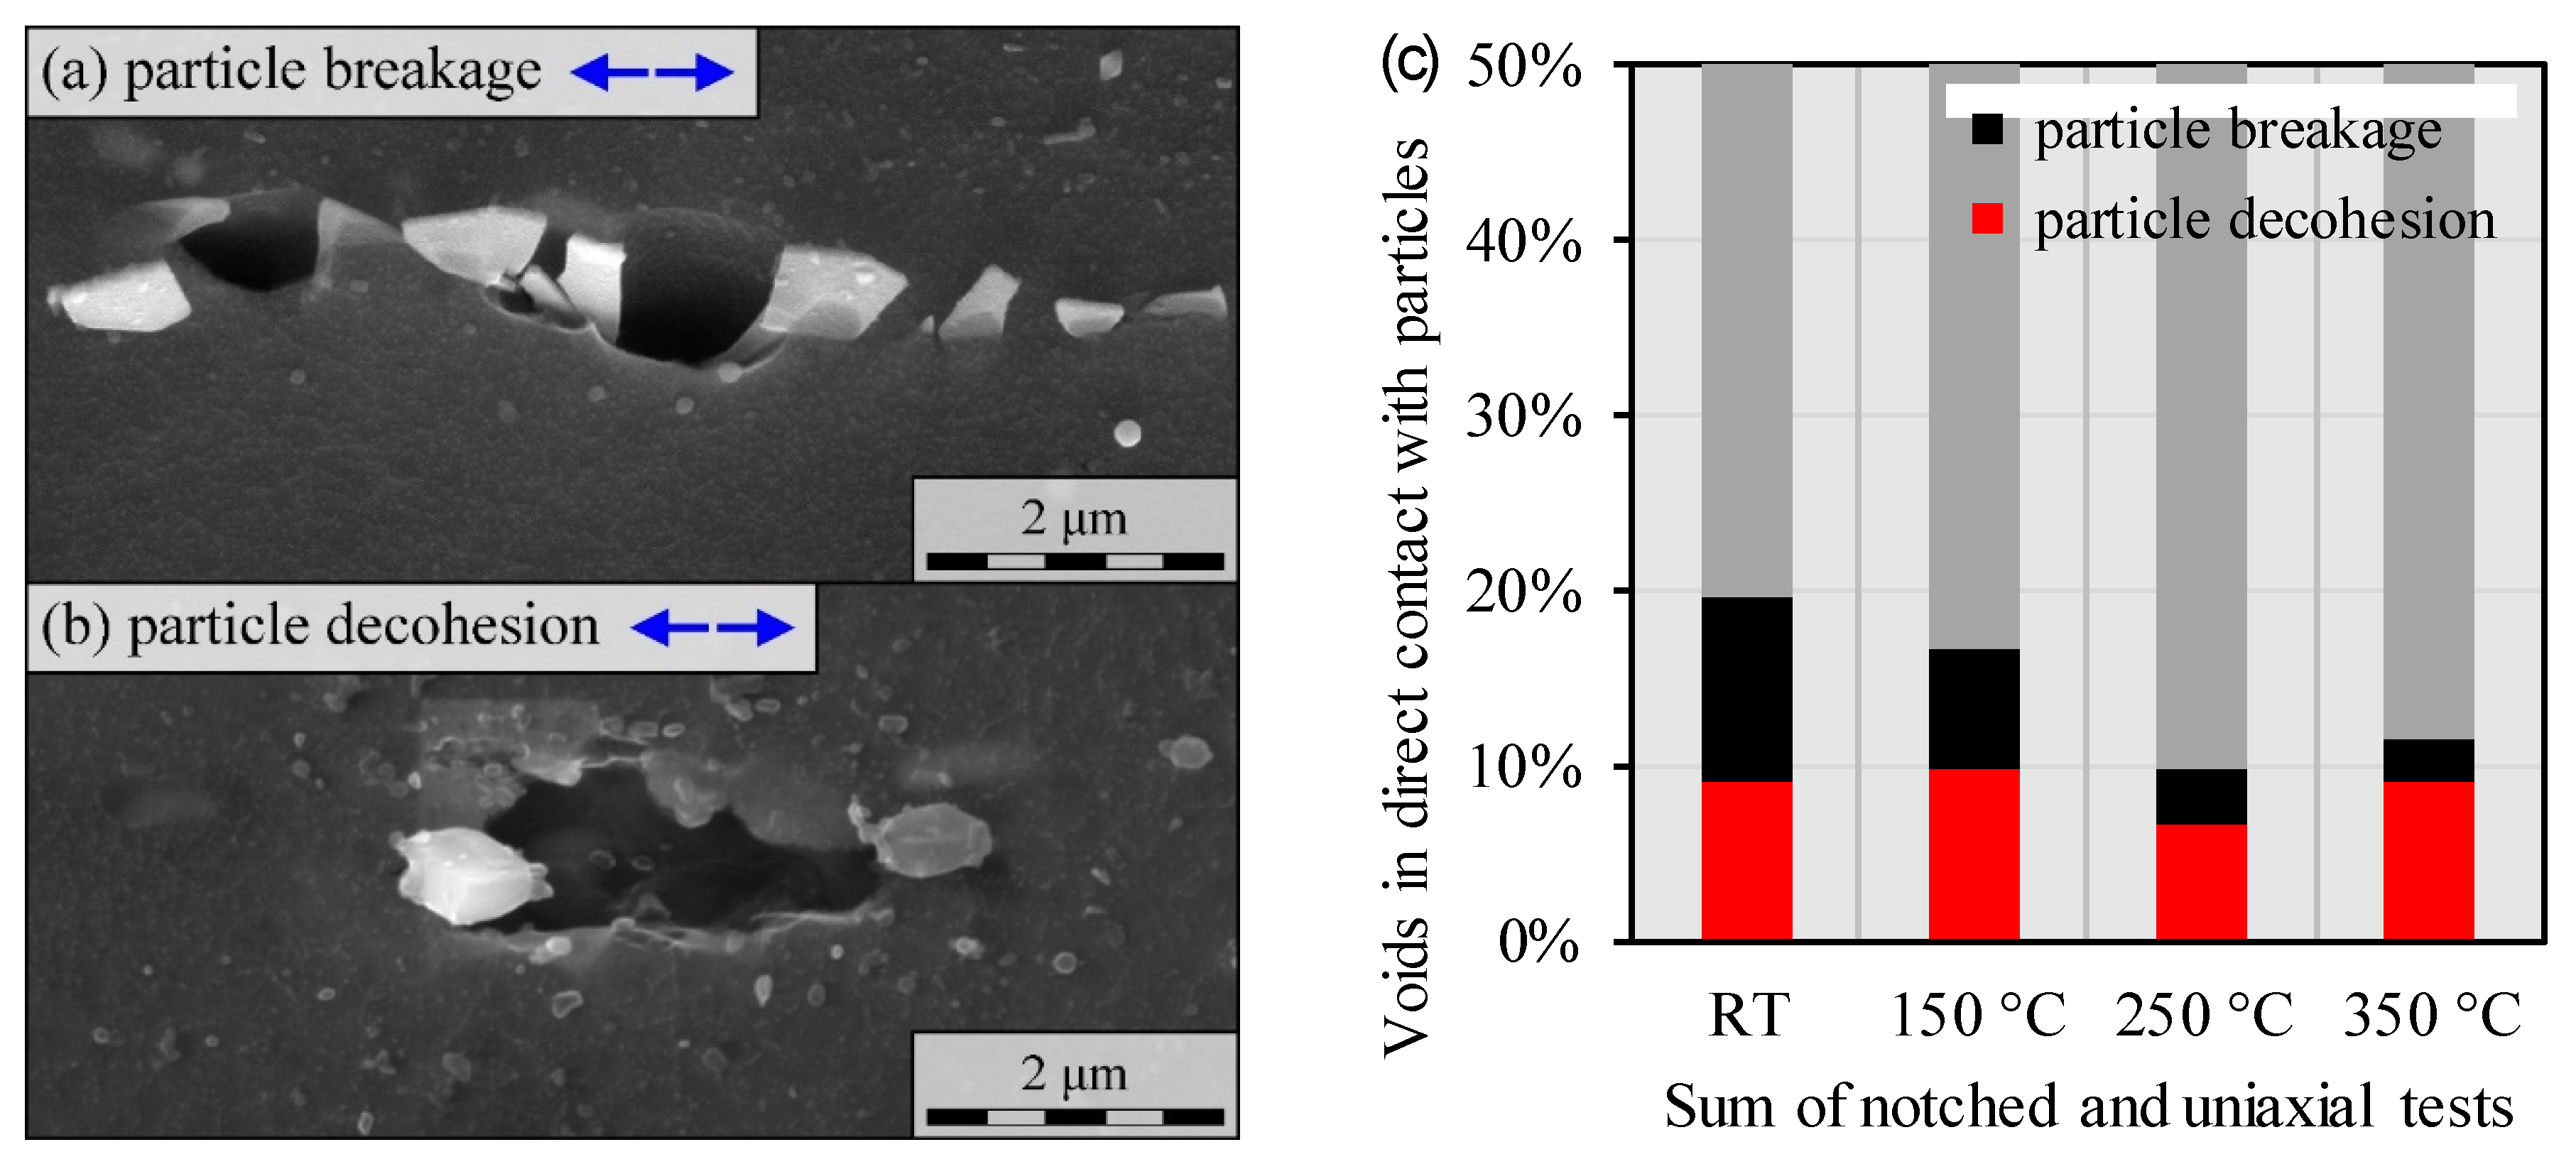
3.3.4. Role of Second Phase Particles

The evolution equation of the void volume fraction in the GTN model functions independently of the actual mechanism of void nucleation. The model cannot distinguish whether voids have formed in the vicinity of particles, at grain-boundary triple points, or at twin boundaries without explicitly introducing the nucleation microstructural feature into the model, as was done in References [42,43]. Since the second-phase particles were homogeneously distributed and did not form accumulations, premature failure, as in the investigations of Wang et al. [44], could not be assumed in this respect. Barnett [45] also describes a direct relationship between twin formation and void nucleation. Thus, twins initiate void nucleation within a grain, which then grow rapidly up to the grain boundaries. This includes, in particular, double twins—which, according to Ulacia et al. [46], are more likely to occur at high strain rates. The present investigations indicate that void nucleation must have taken place not only through second-phase particles, but also at grain boundaries. When considering single-phase metals, Bieler et al. [47] show that void nucleation is mainly caused by damaging alternating effects of dislocations at grain boundaries. Against this background, the representative accuracy of the damage model could be optimized by adding further terms for the respective void nucleation mechanisms, such as in Reference [48]. However, this would also mean that the dynamics of the respective void nucleation mechanisms could be quantified.
In order to clarify the void nucleation mechanism, a distinction is made in the following between particle breakage and decohesion from the matrix. The matrix material appears greyish, voids are significantly darker or black, and particles are white. The mechanism of void nucleation is strongly dependent on the material properties, such as particle strength, size, and shape, as well as the strain hardening behavior of the matrix. According to Benzerga and Leblond [49], the decohesion process occurs in soft matrix materials, while particle breakage occurs in hard matrix materials. In the present work, it was observed that a series of large fragmented second-phase particles (>5 µm) were present in areas of low strain (Figure 9a). In areas of high plastic strain, especially near the fracture surface, the particle size rarely exceeded one micrometer (see Figure 9b). Spherical voids without direct contact with a particle may have been in the matrix already and were the result of the initial void volume fraction.
Large particles were broken by the deformation process and then acted as nucleation sites for void formation. The fact that the mechanisms of both particle breakage and decohesion from the matrix were active was confirmed by SEM images. As can be observed in Figure 10a, the breakage of the particle (white) led to the nucleation of the void. From a particle size of approximately 1 µm upwards, however, the mechanism of decohesion was dominant (Figure 10b). In the case of the investigated material, which mechanism of void nucleation was dominant depended on the particle size. It was also found during the investigations that some voids contained several particles. This is possibly an indication that voids that were once formed individually had coalesced at high strain levels.
In addition to the analysis of the void volume fraction, another quantified factor was how many of the voids were still in direct contact with particles after the test. In each of the cross-sections for the statistics presented in Figure 10c, an average of 2000 to 3000 voids were evaluated. Lhuissier et al. [11] find that 30% of the voids observed in AZ31 hot tensile tests were in direct contact with particles. In the present study, this value lay between 10 and 20% depending on the temperature.
It may be assumed that the actual proportion of voids that were in direct contact with particles during deformation was higher, since the bond between particles and the matrix is significantly reduced during void growth. In addition, the mechanical grinding and subsequent polishing of the cross-sections removed many particles, which distorted these statistics. Furthermore, existing hydrogen micro-cavities, which do not necessarily contain particles, cannot be distinguished after the test [14]. The cavities do not necessarily have to be spherical, since the alloy under investigation exhibits high GBS activity at higher temperatures, and thus, develops complex cavity shapes [12]. Nemcko et al. [50] also show that the anisotropic material behavior of the magnesium crystal can lead to the nucleation of irregularly shaped voids.
With increasing temperature, the incidence of voids with broken particles decreases because the strength of the matrix decreases, and voids tend to form through decohesion from the matrix. The fact that at higher temperatures, there are fewer voids in contact with particles may be attributable to voids becoming significantly larger than the particles that initiate them. At low temperatures, more voids are formed, but they do not become quite as large, due to the low degree of local strain. Many particles, thus, remain trapped in the void. The distance between voids is a decisive factor for the coalescence phase, and thus, for the ultimate failure of the sample [51]. Because void nucleation and cavity growth occur over large strain ranges, many voids of different sizes are created. In addition, large voids influence the growth behavior of smaller voids in their environment [52]. This could be confirmed for the investigated material, and in the vicinity of the fracture surface.

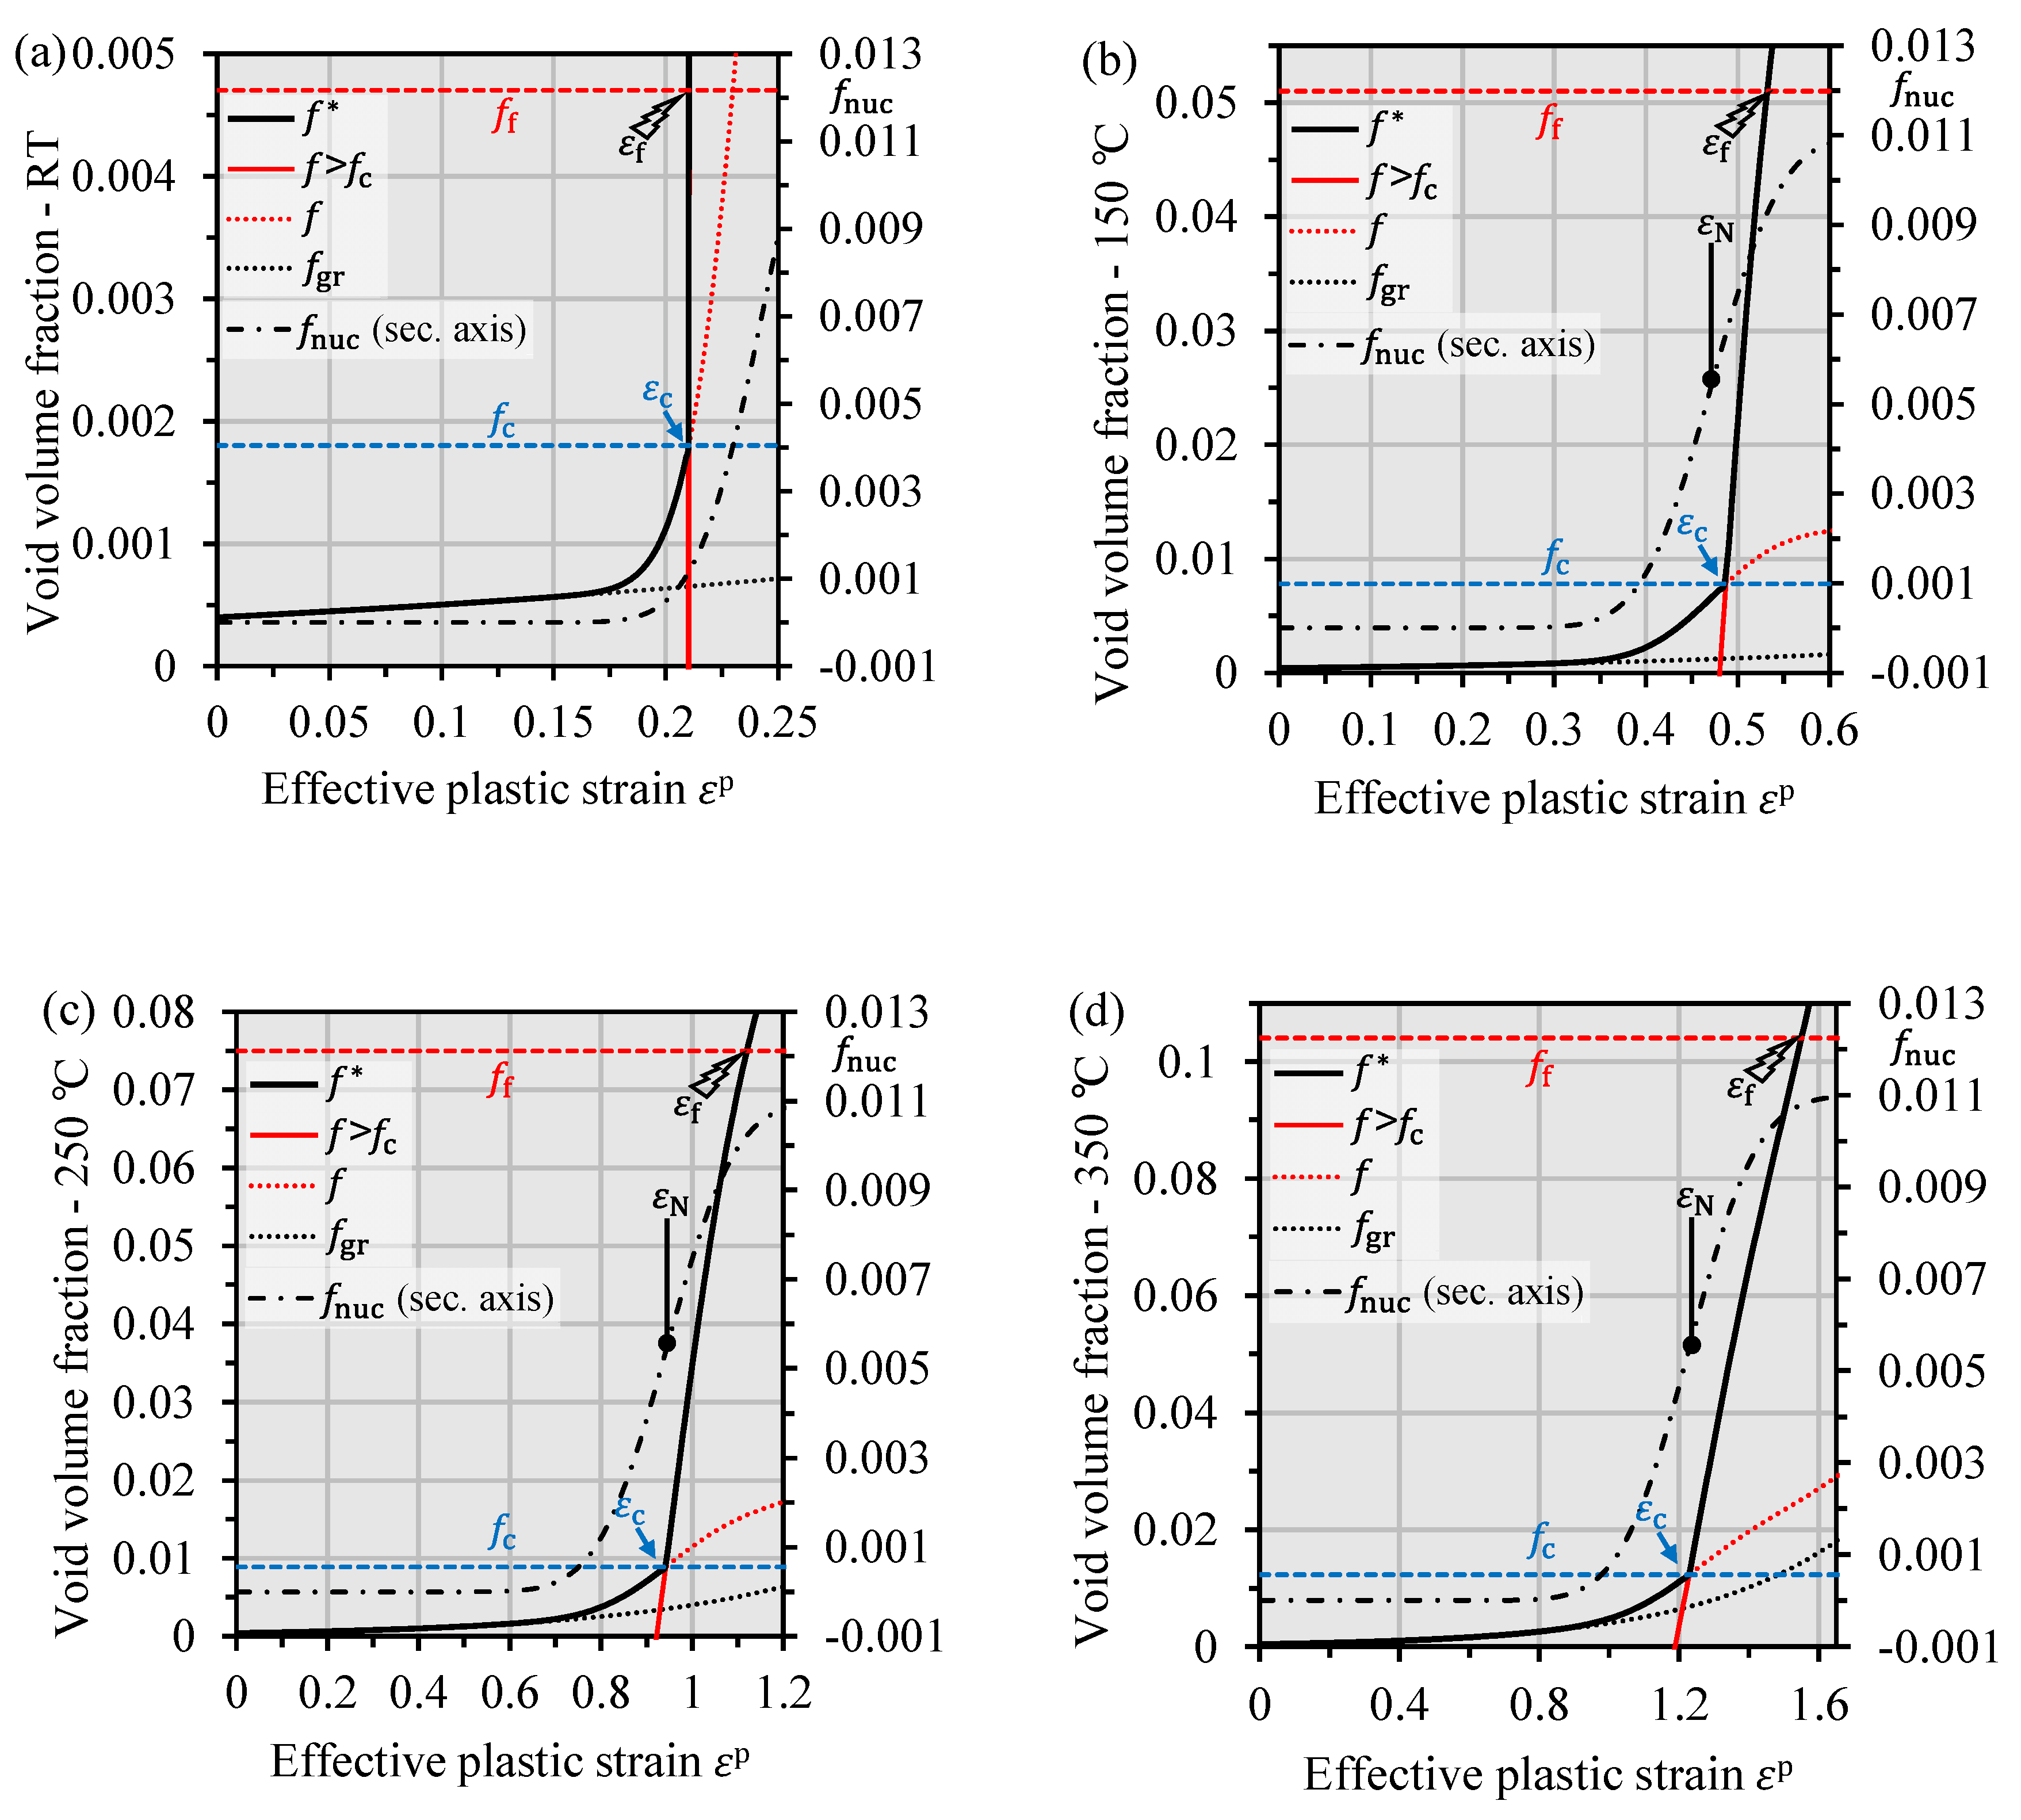
3.3.5. Calibration of Growth Parameters and Normal Distribution

The GTN parameters q 1 , also known as the growth parameters, are usually specified in the literature as q 1 = 1.5, q 2 = 1, and q 3 = q 1 2 = 2.25 in accordance with the recommendations of Tvergaard and Needleman [17]. They influence the shape and size of the yield surface and have a direct influence on the void growth rate f ˙ gr through the flow rule. Figure 11a–d shows how the void volume fraction behaved in the numerical simulation as a function of the effective plastic strain ε ¯ p for the model parameters developed in the present study. An explicit formulation of the void growth rate from Prahl et al. [53,54] was used for this representation, integrating the equations for a single material point. This was followed by the application of the associated flow rule (the equation of the evolution of ε ¯ p ) in place of the trace of the strain rate tensor ε ˙ p in
f ˙ gr = ( 1 f ) · trace ( ε ˙ p ) = ( 1 f ) Λ ˙ Φ GTN σ H .
Under the assumption that flow occurs and that σ v = σ y stands without feedback from f , the specific void volume fraction f gr can be expressed as a function of the effective plastic strain ε ¯ p [53]:
f gr = f 0 · exp ( 3 2 q 1 q 2 sinh ( 3 2 q 2 η ) ε ¯ p ) .
It was evident that the volume fraction of growing voids f gr was dependent on the initial void volume fraction f 0 and the triaxiality factor η , as well as q 1 and q 2 . In the following a triaxiality factor η = 0.5 is assumed. Since the GTN model also represents void nucleation, due to second-phase particles, the void growth rate f ˙ is extended by the void volume fraction of new voids f nuc . This can be clearly seen in Figure 11, where f = f nuc + f gr . The sigmoidal curve of f nuc (secondary axes) starts at zero and reaches its maximum at f nuc = f N = 0.0011. Viewed numerically, the newly formed voids are added to the initial void density as a function of the strain ε ¯ p , and then increase at the same rate. In the GTN model, ε N is the parameter that indicates from which effective plastic strain half of all of the particles have led to the nucleation of a void. Its change results in the horizontal displacement of f nuc . S N is the standard deviation and indicates the slope in the sigmoidal curve.
f represents the partially continuous function which, in the flow potential, leads to a reduction of the flow area along the hydrostatic axis. According to Equation (2), a case distinction is made depending on f c in order to determine the course of f in association with the active damage mechanisms. Therefore, the course of f first runs along f (nucleation + growth) and from f c along “ f > f c ” (nucleation + growth + coalescence). It is clear that the rate of f increases from f c . At this point, the function is not continuous and can lead to a bend in the course of f . As soon as f is equal to f f , the critically damaged elements are eliminated in the FEM simulation. It can be seen from the range of values of the horizontal axes in Figure 11 that the local strains varied greatly depending on the temperature. The rate of increase of the void volume fraction is approximately 0.02 at RT and 0.06–0.08 at temperatures ranging between 150 °C to 350 °C and a constant triaxiality of 0.5.
In the present work, the parameters q 1 , q 2 , ε N and S N , which could not be measured directly in the experiment, were numerically calibrated. Through the direct correlation of f c and f f with ε c and ε f (cf. Figure 11), clear boundary parameters could be established:
f ( ε ¯ p = 0 ) = f 0
f ( ε ¯ p = ε c ) = f c
f ( ε ¯ p = ε f ) = f f .
The calibration was performed under the assumption that constant stresses prevailed with a triaxiality factor of η = 0.5. This is closest to the mean stress state of the notched tensile specimens used. Due to the quadratic cross-section here, the generally assumed triaxiality factor of 0.6 from round notched samples cannot be assumed.
The regression analysis performed using the Solver add-in program in Microsoft Excel showed that it was possible to calibrate the model with just two of the four remaining parameters q 1 , q 2 , ε N and S N , and without violating the boundary conditions. In the context of the present work, it was decided to set the parameters q 1 and q 2 according to the recommendations of Tvergaard and Needleman [17], thus, ensuring better comparability of the model parameters for other studies. Nevertheless, it should be noted that the course of f was highly sensitive to influence from q 1 and q 2 , which would be advantageous in a representation of the exact course. In the present study, only the three boundary conditions Equations (7)–(9) had to be fulfilled. The set of temperature-dependent GTN model parameters developed for the investigated material is listed in the following Table 2:
The determined parameters also reflect the real void nucleation process very well. In Figure 11, it can be seen that f nuc has not yet reached its maximum before it fractures at f = f f . This comes remarkably close to the experimental results, because both the analysis of the fracture surfaces and the analysis of the proportion of voids in direct contact with second-phase particles indicated that not all particles contributed to void nucleation. Furthermore, the parameters for the GTN model showed a linear dependence on temperature, which can be represented with good approximation by Equations (10)–(13).
S N = 0.0004 · ϑ + 0.0107       ( R 2 = 0.977 )
ε N = 0.0031 · ϑ + 0.1249       ( R 2 = 0.967 )
f c = 0.00003 · ϑ + 0.0019       ( R 2 = 0.953 )
f f = 0.0003 · ϑ + 0.0015       ( R 2 = 0.993 )
Thus, and analogous to the hardening and softening behavior and anisotropic hardening, a continuously differentiable parameter from RT to 350 °C is available for damage modeling in FEM simulation.

4. Summary and Conclusions

With the use of in-situ SEM tensile tests, twin-roll cast, hot rolled, and annealed magnesium AZ31 sheet was studied with respect to active ductile damage, as well as deformation mechanisms during temperatures ranging from room temperature to 350 °C. Three specimen types were examined for simple tension, high triaxiality, and simple shear stress states. Furthermore, post-mortem analyses of specimen cross-sections were conducted. Here, ductile damage through void nucleation, coalescence, and growth was linked to digital image correlation strain measurements to determine material parameters. Based on the damage model by Gurson–Tvergaard–Needleman (the GTN model), these parameters were established to be used for finite element simulations with AZ31 magnesium (see Table 2). An explicit formulation of the void growth rate has been chosen to prove the functionality of the parameters. From the presented study, the authors conclude:
  • SEM in-situ images have shown that the specimen surface shows no characteristic signs of ductile damage, but rather allows statements to be made about the deformation mechanisms;
  • Near-surface phenomena of slip traces, grain boundary sliding, and dynamic recrystallization could be observed as functions of temperature and stress state;
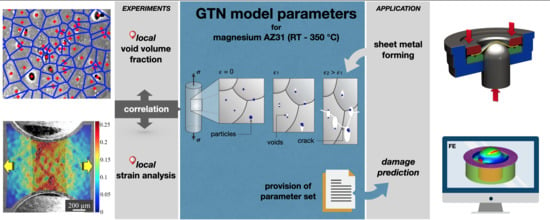
  • For the first time in literature, an experimental method is proposed and validated to determine all GTN model parameters for sheet metal;
  • The post-mortem analyses confirm that pre-existing hydrogen voids, particle-induced voids, as well as voids from grain boundary failure or twin-boundary failure were responsible for ductile damage accumulation. Nevertheless, the post-mortem analyses do not provide sufficient insight into the exact statistics of void origin;
  • The established GTN model parameters show a linear positive dependence on temperature. Furthermore, this parameterization represents a milestone in the ductile damage modeling of Mg thin sheet, because the large temperature ranges that can occur in sheet metal forming can be simulated;
  • The authors conclude that the anisotropic deformation properties can still be modeled as soon as they are considered in the yield stress of the GTN model.

Author Contributions

Conceptualization, T.H. and S.O.; methodology, T.H. and S.O.; software, T.H.; validation, M.U., S.O. and U.P.; formal analysis, T.H.; investigation, T.H.; resources, S.O., U.P. and R.K.; data curation, T.H.; writing—original draft preparation, T.H. and S.O.; writing—review and editing, M.U., U.P. and R.K.; visualization, T.H.; supervision, U.P. and R.K.; project administration, T.H.; funding acquisition, S.O. and M.U. All authors have read and agreed to the published version of the manuscript.

Funding

The authors thank the German Research Foundation (DFG) for its financial support of the project “Characterisation and modelling of the biaxial material behaviour of twin-roll cast, hot rolled, and annealed AZ31 sheets” (AW6/34-1; UL471/3-1). This research bears the DFG grant number 396576920. Further, S. Osovski acknowledges the financial support provided by the Pazy foundation young researchers award grant number 1176.

Conflicts of Interest

The authors declare no conflict of interest. The funders had no role in the design of the study; in the collection, analyses, or interpretation of data; in the writing of the manuscript, or in the decision to publish the results.

Appendix A

Figure A1. (a) Grain orientation map of the specimen cross-section in ND (normal direction)-TD (transverse direction) plane; the color grading indicates the crystal plane normal, which is parallel to ND; (b) intragranular misorientation map on the identical area of analysis.
Crystals 10 00856 g0a1
Figure A2. In the undeformed condition, the specimen surface has a dark grey appearance with uniformly distributed second-phase particles in bright contrast; Here, SEM images of (a) undeformed sample surface as well as continuously increased strain at (b) 5%, (c) 10%, and (d) 15%, are shown.
Crystals 10 00856 g0a2

References

  1. Cao, T. Models for ductile damage and fracture prediction in cold bulk metal forming processes. Int. J. Mater. Form. 2017, 10, 139–171. [Google Scholar] [CrossRef]
  2. Wu, Z.; Curtin, W.A. The origins of high hardening and low ductility in magnesium. Nature 2015, 526, 62–67. [Google Scholar] [CrossRef] [PubMed] [Green Version]
  3. John Neil, C.; Agnew, S. Crystal plasticity-based forming limit prediction for non-cubic metals: Application to Mg alloy AZ31B. Int. J. Plast. 2009, 25, 379–398. [Google Scholar] [CrossRef]
  4. Barnett, M. Influence of deformation conditions and texture on the high temperature flow stress of magnesium AZ31. J. Light Met. 2001, 1, 167–177. [Google Scholar] [CrossRef]
  5. Barnett, M. A taylor model based description of the proof stress of magnesium AZ31 during hot working. Metall. Mater. Trans. A 2003, 34, 1799–1806. [Google Scholar] [CrossRef] [Green Version]
  6. Kim, W.; Lee, B. Factors influencing tensile ductility of ultrafine-grained Mg–3Al–1Zn alloy sheet at elevated temperatures. Mater. Sci. Eng. A 2010, 527, 5984–5989. [Google Scholar] [CrossRef]
  7. Kim, W.; Chung, S.; Chung, C.S.; Kum, D. Superplasticity in thin magnesium alloy sheets and deformation mechanism maps for magnesium alloys at elevated temperatures. Acta Mater. 2001, 49, 3337–3345. [Google Scholar] [CrossRef]
  8. Nemcko, M.; Wilkinson, D. On the damage and fracture of commercially pure magnesium using x-ray microtomography. Mater. Sci. Eng. A 2016, 676, 146–155. [Google Scholar] [CrossRef]
  9. Ray, A.; Wilkinson, D. The effect of microstructure on damage and fracture in AZ31B and ZEK100 magnesium alloys. Mater. Sci. Eng. A 2016, 658, 33–41. [Google Scholar] [CrossRef]
  10. Kondori, B.; Benzerga, A. Modeling damage accumulation to fracture in a magnesium-rare earth alloy. Acta Mater. 2017, 124, 225–236. [Google Scholar] [CrossRef] [Green Version]
  11. Lhuissier, P.; Scheel, M.; Salvo, L.; Di Michiel, M.; Blandin, J. Continuous characterization by X-ray microtomography of damage during high-temperature deformation of magnesium alloy. Scr. Mater. 2013, 69, 85–88. [Google Scholar] [CrossRef]
  12. Lhuissier, P.; Scheel, M.; Salvo, L.; Boller, E.; Di Michiel, M.; Blandin, J. 4D Damage Characterization during Superplastic Deformation of Magnesium Alloys. MSF 2012, 735, 61–66. [Google Scholar] [CrossRef]
  13. Rashed, H.M.M.A.; Robson, J.; Bate, P.; Davis, B. Application of X-ray microtomography to analysis of cavitation in AZ61 magnesium alloy during hot deformation. Mater. Sci. Eng. A 2011, 528, 2610–2619. [Google Scholar] [CrossRef]
  14. Toda, H.; Shamsudin, Z.; Shimizu, K.; Uesugi, K.; Takeuchi, A.; Suzuki, Y.; Nakazawa, M.; Aoki, Y.; Kobayashi, M. Cavitation during high-temperature deformation in Al–Mg alloys. Acta Mater. 2013, 61, 2403–2413. [Google Scholar] [CrossRef]
  15. Kondori, B.; Benzerga, A. Effect of Stress Triaxiality on the Flow and Fracture of Mg Alloy AZ31. Metall. Mater. Trans. A 2014, 45, 3292–3307. [Google Scholar] [CrossRef]
  16. Gurson, A. Continuum Theory of Ductile Rupture by Void Nucleation and Growth. J. Eng. Mater. Technol. 1977, 99, 2–15. [Google Scholar] [CrossRef]
  17. Tvergaard, V.; Needleman, A. Analysis of the cup-cone fracture in a round tensile bar. Acta Metall. 1984, 32, 157–169. [Google Scholar] [CrossRef]
  18. Tvergaard, V. Influence of voids on shear band instabilities under plane strain conditions. Int. J. Fract. 1981, 17, 389–407. [Google Scholar] [CrossRef]
  19. Chu, C.; Needleman, A. Void Nucleation Effects in Biaxially Stretched Sheets. J. Eng. Mater. Technol. 1980, 102, 249. [Google Scholar] [CrossRef]
  20. Wang, R.; Chen, Z.; Li, Y.; Dong, C. Failure analysis of AZ31 magnesium alloy sheets based on the extended GTN damage model. Int. J. Miner. Metall. Mater. 2013, 20, 1198–1207. [Google Scholar] [CrossRef]
  21. Zhao, P.; Chen, Z.; Dong, C. Damage and Failure Analysis of AZ31 Alloy Sheet in Warm Stamping Processes. J. Mater. Eng. Perform. 2016, 25, 2702–2710. [Google Scholar] [CrossRef]
  22. Costa Mattos, H.; Minak, G.; Di Gioacchino, F.; Soldà, A. Modeling the superplastic behavior of Mg alloy sheets under tension using a continuum damage theory. Mater. Des. 2009, 30, 1674–1679. [Google Scholar] [CrossRef]
  23. Kawalla, R.; Oswald, M.; Schmidt, C.; Ullmann, M.; Vogt, H.-P.; Cuong, N. Development of a strip-rolling technology for Mg alloys based on the twin-roll-casting process. Miner. Met. Mater. Soc. 2008, 177, 182. [Google Scholar]
  24. Kawalla, R.; Ullmann, M.; Oswald, M.; Schmidt, C. Properties of strips and sheets of magnesium alloy produced by casting-rolling technology. In Proceedings of the 7th International Conference on Magnesium Alloys and Their Applications, Dresden, Germany, 2 January 2007. [Google Scholar]
  25. Henseler, T.; Ullmann, M.; Kawalla, R.; Berge, F. Influence of the Sheet Manufacturing Process on the Forming Limit Behaviour of Twin-Roll Cast, Rolled and Heat-Treated AZ31. Key Eng. Mater. 2017, 746, 154–160. [Google Scholar] [CrossRef]
  26. Ullmann, M.; Berge, F.; Neh, K.; Kawalla, R. Development of a rolling technology for twin-roll cast magnesium strip. Metalurgija 2015, 4, 711–714. [Google Scholar]
  27. Graf, M.; Henseler, T.; Ullmann, M.; Kawalla, R.; Prahl, U.; Awiszus, B. Study on determination of flow behaviour of 6060-aluminium and AZ31-magnesium thin sheet by means of stacked compression test. IOP Conf. Ser. Mater. Sci. Eng. 2019, 480, 12023. [Google Scholar] [CrossRef]
  28. Kawalla, R.; Ullmann, M.; Henseler, T.; Prahl, U. Magnesium Twin-Roll Casting Technology for Flat and Long Products-State of the Art and Future. Mater. Sci. Forum 2018, 941, 1431–1436. [Google Scholar] [CrossRef]
  29. Bachmann, F.; Hielscher, R.; Schaeben, H. Texture Analysis with MTEX–Free and Open Source Software Toolbox. SSP 2010, 160, 63–68. [Google Scholar] [CrossRef] [Green Version]
  30. Chiu, S.N.; Stoyan, D.; Kendall, W.S.; Mecke, J. Stochastic Geometry and Its Applications; John Wiley & Sons: Hoboken, NJ, USA, 2013. [Google Scholar]
  31. Blaber, J.; Adair, B.; Antoniou, A. Ncorr: Open-Source 2D Digital Image Correlation Matlab Software. Exp. Mech. 2015, 55, 1105–1122. [Google Scholar] [CrossRef]
  32. Ullmann, M.; Kittner, K.; Henseler, T.; Stöcker, A.; Prahl, U.; Kawalla, R. Development of new alloy systems and innovative processing technologies for the production of magnesium flat products with excellent property profile. Procedia Manuf. 2019, 27, 203–208. [Google Scholar] [CrossRef]
  33. Masoumi, M.; Zarandi, F.; Pekguleryuz, M. Microstructure and texture studies on twin-roll cast AZ31 (Mg–3wt.%Al–1wt.%Zn) alloy and the effect of thermomechanical processing. Mater. Sci. Eng. A 2011, 528, 1268–1279. [Google Scholar] [CrossRef]
  34. Liang, P.; Tarfa, T.; Robinson, J.; Wagner, S.; Ochin, P.; Harmelin, M.; Seifert, H.; Lukas, H. Experimental investigation and thermodynamic calculation of the Al–Mg–Zn system. Thermochim. Acta 1998, 314, 87–110. [Google Scholar] [CrossRef]
  35. Koike, J.; Ohyama, R.; Kobayashi, T.; Suzuki, M.; Maruyama, K. Grain-Boundary Sliding in AZ31 Magnesium Alloys at Room Temperature to 523 K. Mater. Trans. 2003, 44, 445–451. [Google Scholar] [CrossRef] [Green Version]
  36. Xia, D.; Huang, G.; Liu, S.; Tang, A.; Gavras, S.; Huang, Y.; Hort, N.; Jiang, B.; Pan, F. Microscopic deformation compatibility during biaxial tension in AZ31 Mg alloy rolled sheet at room temperature. Mater. Sci. Eng. A 2019, 756, 1–10. [Google Scholar] [CrossRef]
  37. Üçel, İ.; Kapan, E.; Türkoğlu, O.; Aydıner, C. In situ investigation of strain heterogeneity and microstructural shear bands in rolled Magnesium AZ31. Int. J. Plast. 2019, 118, 233–251. [Google Scholar] [CrossRef]
  38. Wang, F.; Sandlöbes, S.; Diehl, M.; Sharma, L.; Roters, F.; Raabe, D. In situ observation of collective grain-scale mechanics in Mg and Mg–rare earth alloys. Acta Mater. 2014, 80, 77–93. [Google Scholar] [CrossRef]
  39. Xi, B.; Fang, G.; Xu, S. In-situ analysis of microscopic plastic and failure behaviors of extruded magnesium alloy. Mater. Sci. Eng. A 2019, 749, 148–157. [Google Scholar] [CrossRef]
  40. Wang, H.; Boehlert, C.; Wang, Q.; Yin, D.; Ding, W. In-situ analysis of the tensile deformation modes and anisotropy of extruded Mg-10Gd-3Y-0.5Zr (wt.%) at elevated temperatures. Int. J. Plast. 2016, 84, 255–276. [Google Scholar] [CrossRef]
  41. Cepeda-Jiménez, C.; Molina-Aldareguia, J.; Pérez-Prado, M. EBSD-Assisted Slip Trace Analysis during in Situ SEM Mechanical Testing: Application to Unravel Grain Size Effects on Plasticity of Pure Mg Polycrystals. JOM 2016, 68, 116–126. [Google Scholar] [CrossRef]
  42. Osovski, S.; Srivastava, A.; Williams, J.; Needleman, A. Grain boundary crack growth in metastable titanium β alloys. Acta Mater. 2015, 82, 167–178. [Google Scholar] [CrossRef]
  43. Liu, Y.; Zheng, X.; Osovski, S.; Srivastava, A. On the micromechanism of inclusion driven ductile fracture and its implications on fracture toughness. J. Mech. Phys. Sol. 2019, 130, 21–34. [Google Scholar] [CrossRef] [Green Version]
  44. Wang, D.; Shanthraj, P.; Springer, H.; Raabe, D. Particle-induced damage in Fe–TiB2 high stiffness metal matrix composite steels. Mater. Des. 2018, 160, 557–571. [Google Scholar] [CrossRef]
  45. Barnett, M. Twinning and the ductility of magnesium alloys. Mater. Sci. Eng. A 2007, 464, 8–16. [Google Scholar] [CrossRef]
  46. Ulacia, I.; Yi, S.; Hurtado, I. High strain rate formability of AZ31B magnesium alloy sheets. In Magnesium: Proceedings of the 8th International Conference on Magnesium Alloys and Their Applications; Kainer, K.U., Ed.; Wiley-VCH: Weinheim, Germany, 2010; pp. 509–515. [Google Scholar]
  47. Bieler, T.; Eisenlohr, P.; Roters, F.; Kumar, D.; Mason, D.; Crimp, M.; Raabe, D. The role of heterogeneous deformation on damage nucleation at grain boundaries in single phase metals. Int. J. Plast. 2009, 25, 1655–1683. [Google Scholar] [CrossRef]
  48. Uthaisangsuk, V.; Prahl, U.; Bleck, W. Micromechanical modelling of damage behaviour of multiphase steels. Comput. Mater. Sci. 2008, 43, 27–35. [Google Scholar] [CrossRef]
  49. Benzerga, A.; Leblond, J.-B. Ductile fracture by void growth to coalescence. Adv. Appl. Mech. 2010, 169–305. [Google Scholar]
  50. Nemcko, M.; Li, J.; Wilkinson, D. Effects of void band orientation and crystallographic anisotropy on void growth and coalescence. J. Mech. Phys. Sol. 2016, 95, 270–283. [Google Scholar] [CrossRef]
  51. Landron, C.; Maire, E.; Adrien, J.; Bouaziz, O. Damage characterization in Dual-Phase steels using X-ray tomography. In Optical Measurements, Modeling, and Metrology; Proulx, T., Ed.; Springer: New York, NY, USA, 2011; Volume 5, pp. 11–18. [Google Scholar]
  52. Tvergaard, V. Interaction of very small voids with larger voids. Int. J. Solids Struct. 1998, 35, 3989–4000. [Google Scholar] [CrossRef]
  53. Prahl, U.; Rehbach, W.; Kuckertz, C.; Weichert, D.; Bleck, W. Ductile Damage Prediction on the Basis of Microstructural Observations. KEM 2003, 251–252, 351–356. [Google Scholar] [CrossRef]
  54. Prahl, U. Schädigung und Versagen Mikrolegierter Feinkornstähle in Experiment und Simulation. Ph.D. Thesis, RWTH Aachen University, Aachen, Germany, 2002. [Google Scholar]
Figure 1. (a) Experimental setup for in-situ tensile tests inside the SEM, as well as specimen geometries in mm and their theoretical stress triaxiality η for stress states of (b) high triaxiality, (c) simple tension, and (d) simple shear.
Crystals 10 00856 g001
Figure 2. Voronoi decomposition method to calculate the local void area fraction by (a) partitioning the cross-section images and (b) relating the individual region areas to the void area contained therein; (c) example of digital image correlation (DIC) strain analysis carried out using images of the specimen surface.
Crystals 10 00856 g002
Figure 3. The initial microstructure of the AZ31 magnesium sheet studied, characterized by (a) the grain size distribution with reference to the respective area fraction, (b) pole figures with reference to the basal and prismatic planes, as well as (c) the orientation distribution function (ODF) section at φ 2 = 0°.
Crystals 10 00856 g003
Figure 4. Example of a 150 °C simple tension specimen (loading direction indicated by blue arrows) with a tracked particle indicated by red circles and the orientation of slip traces indicated by red arrows; elongation ε indicated with reference to the initial gauge length of 3 mm being (a) 25%, (b) 40% and (c) 55%.
Crystals 10 00856 g004
Figure 5. Example of a 150 °C simple shear specimen (loading direction indicated by blue arrows) with a tracked particle indicated by red circles and the orientation of slip traces indicated by red arrows; elongation ε indicated with reference to the initial gauge length of 1 mm being (a) 50%, (b) 80% and (c) 110%.
Crystals 10 00856 g005
Figure 6. Increasing grain boundary sliding (GBS) activity observed for simple tension specimens at (a) RT, (b) 150 °C, (c) 250 °C, and (d) 350 °C, and strains equal to 10%; varying slip trace appearance observed for simple tension specimens at (e) RT, (f) 150 °C, (g) 250 °C, and (h) 350 °C, and strains equal to 30%.
Crystals 10 00856 g006
Figure 7. Comparison of the (a) 250 °C specimen to the (b,c) 350 °C in-situ simple tension test specimen where dynamic recrystallization reduced grain elongation and formed new grains along existing boundaries.
Crystals 10 00856 g007
Figure 8. Gurson–Tvergaard–Needleman (GTN) model-based material parameters for critical void volume fractions for fracture and the onset of void coalescence, as well as mean strains for nucleation at RT, 150 °C, 250 °C, and 350 °C for (a) a high-stress triaxiality specimen and (b) a simple tension specimen.
Crystals 10 00856 g008
Figure 9. Exemplary SEM images of the sample cross-section of a sample tested at 350 °C (a) slightly further from the fracture surface with low strains and (b) near the fracture surface with correspondingly higher local strain.
Crystals 10 00856 g009
Figure 10. SEM images of a particle breakage (a) and the decohesion of a particle from the matrix (b), which led to void nucleation in the notched specimen at 200 °C; Statistics on the analyzed voids that were in direct contact with particles after the test (c).
Crystals 10 00856 g010
Figure 11. Void volume fractions after calibration of the growth parameters for the temperatures RT (a), 150 °C (b), 250 °C (c), and 350 °C (d) to fit experimental data taken according to Figure 2 from notched samples.
Crystals 10 00856 g011
Table 1. Nominal chemical composition of the investigated AZ31 magnesium sheet (wt.%).
AlZnMnZrCuSiFeSnCaMg
2.990.9690.3770.0020.0010.0170.003<0.005<0.001bal.
Table 2. Compilation of the determined parameters for the GTN model depending on the temperature for AZ31 thin sheet.
ϑ q 1 q 2 q 3 f 0 f N S N ε N f c f f
RT1.512.250.00040.0110.02460.2460.00180.0047
150 °C0.05940.4750.00780.051
250 °C0.11880.950.00890.075
350 °C0.15441.2350.01230.104

