1. Introduction
In the last 15 years, because of their excellent piezoelectric properties, relaxor-based ferroelectric single crystals such as binary Pb(Mg
1/3Nb
2/3)O
3–PbTiO
3 (PMN–PT) and ternary Pb(In
1/2Nb
1/2)O
3–Pb(Mg
1/3Nb
2/3)O
3–PbTiO
3 (PIN–PMN–PT) have attracted extensive attention and become important materials in the fabrication of new-generation high-performance electromechanical devices including ultrasound transducers, actuators, sensors, and other electromechanical devices [
1,
2,
3,
4,
5,
6,
7,
8,
9]. It is worth noting that due to the high toxicity of lead, the traditional lead-containing ferro-piezoelectric materials are very harmful to the environment and human health. Lead-free materials are therefore the future developmental direction of ferro-piezoelectric materials [
10,
11,
12,
13]. However, current lead-free piezoelectric materials have some defects which limit their applications, and so lead-containing materials continue to dominate in a number of applications. With its concentration of PT near the morphotropic phase boundary region, the ternary PIN–PMN–PT single crystal not only has similar piezoelectric performance to that of the binary PMN–PT single crystal but also possesses higher phase transition temperature (>120 °C) and coercive field (~6 kV/cm) than the binary PMN–PT single crystal. These properties are very crucial to many electromechanical devices, especially when applied to high-drive and high-temperature environments [
14,
15,
16].
In practical applications, relaxor-based ferroelectric single crystals are expected to endure mechanical loading [
17,
18,
19,
20]. Moreover, mechanical loading may also degrade the performance of ferroelectric single-crystal devices, eventually leading to device failure during fabrication or service [
21,
22,
23,
24]. Understanding the mechanical properties of relaxor-based ferroelectric PIN–PMN–PT single crystals is therefore key to improving the performance and optimizing the design of these devices.
Nanoindentation is a convenient and reliable examination method to investigate mechanical properties with small volumes and has been widely used to examine various materials [
25,
26,
27,
28,
29]. Nanoindentation is a continuous measurement of the load and displacement. Then, nano-mechanical properties such as hardness, Young’s modulus, indentation strain-rate sensitivity, and creep can be measured from the load–displacement curve. The mechanical behavior of the relaxor-based ferroelectric single crystals has been studied by some researchers. Gailard et al. presented a study of the deformation mechanisms of BaTiO
3 giant single crystals with known orientations using nanoindentation and an atomic force microscope [
30]. Fang et al. investigated the interactions between the crack propagation and domain switching in poled BaTiO
3 single crystals under a mechanical load [
31]. Babu et al. performed the Vickers microhardness test on a <001>-cut Na
1/2Bi
1/2TiO
3 single crystal and calculated its fracture toughness and brittleness index from the R-curve [
32]. Zhou et al. investigated the electric field-dependent mechanical properties of the PMN–PT single crystal by electromechanical-coupled nanoindentation [
33]. Zeng et al. investigated the deformation and mechanical properties of a (001)-oriented single crystal of PZN–0.07PT using a combination of nanoindentation, micro-indentation, and three-point bending tests [
34]. These studies examined in part the mechanical behavior of the relaxor-based ferroelectric single crystals, but there has been little investigation into the mechanical properties of ternary PIN–PMN–PT single crystals using the nanoindentation technique.
In the present work, the anisotropic nano-mechanical properties of relaxor-based ferroelectric PIN–PMN–PT bulk single crystals with different crystallographic directions were experimentally investigated using nanoindentation testing. The load–indentation depth curves, elastic and plastic deformations, hardnesses. and Young’s moduli of the [100]- and [110]-oriented PIN–PMN–PT bulk single crystals were evaluated.
2. Experimental Method
The ferroelectric 0.28PIN-0.43PMN-0.29PT single crystals used in this study were grown using a modified Bridgeman method and were provided by the Shanghai Institute of Ceramics, Chinese Academy of Sciences. High-purity (99.99%) oxide powders of PbO, In2O3, Nb2O5, MgO, and TiO2 were mixed stoichiometrically and ground to reduce the particle size. The resulting powder was sintered for 8 hours at 1000 °C. The sintered material was put into a platinum crucible, and the crucible was sealed and placed inside a furnace. The sintered material was heated up to 1400 °C, and the melt was equilibrated for 10 hours. Lastly, the crucible was lowered at 0.5 mm/hour, and the crystal was grown. The PIN–PMN–PT single crystal was cut into a rectangular specimen with dimensions of 6 × 4 × 0.5 mm3. The crystallographic direction of the main plane (6 × 4 mm) was either the [100] direction (termed the [100]-oriented PIN–PMN–PT single crystal) or the [110] direction (termed the [110]-oriented PIN–PMN–PT single crystal).
For the purpose of consistency and accuracy of the nanoindentation testing results, the main planes (6 × 4 mm) of the PIN–PMN–PT single-crystal specimens were ground and mechanically and electrolytically polished to a near-mirror finish.
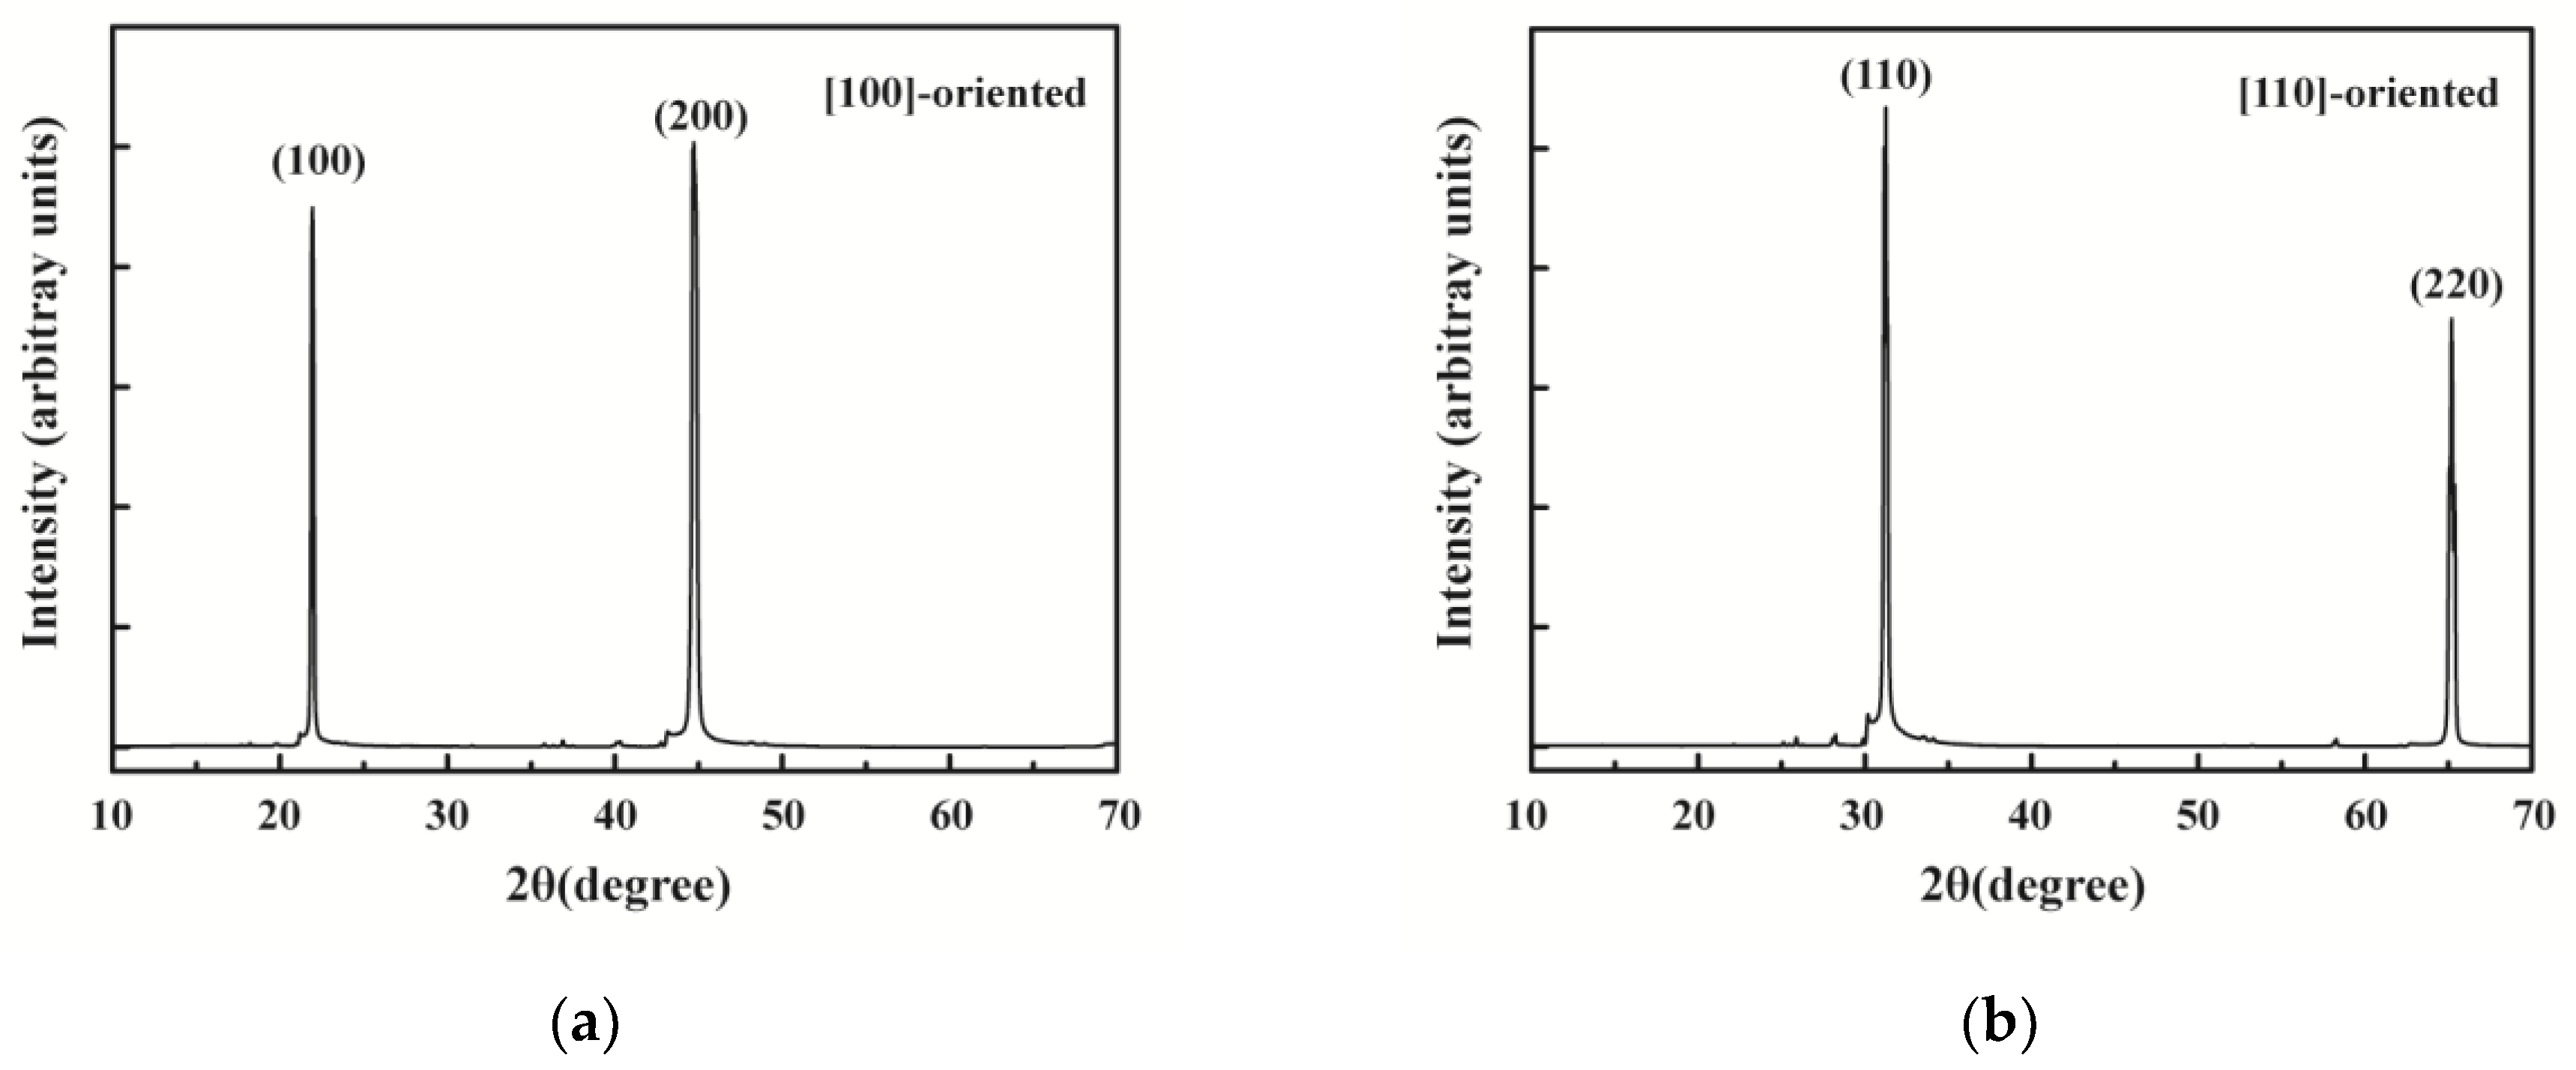
Figure 1 shows the X-ray diffraction (XRD) patterns from the main planes of [100]- and [110]-oriented PIN–PMN–PT single crystals by using X-ray diffractometer SmartLab 9KW (Rigaku, Akishima, Tokyo, Japan). It reveals that the PIN–PMN–PT single crystals with two different crystallographic directions in this study were exactly in the [100] and [110] directions and additionally had good phase purity.
The mechanical properties of the PIN–PMN–PT single crystals were characterized using a Nano indenter G200 (Agilent Technologies, Santa Clara, CA, USA) with a standard diamond Berkovich indenter (Agilent Technologies, Santa Clara, CA, USA) at room temperature. For the Berkovich indenter, the centerline-to-face angle, centerline-to-edge angle, and radius at the tip were 65.3°, 77.05°, and 50 nm, respectively. The Nano indenter G200 had a maximum load of 500 mN and a maximum indentation depth greater than 500 μm. With a load resolution of 50 nN and displacement resolution less than 0.01 nm, it could accurately test the mechanical behavior of the material at both the micro- and the nano-scale. The nanoindentation measurements were conducted under continuous stiffness measurement (CSM) procedures [
35,
36,
37]. The indentation loads acted on the main planes (6 × 4 mm) of the [100]- and [110]-oriented PIN–PMN–PT single crystal samples at a constant strain rate of 0.05 s
−1 with four maximum indentation depths of 500 nm, 1000nm, 1500nm, and 2000 nm. When the indentation depth reached the maximum value, the corresponding peak load was held for 10 s and then unloaded at the same strain rate. More than five indents at each maximum indentation depth were performed on the samples to confirm the reliability and repeatability of the nanoindentation tests. For the sake of eliminating interactions among the indentation points, the spacing between each two neighboring indentation points was set to 100 µm.
During indenting, loads and displacements were recorded to generate load–indentation depth curves. The Oliber–Pharr method was applied to determine the hardness (
H) as well as the Young’s modulus (
E) [
38,
39]. The
H and
E were calculated using the following relationships:
where
Pmax is the maximum applied load, and
A is the projected contact area between the indenter tip and the specimen at the maximum load;
hc is the contact indentation depth determined from load–indentation depth curves;
Er is the reduced modulus;
Ei and
are Young’s modulus and Poisson’s ratio for the diamond indenter, with
Ei = 1141 GPa, and
= 0.07; S is the initial unloading stiffness determined by the slope of the unloading curve d
P/d
h at the maximum load, and
β is the correction factor that depends on the geometry of the indenter (for the Berkovich tip,
β is 1.034).
3. Results and Discussion
3.1. Load–Indentation Depth Curves
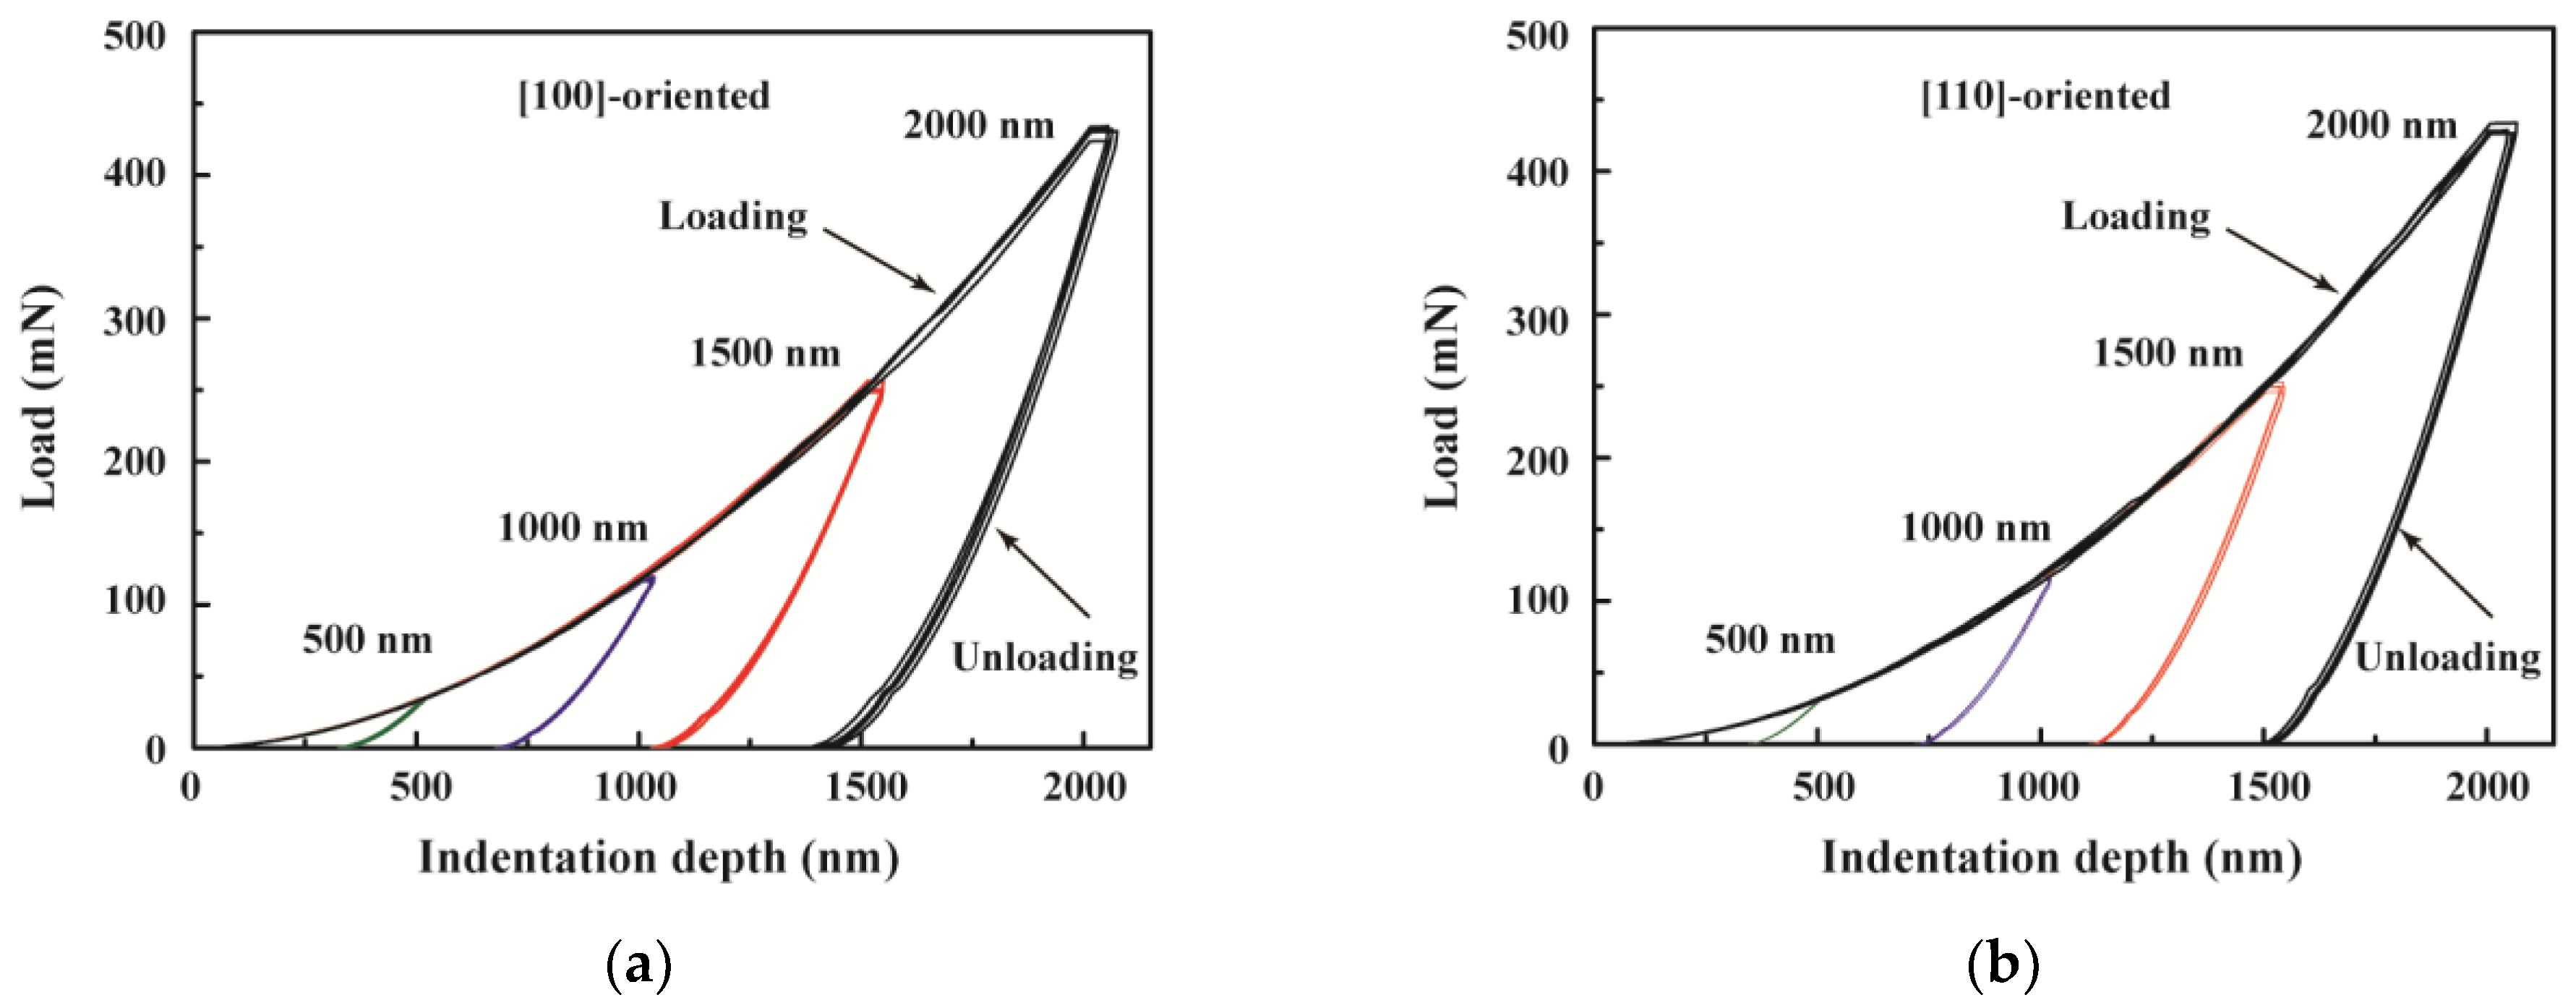
Figure 2 shows the representative load–indentation depth curves at different maximum indentation depths for the [100]- and [110]-oriented PIN–PMN–PT bulk single crystals. It is observed that the load–indentation depth curves for each maximum indentation depth closely overlap when the maximum indentation depth
hmax is below 1500 nm. The difference between the load–indentation depth curves at the
hmax of 2000 nm is very small. Thus, the load–indentation depth curves exhibit a low noise level and small variation in the data. These features reflect the good phase purity and crystal uniformity of the PIN–PMN–PT bulk single crystal, which is consistent with the XRD results above.
With the indentation depth increasing, the load increased gradually at each hmax during the loading process, and with the hmax increasing, the corresponding peak load also gradually increased. It can be seen that when the hmax increased from 500 nm to 2000 nm, the corresponding peak load increased from 34.22 mN to 436.54 mN for the [100]-oriented PIN–PMN–PT bulk single crystal and from 31.33 mN to 428.68 mN for the [110]-oriented PIN–PMN–PT bulk single crystal.
When the indentation depth reached the hmax, the corresponding peak load was held for 10 s and then unloaded. Only the elastic indentation depth recovered in the unloading process. After unloading, the indentation depth did not fully recover, and residual indentation depth remained, which indicated irreversible plastic deformation in the PIN–PMN–PT bulk single crystal during the loading process. In our experiment, there was no discontinuity in the load–indentation depth curves within an indentation depth of 2000 nm, which indicated that large cracks were not formed in the PIN–PMN–PT single crystal during the loading and unloading process.
3.2. Elastic and Plastic Deformations
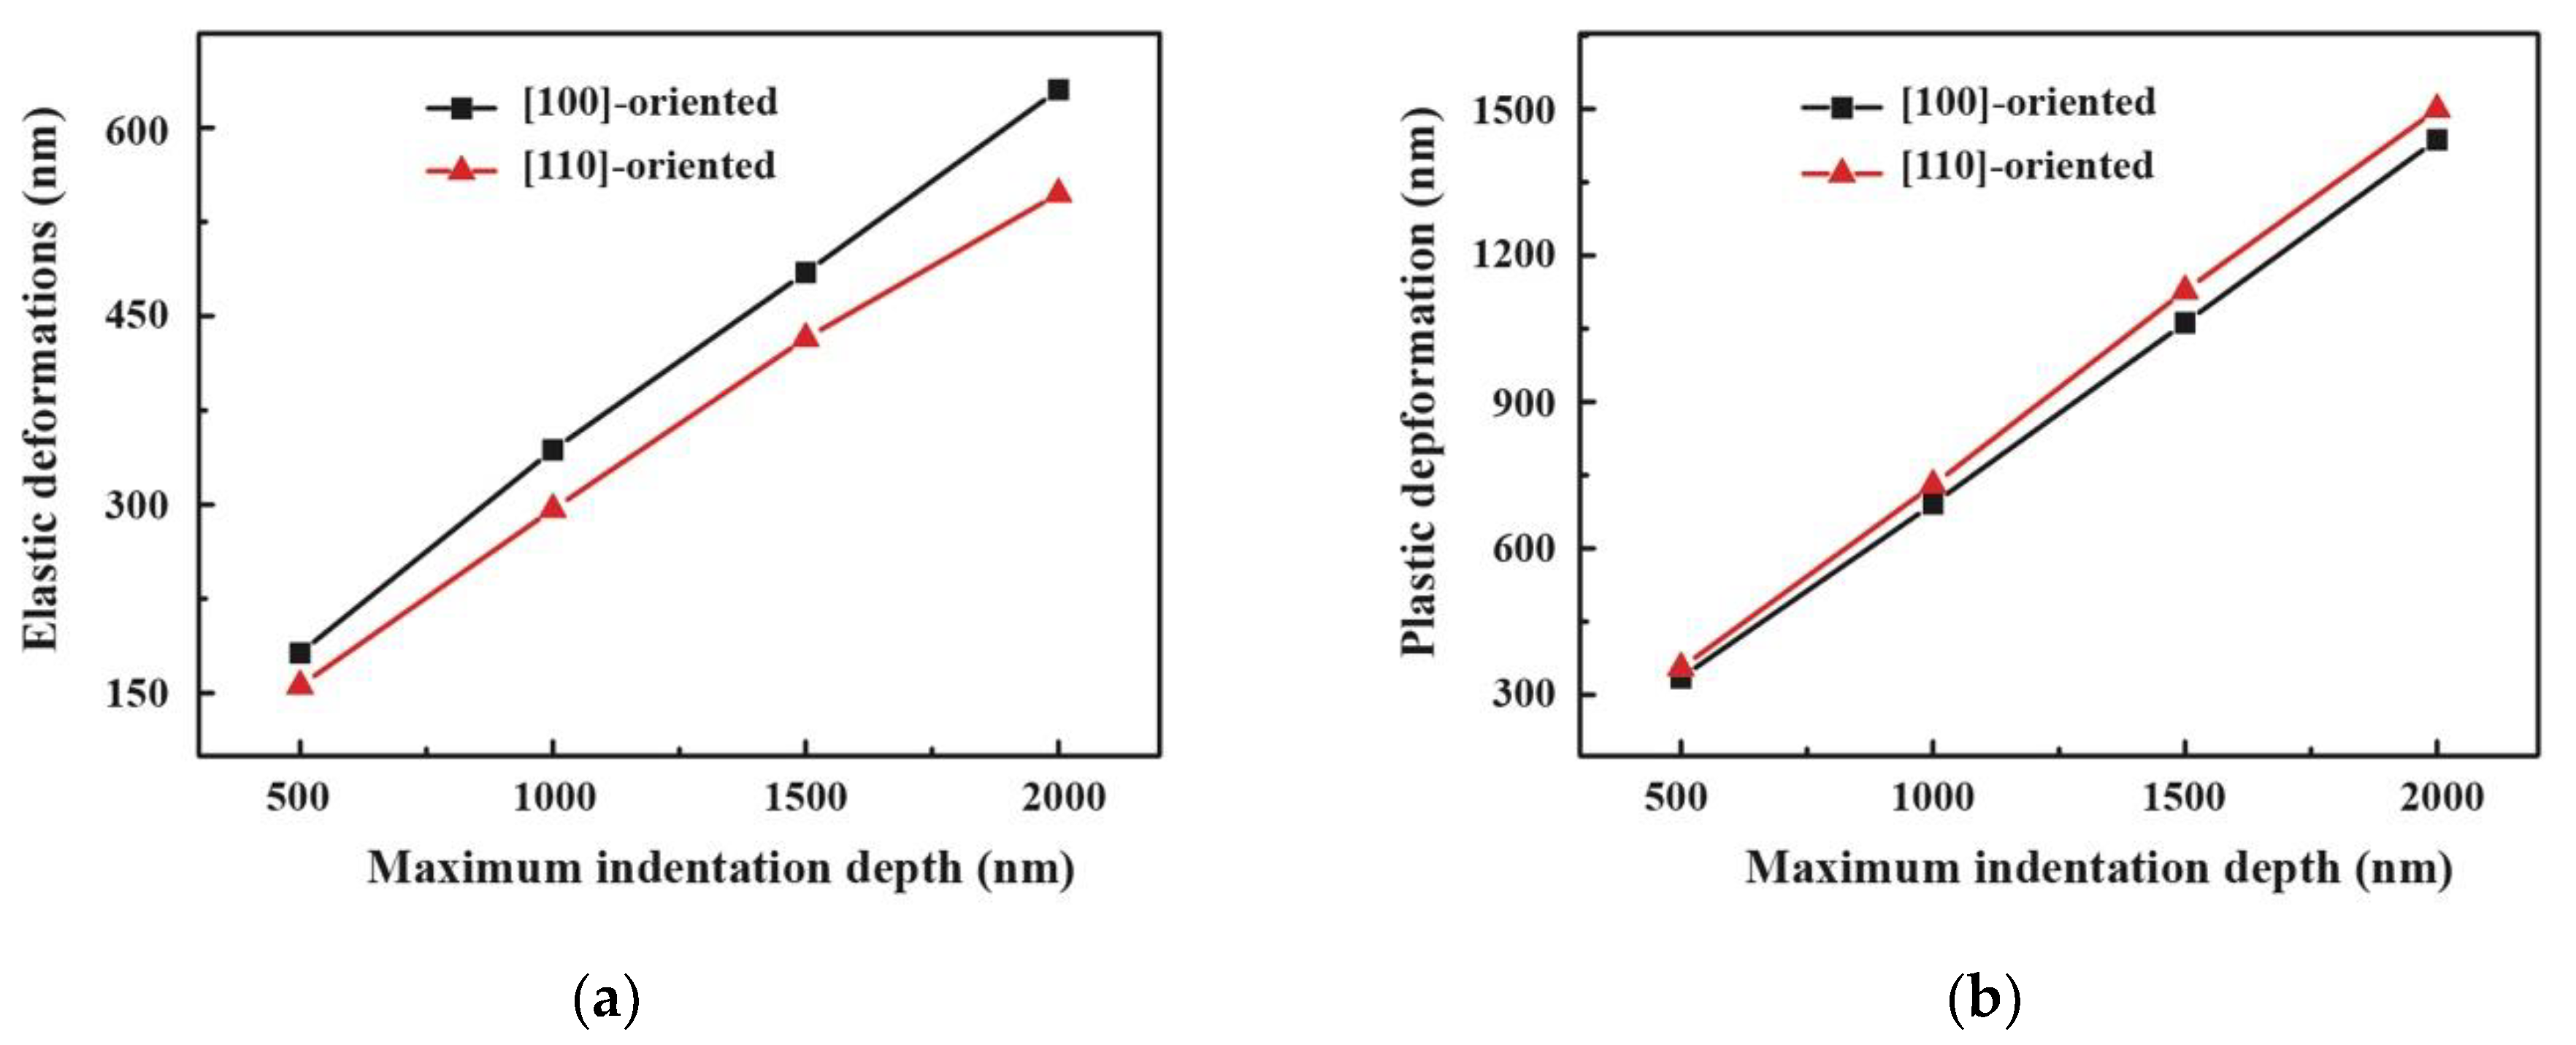
Figure 3 shows the elastic and plastic deformations versus the maximum indentation depth
hmax for the [100]- and [110]-oriented PIN–PMN–PT single crystals. It can be seen that when the
hmax increased from 500 nm to 2000 nm, the elastic deformation increased from 181.88 nm to 630.27 nm for the [100]-oriented PIN–PMN–PT bulk single crystal and from 155.78 nm to 547.47 nm for the [110]-oriented PIN–PMN–PT bulk single crystal. At each
hmax, the elastic deformation of the [100]-oriented PIN–PMN–PT bulk single crystal was larger than that of the [110]-oriented PIN–PMN–PT bulk single crystal. A similar relationship was observed in the plastic deformation results. With increasing the
hmax from 500 to 2000 nm, the plastic deformation increased from 334.67 nm to 1436.96 nm for the [100]-oriented PIN–PMN–PT bulk single crystal and from 354.94 nm to 1499.36 nm for the [110]-oriented PIN–PMN–PT bulk single crystal. At each
hmax, the plastic deformation of the [100]-oriented PIN–PMN–PT bulk single crystal was less than that of the [110]-oriented PIN–PMN–PT bulk single crystal.
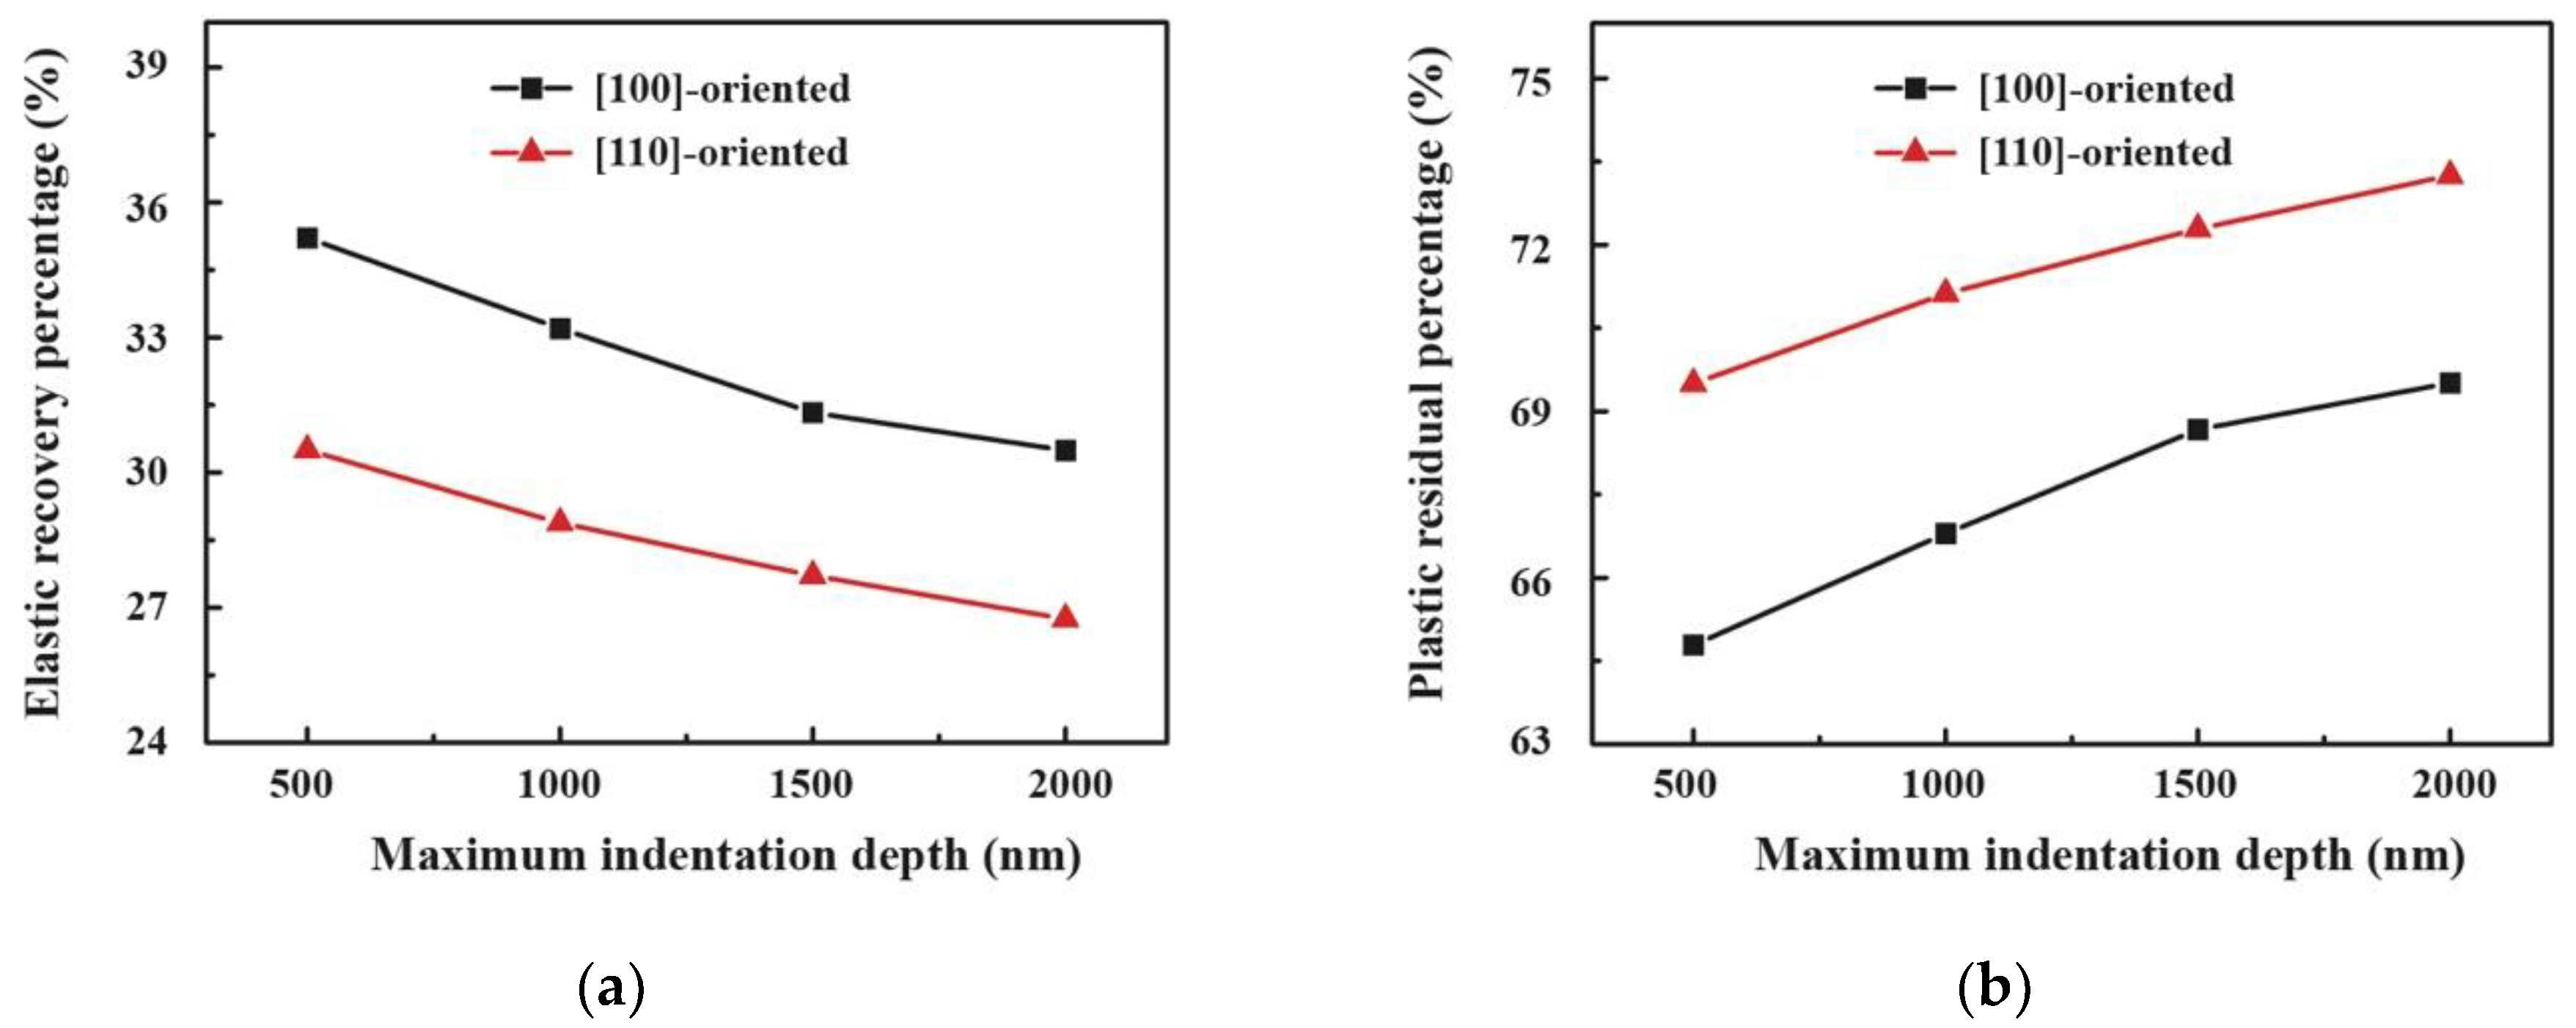
The elastic recovery and the plastic residual percentages versus the maximum indentation depth
hmax for the [100]- and [110]-oriented PIN–PMN–PT single crystals are shown in
Figure 4. It can be seen that with increasing the
hmax, the elastic recovery percentage decreased from 35.21% to 30.49% for the [100]-oriented PIN–PMN–PT crystal and from 30.50% to 26.75% for the [110]-oriented PIN–PMN–PT crystal. At each
hmax, the elastic recovery percentage of the [100]-oriented PIN–PMN–PT crystal was larger than that of the [110]-oriented PIN–PMN–PT crystal. Conversely, with increasing the
hmax, the plastic residual percentage increased from 64.79% to 69.51% for the [100]-oriented PIN–PMN–PT crystal and from 69.50% to 73.25% for the [110]-oriented PIN–PMN–PT bulk single crystal. At each
hmax, the plastic residual percentage of the [100]-oriented PIN–PMN–PT bulk single crystal was less than that of the [110]-oriented PIN–PMN–PT bulk single crystal. This indicated that the higher the maximum indentation depth
hmax or peak load, the lower the elastic recovery percentage and the higher the plastic residual percentage in the PIN–PMN–PT bulk single crystals. Under indentation stress, some of the domains of the PIN–PMN–PT bulk single crystals tend to switch, forming non-180 domain walls to minimize elastic energy [
40]. The formation of these non-180 domain walls may cause irreversible depolarization, relieving the internal stress built up in the PIN–PMN–PT bulk single crystals [
41]. This reduces the driving force for the recovery of the PIN–PMN–PT bulk single crystal. Therefore, at the maximum indentation depth of 500 nm to 2000 nm, the plastic deformation is larger than the elastic deformation, and the plastic residual percentage is larger than 50%, which means that the plastic deformation dominated in the indentation process of the PIN–PMN–PT bulk single crystal.
3.3. Hardness and Young’s Modulus
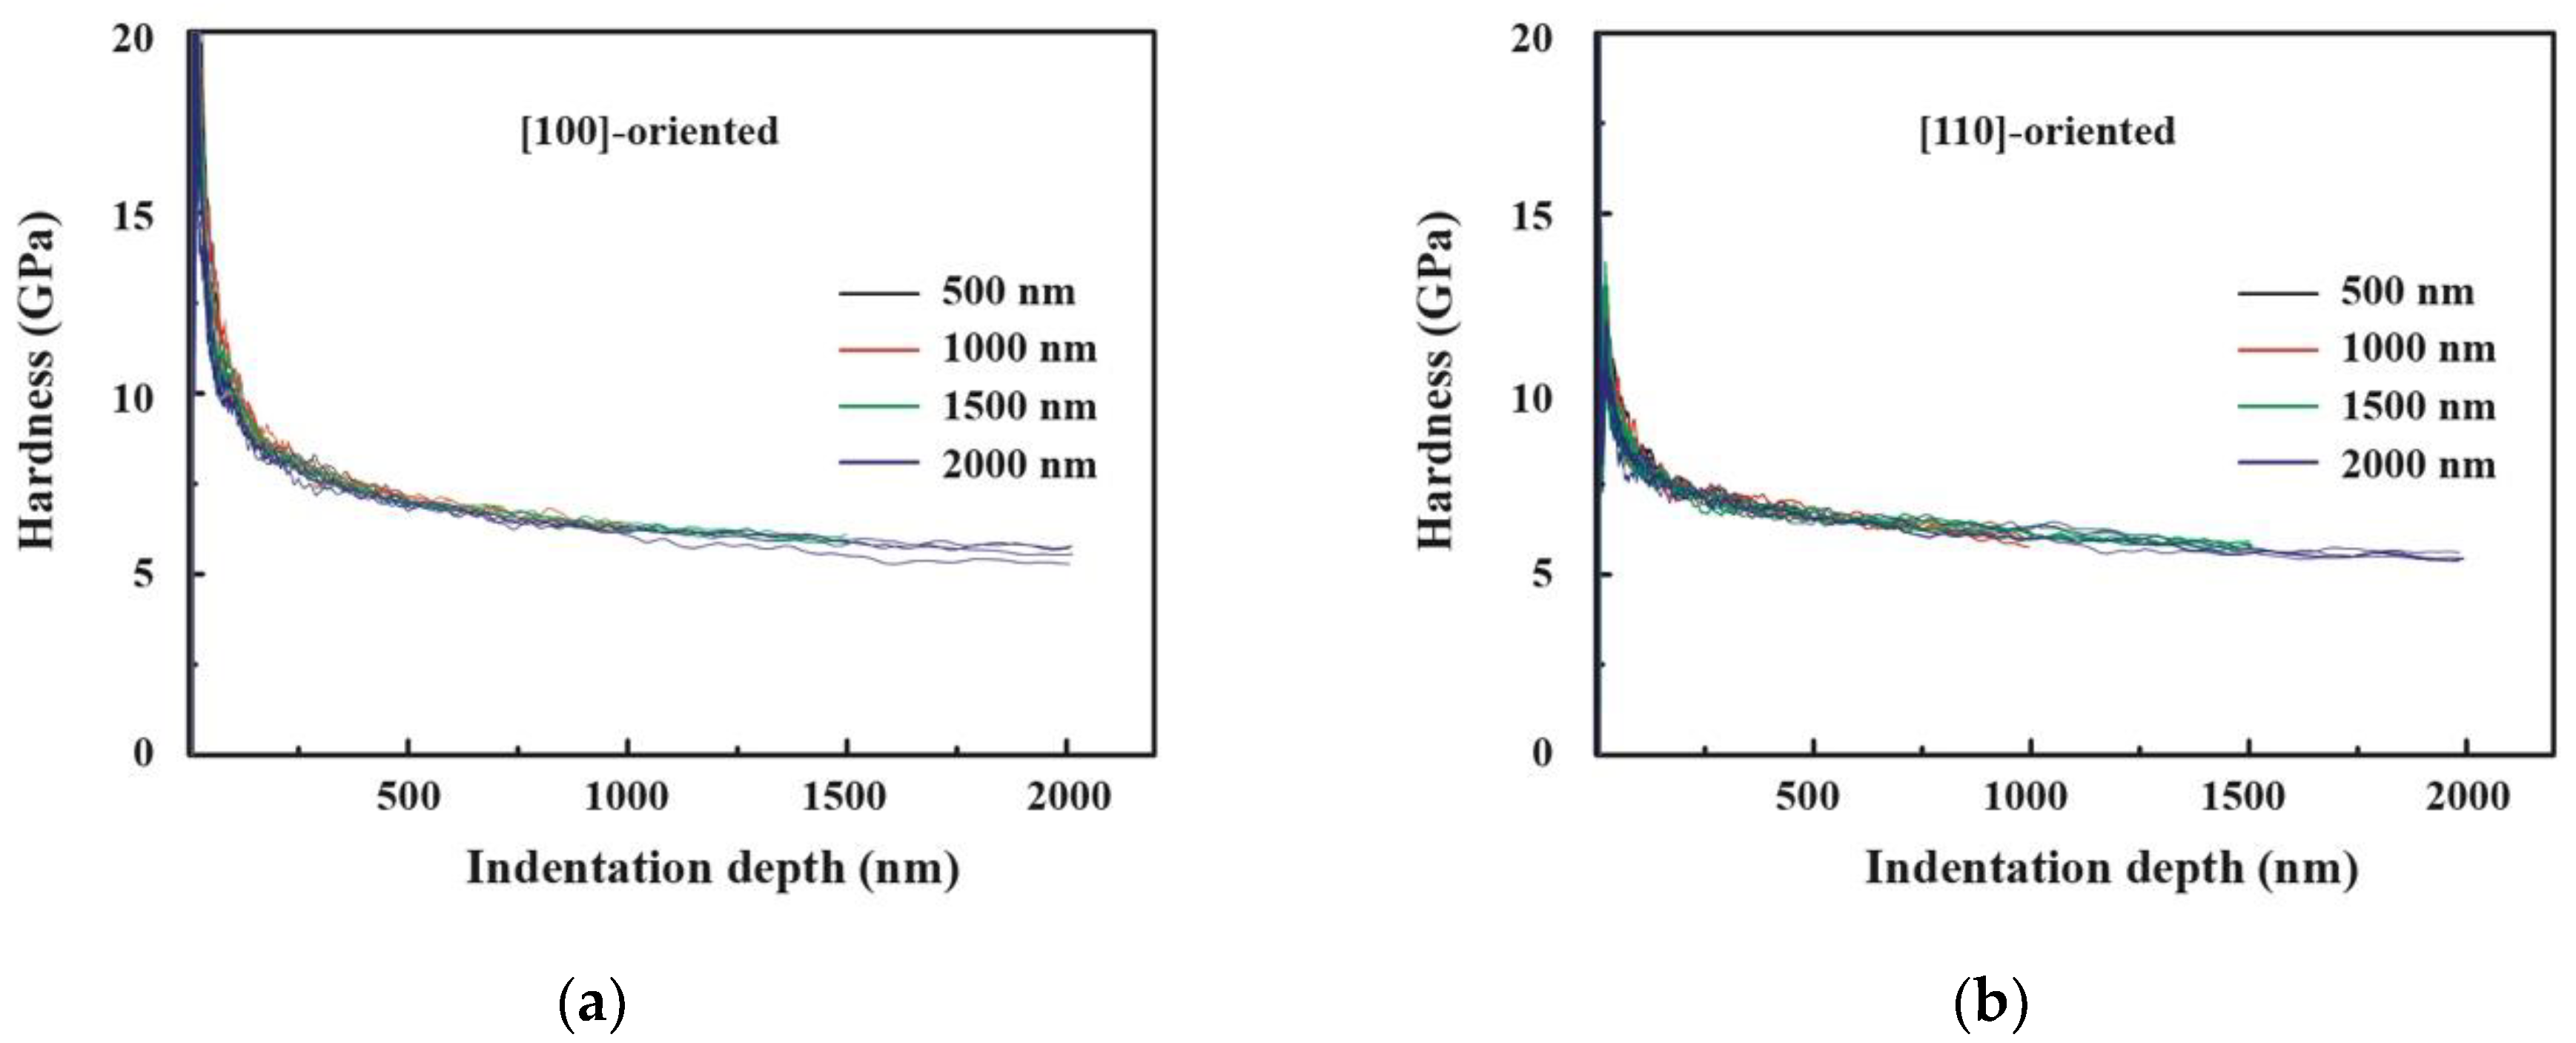
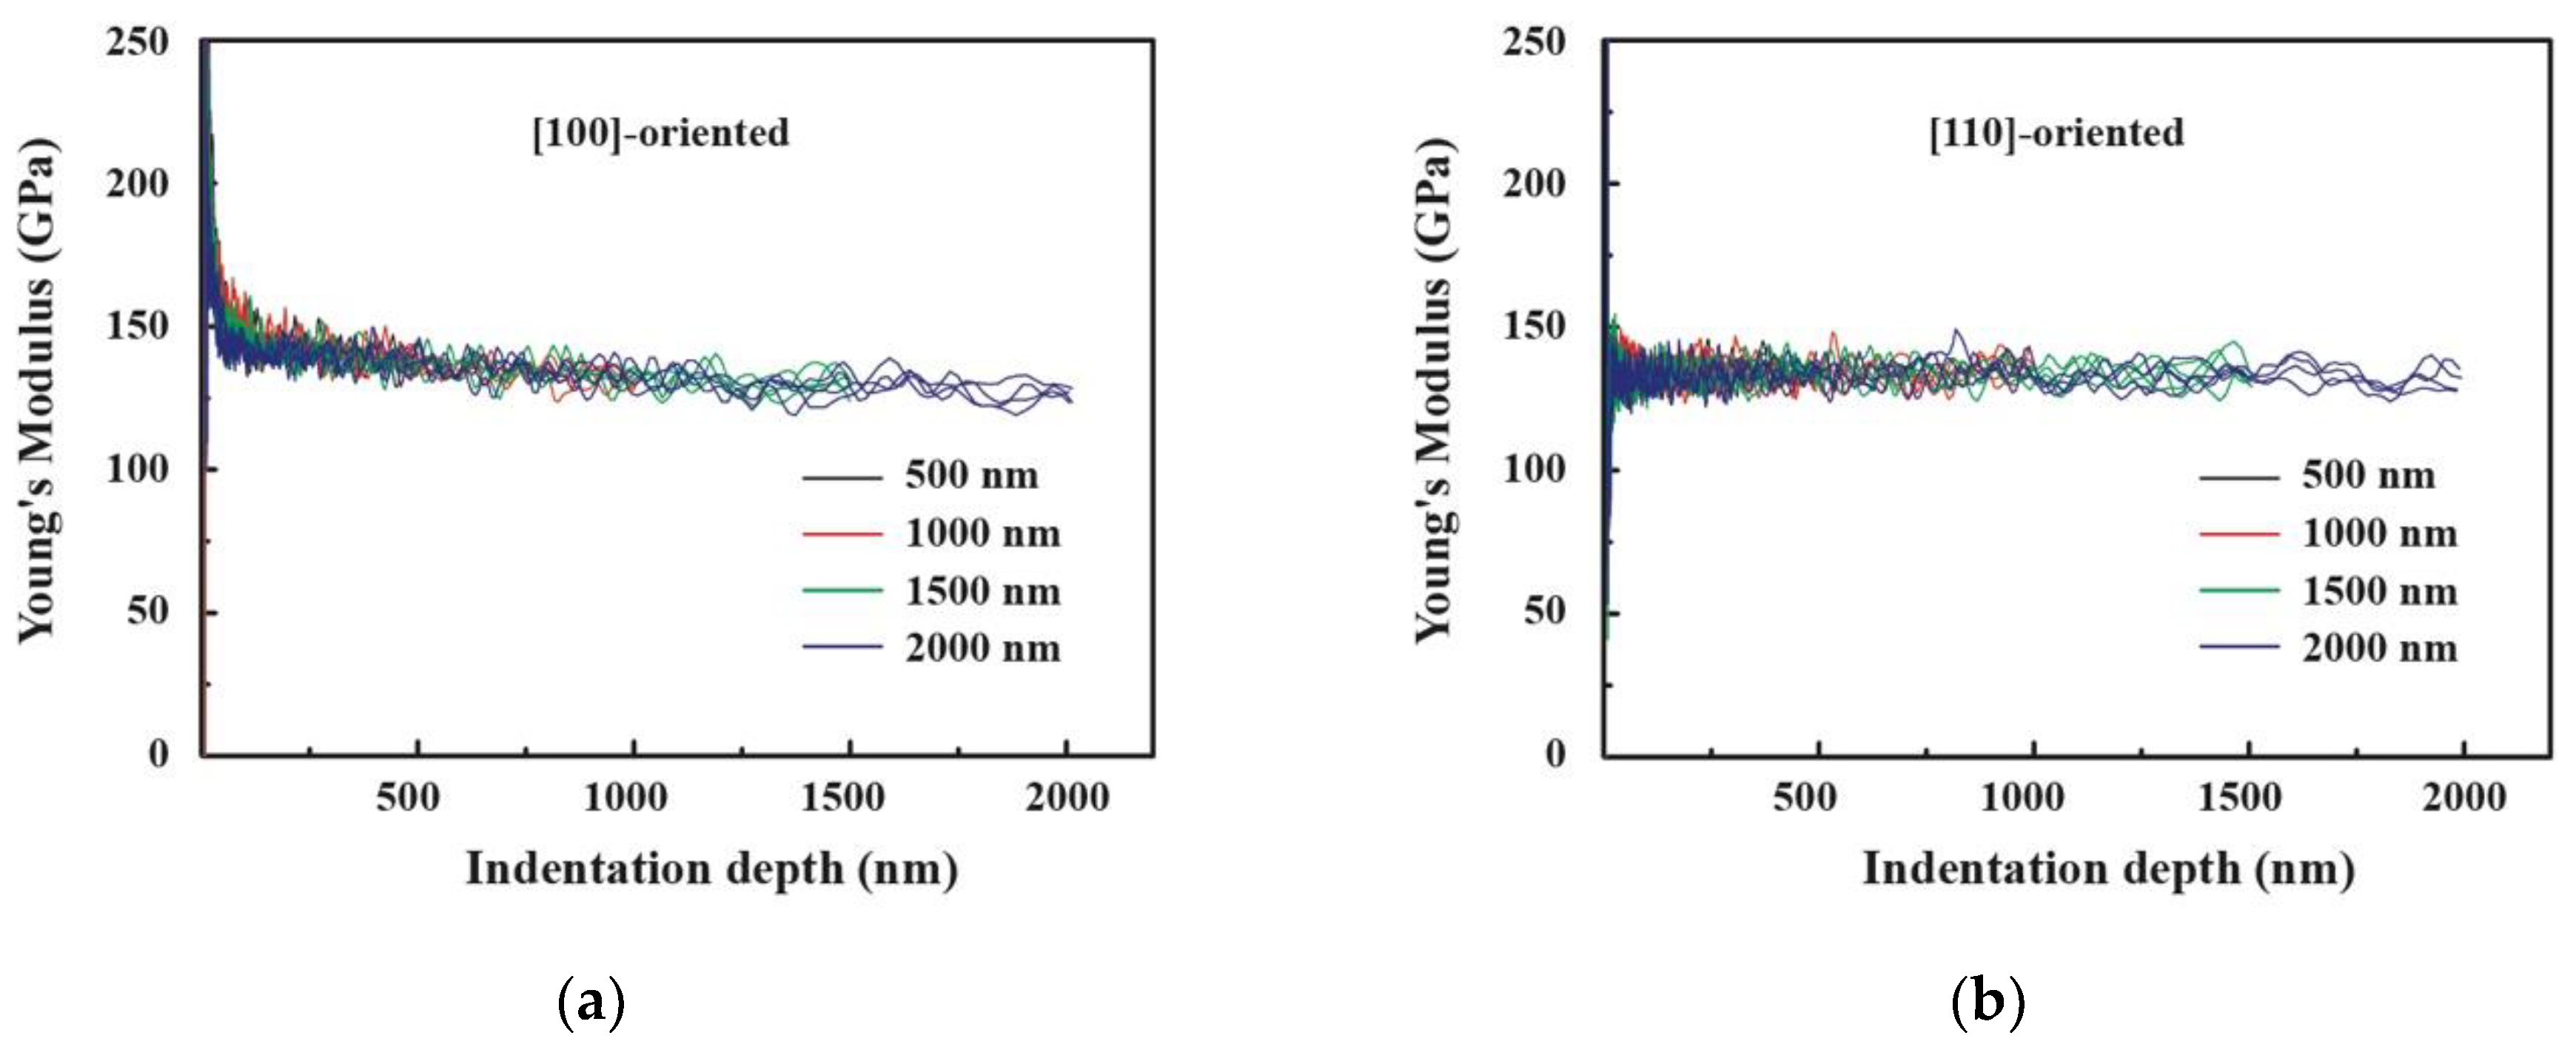
Figure 5 and
Figure 6 show the hardness–indentation depth curves and Young’s modulus
–indentation depth curves, respectively, of the [100]- and [110]-oriented PIN–PMN–PT single crystals at the maximum indentation depths from 500 nm to 2000 nm. It can be seen that when the indentation depth was less than 30 nm, the fluctuation of the data was somewhat large, which may be related to the resolution of the nano-indenter, the smoothness of the specimen surface, and environmental noise when searching for the initial contact position during the nanoindentation test. However, when the indentation depth was more than 30 nm, the hardness–indentation depth curves and Young’s modulus
–indentation depth curves featured small variation in the data at the same range of indentation depth.
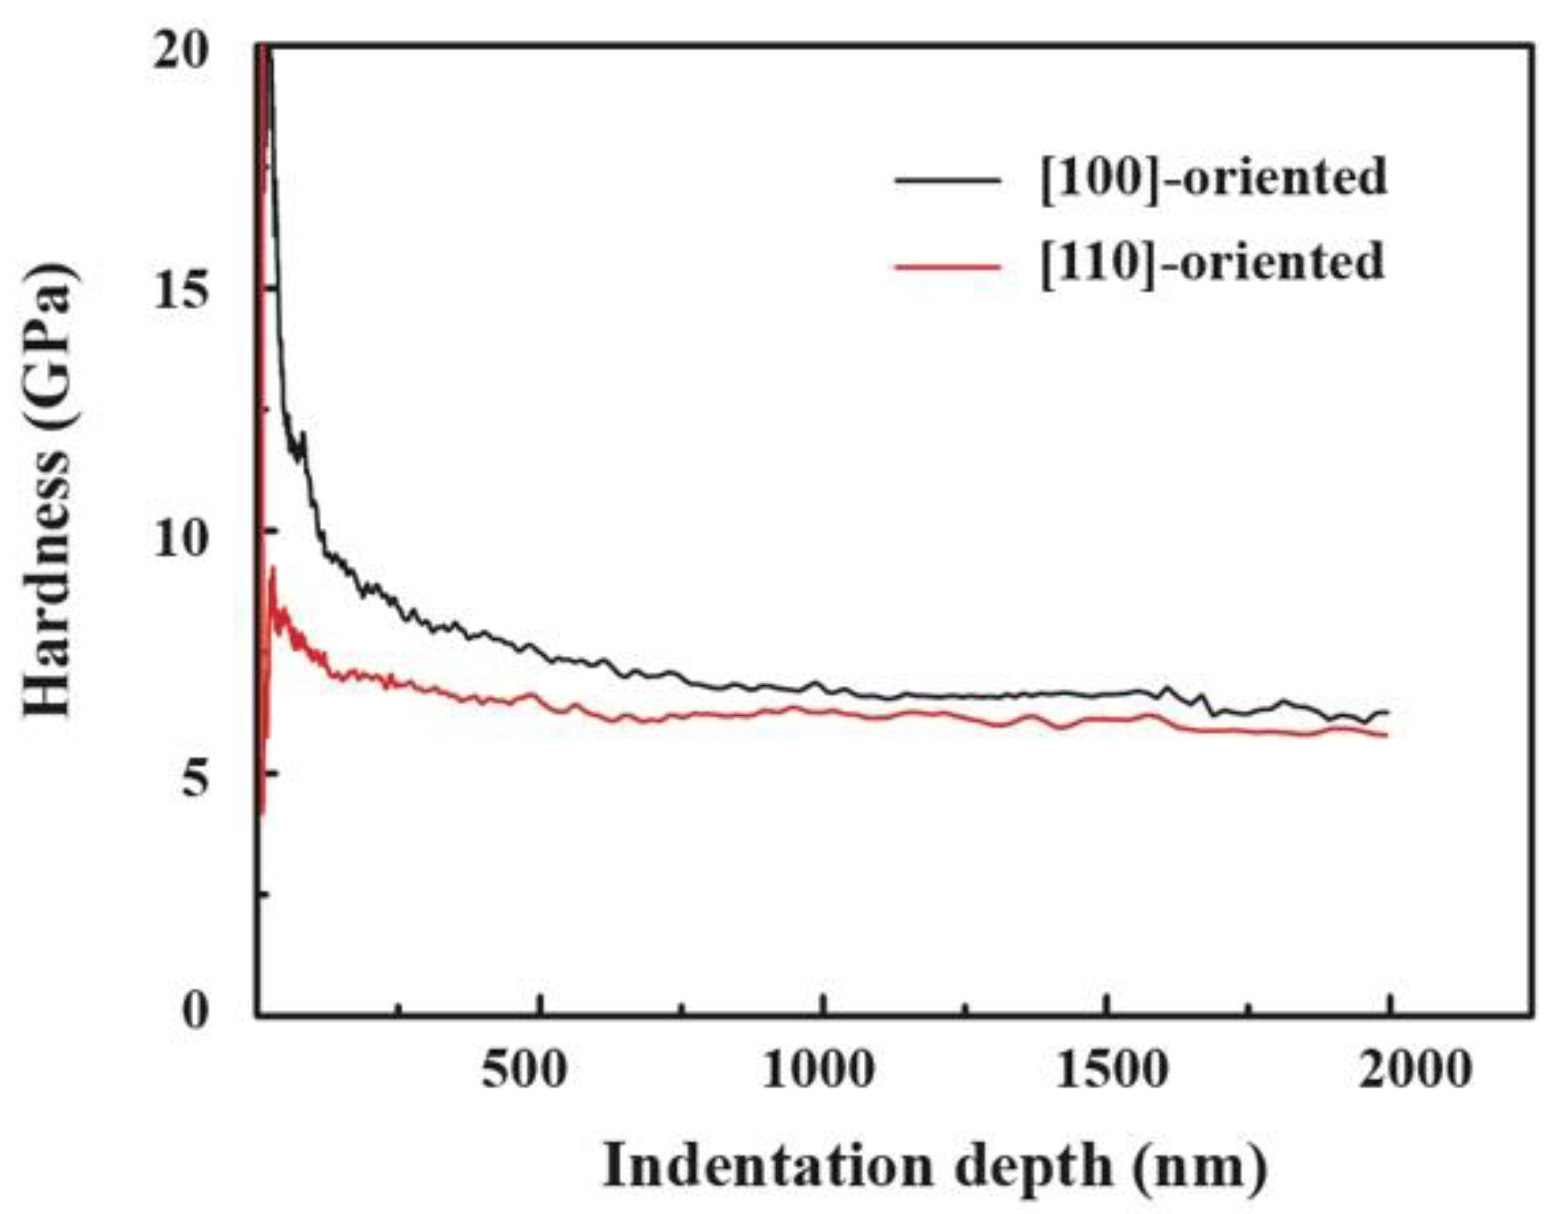
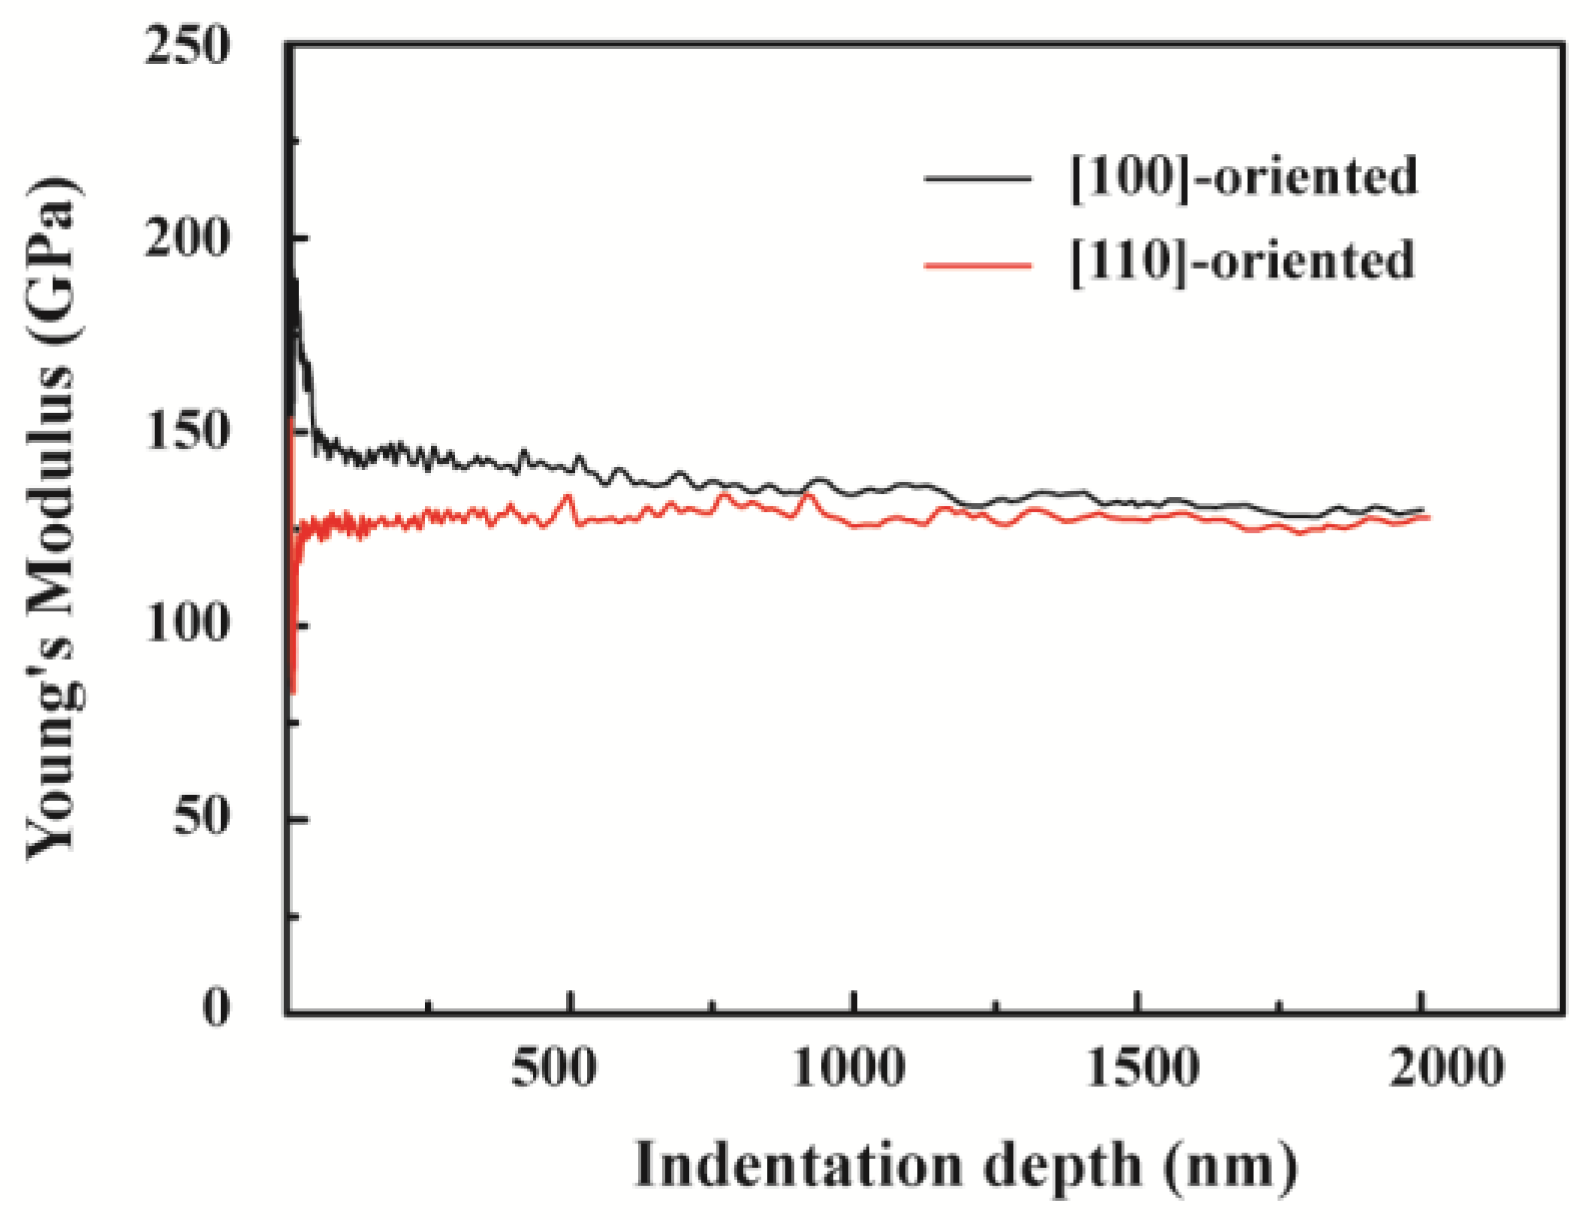
To compare the hardnesses and Young’s moduli of the [100]-and [110]-oriented PIN–PMN–PT bulk single crystals, the hardness and Young’s modulus were determined as the average of the values of four indentations at every indentation depth, with maximum indentation depth of 2000 nm. The corresponding hardness–indentation depth curves and the Young’s modulus
–indentation depth curves of the [100]- and [110]-oriented PIN–PMN–PT bulk single crystals are shown in
Figure 7 and
Figure 8, respectively.
From
Figure 7, it can be seen that with increasing indentation depth from 30 nm to 500 nm, the hardness decreased from 16.92 GPa to 7.50 GPa for the [100]-oriented PIN–PMN–PT bulk single crystal and from 8.46 GPa to 6.47 GPa for the [110]-oriented PIN–PMN–PT bulk single crystal. This indicated that the hardness decreased dramatically with the increase of the indentation depth from 30 nm to 500 nm. When the indentation depth exceeded 500 nm, the decreasing tendencies gradually slowed. When the indentation depth was more than 1300 nm, the hardness tended to be stable. Therefore, the indentation size effect on the hardness of the PIN–PMN–PT bulk single crystal appeared during the nanoindentation process. This indentation size effect is usually attributed to the large surface strain gradient and work hardening [
42,
43]. From
Figure 8, it can be seen that the Young’s modulus was almost independent of the indentation depth in the nanoindentation process.
The average hardness and Young’s modulus were evaluated in the indentation depth range from 1400 to 1600 nm, as shown in
Figure 7 and
Figure 8, respectively. The average hardnesses of the [100]- and [110]-oriented PIN–PMN–PT bulk single crystals were 5.98 GPa and 5.53 GPa, respectively. The average Young’s modulus of the [100]- and [110]-oriented PIN–PMN–PT bulk single crystals were 136.45 GPa and 132.74 GPa, respectively. Thus, both the hardness and Young’s modulus of the [100]-oriented PIN–PMN–PT bulk single crystal were a little larger than those of the [110]-oriented PIN–PMN–PT bulk single crystal, which indicated anisotropic mechanical characteristics in the PIN–PMN–PT bulk single crystal. The hardness and Young’s modulus reflect the resistance to plastic and elastic deformations, respectively. Therefore, the PIN–PMN–PT single crystal can endure more mechanical load and has higher stiffness and lower friction coefficient and wear rate in the [100] crystallographic direction. The PIN–PMN–PT single crystal can be more easily polished and subjected to ductile machining in the [110] crystallographic direction. The anisotropy of its mechanical characteristics is mainly attributed to the arrangement differences of its atoms, in different crystallographic directions. This anisotropy of the mechanical properties may also have some effect on the piezoelectric properties of PIN–PMN–PT single crystals.
4. Conclusions
The load–indentation depth curves, elastic and plastic deformations, hardnesses, and Young’s moduli of the [100]- and [110]-oriented relaxor-based ferroelectric 0.28PIN–0.43PMN–0.29PT bulk single crystals were investigated by the nanoindentation technique and continuous stiffness measurements. The conclusions are as follows:
(1) The load–indentation depth curves for the PIN–PMN–PT bulk single crystals featured a low noise level and small variation in the data, which reflects the good phase purity and uniformity of the PIN–PMN–PT bulk single crystals. There was no discontinuity in the load–indentation depth curves within an indentation depth of 2000 nm, which indicates that large cracks were not formed in the PIN–PMN–PT single crystals during the loading and unloading processes.
(2) With increasing the maximum indentation depth hmax from 500 nm to 2000 nm, both the elastic and the plastic deformations increased for both the [100]- and the [110]-oriented single crystals. However, with the increasing hmax, the elastic recovery percentage decreased, and the plastic residual percentage increased for both the [100]- and [110]-oriented single crystals. At each hmax, the elastic recovery percentage of the [100]-oriented PIN–PMN–PT bulk single crystal was larger than that of the [110]-oriented PIN–PMN–PT bulk single crystal, and the plastic residual percentage of the [100]-oriented PIN–PMN–PT bulk single crystal was less than that of the [110]-oriented PIN–PMN–PT bulk single crystal. In the hmax from 500 nm to 2000 nm, the plastic deformation was larger than the elastic deformation, and the plastic residual percentage was larger than 50% for both the [100]- and [110]-oriented single crystals, which means that the plastic deformation dominated in the indentation process of the PIN–PMN–PT bulk single crystals.
(3) The indentation size effect on the hardness of the PIN–PMN–PT bulk single crystals was apparent, which is usually attributed to the large surface strain gradient and work hardening. The Young’s modulus was almost independent of the indentation depth in the nanoindentation process. Both the hardness and the Young’s modulus of the [100] PIN–PMN–PT bulk single crystal were a little larger than those of the [110] PIN–PMN–PT bulk single crystal, which indicates that the PIN–PMN–PT bulk single crystal had anisotropic mechanical characteristics. These anisotropic mechanical characteristics were mainly attributed to the arrangement of atoms in different crystallographic directions.
Author Contributions
Conceptualization, J.L., W.Z., and Y.X.; methodology, J.L., W.Z., and F.L.; software, J.L., W.Z., and X.H.; validation, J.L., W.Z., and S.Y.; formal analysis, J.L. and W.Z.; investigation, J.L. and W.Z.; resources, G.X.; data curation, J.L. and W.Z.; writing—original draft preparation, J.L. and W.Z.; writing—review and editing, C.Z. and Y.X.; visualization, W.Z.; supervision, J.L.; project administration, J.L.; funding acquisition, J.L. All authors have read and agreed to the published version of the manuscript.
Funding
This research was funded by the National Science Foundation of China (Grant No. 11562016, 11762014, 11762013, and 11972221), the Natural Science Foundation of Inner Mongolia Autonomous Region (Grant No. 2018MS01013 and 2013MS0107), and the Science Research Project of Inner Mongolia University of Technology (Grant No. X201713 and ZZ201812).
Acknowledgments
The authors express their greatest thanks to Jingfeng Wang for his excellent technical support.
Conflicts of Interest
The authors declare no conflict of interest.
References
- Wadhawan, V.K.; Pandit, P.; Gupta, S.M. PMN-PT based relaxor ferroelectrics as very smart materials. Mater. Sci. Eng. B 2005, 120, 199–205. [Google Scholar] [CrossRef]
- Zhang, R.; Jiang, B.; Cao, W.W. Elastic, piezoelectric, and dielectric properties of multidomain 0.67Pb(Mg1/3Nb2/3) O3-0.33PbTiO3 single crystals. J. Appl. Phys. 2001, 90, 3471–3475. [Google Scholar] [CrossRef]
- Li, F.; Zhang, S.J.; Xu, Z.; Wei, X.Y.; Luo, J.; Shrout, T.R. Temperature independent shear piezoelectric response in relaxor-PbTiO3 based crystals. Appl. Phys. Lett. 2010, 97, 252903. [Google Scholar] [CrossRef] [PubMed]
- Sun, E.W.; Cao, W.W. Relaxor-based ferroelectric single crystals: Growth, domain engineering, characterization and applications. Prog. Mater. Sci. 2014, 65, 124–210. [Google Scholar] [CrossRef] [PubMed]
- Straub, F.K.; Ngo, H.T.; Aanad, V.; Domzalski, D.B. Development of a piezoelectric actuator for trailing edge flap control of full scale rotor blades. Smart Mater. Struct. 2001, 10, 25–34. [Google Scholar] [CrossRef]
- Das, S.; Herklotz, A.; Guo, E.J.; Dörr, K. Static and reversible elastic strain effects on magnetic order of La0.7Ca0.3MnO3/SrTiO3 superlattices. J. Appl. Phys. 2014, 115, 143902. [Google Scholar] [CrossRef]
- Guo, E.J.; Roth, R.; Das, S.; Dörr, K. Strain induced low mechanical switching force in ultrathin PbZr0.2Ti0.8O3 films. Appl. Phys. Lett. 2014, 105, 012903. [Google Scholar] [CrossRef]
- Das, S.; Herklotz, A.; Pippel, E.; Guo, E.J.; Rata, D.; Dörr, K. Strain dependence of antiferromagnetic interface coupling in La0.7Sr0.3MnO3/SrRuO3 superlattices. Phys. Rev. B 2015, 91, 134405. [Google Scholar] [CrossRef]
- Guo, E.J.; Roth, R.; Das, S.; Herklotz, A.; Dörr, K. Strain-induced improvement of retention loss in PbZr0.2Ti0.8O3 films. Appl. Phys. Lett. 2015, 106, 072904. [Google Scholar] [CrossRef]
- Trolier-McKinstry, S.; Zhang, S.J.; Bell, J.A.; Tan, X.L. High-performance piezoelectric crystals, ceramics, and films. Annu. Rev. Mater. Res. 2018, 48, 191–217. [Google Scholar] [CrossRef]
- Xie, Q.X.; Hu, Y.Q.; Zhao, X.Y.; Wang, F.F.; Tang, Y.X.; Zhang, Q.Z.; Chen, M.Z.; Shi, W.Z.; Lin, D.; Luo, H.S. Theoretical analysis of high electromechanical coupling surface acoustic wave propagating on lead-free Na0.5Bi0.5TiO3-BaTiO3 single crystal. Scr. Mater. 2020, 178, 372–375. [Google Scholar] [CrossRef]
- Guo, E.J.; Herklotz, A.; Roth, R.; Christl, M.; Das, S. Tuning the switching time of BiFeO3 Capacitors by Electrodes’ conductivity. Appl. Phys. Lett. 2013, 103, 022905. [Google Scholar] [CrossRef]
- Guo, E.J.; Das, S.; Herklotz, A. Enhancement of switching speed of BiFeO3 capacitors by magnetic fields. APL Mater. 2014, 2, 096107. [Google Scholar] [CrossRef]
- Kim, J.; Yamanaka, S.; Murayama, I.; Katou, T.; Nakayama, T.; Takeda, M.; Yamada, N.; Nishihata, Y.; Fukuda, T.; Tanaka, H.; et al. Temperature stability of PIN-PMN-PT ternary ceramics during pyroeletric power generation. J. Alloys Compd. 2018, 768, 22–27. [Google Scholar] [CrossRef]
- Luo, L.; Zhao, X.; Luo, H. Single Crystal PZN-PT, PMN-PT, PSN-PT, and PIN-PT-Based Piezoelectric Materials. In Advanced Piezoelectric Materials: Science and Technology, 2nd ed.; Uchino, K., Ed.; Elsevier Science & Technology Publishing: Cambridge, UK, 2017; pp. 271–318. [Google Scholar]
- Sun, E.W.; Cao, W.W.; Han, P.D. Complete set of material properties of [011]c poled 0.24Pb(In1/2Nb1/2) O3-0.46Pb(Mg1/3Nb2/3) O3-0.30PbTiO3 single crystal. Mater. Lett. 2011, 65, 2855–2857. [Google Scholar] [CrossRef]
- Ahart, M.; Somayazulu, M.; Cohen, R.E.; Ganesh, P.; Dera, P.; Mao, H.-K.; Hemley, R.J.; Ren, Y.; Liermann, P.; Wu, Z.G. Origin of morphotropic phase boundaries in ferroelectrics. Nature 2008, 451, 545–548. [Google Scholar] [CrossRef]
- Martin, A.; Khansur, N.H.; Riess, K.; Webber, K.G. Frequency dependence of the relaxor-to-ferroelectric transition under applied electrical and mechanical fields. J. Eur. Ceram. Soc. 2019, 39, 1031–1041. [Google Scholar] [CrossRef]
- Wan, Q.; Chen, C.; Shen, Y.P. Effects of stress and electric field on the electromechanical properties of Pb(Mg1/3Nb2/3) O3-0.32PbTiO3 single crystals. J. Appl. Phys. 2005, 98, 024103. [Google Scholar] [CrossRef]
- Das, S.; Biswal, A.K.; Parida, K.; Choudhary, R.N.P.; Roy, A. Electrical and mechanical behavior of PMN-PT/CNT based polymer composite film for energy harvesting. Appl. Surf. Sci. 2018, 428, 356–363. [Google Scholar] [CrossRef]
- Chen, Y.; Xu, J.G.; Xie, S.X.; Nie, R.; Yuan, J.; Wang, Q.Y.; Zhu, J.G. Failure mode, ferroelastic behavior and toughening effect of bismuth titanate ferroelectric ceramics under uniaxial compression load. Mater. Des. 2018, 152, 54–64. [Google Scholar] [CrossRef]
- Won, S.S.; Seo, H.; Kawahara, M.; Glinsek, S.; Lee, J.; Kim, Y.; Jeong, C.K.; Kingon, A.I.; Kim, S.-H. Flexible vibrational energy harvesting devices using strain-engineered perovskite piezoelectric thin films. Nano Energy 2019, 55, 182–192. [Google Scholar] [CrossRef]
- Fang, X.Q.; Bai, G.X. Preparation and service performance characterization of Ni/PMN-PT: Effect of preparation temperature. J. Alloys Compd. 2018, 735, 1131–1136. [Google Scholar] [CrossRef]
- Chen, Y.; Zhang, Y.; Zhang, L.; Ding, F.; Schmidt, O.G. Scalable single crystalline PMN-PT nanobelts sculpted from bulk for energy harvesting. Nano Energy 2017, 31, 239–246. [Google Scholar] [CrossRef]
- Muhammad, M.; Masoomi, M.; Torries, B.; Shamsaei, N.; Haghshenas, M. Depth-sensing time-dependent response of additively manufactured Ti-6Al-4V alloy. Addit. Manuf. 2018, 24, 37–46. [Google Scholar] [CrossRef]
- Sribalaji, M.; Asiq Rahman, O.S.; Laha, T.; Keshri, A.K. Nanoindentation and nanoscratch behavior of electroless deposited nickel-phosphorous costing. Mater. Chem. Phys. 2016, 177, 220–228. [Google Scholar] [CrossRef]
- Guo, H.; Jiang, C.B.; Yang, B.J.; Wang, J.Q. Deformation behavior of Al-rich metallic glasses under nanoindentation. J. Mate. Sci. Technol. 2017, 33, 1272–1277. [Google Scholar] [CrossRef]
- Nomura, K.-I.; Chen, Y.-C.; Kalia, R.K.; Nakano, A.; Vashishta, P. Defect migration and recombination in nanoindentation of silica glass. Appl. Phys. Lett. 2011, 99, 111906. [Google Scholar] [CrossRef]
- Jiao, Z.-M.; Ma, S.-M.; Yuan, G.-Z.; Wang, Z.-H.; Yang, H.-J.; Qiao, J.-W. Plastic deformation of Al0.3CoCrFeNi and AlCoCrFeNi high-entropy alloys under nanoindentation. J. Mater. Eng. Perform. 2015, 24, 3077–3083. [Google Scholar] [CrossRef]
- Gaillard, Y.; Macías, A.H.; Munioz-Saldania, J.; Anglada1, M.; Trápaga, G. Nanoindentation of BaTiO3: Dislocation nulcleation and mechanical twinning. J. Phys. D Appl. Phys. 2009, 42, 085502. [Google Scholar] [CrossRef]
- Fang, D.N.; Jiang, Y.J.; Li, S.; Sun, C.T. Interactions between domain switching and crack propagation in poled BaTiO3 single crystal under mechanical loading. Acta Mater. 2007, 55, 5758–5767. [Google Scholar] [CrossRef]
- Babu, P.R.; Selvamani, R.; Singh, G.; Kalainathan, S.; Babu, R.; Tiwari, B.S. Growth, mechanical and domain structure studies of Na0.5Bi0.5TiO3 single ceystal grown by flux growth method. J. Alloys Compd. 2017, 721, 199–204. [Google Scholar] [CrossRef]
- Zhou, H.; Pei, Y.M.; Li, F.X.; Luo, H.S.; Fang, D.N. Electric-field-tunable mechanical properties of relaxor ferroelectric single crystal measured by nanoindentation. Appl. Phys. Lett. 2014, 104, 061904. [Google Scholar] [CrossRef]
- Zeng, K.Y.; Pang, Y.-S.; Shen, L.; Rajan, K.K.; Lim, L.-C. Elastic modulus, hardness and fracture behavior of Pb(Zn1/3Nb2/3) O3–PbTiO3 single crystal. Mater. Sci. Eng. A 2008, 472, 35–42. [Google Scholar] [CrossRef]
- Li, X.D.; Bhushan, B. A review of nanoindentation continuous stiffness measurement technique and its applications. Mater. Charact. 2002, 48, 11–36. [Google Scholar] [CrossRef]
- Vachhani, S.J.; Doherty, R.D.; Kalidindi, S.R. Effect of the continuous stiffness measurement on the mechanical properties extracted using spherical nanoindentation. Acta Mater. 2013, 61, 3744–3751. [Google Scholar] [CrossRef]
- Li, X.D.; Bhushan, B. Development of continuous stiffness measurement technique for composite magnetic tapes. Scripta. Mater. 2000, 42, 929–935. [Google Scholar] [CrossRef]
- Oliver, W.C.; Pharr, G.M. An improved technique for determining hardness and elastic modulus using load and displacement sensing indentation experiment. J. Mater. Res. 1992, 7, 1564–1583. [Google Scholar] [CrossRef]
- Pharr, G.M.; Oliber, W.C. Measurement of Thin Film Mechanical properties using nanoindentation. MRS Bull. 1992, 17, 28–33. [Google Scholar] [CrossRef]
- Damjanovic, D. Ferroelectric, dielectric and piezoelectric properties of ferroelectric thin films and ceramics. Rep. Prog. Phys. 1998, 61, 1267–1324. [Google Scholar] [CrossRef]
- Wong, M.F.; Zeng, K.Y. Elastic–plastic deformation of Pb(Zn1/3Nb2/3) O3–(6–7)%PbTiO3 single crystals during nanoindentation. Philos. Mag. 2010, 90, 1685–1700. [Google Scholar] [CrossRef]
- Xiao, X.Z.; Chen, L.R.; Yu, L.; Duan, H.L. Modelling nano-indentation of ion-irradiated FCC single crystals by strain-gradient crystal plasticity theory. Int. J. Plast. 2019, 116, 216–231. [Google Scholar] [CrossRef]
- Yonezu, A.; Xu, B.X.; Chen, X. Indentation induced lateral crack in ceramics with surface hardening. Mater. Sci. Eng. A 2009, 507, 226–235. [Google Scholar] [CrossRef]
© 2020 by the authors. Licensee MDPI, Basel, Switzerland. This article is an open access article distributed under the terms and conditions of the Creative Commons Attribution (CC BY) license (http://creativecommons.org/licenses/by/4.0/).


