2.1. Influence of Calcination Temperature
The SDP method typically involves two steps: Grinding of the reactants and calcination of the resultant intermediate. Therefore, any change in the calcination temperature can modify the final catalyst properties and in turn affect the dehydrogenation capability [
20]. Thus, the MPdA catalysts prepared by calcination between 400 °C and 700 °C at intervals of 100 °C were characterized by various techniques.
The textural properties of the calcined MPdA samples were examined by N
2 physisorption (
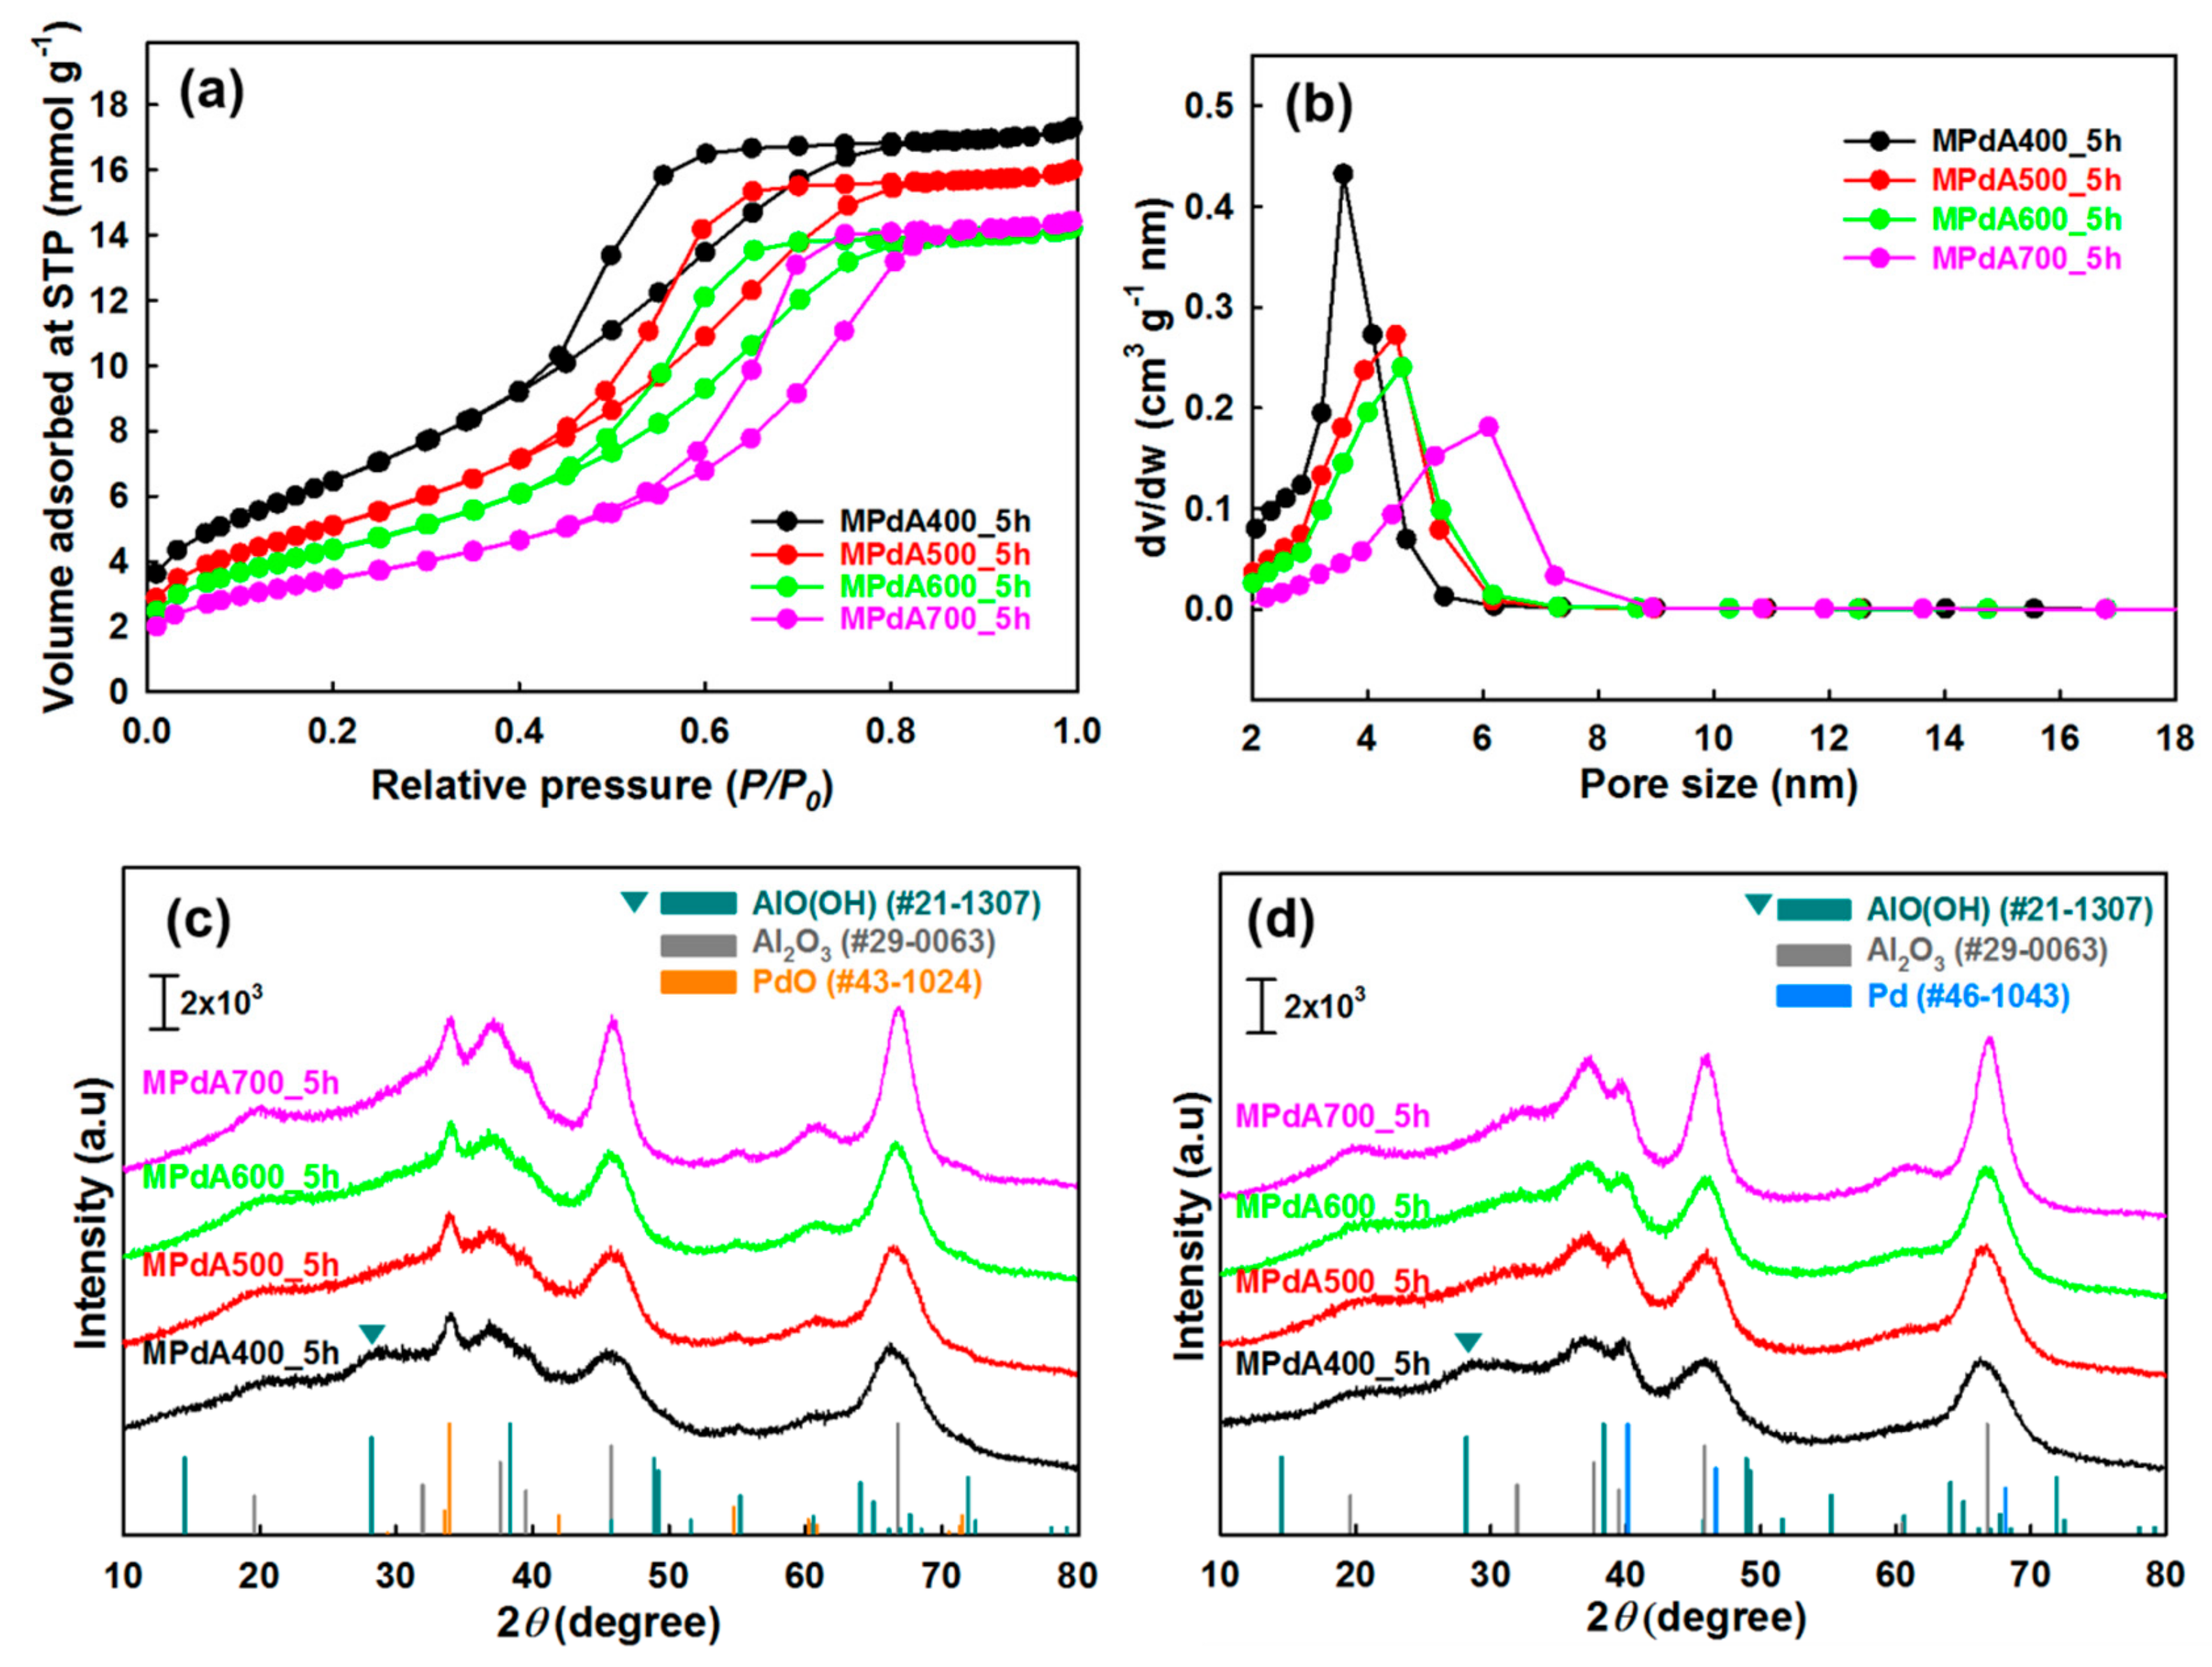
Table 1). All of the samples exhibit type IV isotherms with a hysteresis loop, and confirm the existence of well-developed mesopores. These hysteresis loops, comprised by H2 and H3, indicate the existence of an ink-bottle or channel-like pore connectivity (
Figure 1a) and the samples exhibit a relatively narrow pore size distribution (
Figure 1b), which agree well with the results of previous reports [
9,
22]. In detail, the sample calcined at 400 °C (MPdA400_5h) achieved a Brunauer–Emmett–Teller (BET) surface area of 532 m
2 g
−1, pore volume of 0.59 cm
3 g
−1, and pore size of 3.5 nm. As the calcination temperature increased from 400 °C to 700 °C, the BET surface area continuously decreased (to 282 m
2 g
−1) as did the pore volume (to 0.49 cm
3 g
−1), while the average pore size increased to 5.2 nm. The declines in the BET surface area and pore volume and increase in the pore size can be explained by the growth of alumina particles. A similar trend was noted in earlier literature [
23]. Notably, the capillary condensation shifted toward higher relative pressures as the calcination temperature increased, suggesting an enlargement in the pore size due to development of Al
2O
3 particles. This is consistent with the observations of Zheng et al. [
24] and Seo et al. [
25].
The MPdA samples calcined at different temperatures for 5 h were analyzed by X-ray diffraction (XRD).
Figure 1c displays the characteristic peaks of γ-Al
2O
3 (JCPDS #00-029-0063) and PdO (JCPDS #00-043-1024) in all XRD patterns. However, MPdA400_5h displays another diffraction peak, which is related to boehmite (AlOOH) species (JCPDS #00-021-1307), along with the γ-Al
2O
3 and PdO peaks. Smith et al. [
26] stated that the boehmite precursor could be transformed to the γ-Al
2O
3 phase below 300 °C; however, the γ-Al
2O
3 at 400 °C still had a substantial amount of boehmite-like stacking-fault defects which gradually disappeared with a rise in calcination temperature. Thus, the presence of boehmite species in MPdA400_5h is inevitable due to the lower calcination temperature, and the absence of diffractions of boehmite species above 400 °C verifies its transformation to the γ-Al
2O
3 phase.
Furthermore, the increase in the calcination temperature resulted in enlarged reflections of γ-Al
2O
3. This verifies the growth of alumina particles, which will eventually affect the textural properties, such as the decline in BET surface area and pore volume with a corresponding increase in pore size. This was markedly noticed in the N
2 adsorption–desorption results. Although an insignificant change was observed in the intensities of the PdO diffraction peaks, MPdA600_5h among the studied catalysts clearly exhibited low intense PdO diffraction peaks manifesting smaller-size PdO particles. Thus, we examined the XRD patterns of MPdA catalysts reduced at 350 °C for 3 h, which revealed the existence of metallic Pd nanoparticles (JCPDS #00-046-1043) along with the γ-Al
2O
3 visibly presented in
Figure 1d. Additionally, a diffraction peak related to boehmite persists in MPdA400_5h, defining that the reduction no longer affects any other species in the calcined catalyst apart from the change of PdO to metallic Pd. However, the diffraction peaks of the metallic Pd nanoparticles in the reduced MPdA catalysts overlap with the diffractions of the support γ-Al
2O
3, introducing a complication in the calculation of Pd particle size using the Scherer equation. Therefore, CO-chemisorption was conducted instead to determine the Pd particle size along with the Pd dispersion and metal surface area of the reduced MPdA catalysts.
Table 1 shows the Pd dispersion, particle size, and metal surface area of the MPdA catalysts calcined at different temperatures obtained via CO chemisorption after reduction at 350 °C. All catalysts exhibited Pd nanoparticles in the range of 2.6–3.5 nm, even though the calcination temperatures ranging from 400 to 700 °C were considered to be high. Among the studied catalysts, MPdA600_5h yielded the smallest Pd particles (2.6 nm) with higher dispersion (42%) and metal surface area (190 m
2 g
−1), while larger Pd particles (3.5 nm) with inferior dispersion (32%) and metal surface area (143 m
2 g
−1) were achieved by MPdA400_5h. It is worth mentioning that the particle size of Pd decreased and particle dispersion and metal surface area values increased for the calcination temperature of 600 °C, and a further increase in temperature to 700 °C enhanced the Pd particle size but diminished the particle dispersion and metal surface area. The existence of larger Pd particles with lower dispersion and metal surface areas in MPdA400_5h and MPdA500_5h is quite surprising as compared to the cases of MPdA600_5h and MPdA700_5h.
It is well known that the properties of the support Al
2O
3 always regulate the particle size and dispersions of Pd in Pd/Al
2O
3 catalysts. Byun et al. [
20] studied the influence of the calcination temperature on the structural properties of alumina for Pd/Al
2O
3 and found that the size and distribution of Pd particles depend on the phase transition and on the ratio of isolated tetrahedral to condensed octahedral coordination sites. They also reported that the Pd/Al
2O
3 prepared by using Al
2O
3 calcined at 900 °C delivered greater Pd dispersion with smaller size Pd particles compared to those prepared by using Al
2O
3 calcined at 500 °C owing to the presence of higher numbers of isolated tetrahedral sites (AlO
4) than condensed octahedral sites (AlO
6), which have superior interaction capability with Pd. In the present study, all MPdA catalysts were synthesized in a single step by mixing their precursors; hence the distribution and particle sizes of Pd may also depend on the synthesis procedure as well as on the properties of the Al
2O
3. Therefore, the reality of smaller-size Pd particles in all the MPdA catalysts, irrespective of the calcination temperature, may result from the solvent deficient environment generated in the synthesis procedure, which inhibits the migration of reagent materials that would subsequently terminate the nucleation of nanoparticles [
27,
28]. It was established in our previous study that PdO and γ-Al
2O
3 were the final phases of their precursors (i.e., boehmite (AlOOH) for Al and PdO, Pd(NH
3)
2(NO
2)
2, and (Pd(NO
2)(NH
3)
3)
2(Pd(NH
3)
4(NO
3)
4) for Pd) in the MPdA catalyst after calcination [
9]. Hence, the interactions between the Al and Pd precursors can decide the distribution and particle size of the Pd, which is ultimately sensitive to the calcination temperature.
Thus, a possible explanation is outlined as follows; the prevalence of larger-size Pd particles in MPdA400_5h can be attributed to the presence of boehmite-like stacking-fault defects, which are clearly perceived in its XRD. The rise in calcination temperature to 500 °C resulted in a trivial difference in the Pd particle size and dispersion. Thus, MPdA500_5h may also have a considerable amount of boehmite-like stacking-fault defects, even though these species were not apparent in its XRD, but were well explained in an earlier report [
26]. The realization of smaller-size Pd particles with higher dispersion in MPdA600_5h further confirms the healing of boehmite-like stacking-fault defects and agrees with the observations by Smith et al. [
26]. In our tests, a further rise in calcination temperature again produced an increase in particle size with a decrease in dispersion, which was purely related to the aggregation of Pd particles due to exposure to elevated temperatures. These results are well supported by the XRD, where low, intense PdO diffraction peaks in MPdA600_5h are observed among the studied catalysts.
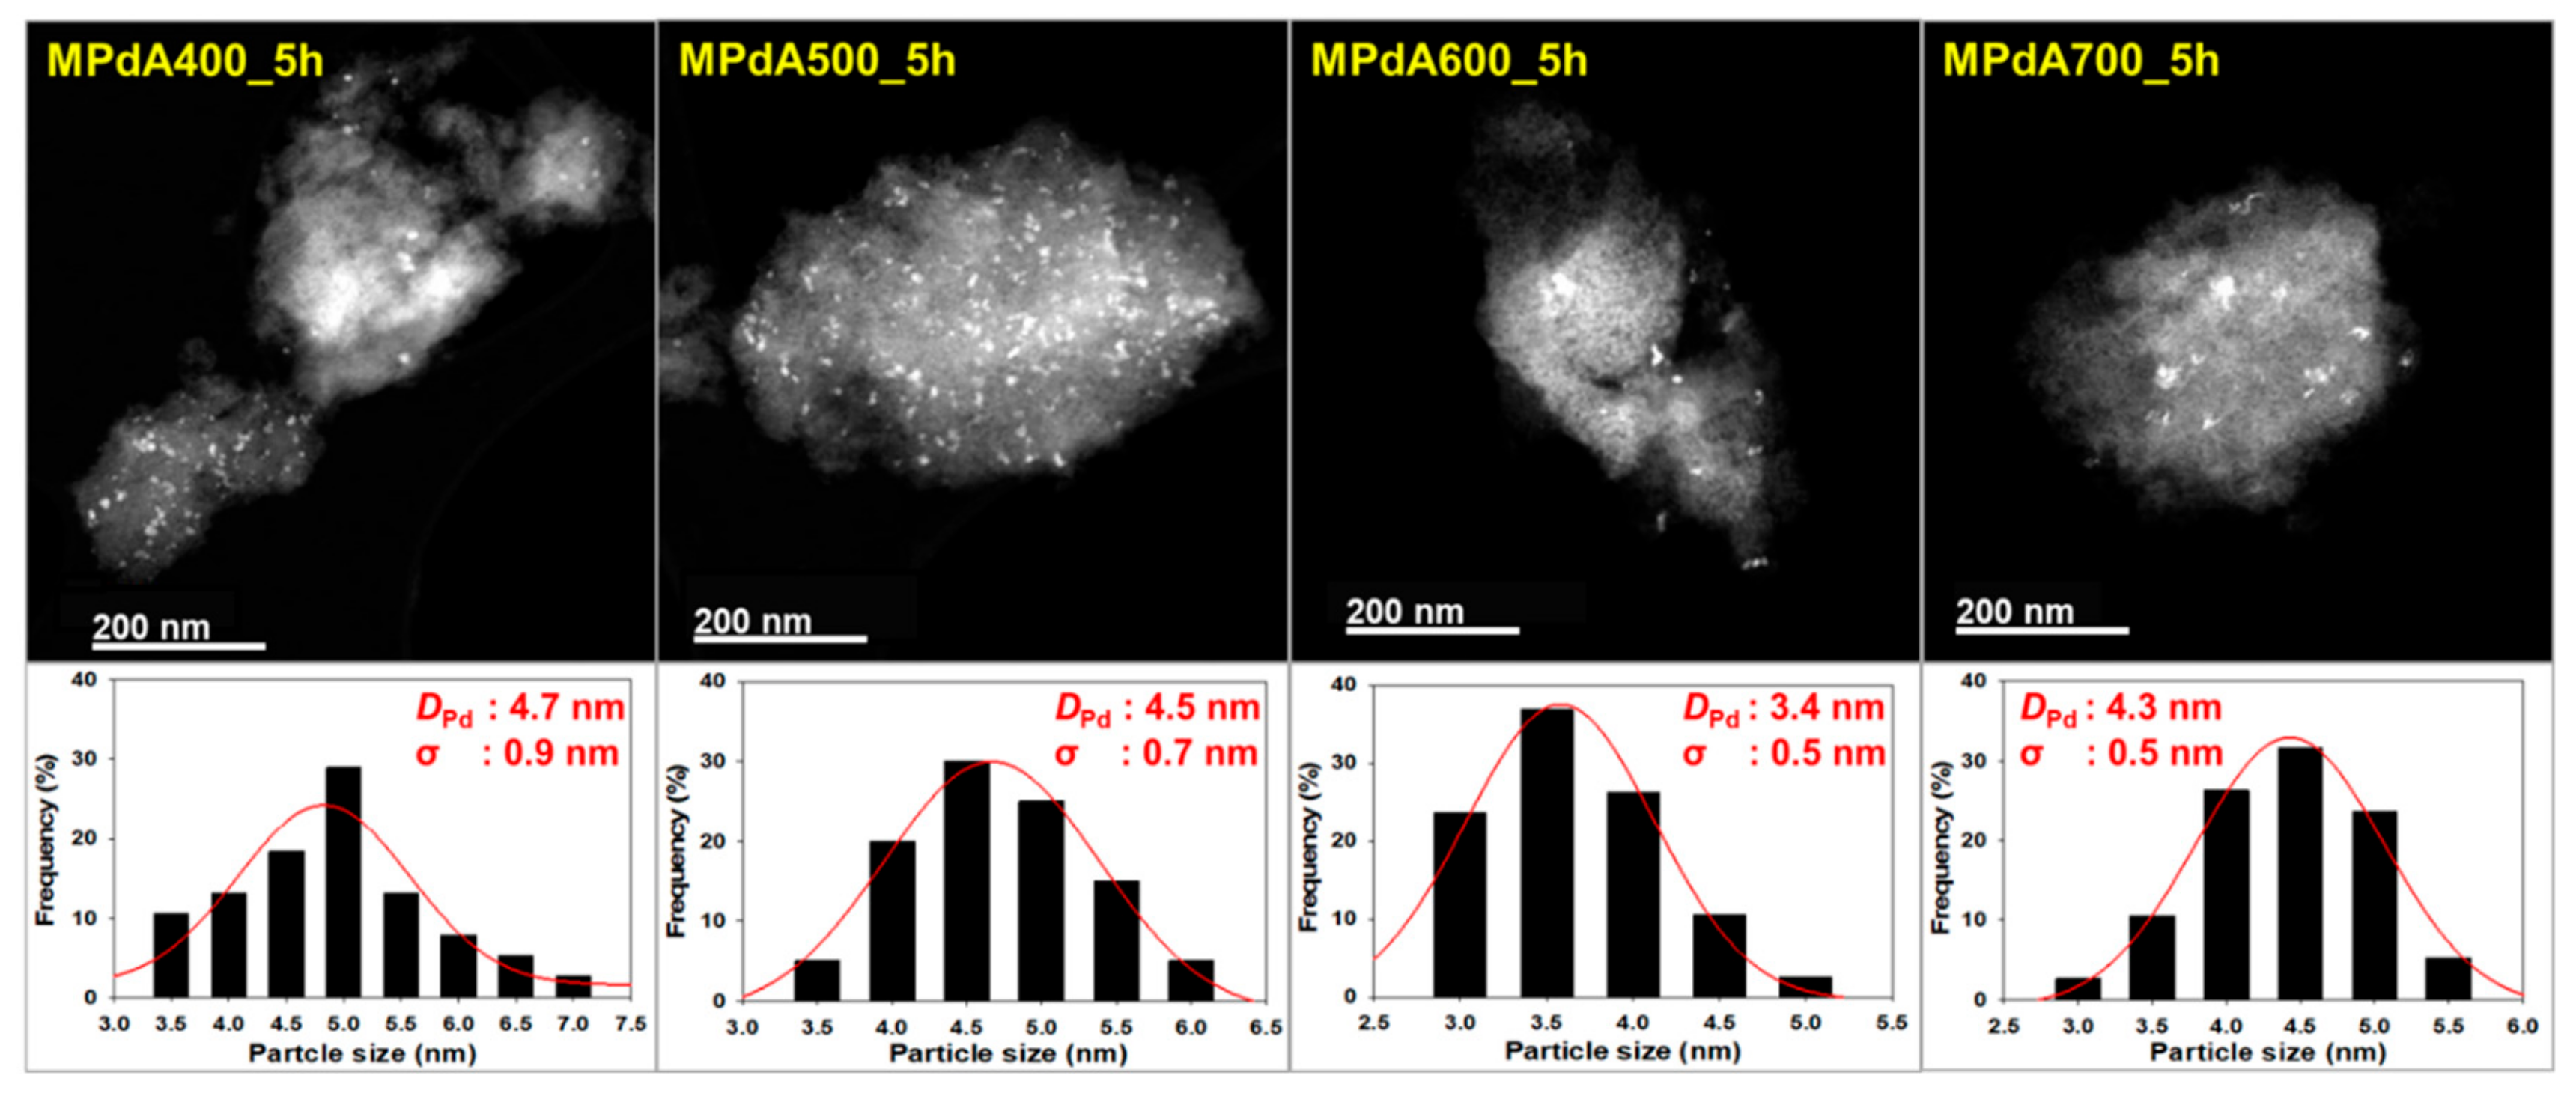
Figure 2 displays the high angle annular dark field scanning transmission electron microscopy (HAADF-STEM) images and particle size distributions of the reduced MPdA catalysts calcined at different temperatures for 5 h, and the average Pd particle sizes are listed in
Table 1. All MPdA catalysts revealed that the particles of Pd (bright colored) and Al
2O
3 (grey colored) were stacked fairly tightly, regardless of the calcination temperature. These results agree well with previous literature [
22]. Particle size distribution diagrams show that all MPdA catalysts yielded smaller-size Pd particles with a difference of approximately 1 nm through a significant range in the calcination temperature, owing to the solvent deficient environment, which controls the grain growth of the precipitate and ultimately leads to smaller-size Pd particles. The mean size of the Pd particles in the MPdA catalysts decreased in the following order: MPdA400_5h (4.7 nm) > MPdA500_5h (4.5 nm) > MPdA700_5h (4.3 nm) > MPdA600_5h (3.4 nm). The present findings are in good agreement with the results of the XRD and CO-chemisorption analyses. Furthermore, the TEM images also disclosed an irregular distribution of Pd particles, which can also be clearly observed in their EDS mapping images (not shown here for brevity). It was well documented in our previous study [
9] that both palladium and alumina particles are involved in the mesopore formation; therefore, the Pd particles are protected by the Al
2O
3, which limits the migration of Pd particles within the catalyst. This causes the uneven distribution of the Pd particles.
H
2-temperature programmed reduction (H
2-TPR) profiles of the MPdA catalysts calcined at different temperatures for 5 h are shown in
Figure 3, and their H
2 consumption values are listed in
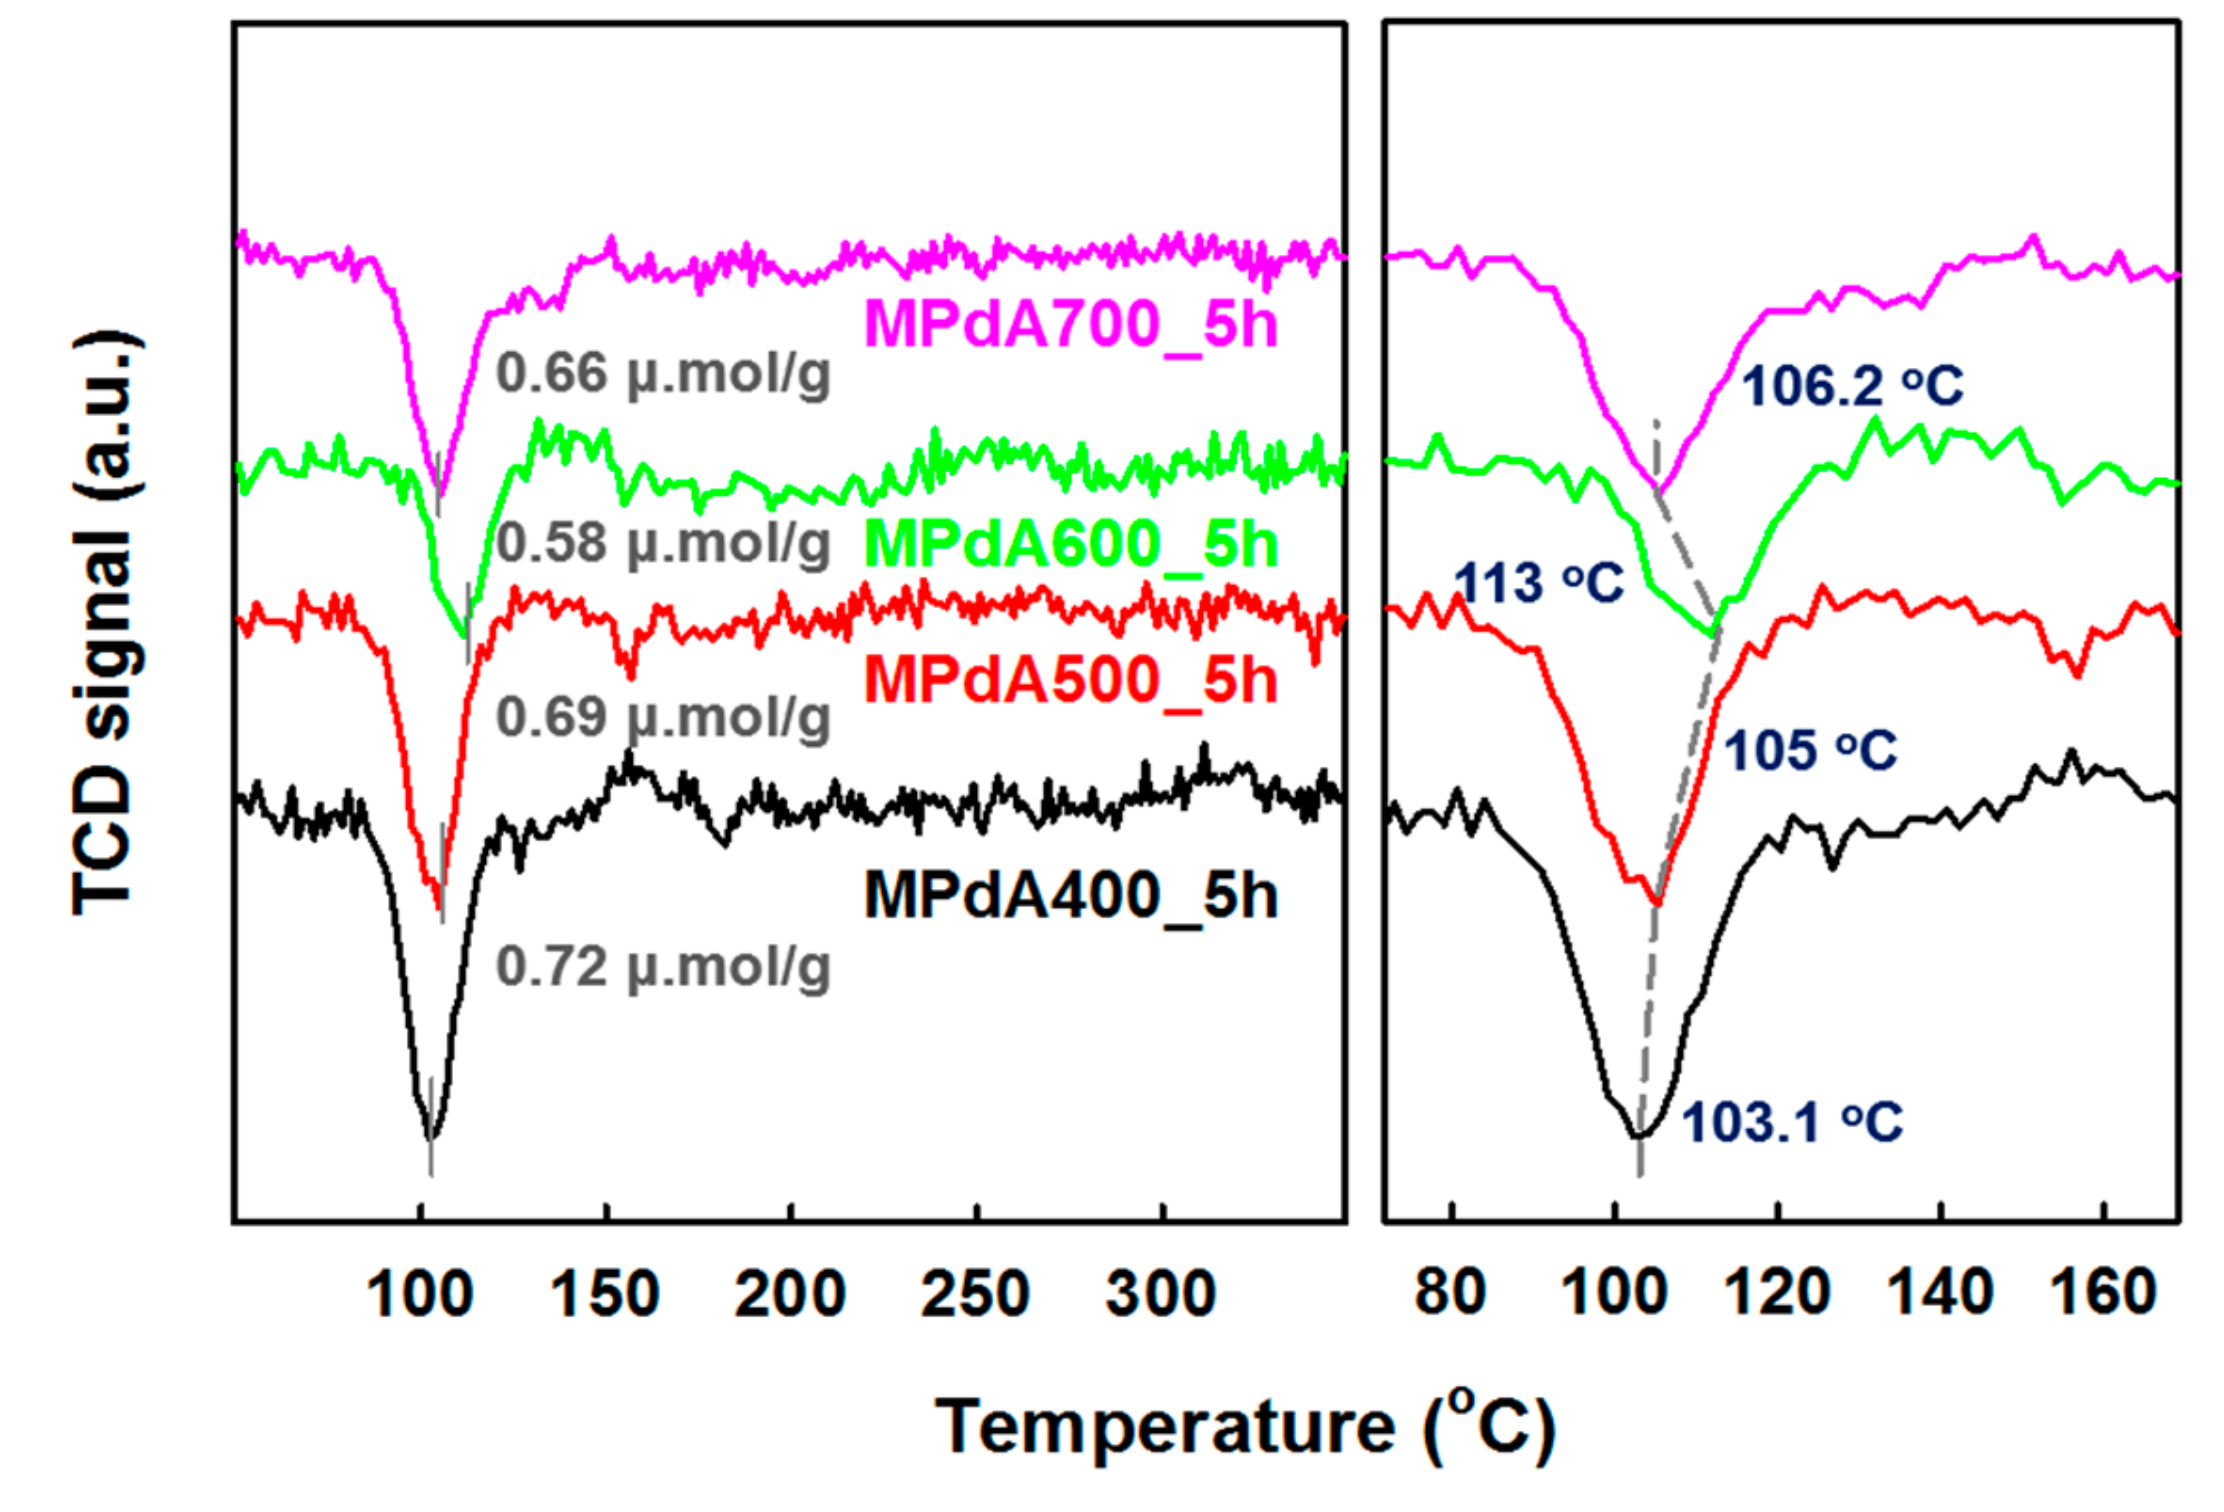
Table 1. A negative H
2 consumption peak with varying intensity was observed between the Tmax of 103 °C and 113 °C in all MPdA catalysts regardless of calcination temperature. It is well known that the reduction of PdO particles occurs below room temperature, and that they then instantly become a Pd hydride (β-PdH) species by the adsorption/diffusion of hydrogen into the generated metallic Pd crystallites in Pd/Al
2O
3 [
29,
30]. The formed Pd hydride species later decompose at a higher temperature and exhibit a negative peak. Furthermore, the intensity and position of the negative peak infer the size and dispersion of Pd particles. For instance, larger-size Pd particles have higher H
2 storage capacity, and therefore exhibit higher intense negative peaks, whereas smaller-size Pd particles exhibit low intense negative peaks owing to their lower H
2 storage capacity. Similarly, β-PdH formed by the larger-size Pd particles decomposes at lower temperatures, whereas the β-PdH formed by the smaller-size Pd particles decomposes at higher temperatures [
31,
32]. Hence, one can confirm that the obtained negative H
2 consumption peak is due to the decomposition of Pd hydrate species formed at ambient temperature (i.e., during the H
2 purge prior to TPR analysis). Among all catalysts tested, MPdA400_5h exhibited the highest intense negative peak at 103 °C, which infers the existence of larger-size Pd particles. In contrast, an increase in the calcination temperature produced a decrease in the negative peak intensity along with a shift in the β-PdH decomposition temperature to higher values, such as 105 °C and 113 °C for MPdA500_5h and MPdA600_5h, respectively. A further increase in the calcination temperature to 700 °C (MPdA700_5h) resulted in a small increase in the intensity of the negative peak along with a slight shift in the β-PdH decomposition temperature to 106 °C. Thus, the outcomes of H
2-TPR endorses that the MPdA600_5h catalyst ensured the lowest intense negative peak with high temperature β-PdH decomposition among the studied catalysts. This confirms the presence of smaller-size Pd particles in MPdA600_5h. Likewise, the hydrogen consumption values of the MPdA catalysts followed the order: MPdA400_5h (0.72 μmol g
−1) > MPdA500_5h (0.69 μmol g
−1) > MPdA700_5h (0.66 μmol g
−1) > MPdA600_5h (0.58 μmol g
−1). The variation in the hydrogen consumption values once again infers the existence of smaller-size Pd particles in MPdA600_5h, while the largest particles are present in MPdA400_5h. The obtained results agree with the conclusions obtained from CO-chemisorption and HAADF-STEM analyses.
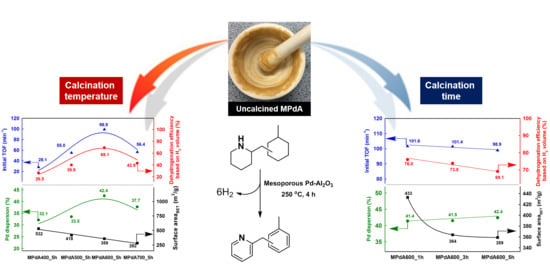
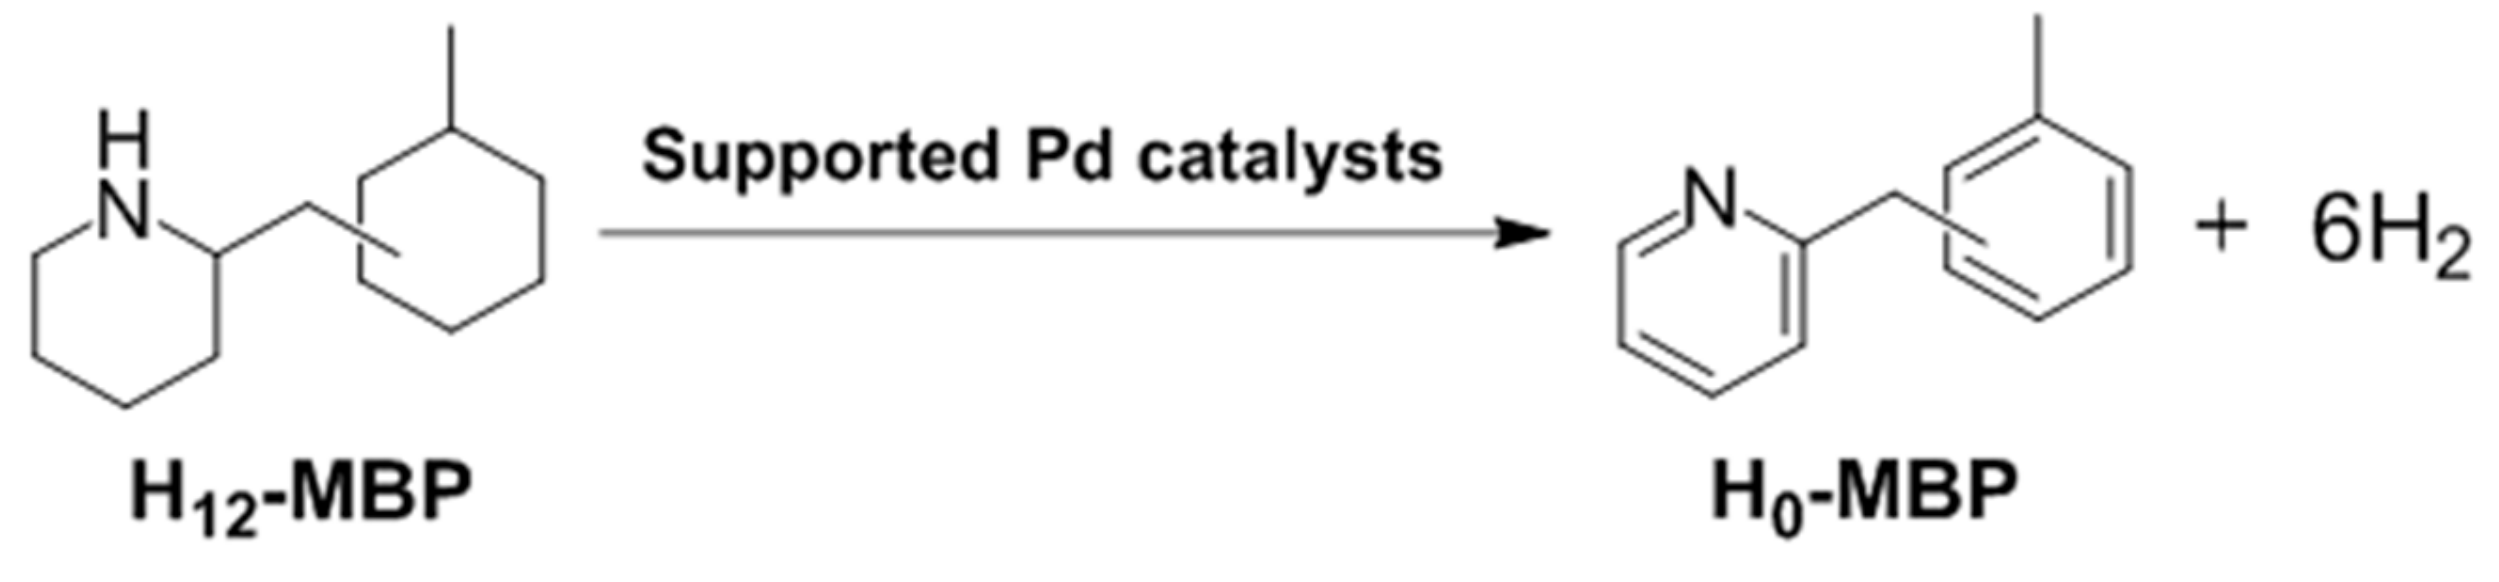
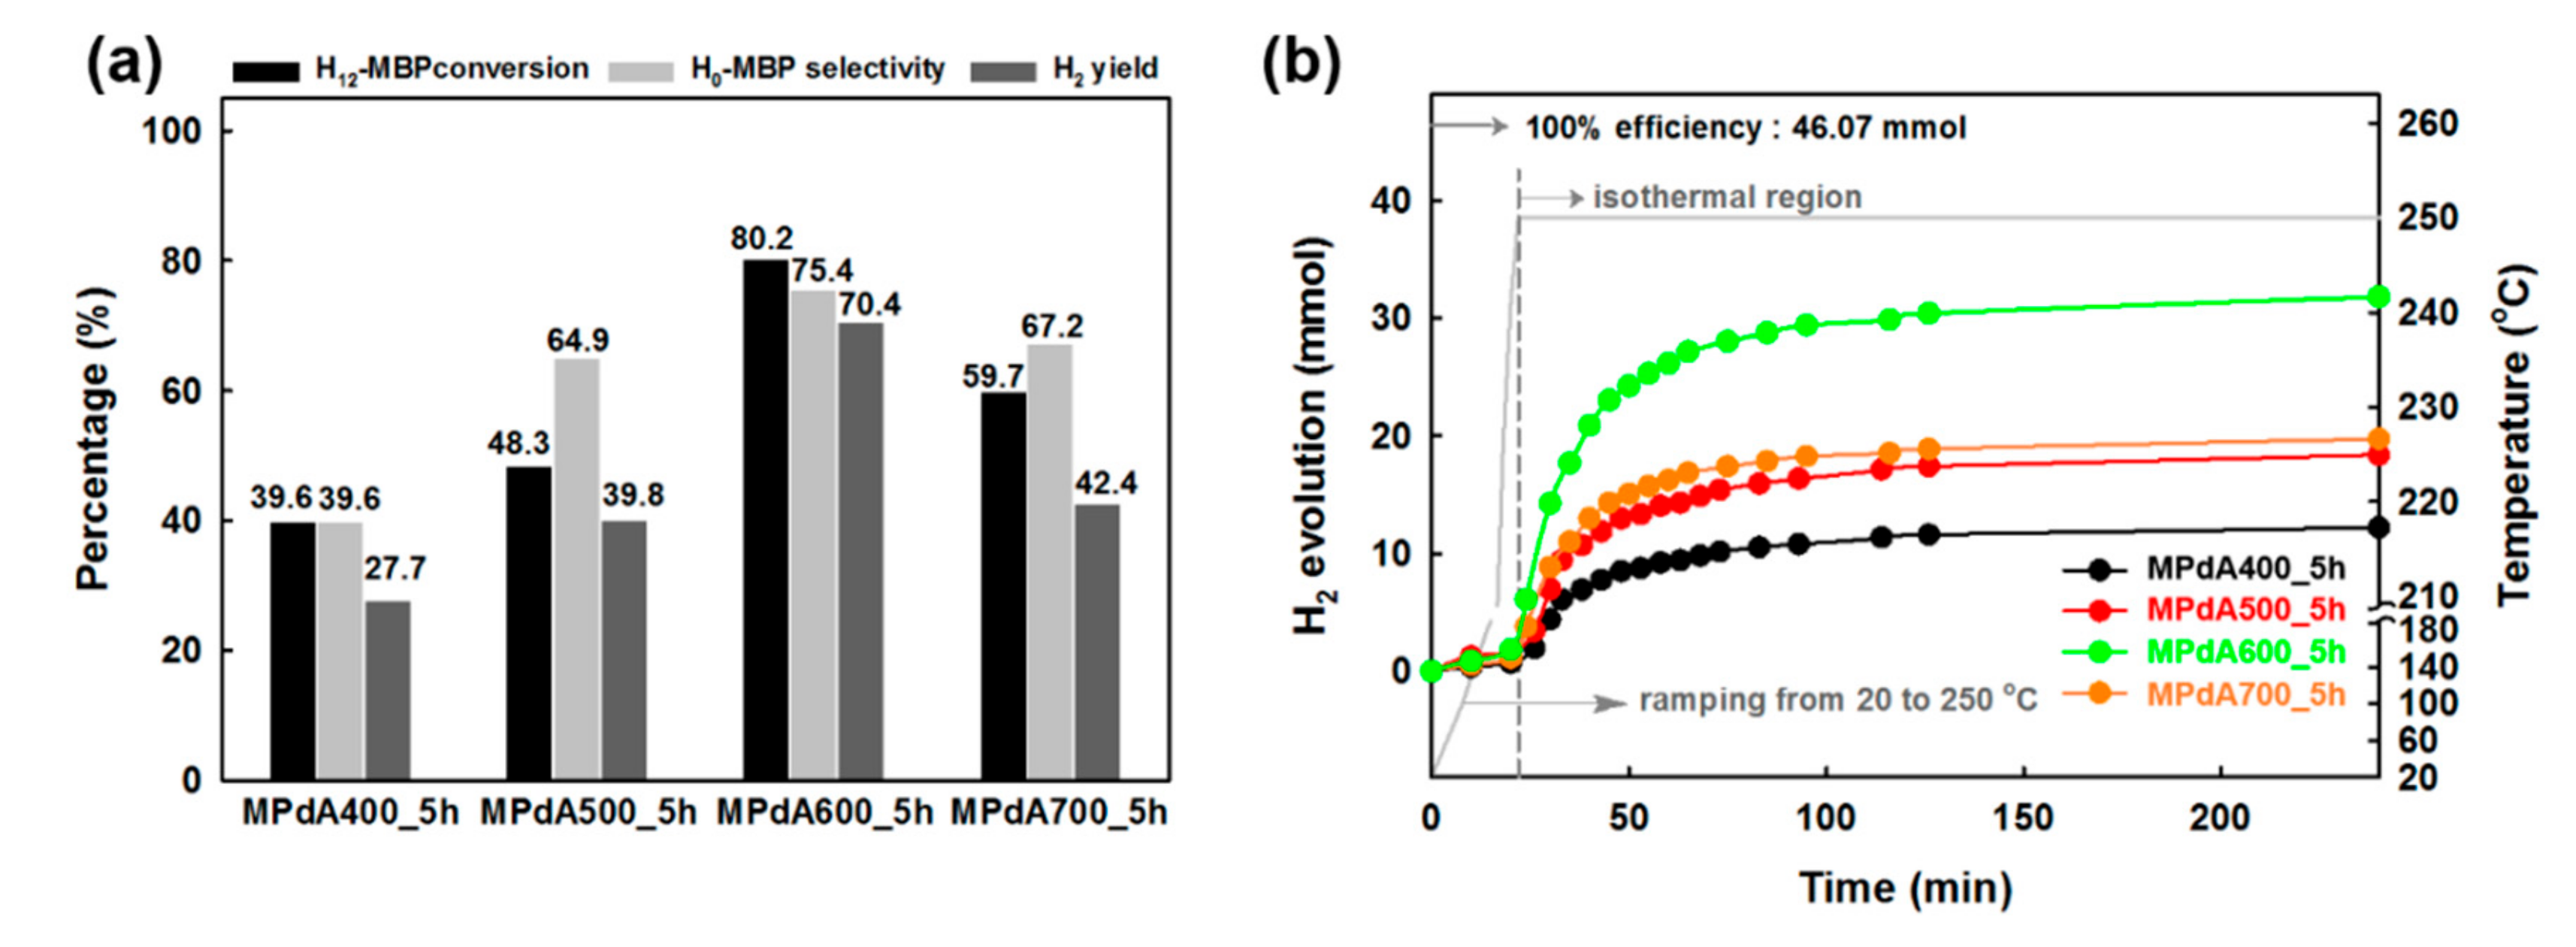
Figure 4a presents the dehydrogenation activity results (obtained by GC analysis) of the MPdA catalysts calcined at different temperatures for 5 h together with their time-dependent H
2 release curves (
Figure 4b) at the standard reaction condition used in our previous work (i.e., M/R ratio of 0.1 mol%, 250 °C, and 4 h) [
9,
12,
13]. The time-dependent hydrogen evolution curves reveal that the highest amount of H
2 was released by MPdA600_5h from among the studied catalytic systems. Moreover, MPdA600_5h exhibited the highest first-order rate constant (0.0308 min
−1 gcat
−1) and the greatest initial turnover frequency (98.9 cm
−1) compared to those of the other calcined catalysts (i.e., MPdA400_5h (0.0067 min
−1 gcat
−1, 28.1 cm
−1), MPdA500_5h (0.0142 min
−1 gcat
−1, 55.0 cm
−1) and MPdA700_5h (0.0156 min
−1 gcat
−1, 56.4 cm
−1)), which again confirmed its superior hydrogen liberation capability. It is worth mentioning that the H
2 evolution occurred quickly in the initial period of time and then reached its maximum value within 100 min of the reaction time period. Afterward, the H
2 release plateaued until the end of the reaction for each catalyst. The activity results obtained through the GC also suggested that the H
12-MBP conversion, H
0-MBP selectivity, and H
2-yield constantly increased with increasing calcination temperature from 400 °C to 600 °C. MPdA600_5h demonstrated the maximum dehydrogenation capability (i.e., 80% H
12-MBP conversion with 75% H
0-MBP selectivity) with uppermost H
2 yield (i.e., 70%). A further rise in temperature to 700 °C (i.e., MPdA700_5h) decreased the H
12-MBP conversion to 60% and H
0-MBP selectivity to 67% and accordingly achieved a low yield of H
2 (i.e., 42%). The present results correlate well with the physicochemical properties of MPdA catalysts calcined at different temperatures acquired by the dissimilar characterization techniques we employed.
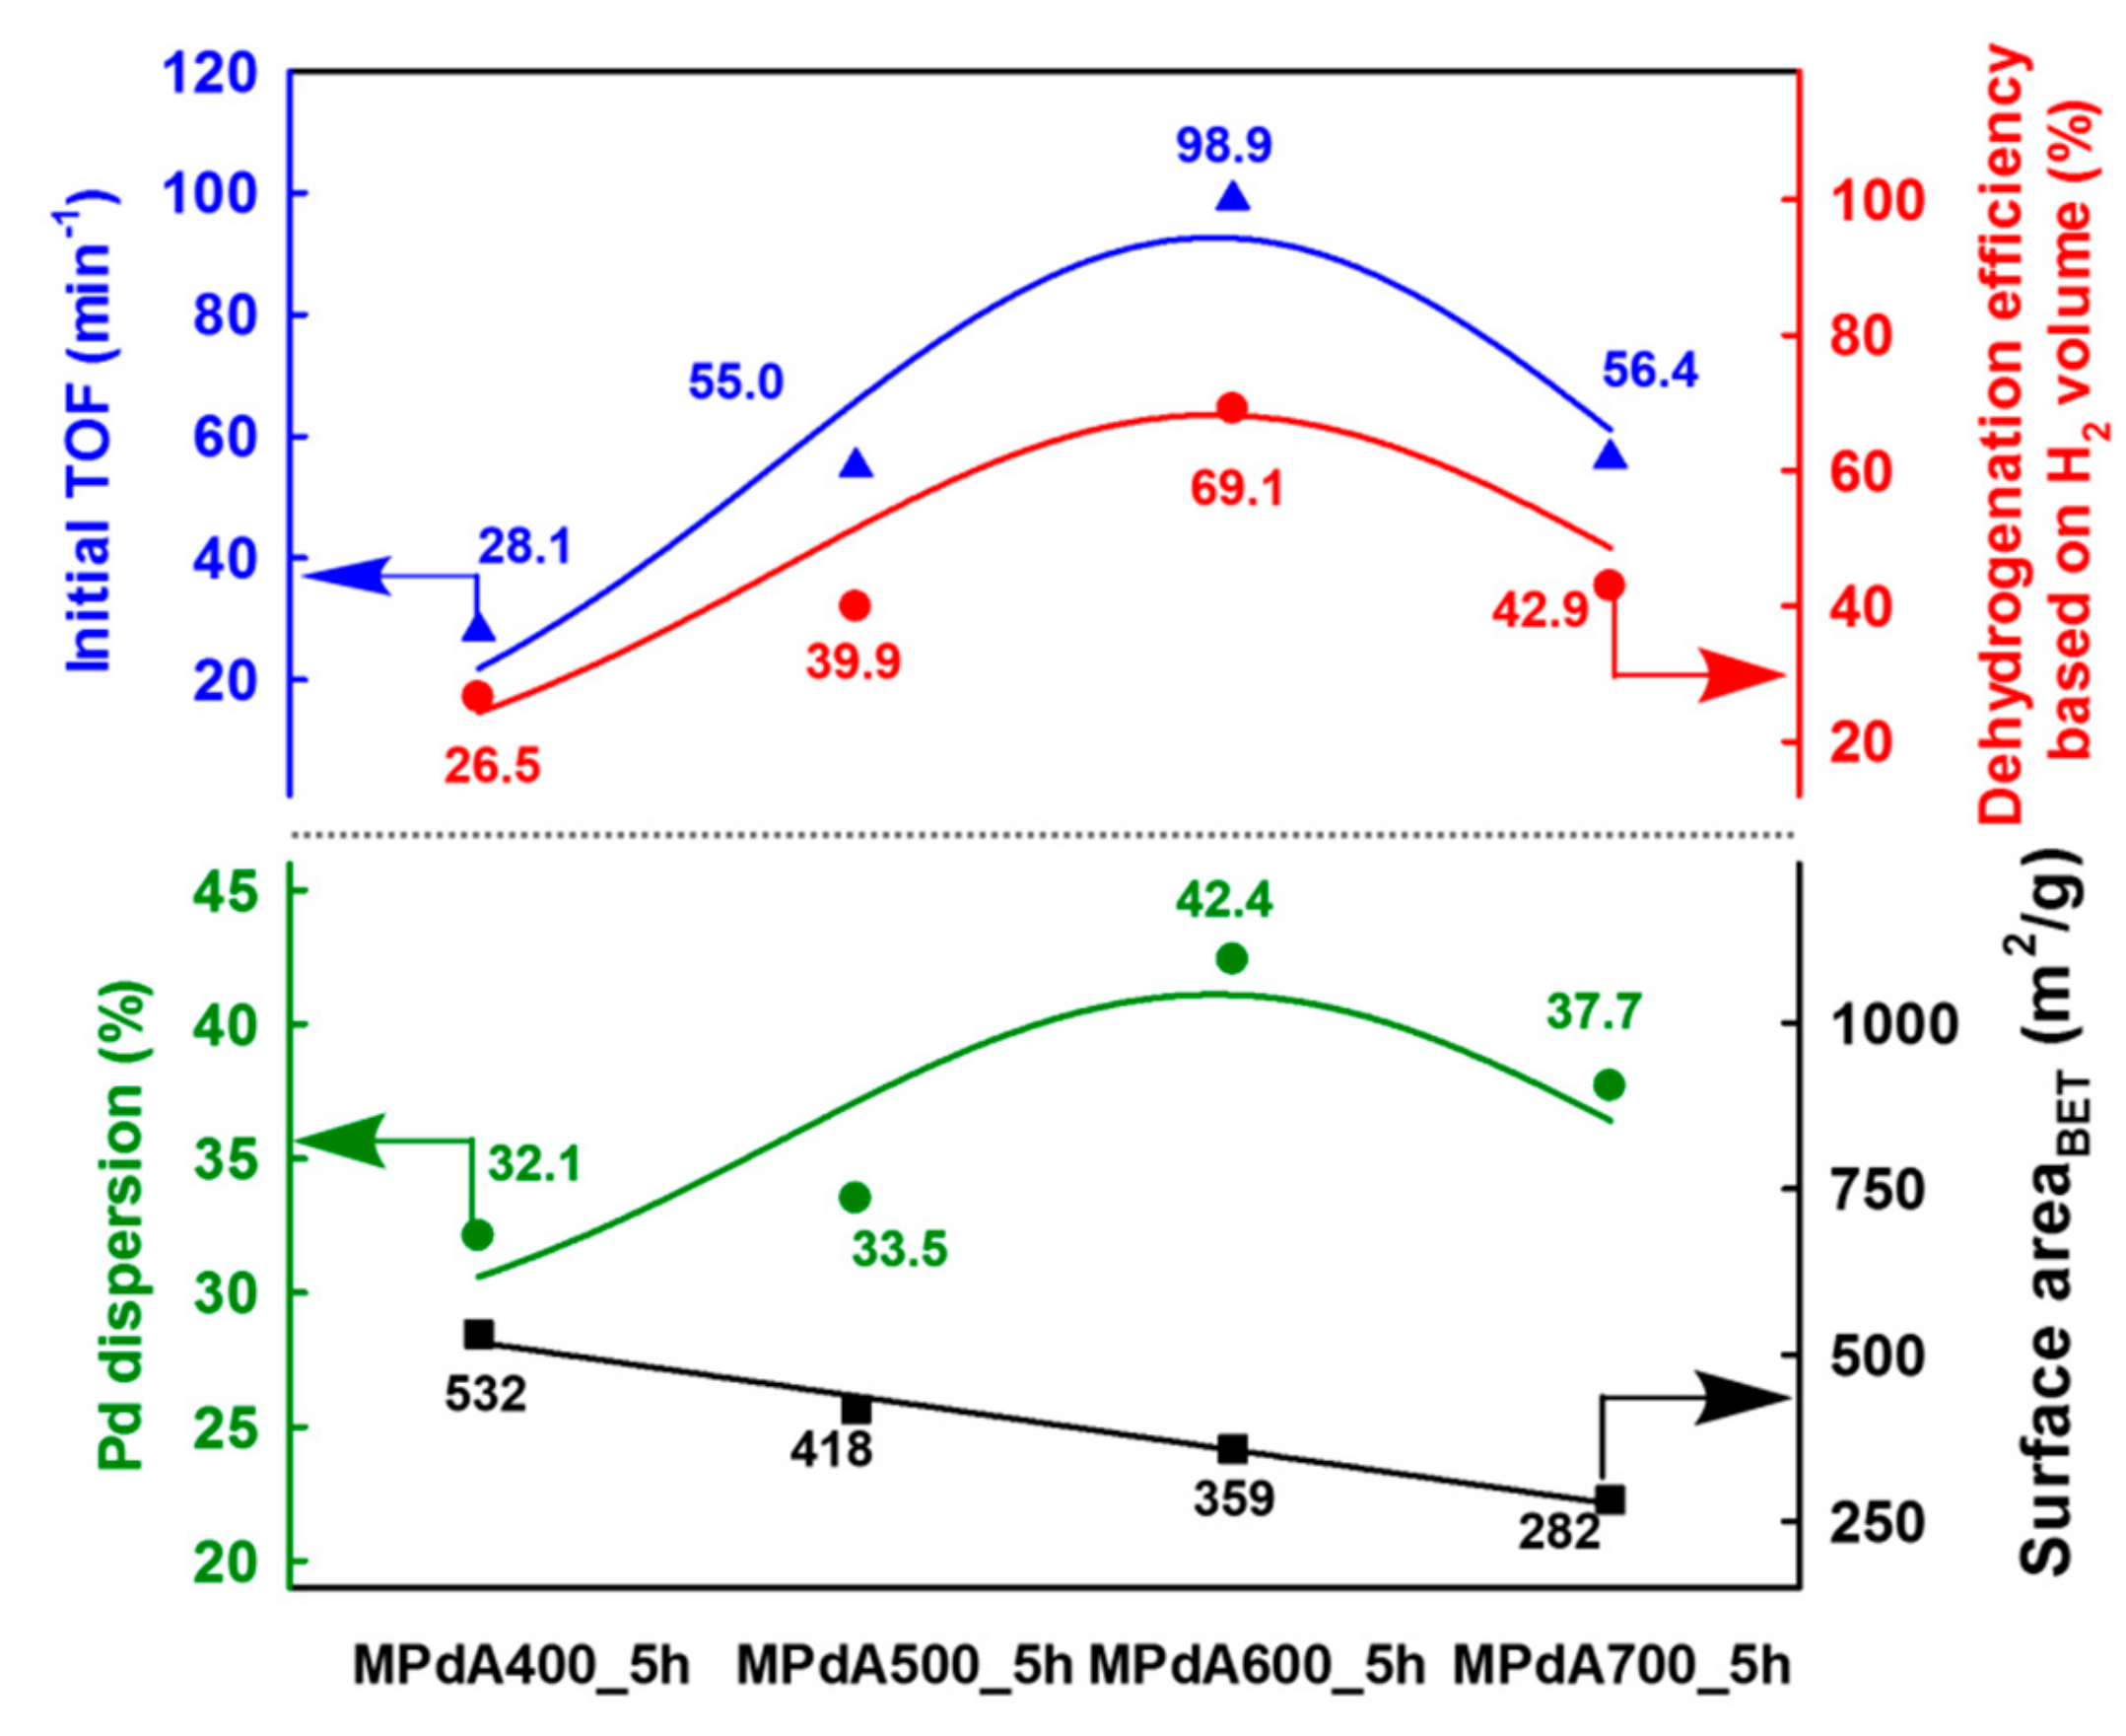
Figure 5 displays the correlations of Pd dispersion and BET surface area with initial turnover frequency (TOF), calculated by H
2 evolution rate at the initial time of the dehydrogenation reaction (i.e., within 10 min) after reaching the reaction temperature, and final dehydrogenation efficiency calculated from the time-dependent H
2 release curves of MPdA catalysts calcined at different temperatures for 5 h. It is clearly evident that the change in calcination temperature significantly affected the Pd dispersion and BET surface area. It is worth mentioning here that the initial TOF and the final dehydrogenation efficiency of differently calcined MPdA catalysts exhibited a volcano-shaped relationship with the Pd dispersion. Hence, the acquired results indicate that the higher dispersion of smaller-size Pd particles in MPdA600_5h is responsible for the superior hydrogen release efficiency compared to the case of the other calcined catalysts.
2.2. Influence of Calcination Time
In the SDP method, when the metal nitrate reacts with ammonium bicarbonate, they form a solvent deficient environment which then yields an intermediate hydroxide product (e.g. metal hydroxide or metal oxide hydroxide) and an ammonium nitrate (NH
4NO
3) byproduct [
27,
28]. During aggregation in the solvent deficient environment, the spectator ions or molecules (NH
4+, NO
3−, and H
2O) act as a spatial buffer or form a sort of template around which the agglomerates form and produce mesoporosity after these ions are removed during calcination. In view of this, a minor modification in the calcination process causes a notable improvement in the physicochemical properties of the catalyst. Therefore, we believe that the reduction in calcination time could affect the catalyst properties, which eventually affects their catalytic activity [
21]. In the following, the calcination time is changed to 1 h, 3 h, and 5 h for the MPdA catalyst at 600 °C, which was found to yield the best results among the different calcination temperatures tested for H
12-MBP dehydrogenation.
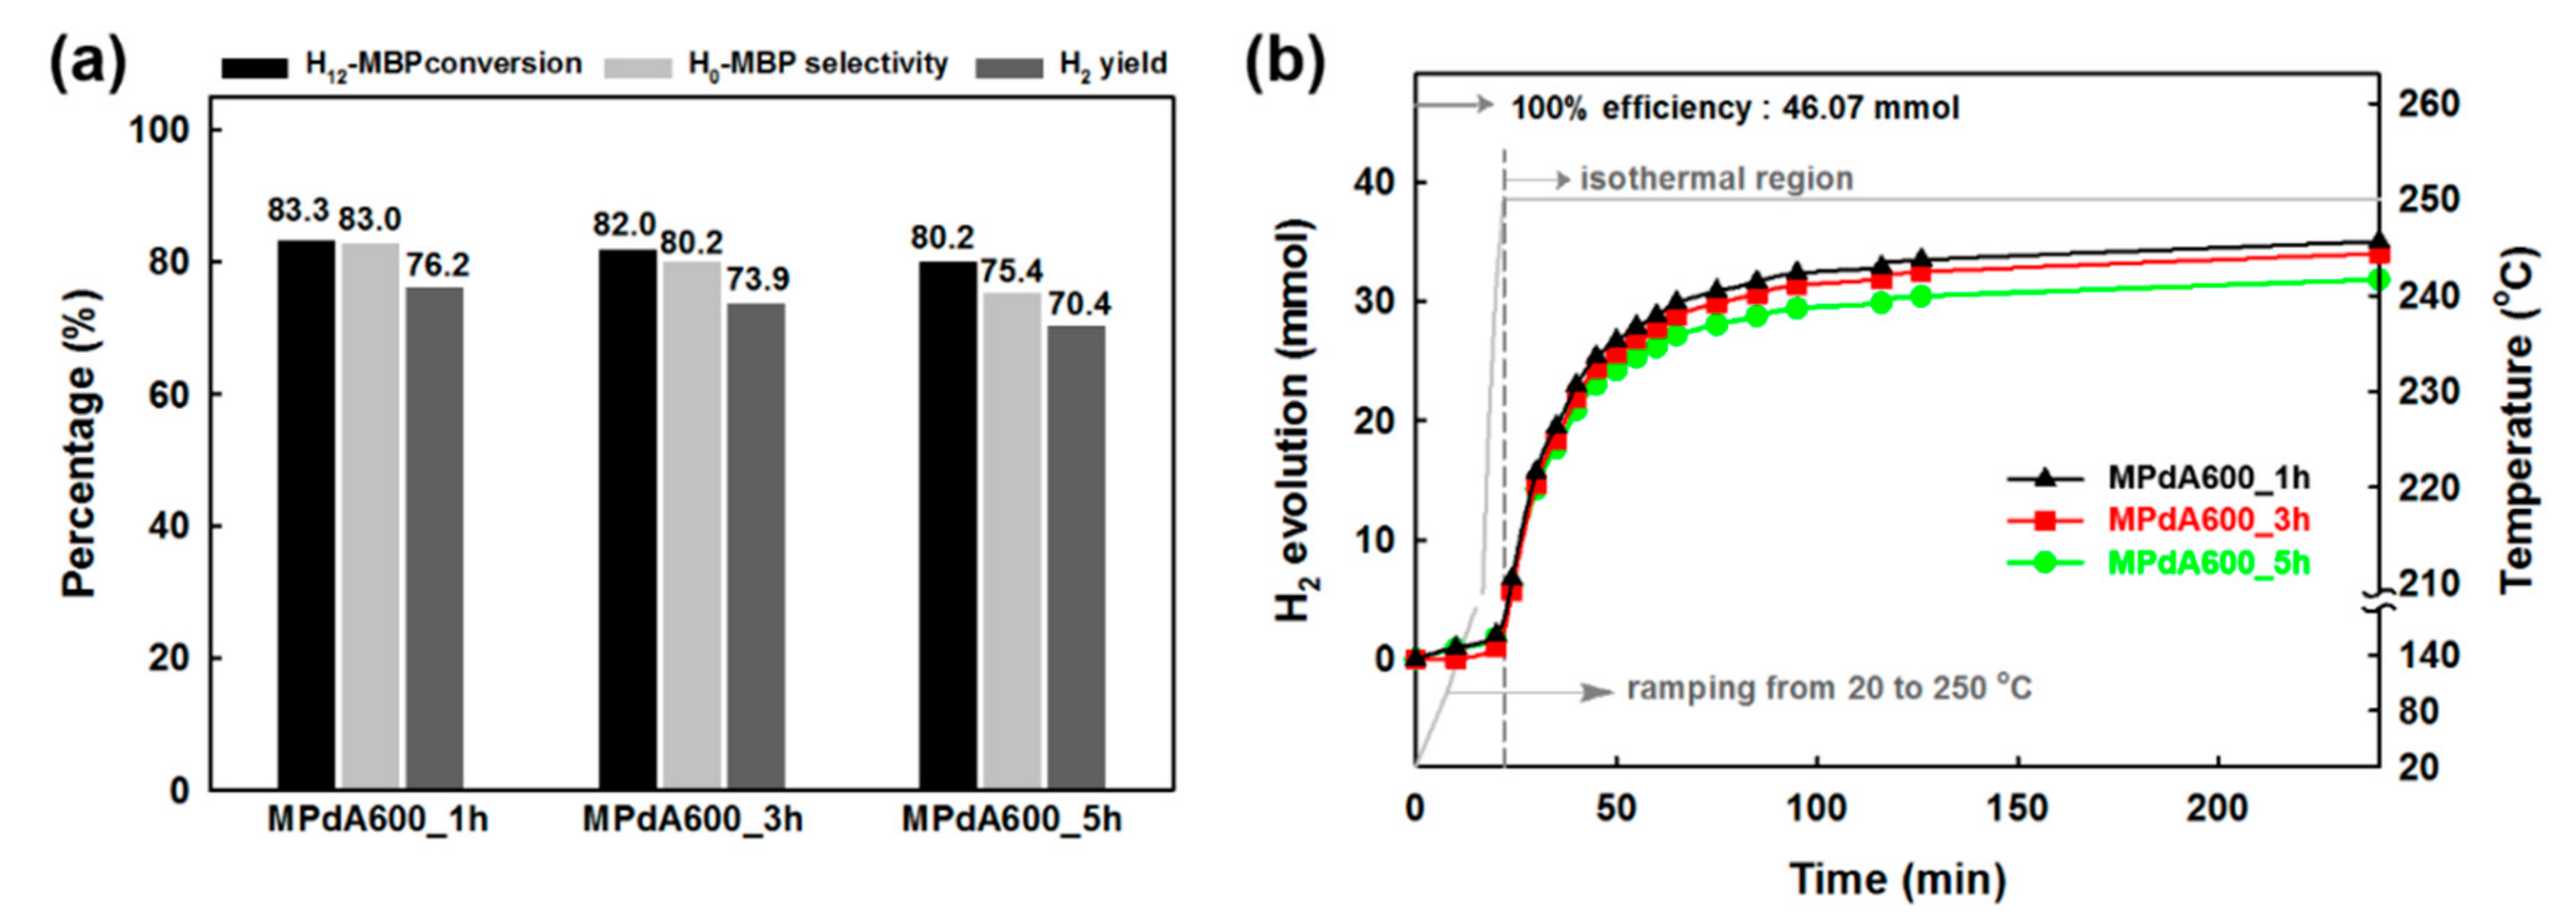
Figure 6a shows the dehydrogenation activity results (obtained by GC analyses) of the MPdA catalysts calcined at 600 °C for different calcination durations along with the corresponding time-dependent H
2 release curves (
Figure 6b). It is inferred from the time-dependent hydrogen evolution curves that the calcination time does not cause any noteworthy change in the H
2 liberation rate initially, but does cause a notable change at the end of the reaction, following the order: MPdA600_1h > MPdA600_3h > MPdA600_5h. These results were further confirmed by the first-order rate constants and TOFs calculated at the initial time and by the dehydrogenation activity results attained through the GC at the end of the reaction. From these results, the first-order rate constants and TOFs calculated at the initial time using the time-dependent hydrogen release curves indicated negligible changes in the following order: MPdA600_1h (0.0310 min
−1 gcat
−1, 101.6 cm
−1) ≈ MPdA600_3h (0.0309 min
−1 gcat
−1, 101.4 cm
−1) ≈ MPdA600_5h (0.0308 min
−1 gcat
−1, 98.9 cm
−1). However, the dehydrogenation activity results obtained through the GC at the end of the reaction indicated a small variation in the H
12-MBP conversion (i.e., approximately 3%), but displayed a substantial improvement in H
0-MBP selectivity and H
2 yield with decreasing calcination time in the ensuing order: MPdA600_5h (H
0-MBP selectivity: 75% and H
2 yield: 70%) < MPdA600_3h (H
0-MBP selectivity: 80% and H
2 yield: 74%) < MPdA600_1h (H
0-MBP selectivity: 83% and H
2 yield: 76%). Thus, it is again confirmed that the change in calcination time has some influence on the dehydrogenation activity. In order to understand the disparities in the catalytic activity, all catalysts were further characterized using different characterization techniques.
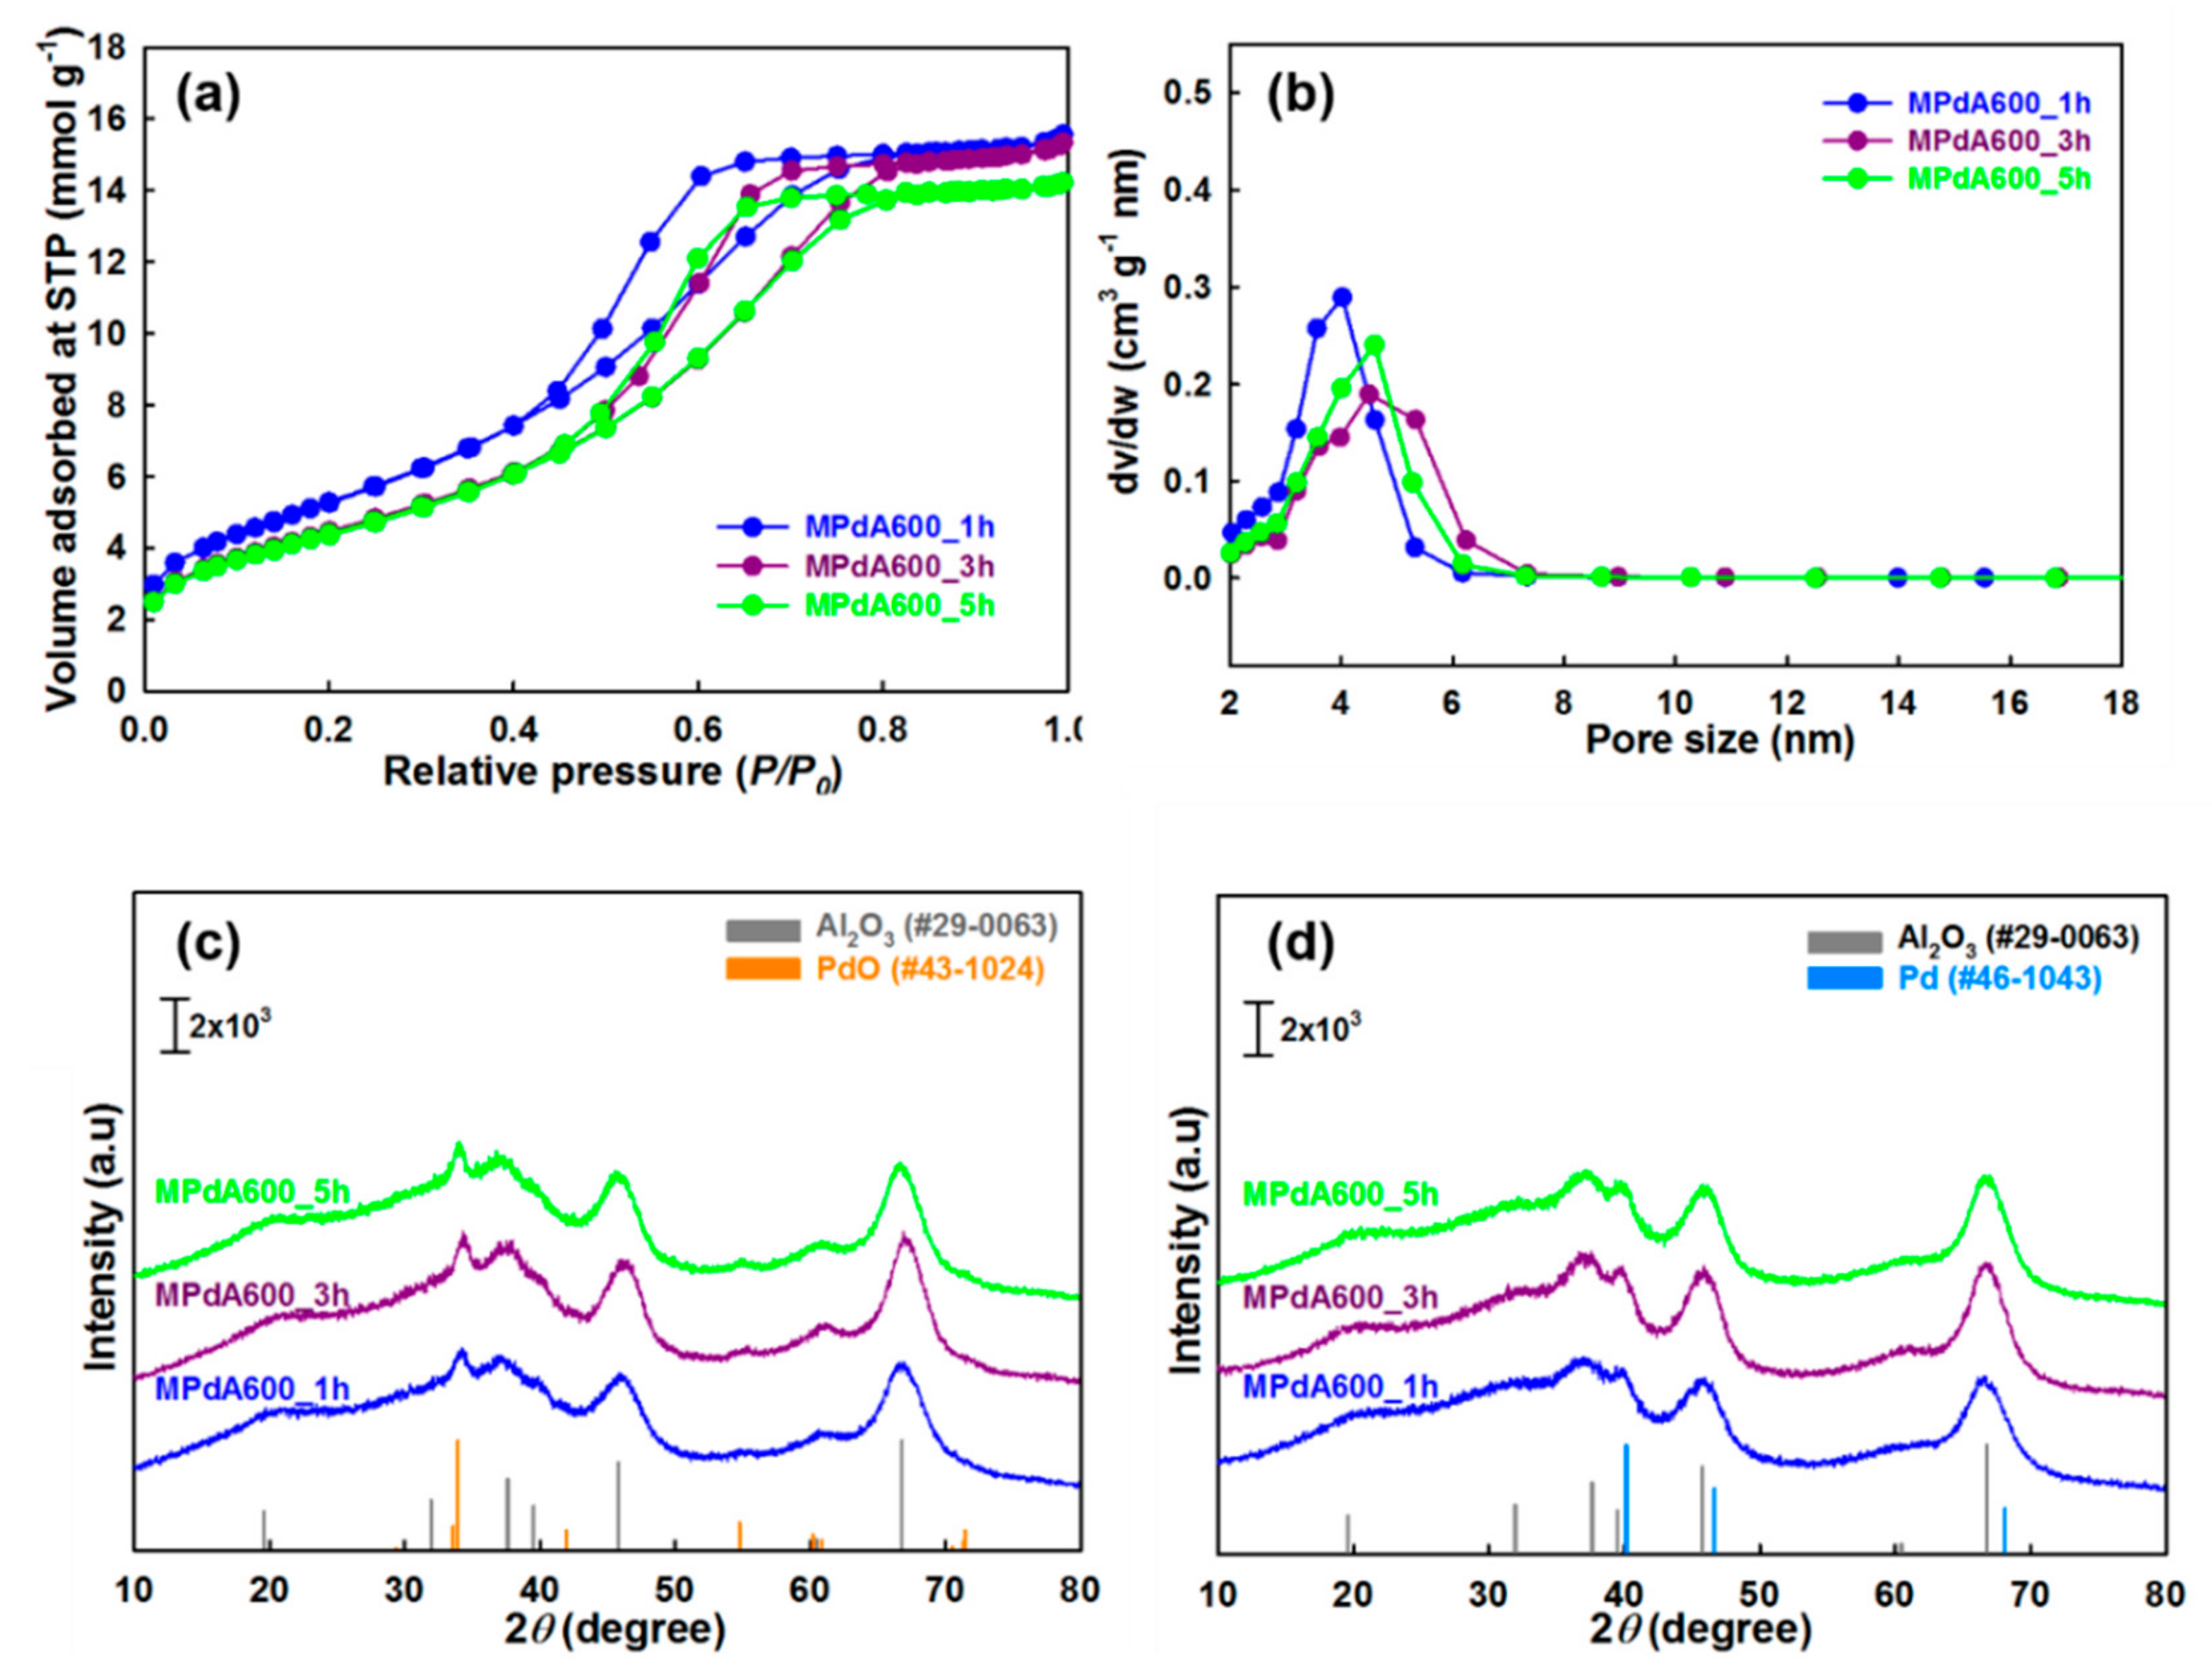
The N
2 physisorption isotherms and pore size distributions of MPdA catalysts calcined at 600 °C for different time intervals are presented in
Figure 7a,b, respectively, and the obtained values are summarized in
Table 2. All these catalysts show the similar isotherms and hysteresis loops, alike the differently calcined catalysts. Among these catalysts, MPdA600_1h had the highest BET surface area (433 m
2 g
−1) and pore volume (0.53 cm
3 g
−1), and lowest pore size (3.7 nm). An increase in calcination time to 3 h (MPdA600_3h) substantially decreased the BET surface area (364 m
2 g
−1) and pore volume (0.52 cm
3 g
−1), and increased the pore size (4.3 nm). A further increase in calcination time to 5 h (MPdA600_5h) resulted in an insignificant difference in the BET surface area (359 m
2 g
−1), pore volume (0.49 cm
3 g
−1), and pore size (4.1 nm). The hysteresis loops of the MPdA catalysts shifted to higher relative pressures with increasing calcination time, indicating an increase in pore size that can be attributed to dehydroxylation and sintering of alumina particles [
25,
33]. Therefore, the obtained results indicate that the dehydroxylation and sintering of alumina particles were enormous from 1 h to 3 h, and then nearly stabilized for the 3 h and 5 h calcination times. This explains the significant loss in the BET surface area for MPdA600_3h compared to that for MPdA600_1h and an insignificant difference in BET surface area between MPdA600_5h and MPdA600_3h. The present findings are further confirmed by the following XRD measurements.
Figure 7c shows the XRD patterns of the MPdA catalysts calcined at 600 °C for different durations. All MPdA catalysts exhibited diffractions of the support γ-Al
2O
3 and the PdO, regardless of the calcination time. The intensity of the diffractions of the support γ-Al
2O
3 noticeably improved with an extension of calcination time from 1 h (MPdA600_1h) to 3 h (MPdA600_3h), verifying the enlargement of alumina particles. Further increase in calcination time to 5 h (MPdA600_5h) revealed negligible evolution in the growth of alumina particles, clearly witnessed from their crystallite sizes i.e., MPdA600_1h (9.7 nm) < MPdA600_3h (10.5 nm) > MPdA600_5h (10.8 nm). These results are in good agreement with the textural properties of MPdA catalysts for different intervals of calcination time, where a drop in BET surface area and pore volume, and an increase in pore size occur as calcination time increases (i.e., major differences in MPdA600_3h compared to MPdA600_1h, and negligible differences between MPdA600_5h and MPdA600_3h). Additionally, delay in the calcination time does not affect the intensities of the PdO diffraction peaks, which validates that all catalysts may have similar-size PdO nanoparticles. Furthermore, the reduced MPdA catalysts revealed the occurrence of metallic Pd nanoparticles, whose diffraction peaks overlap those of γ-Al
2O
3 (
Figure 7d). Therefore, CO chemisorption was employed to determine the Pd particle size along with the Pd dispersion and metal surface area of these catalysts.
The measured CO chemisorption values of the MPdA catalysts calcined at 600 °C with different calcination times after reduction at 350 °C are presented in
Table 2. All MPdA catalysts yielded similar Pd dispersions (41–42%) and metal surface areas (185–190 m
2 g
−1), as well as similar particle sizes (2.6–2.7 nm). However, the minor differences observed in the CO chemisorption values of MPdA600_1h and MPdA600_3h compared to that of MPdA600_5h can be ascribed to the lower crystallinity of γ-Al
2O
3 achieved by less calcination time, as stated above. The present results suggest that a minor change in the synthesis procedure can regulate final properties of the MPdA catalyst, which verifies the sensitivity and effectiveness of the SDP method. Even a small amendment in the synthesis procedure can cause a considerable variation in catalytic activity (
Figure 6).
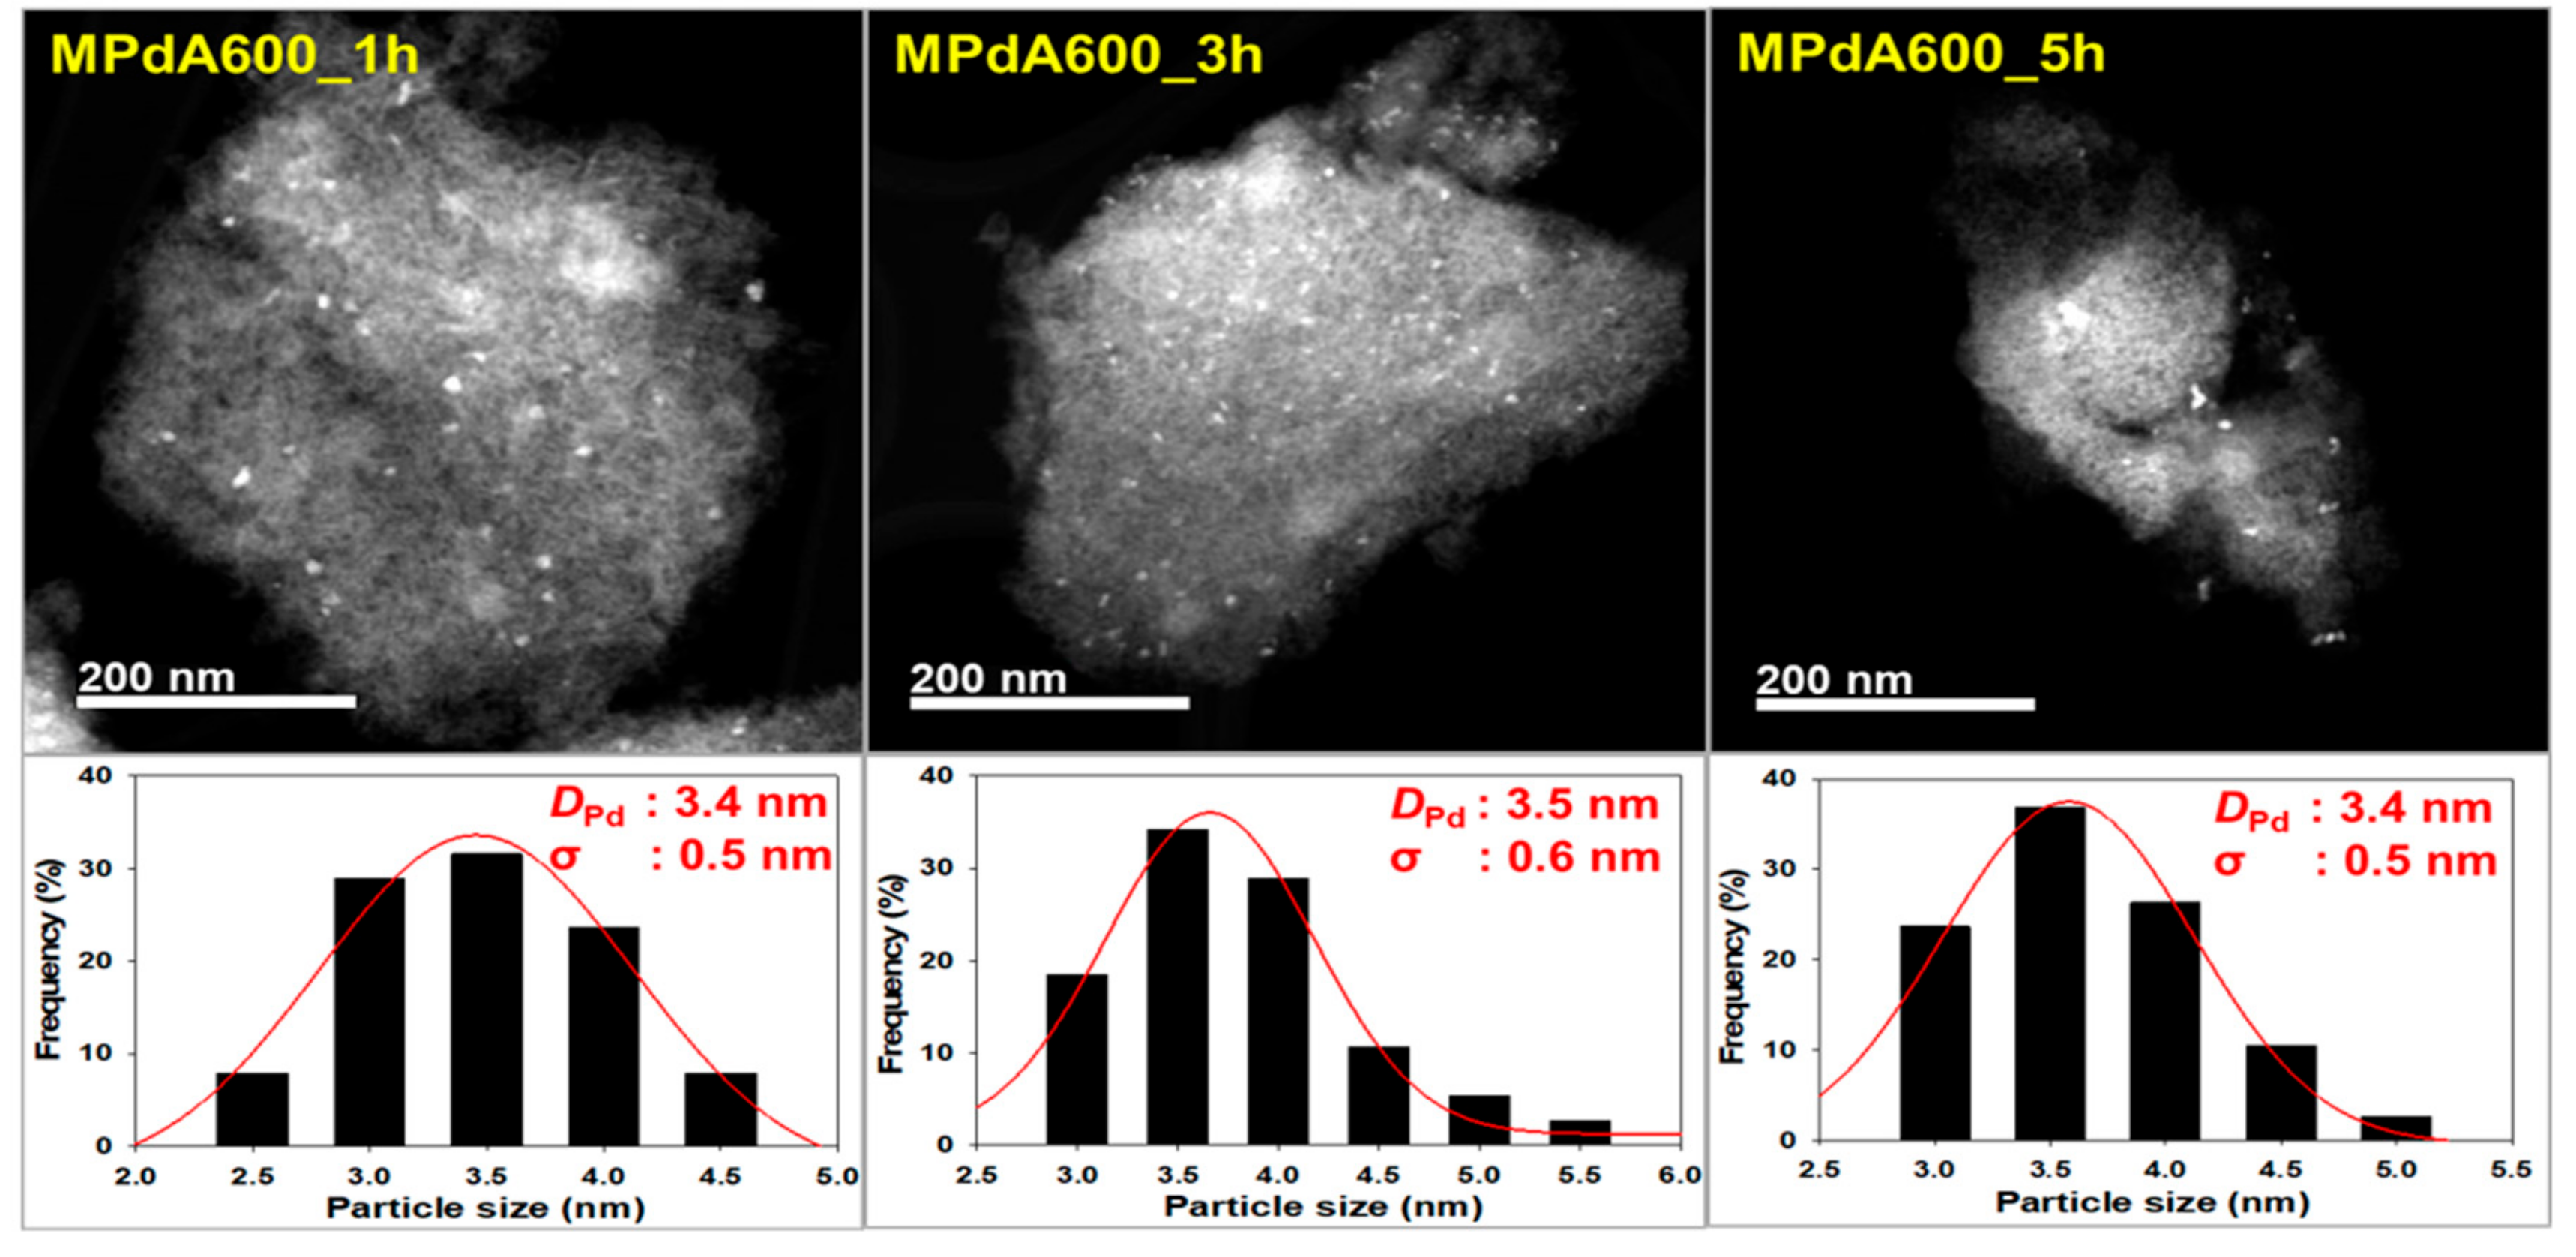
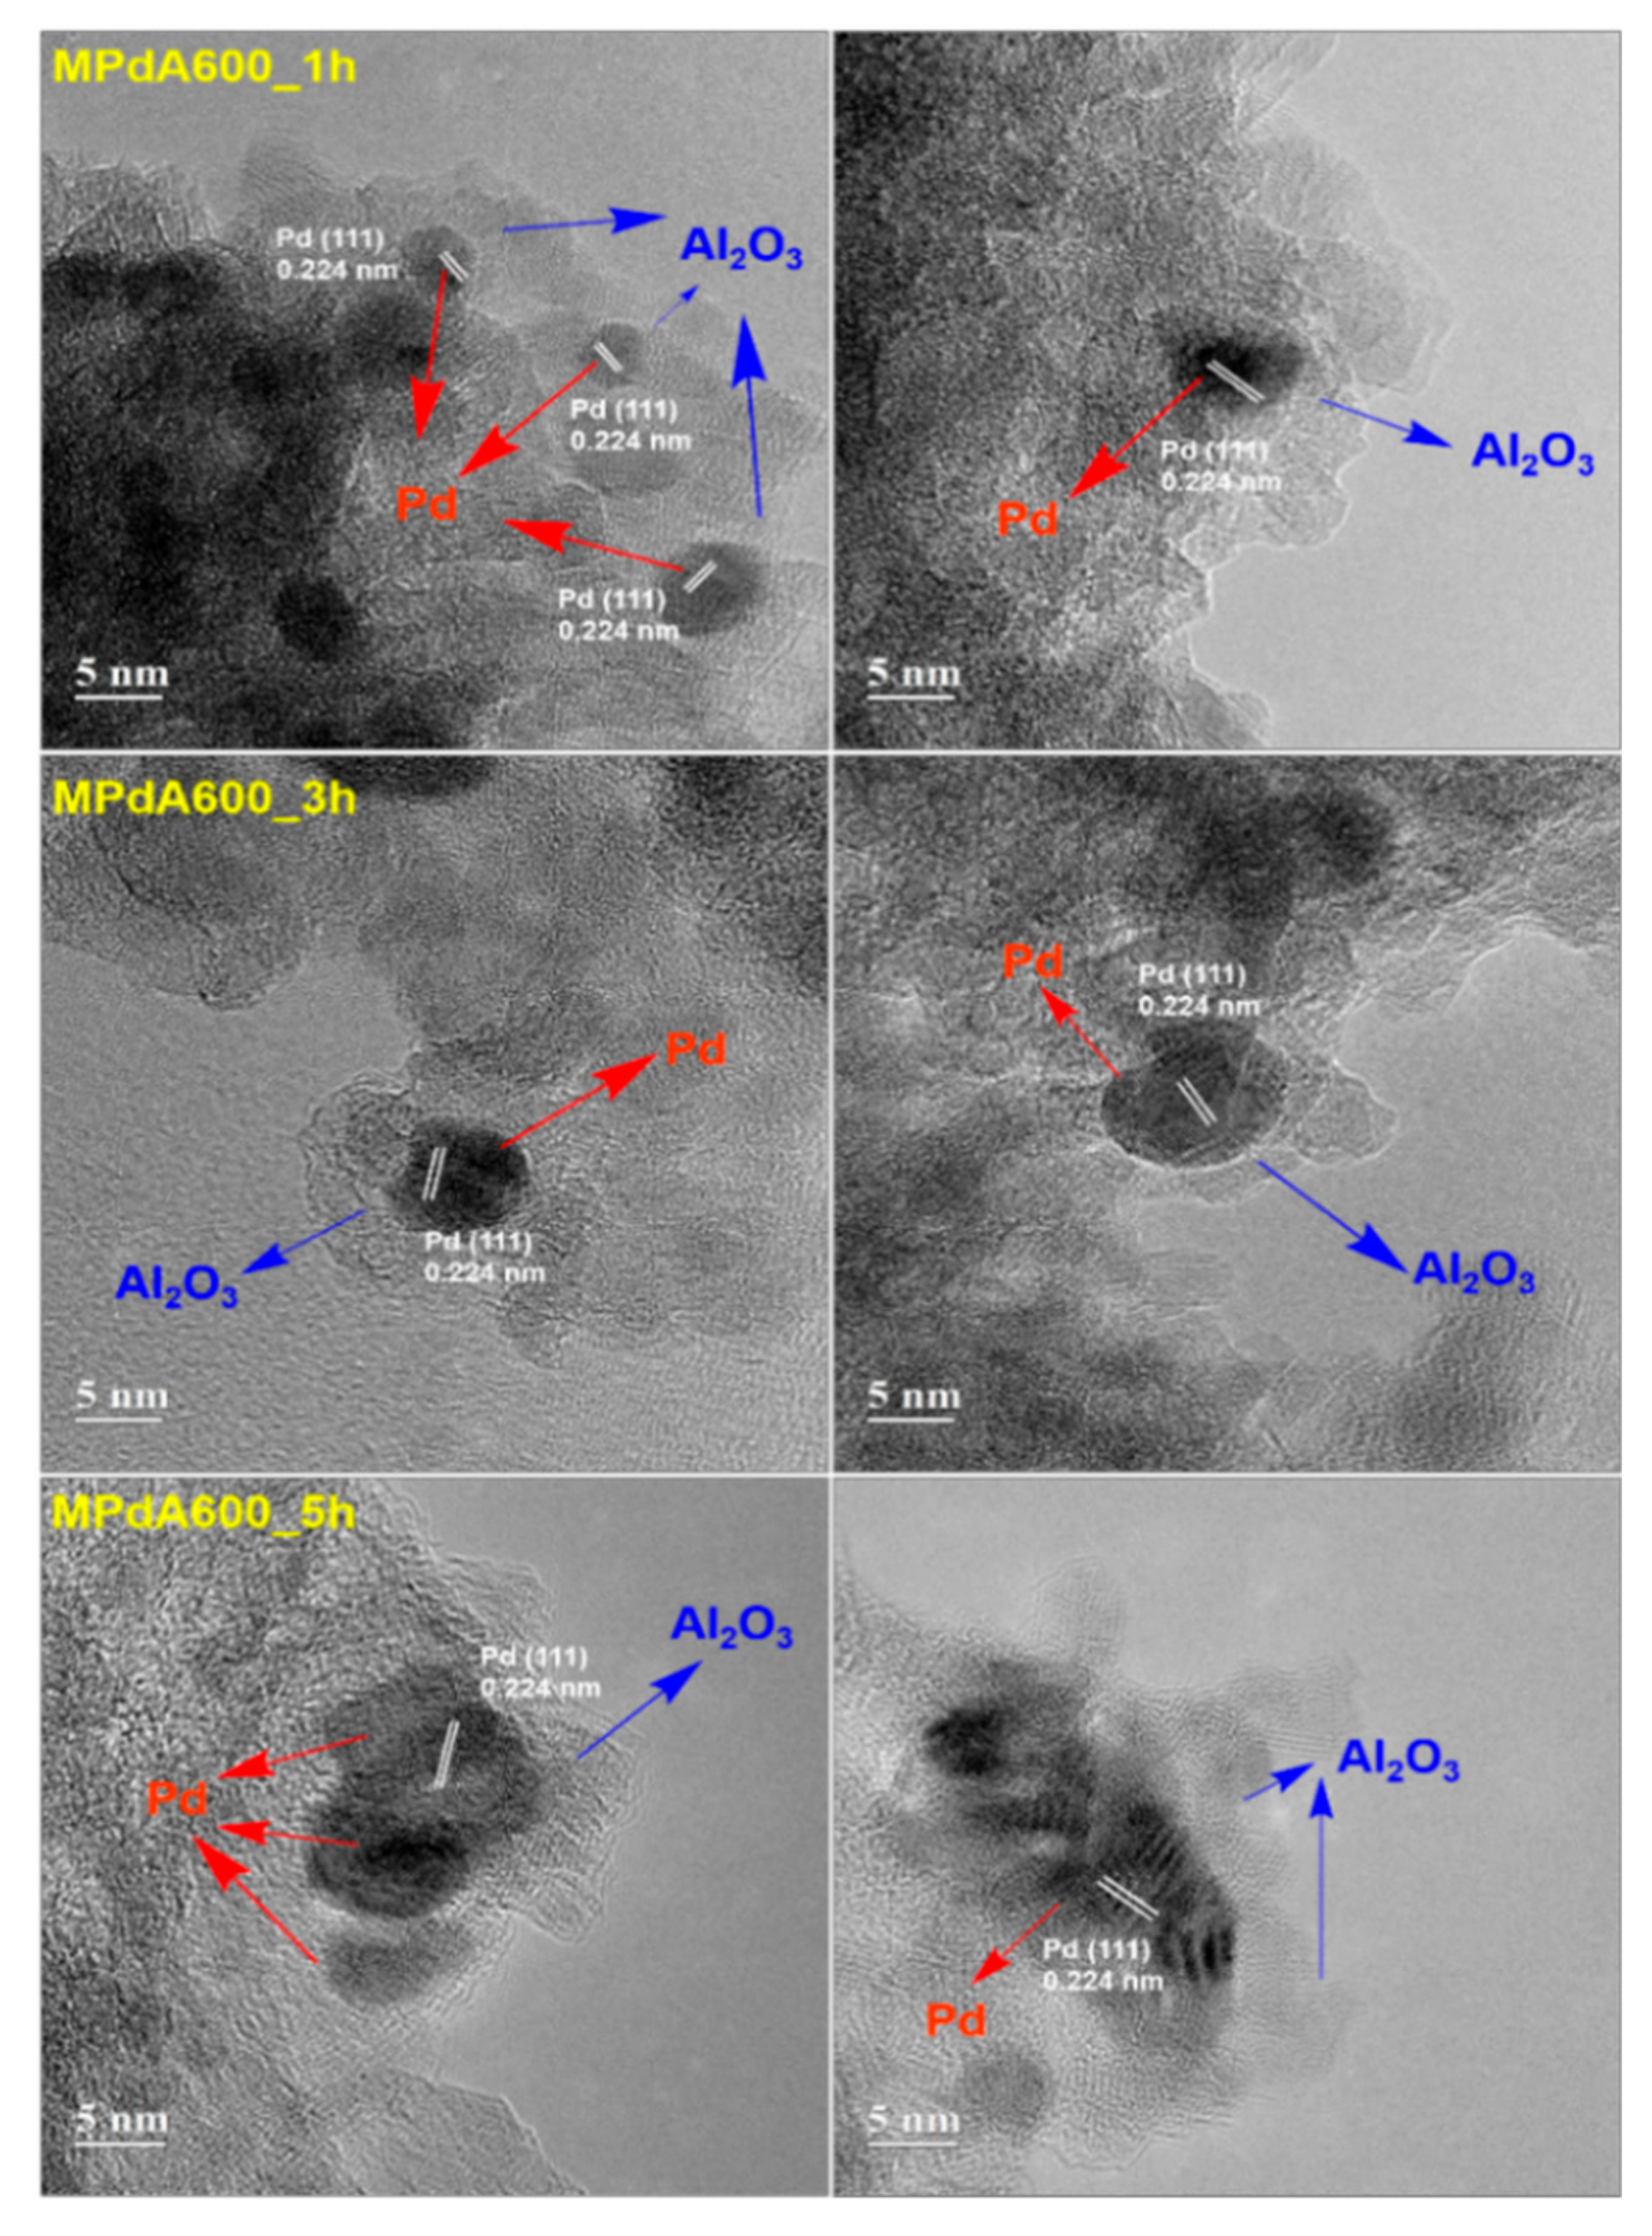
Figure 8 shows HAADF-STEM images and particle size distributions of the MPdA catalysts calcined at 600 °C for different calcination times after reduction at 350 °C. The average Pd particle sizes are presented in
Table 2. In all catalysts Pd and Al
2O
3 particles appeared to be stacked fairly tightly with the similar irregular Pd distributions, as stated before. In particle size distribution diagrams, all catalysts produced smaller-size Pd particles with a negligible difference; i.e., MPdA600_1h (
DPd: 3.4 nm, σ: 0.5 nm), MPdA600_3h (
DPd: 3.5 nm, σ: 0.6 nm), and MPdA600_5h (
DPd: 3.4 nm, σ: 0.5 nm). These are in good agreement with the findings of XRD and CO chemisorption.
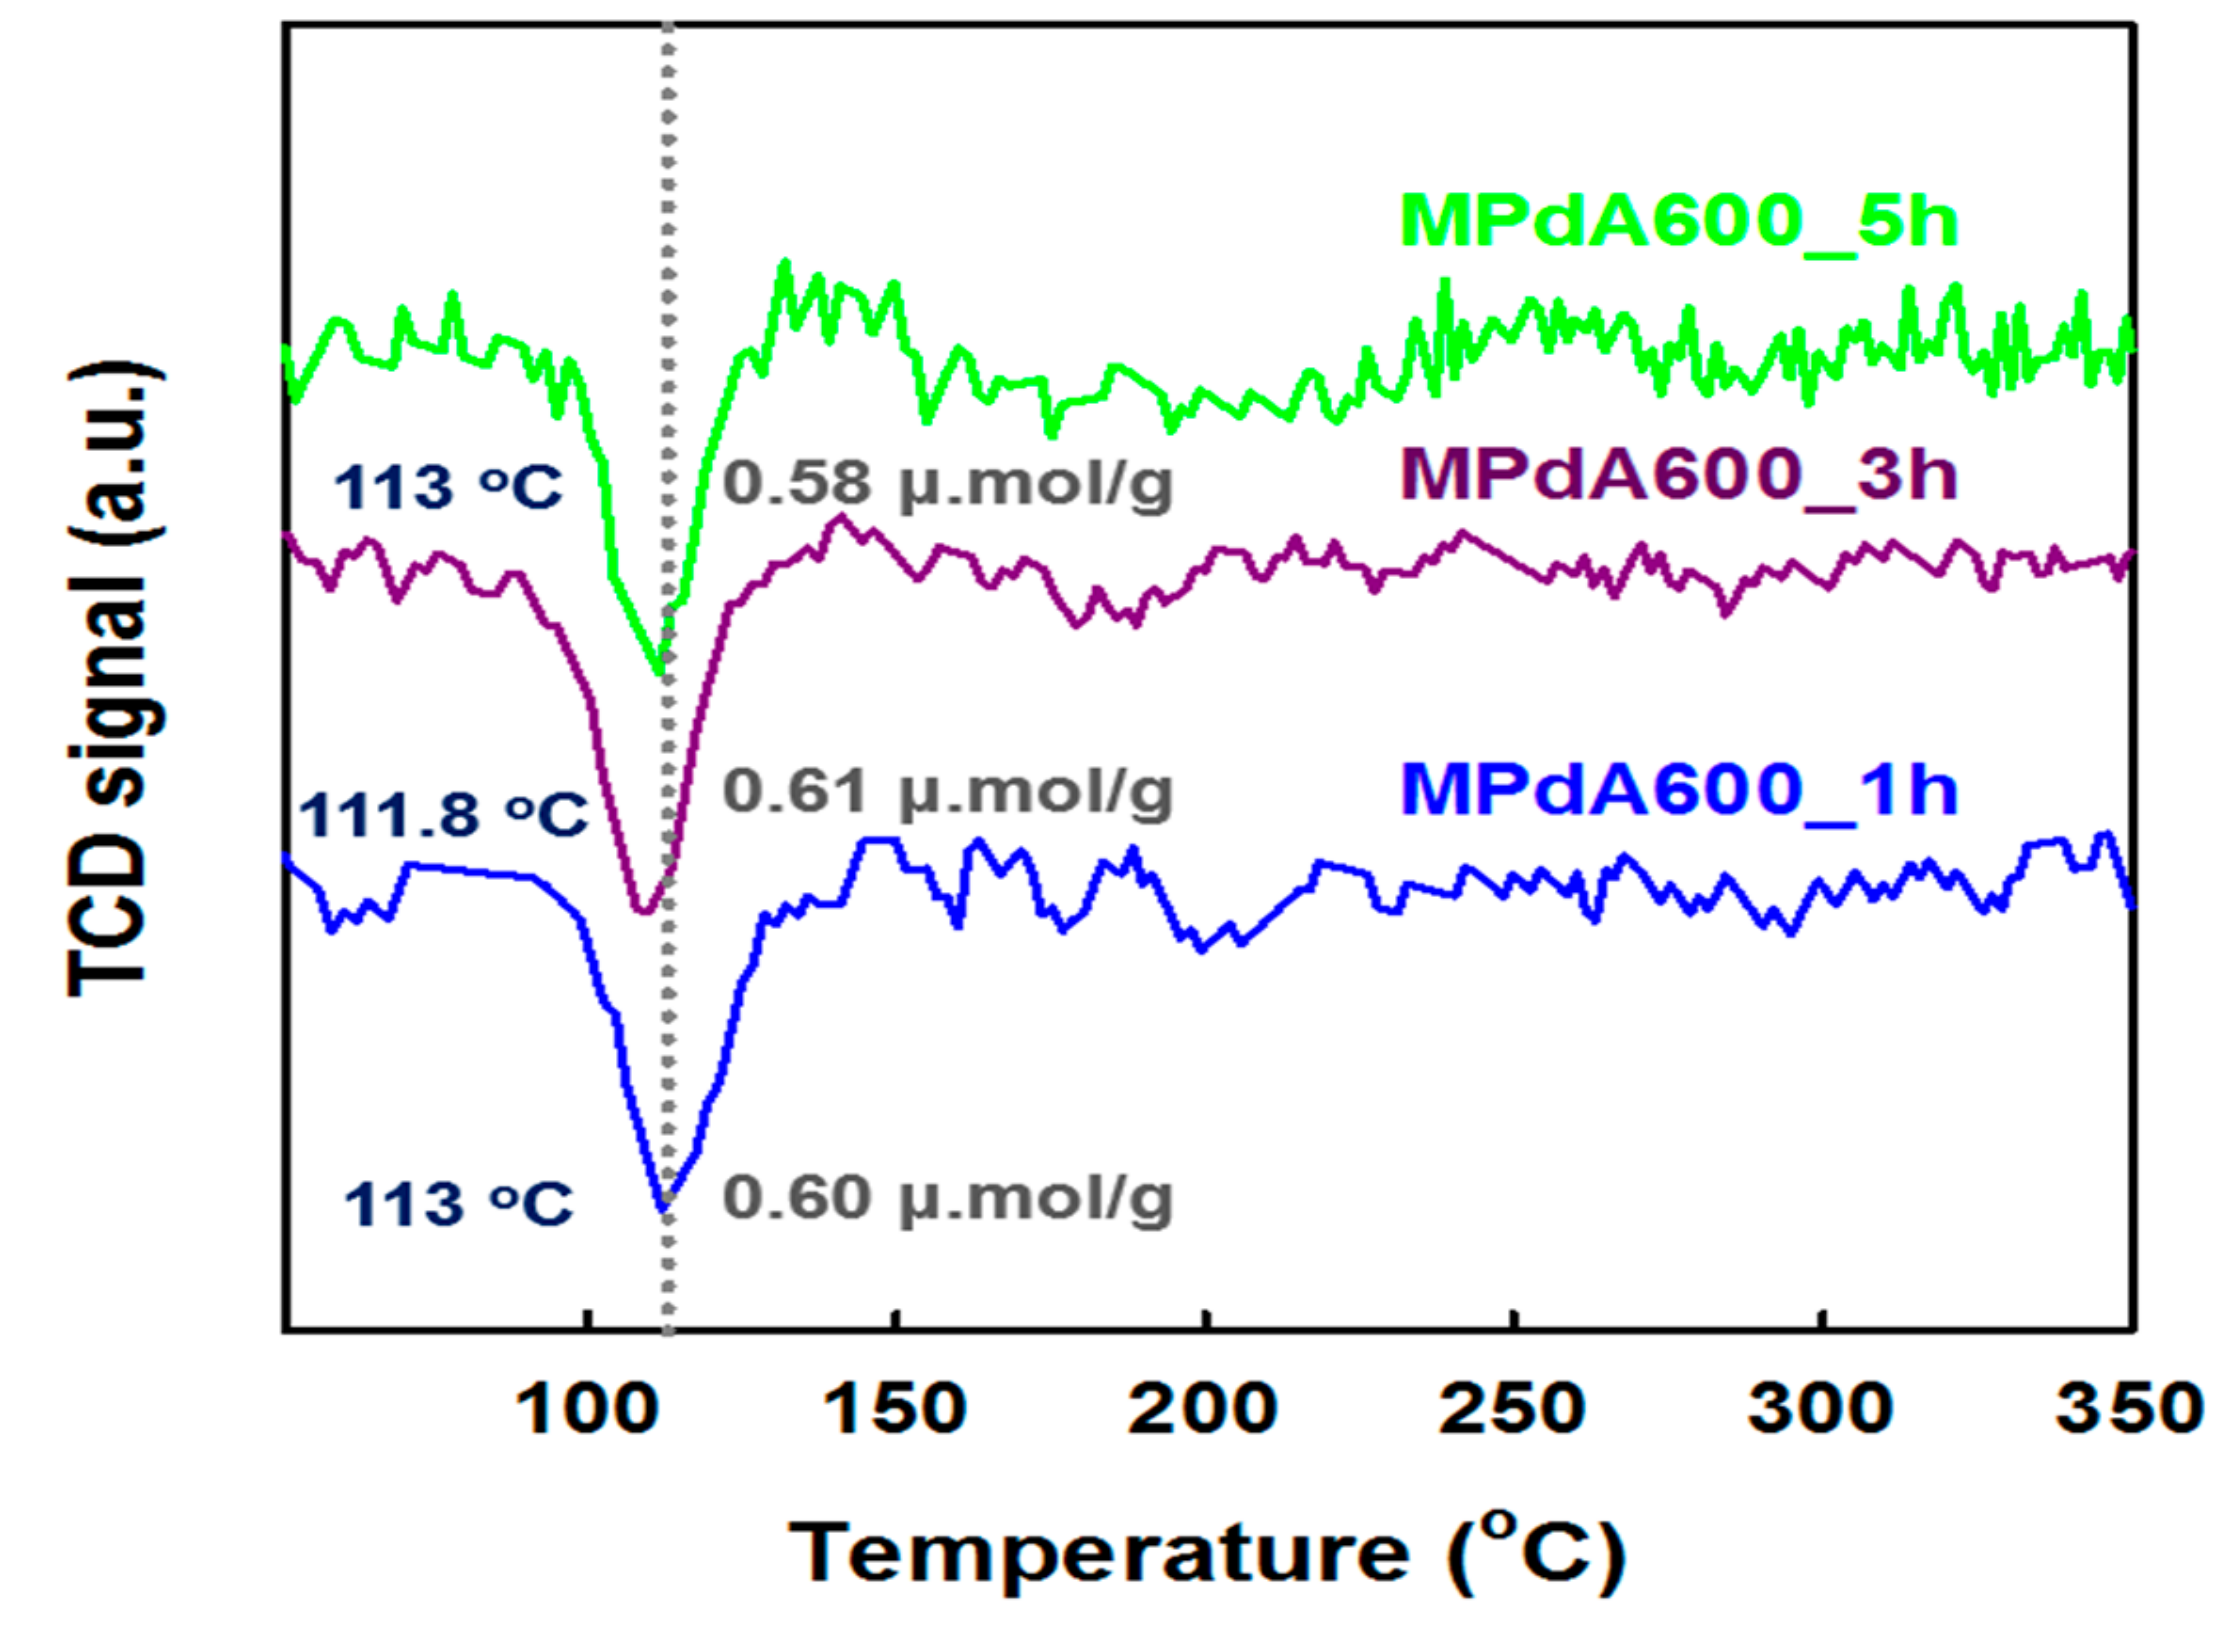
H
2-TPR profiles of the MPdA catalysts calcined at 600 °C with variations in calcination time are displayed in
Figure 9, and their H
2 consumption values are listed in
Table 2. All MPdA catalysts exhibited a negative H
2 consumption peak at
Tmax of 112–113 °C, which could be attributed to the decomposition of Pd hydrate species formed at ambient temperature. In addition, all catalysts exhibited an unimportant change in the negative peak intensity, and achieved similar hydrogen consumption values of 0.58–0.61 μmol g
−1. These results again confirmed that a modification in the calcination time does not affect the Pd particle size greatly, which is supported by CO chemisorption results and HAADF-STEM images. These MPdA catalysts exhibited similar characterization results except for the N
2 physisorption results.
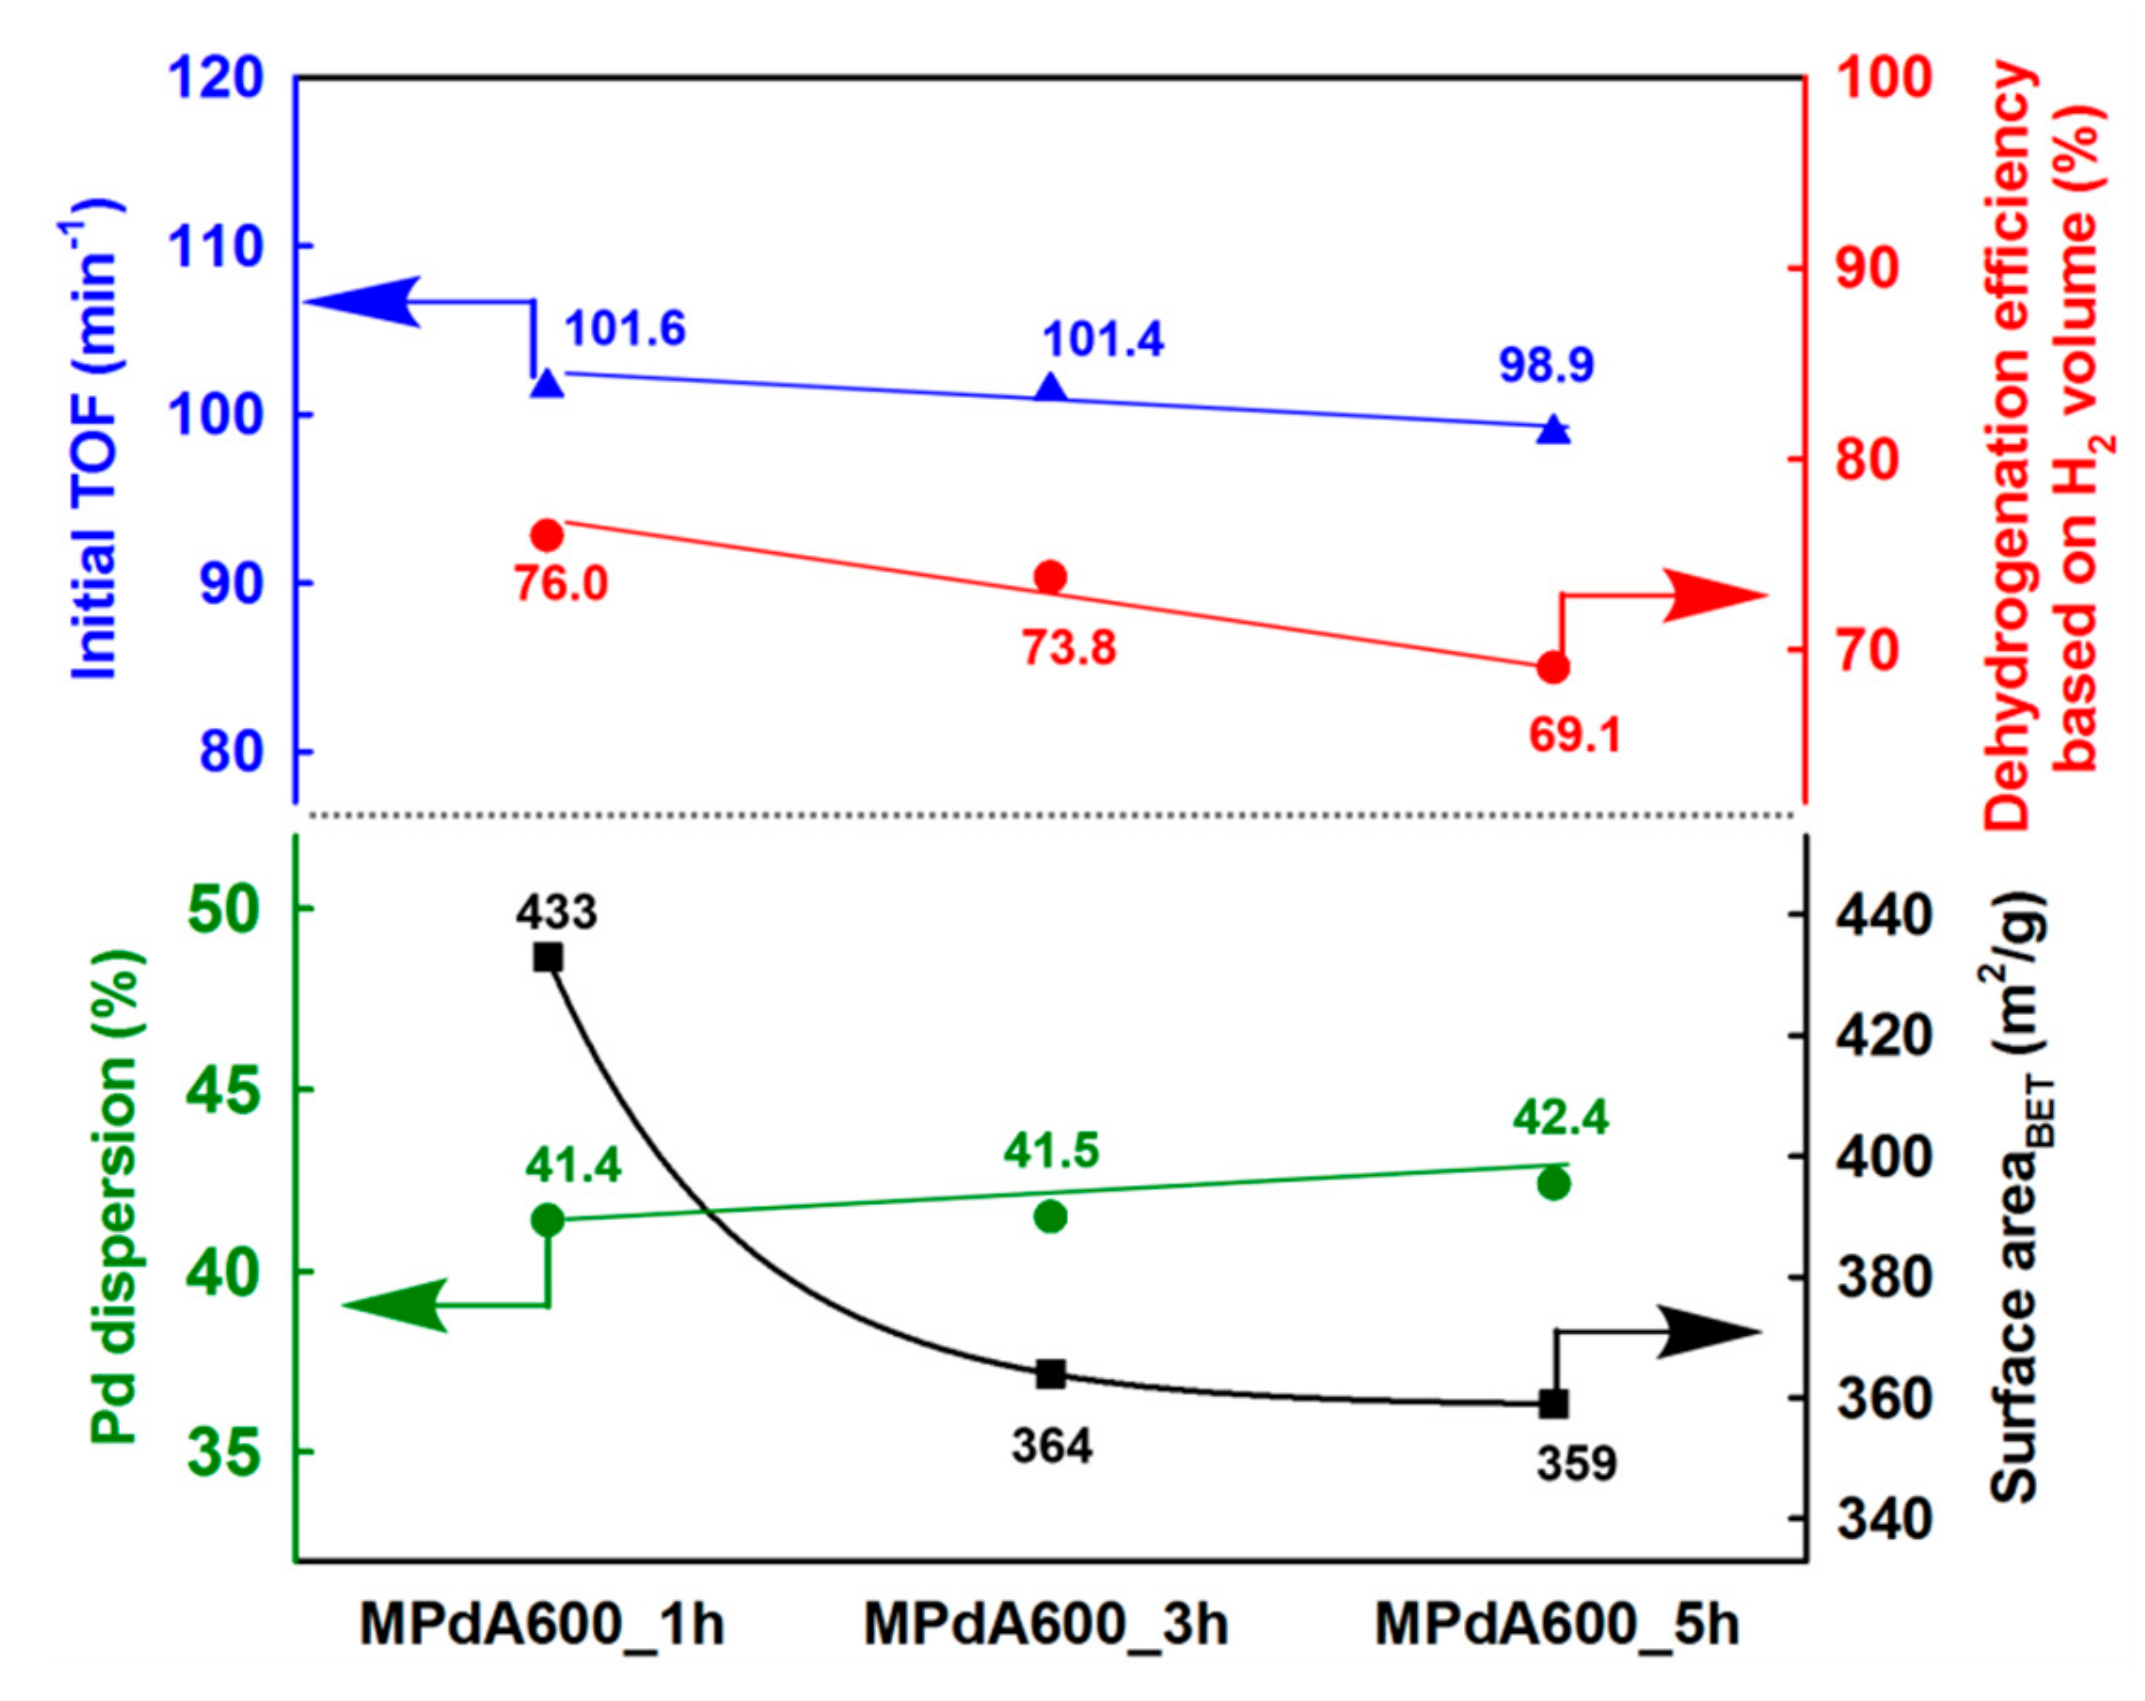
Figure 10 displays the correlation of Pd dispersion and BET surface area with the initial TOF and the final dehydrogenation efficiency calculated from the time-dependent H
2 release curves of MPdA catalysts subjected to different calcination durations at 600 °C. It is evident that a change in calcination time affected the BET surface area, but not the Pd dispersion. Interestingly, the change in calcination time does not have any effect at the initial activity but has an effect as time progresses, which can be clearly understood from the results of the initial TOF and the final dehydrogenation efficiency. Hence, the attained results support that a better arrangement of an equal number of active sites exists on the high surface area, which permits the greater hydrogen discharge competence of MPdA600_1h compared to those of MPdA600_3h and MPdA600_5h.
2.3. Optimization of Reaction Parameters
The U.S. Department of Energy (DOE) states that the minimum gravimetric hydrogen storage capacity required for vehicular applications is 5.5 wt% [
6,
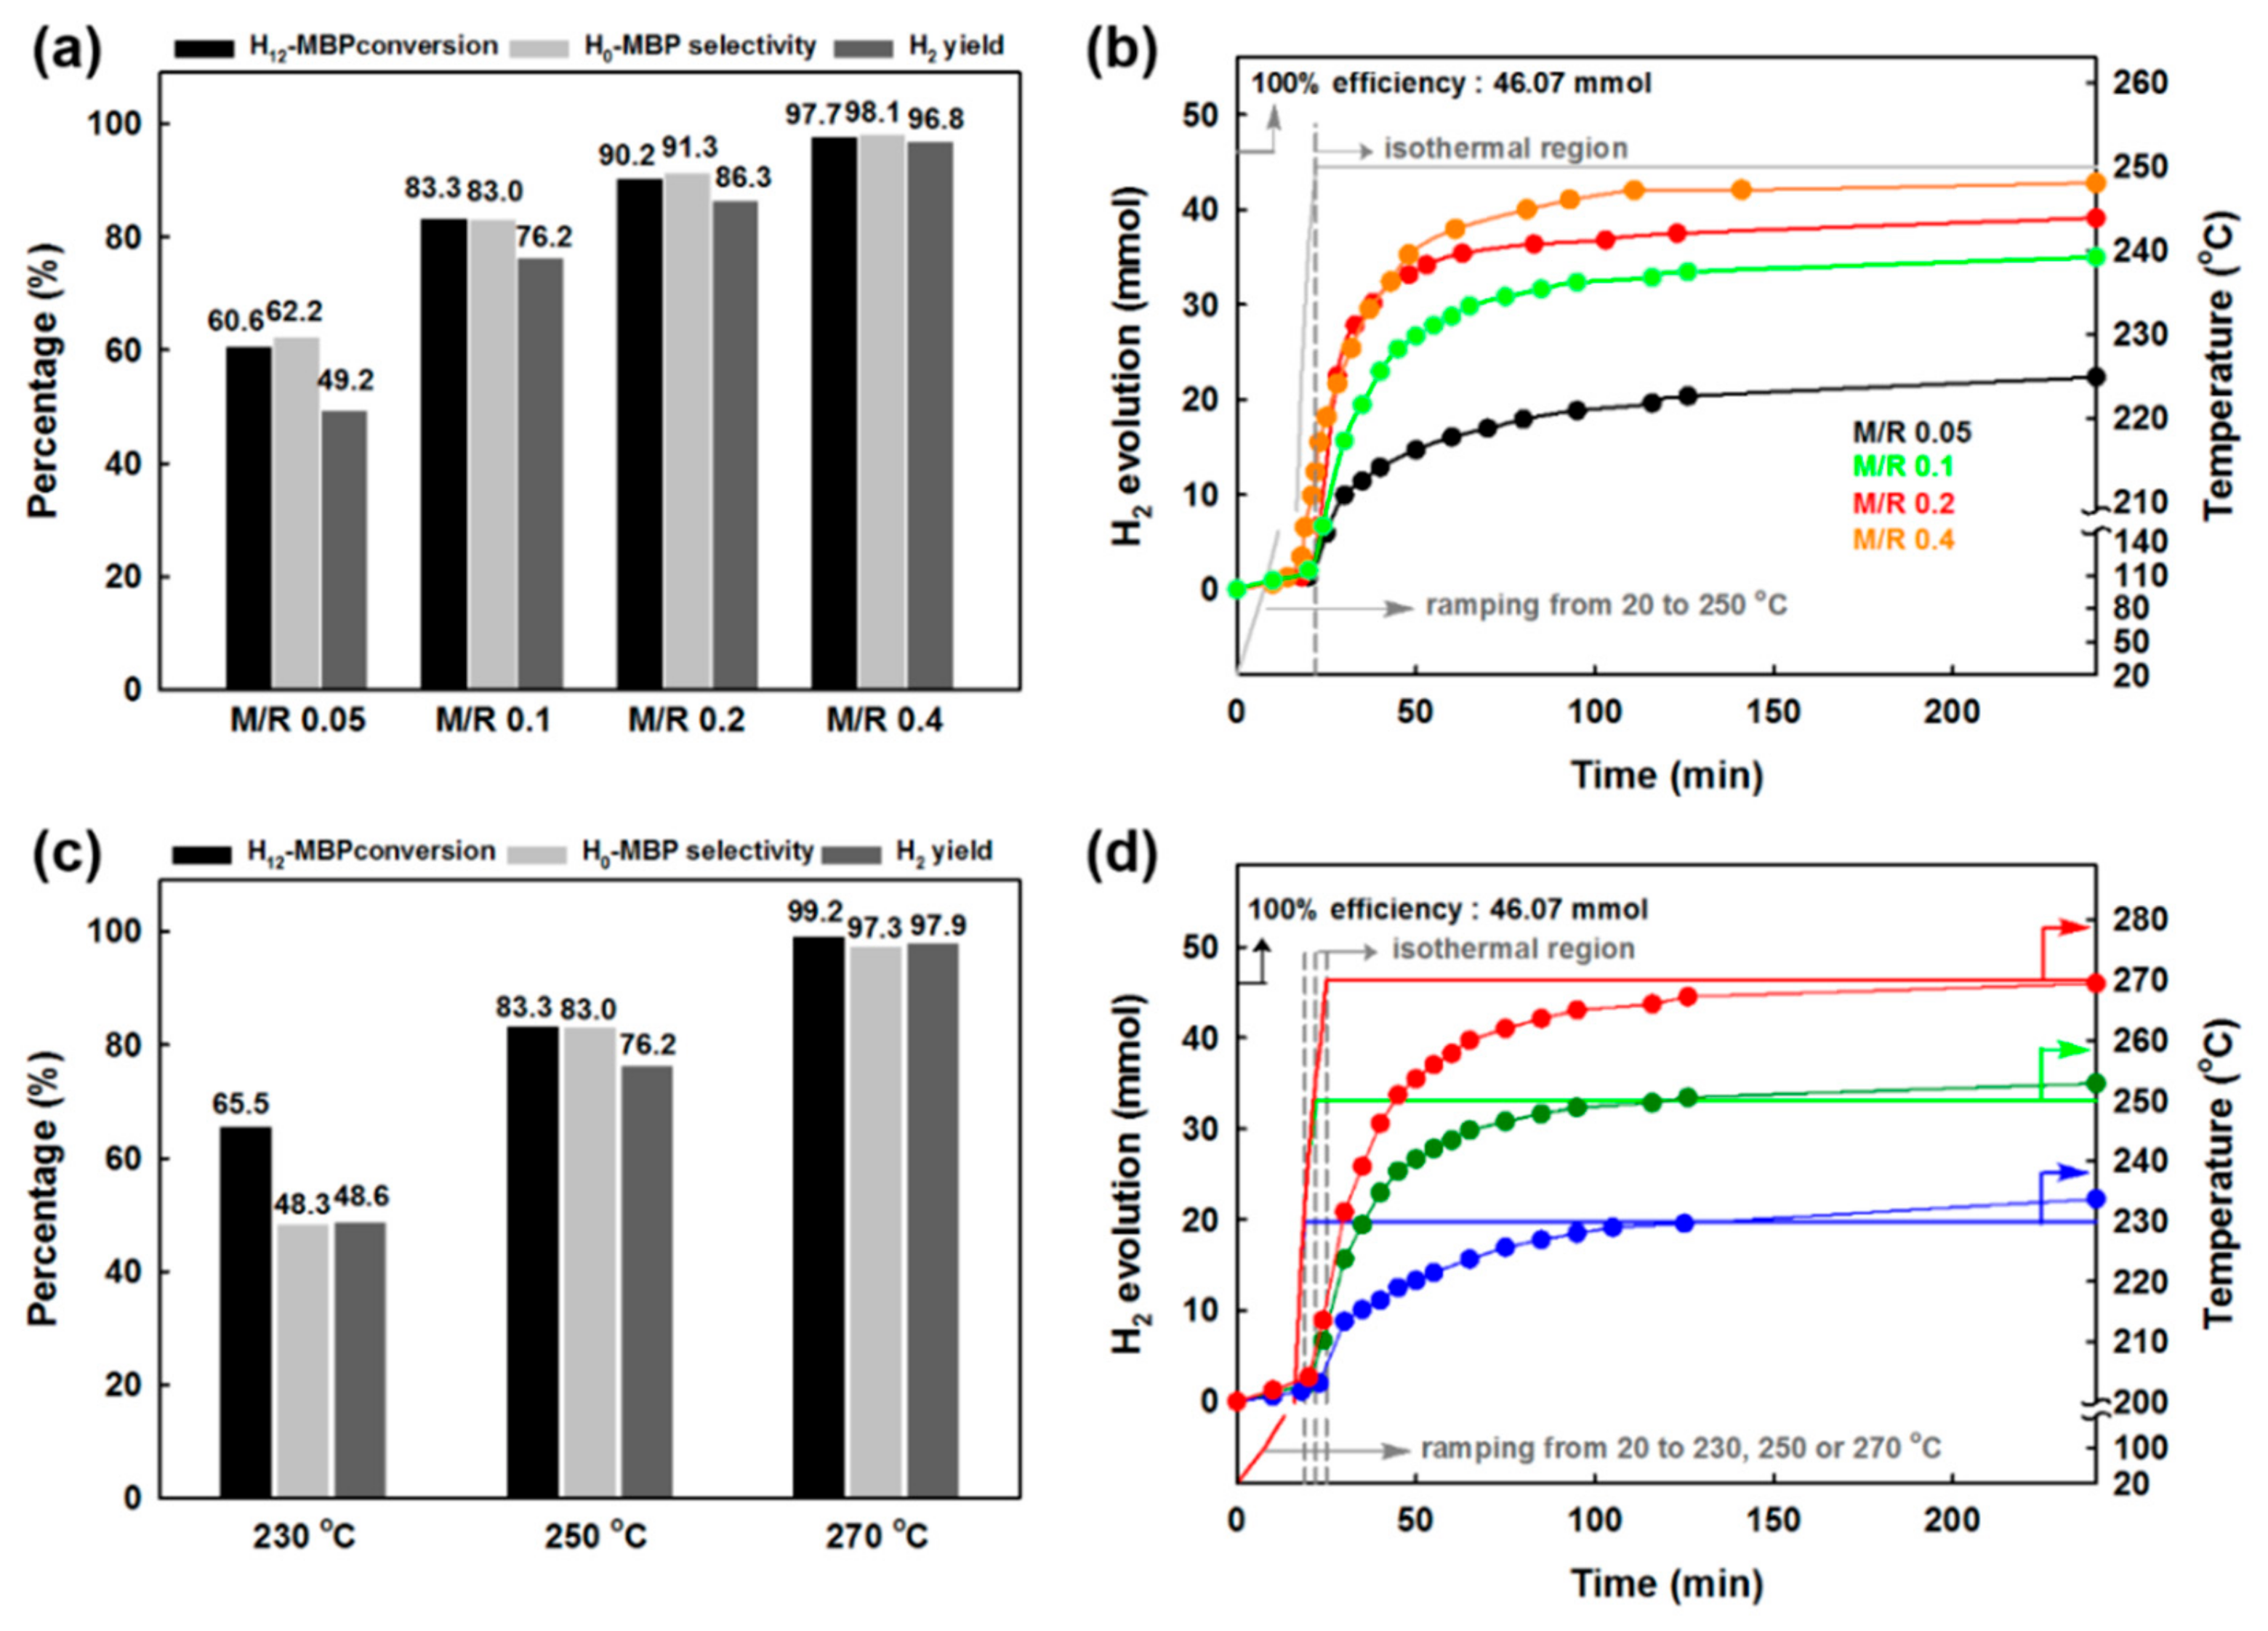
17]. In order to achieve this criterion, optimization of the best catalyst (i.e., MPdA600_1h) is needed. Hence, MPdA600_1h was first tested by changing the M/R ratio from 0.05 mol% to 0.4 mol% at 250 °C for 4 h, and the activity results are presented in
Figure 11a along with their time-dependent H
2 release curves (
Figure 11b). The time-dependent H
2 release curves show that the discharge of H
2 increased with such an increase in M/R ratio. The results indicate that the lower discharge of H
2 at the M/R ratio of 0.05 mol% was due to the lower amount of catalyst, while an increase in M/R ratio increased the discharge of H
2, which reached a maximum value of 1076 cm
3 at the M/R ratio of 0.4 mol%. The activity results obtained through the GC also projected the same results, in which an enrichment in H
12-MBP conversion, H
0-MBP selectivity, and H
2 yield occurs uninterruptedly as the M/R ratio increases from 0.05 mol% to 0.4%. These results indicate that the use of higher amounts of catalyst (i.e., M/R ratio of 0.4 mol%) assists in the dehydrogenation of both piperidine and the cyclohexane ring in H
12-MBP, and harvests approximately 5.8 wt% of H
2 in terms of gravimetric density.
Later, the dehydrogenation of H
12-MBP over MPdA600_1h was examined at various temperatures ranging from 230 °C to 270 °C at 20 °C intervals, and the activity results obtained through the GC are shown in
Figure 11c along with their time-dependent H
2 release curves (
Figure 11d). It is obvious that the conversion of H
12-MBP increases with an increase in reaction temperature. Similarly, H
0-MBP selectivity and H
2 yield also increase with increasing reaction temperature. The obtained low H
0-MBP selectivity and H
2 yield at 230 °C can be explained by the slower dehydrogenation of the cyclohexane ring along with the piperidine ring in H
12-MBP. It can be expected that a rise in reaction temperature enables a more pronounced dehydrogenation of the cyclohexane ring in H
12-MBP, and thus aids in achieving higher H
0-MBP selectivity and H
2 yield (which is equivalent to 6.1 wt% of H
2 gravimetric density). Hence, the results indicate that the minimum required amount of H
2 for mobile applications (i.e., 5.5 wt%) can be attained either by increasing the temperature to 270 °C at 0.1 mol% M/R or by increasing the M/R ratio to 0.4 mol% at 250 °C.


