Kinetic Study Based on the Carbide Mechanism of a Co-Pt/γ-Al2O3 Fischer–Tropsch Catalyst Tested in a Laboratory-Scale Tubular Reactor
Abstract
1. Introduction
2. Results
2.1. Catalyst Characterization
2.2. FT Mechanism
2.3. FT Products Distributions
3. Discussion
3.1. FT Kinetic Model
4. Materials and Methods
4.1. Catalyst Preparation and Characterization
4.2. Catalyst Testing
4.3. Kinetic Model Development
4.4. Reactor Model
4.5. Data Regression
5. Conclusions
Supplementary Materials
Author Contributions
Funding
Acknowledgments
Conflicts of Interest
Appendix A
- Interphase mass transfer limitations—Mears’ criterion [76]:
| Catalyst Parameter | Value |
|---|---|
| Packed bulk density [g/l] | 820 |
| Tortuosity [−] | 2 |
| Thermal conductivity [W/(m K)] | 1.02 |
| Median particle size [m] | 7.50 × 10⁻⁸ |
| Characteristic length [m] | 1.25 × 10⁻⁸ |
References
- Rafiee, A.; Rajab Khalilpour, K.; Milani, D.; Panahi, M. Trends in CO2 conversion and utilization: A review from process systems perspective. J. Environ. Chem. Eng. 2018, 6, 5771–5794. [Google Scholar] [CrossRef]
- Van der Laan, G.P.; Beenackers, A.A.C.M. Kinetics and Selectivity of the Fischer-Tropsch Synthesis: A Literature Review. Catal. Rev. 1999, 4940, 255–318. [Google Scholar] [CrossRef]
- Dry, M.E. The Fischer—Tropsch process: 1950–2000. Catal. Today 2002, 71, 227–241. [Google Scholar] [CrossRef]
- Klerk, A. De Can Fischer-Tropsch Syncrude Be Refined to On-Specification Diesel Fuel? Energy Fuel 2009, 75, 4593–4604. [Google Scholar] [CrossRef]
- Kim, H.H.; Mazumder, M.; Lee, M.-S.; Lee, S.-J. Effect of blending time on viscosity of rubberized binders with wax additives. Int. J. Pavement Res. Technol. 2018, 11, 655–665. [Google Scholar] [CrossRef]
- Wood, D.A.; Nwaoha, C.; Towler, B.F. Gas-to-liquids (GTL): A review of an industry offering several routes for monetizing natural gas. J. Nat. Gas Sci. Eng. 2012, 9, 196–208. [Google Scholar] [CrossRef]
- Chiodini, A.; Bua, L.; Carnelli, L.; Zwart, R.; Vreugdenhil, B.; Vocciante, M. Enhancements in Biomass-to-Liquid processes: Gasification aiming at high hydrogen/carbon monoxide ratios for direct Fischer-Tropsch synthesis applications. Biomass and Bioenergy 2017, 106, 104–114. [Google Scholar] [CrossRef]
- Hillestad, M.; Ostadi, M.; Alamo Serrano, G.d.; Rytter, E.; Austbø, B.; Pharoah, J.G.; Burheim, O.S. Improving carbon efficiency and profitability of the biomass to liquid process with hydrogen from renewable power. Fuel 2018, 234, 1431–1451. [Google Scholar] [CrossRef]
- Rafiee, A.; Panahi, M.; Khalilpour, K.R. CO2 utilization through integration of post-combustion carbon capture process with Fischer-Tropsch gas-to-liquid (GTL) processes. J. CO2 Util. 2017, 18, 98–106. [Google Scholar] [CrossRef]
- Vázquez, F.V.; Koponen, J.; Ruuskanen, V.; Bajamundi, C.; Kosonen, A.; Simell, P.; Ahola, J.; Frilund, C.; Elfving, J.; Reinikainen, M.; et al. Power-to-X technology using renewable electricity and carbon dioxide from ambient air: SOLETAIR proof-of-concept and improved process concept. J. CO2 Util. 2018, 28, 235–246. [Google Scholar] [CrossRef]
- Shafer, W.; Gnanamani, M.; Graham, U.; Yang, J.; Masuku, C.; Jacobs, G.; Davis, B.; Shafer, W.D.; Gnanamani, M.K.; Graham, U.M.; et al. Fischer–Tropsch: Product Selectivity–The Fingerprint of Synthetic Fuels. Catalysts 2019, 9, 259. [Google Scholar] [CrossRef]
- Mahmoudi, H.; Mahmoudi, M.; Doustdar, O.; Jahangiri, H.; Tsolakis, A.; Gu, S.; Lech Wyszynski, M. A review of Fischer Tropsch synthesis process, mechanism, surface chemistry and catalyst formulation. Biofuels Eng. 2017, 2, 11–31. [Google Scholar] [CrossRef]
- Shimizu, T.; Ushiki, I.; Ota, M.; Sato, Y.; Koizumi, N.; Inomata, H. Preparation of mesoporous silica supported cobalt catalysts using supercritical fluids for Fischer–Tropsch synthesis. Chem. Eng. Res. Des. 2015, 95, 64–68. [Google Scholar] [CrossRef]
- Tucker, C.L.; van Steen, E. Activity and selectivity of a cobalt-based Fischer-Tropsch catalyst operating at high conversion for once-through biomass-to-liquid operation. Catal. Today 2018. [Google Scholar] [CrossRef]
- Botes, F.G.; Niemantsverdriet, J.W.; Loosdrecht, J. Van De A comparison of cobalt and iron based slurry phase Fischer – Tropsch synthesis. Catal. Today 2013, 215, 112–120. [Google Scholar] [CrossRef]
- Visconti, C.G.; Tronconi, E.; Lietto, L.; Forzatti, P.; Rossini, E.; Zennaro, R. Detailed Kinetics of the Fischer – Tropsch Synthesis on Cobalt Catalysts Based on H-Assisted CO Activation. Top Catal 2011, 786–800. [Google Scholar] [CrossRef]
- Todic, B.; Ma, W.; Jacobs, G.; Davis, B.H.; Bukur, D.B. CO-insertion mechanism based kinetic model of the Fischer-Tropsch synthesis reaction over Re-promoted Co catalyst. Catal. Today 2014, 228, 32–39. [Google Scholar] [CrossRef]
- Yates, I.C.; Satterfield, C.N. Intrinsic Kinetics of the Fischer-Tropsch Synthesis on a Cobalt Catalyst. Energy Fuels 1991, 5, 168–173. [Google Scholar] [CrossRef]
- Ma, W.; Jacobs, G.; Sparks, D.E.; Spicer, R.L.; Davis, B.H.; Klettlinger, J.L.S.; Yen, C.H. Fischer – Tropsch synthesis: Kinetics and water effect study over 25 % Co/Al2O3 catalysts. Catal. Today 2014, 228, 158–166. [Google Scholar] [CrossRef]
- Piermartini, P.; Boeltken, T.; Selinsek, M.; Pfeifer, P. Influence of channel geometry on Fischer-Tropsch synthesis in microstructured reactors. Chem. Eng. J. 2017, 313, 328–335. [Google Scholar] [CrossRef]
- Moazami, N.; Wyszynski, M.L.; Rahbar, K.; Tsolakis, A.; Mahmoudi, H. A comprehensive study of kinetics mechanism of Fischer-Tropsch synthesis over cobalt-based catalyst. Chem. Eng. Sci. 2017, 171, 32–60. [Google Scholar] [CrossRef]
- Ostadi, M.; Rytter, E.; Hillestad, M. Evaluation of kinetic models for Fischer–Tropsch cobalt catalysts in a plug flow reactor. Chem. Eng. Res. Des. 2016, 114, 236–246. [Google Scholar] [CrossRef]
- Moazami, N.; Wyszynski, M.L.; Mahmoudi, H.; Tsolakis, A.; Zou, Z.; Panahifar, P.; Rahbar, K. Modelling of a fixed bed reactor for Fischer–Tropsch synthesis of simulated N2-rich syngas over Co/SiO2: Hydrocarbon production. Fuel 2015, 154, 140–151. [Google Scholar] [CrossRef]
- Bhatelia, T.; Li, E.; Sun, Y.; Hazewinkel, P.; Burke, N.; Sage, V. Chain length dependent olefin re-adsorption model for Fischer-Tropsch synthesis over Co-Al2O3 catalyst. Fuel Process. Technol. 2014, 125, 277–289. [Google Scholar] [CrossRef]
- Van Dijk, H.A.J. The Fischer-Tropsch Synthesis: A Mechanistic Study Using Transient Isotopic Tracing. Ph.D. Thesis, Eindhoven University of Technology, Eindhoven, The Nederland, 2001. [Google Scholar]
- Kondamudi, K.; Pant, K.K.; Upadhyayula, S. Synergistic Effect of Fe−Co Bimetallic Catalyst on FTS and WGS Activity in the Fischer−Tropsch Process: A Kinetic Study. Ind. Eng. Chem. Res. 2017, 56, 4659–4671. [Google Scholar]
- Davis, B.H. Fischer-Tropsch synthesis: Current mechanism and futuristic needs. Fuel Process. Technol. 2001, 71, 157–166. [Google Scholar] [CrossRef]
- Fajín, J.; Cordeiro, M.; Gomes, J.; Fajín, J.L.C.; Cordeiro, M.N.D.S.; Gomes, J.R.B. Fischer-Tropsch Synthesis on Multicomponent Catalysts: What Can We Learn from Computer Simulations? Catalysts 2015, 5, 3–17. [Google Scholar] [CrossRef]
- Wojciechowski, B.W. The Kinetics of the Fischer- Tropsch Synthesis. Catal. Re. Sci. Eng. 1988, 629–702. [Google Scholar] [CrossRef]
- Turner, M.L.; Long, H.C.; Shenton, A.; Byers, P.K.; Maitlis, P.M. The Alkenyl Mechanism for Fischer-Tropsch Surface Methylene Polymerisation; the Reactions of Vinylic Probes with CO/H2 over Rhodium Catalyst. Chem. - A Eur. J. 1995, 1, 549–556. [Google Scholar] [CrossRef]
- Fischer, F.; Tropsch, H. The Synthesis of Petroleum at Atmospheric Pressures from Gasification Products of Coal. Brennstoff-Chemie 1926, 7, 97–104. [Google Scholar]
- Lox, E.S.; Froment, G.F. Kinetics of the Fischer-Tropsch Reaction on a Precipitated Promoted Iron Catalyst. 2. Kinetic Modeling. Ind. Eng. Chem. Res. 1993, 71–82. [Google Scholar] [CrossRef]
- Shi, B.; Davis, B.H. Fischer–Tropsch synthesis: accounting for chain-length related phenomena. Appl. Catal. A Gen. 2004, 277, 61–69. [Google Scholar] [CrossRef]
- Schulz, H.; Claeys, M. Kinetic modelling of Fischer–Tropsch product distributions. Appl. Catal. A Gen. 1999, 186, 91–107. [Google Scholar] [CrossRef]
- Iglesia, E.; Reyes, S.C.; Madon, R.J. Transport-Enhanced a-Olefin Readsorption Pathways in Ru-Catalyzed Hydrocarbon Synthesis. J. Catal. 1991, 6, 238–256. [Google Scholar] [CrossRef]
- Botes, F.G. Proposal of a New Product Characterization Model for the Iron-Based Low-Temperature Fischer−Tropsch Synthesis. Energy Fuels 2007, 21, 1379–1389. [Google Scholar] [CrossRef]
- Schulz, H.; Claeys, M. Reactions of α-olefins of different chain length added during Fischer–Tropsch synthesis on a cobalt catalyst in a slurry reactor. Appl. Catal. A Gen. 1999, 186, 71–90. [Google Scholar] [CrossRef]
- Pant, K.K.; Upadhyayula, S. Detailed kinetics of Fischer Tropsch synthesis over Fe-Co bimetallic catalyst considering chain length dependent olefin desorption. Fuel 2019, 236, 1263–1272. [Google Scholar] [CrossRef]
- Todic, B.; Bhatelia, T.; Froment, G.F.; Ma, W.; Jacobs, G.; Davis, B.H.; Bukur, D.B. Kinetic Model of Fischer−Tropsch Synthesis in a Slurry Reactor on Co−Re/Al2O3 Catalyst. Ind. Eng. Chem. Res. 2013, 52, 669–679. [Google Scholar] [CrossRef]
- Visconti, C.G.; Tronconi, E.; Lietti, L.; Zennaro, R.; Forzatti, P. Development of a complete kinetic model for the Fischer – Tropsch synthesis over Co/Al2O3 catalysts. Chem. Eng. Sci. 2007, 62, 5338–5343. [Google Scholar] [CrossRef]
- Kwack, S.-H.; Park, M.-J.; Bae, J.W.; Ha, K.-S.; Jun, K.-W. Development of a kinetic model of the Fischer – Tropsch synthesis reaction with a cobalt-based catalyst. React. Kinet. Mech. Catal. 2011, 483–502. [Google Scholar] [CrossRef]
- Gavrilović, L.; Save, J.; Blekkan, E.A. The Effect of Potassium on Cobalt-Based Fischer–Tropsch Catalysts with Different Cobalt Particle Sizes. Catalysts 2019, 9, 351. [Google Scholar]
- Karaca, H.; Safonova, O.V.; Chambrey, S.; Fongarland, P.; Roussel, P.; Griboval-Constant, A.; Lacroix, M.; Khodakov, A.Y. Structure and catalytic performance of Pt-promoted alumina-supported cobalt catalysts under realistic conditions of Fischer-Tropsch synthesis. J. Catal. 2011, 277, 14–26. [Google Scholar] [CrossRef]
- Nabaho, D.; Niemantsverdriet, J.W.; Claeys, M.; van Steen, E. Hydrogen spillover in the Fischer–Tropsch synthesis: An analysis of gold as a promoter for cobalt–alumina catalysts. Catal. Today 2016, 275, 27–34. [Google Scholar] [CrossRef]
- Bezemer, G.L.; Bitter, J.H.; Kuipers, H.P.C.E.; Oosterbeek, H.; Holewijn, J.E.; Xu, X.; Kapteijn, F.; Van Diilen, A.J.; De Jong, K.P. Cobalt particle size effects in the Fischer-Tropsch reaction studied with carbon nanofiber supported catalysts. J. Am. Chem. Soc. 2006, 128, 3956–3964. [Google Scholar] [CrossRef] [PubMed]
- Fischer, N.; Clapham, B.; Feltes, T.; Claeys, M. Cobalt-Based Fischer-Tropsch Activity and Selectivity as a Function of Crystallite Size and Water Partial Pressure. ACS Catal. 2015, 5, 113–121. [Google Scholar] [CrossRef]
- Rønning, M.; Tsakoumis, N.E.; Voronov, A.; Johnsen, R.E.; Norby, P.; Van Beek, W.; Borg, Ø.; Rytter, E.; Holmen, A. Combined XRD and XANES studies of a Re-promoted Co/γ-Al2O3 catalyst at Fischer-Tropsch synthesis conditions. Catal. Today 2010, 155, 289–295. [Google Scholar] [CrossRef]
- Rytter, E.; Borg, Ø.; Tsakoumis, N.E.; Holmen, A. Water as key to activity and selectivity in Co Fischer-Tropsch synthesis: Γ-alumina based structure-performance relationships. J. Catal. 2018, 365, 334–343. [Google Scholar] [CrossRef]
- Fratalocchi, L.; Giorgio, C.; Lietti, L.; Fischer, N.; Claeys, M. A promising preparation method for highly active cobalt based Fischer- Tropsch catalysts supported on stabilized Al2O3. Appl. Catal. A Gen. 2018, 556, 92–103. [Google Scholar] [CrossRef]
- Den Breejen, J.P.; Radstake, P.B.; Bezemer, G.L.; Bitter, J.H.; Fr{\o}seth, V.; Holmen, A.; De Jong, K.P. On the Origin of the Cobalt Particle Size Effects in. J. Am. Chem. Soc. 2009, 131, 7197–7203. [Google Scholar] [CrossRef]
- Lögdberg, S.; Lualdi, M.; Järås, S.; Walmsley, J.C.; Blekkan, E.A.; Rytter, E.; Holmen, A. On the selectivity of cobalt-based Fischer–Tropsch catalysts: Evidence for a common precursor for methane and long-chain hydrocarbons. J. Catal. 2010, 274, 84–98. [Google Scholar] [CrossRef]
- Robota, H.J.; Richard, L.A.; Deshmukh, S.; Leviness, S.; Leonarduzzi, D.; Roberts, D. High Activity and Selective Fischer-Tropsch Catalysts for Use in a Microchannel Reactor. Catal. Surv. Asia 2014, 18, 177–182. [Google Scholar] [CrossRef]
- Ojeda, M.; Nabar, R.; Nilekar, A.U.; Ishikawa, A.; Mavrikakis, M.; Iglesia, E. CO activation pathways and the mechanism of Fischer–Tropsch synthesis. J. Catal. 2010, 272, 287–297. [Google Scholar] [CrossRef]
- Storsæter, S.; Chen, D.; Holmen, A. Microkinetic modelling of the formation of C 1 and C 2 products in the Fischer – Tropsch synthesis over cobalt catalysts. Surf. Sci. 2006, 600f, 2051–2063. [Google Scholar] [CrossRef]
- Mansouri, M.; Atashi, H.; Mirzaei, A.A.; Jangi, R. Kinetics of the Fischer-Tropsch synthesis on silica-supported cobalt-cerium catalyst. Int. J. Ind. Chem. 2013, 4, 1–10. [Google Scholar] [CrossRef]
- Nikbakht, N.; Mirzaei, A.A.; Atashi, H. Kinetic modeling of the Fischer-Tropsch reaction over a zeolite supported Fe-Co-Ce catalyst prepared using impregnation procedure. Fuel 2018, 229, 209–216. [Google Scholar] [CrossRef]
- Mirzaei, A.A.; Shirzadi, B.; Atashi, H.; Mansouri, M. Modeling and operating conditions optimization of Fischer-Tropsch synthesis in a fixed-bed reactor. J. Ind. Eng. Chem. 2012, 18, 1515–1521. [Google Scholar] [CrossRef]
- Almeida, L.C.; Sanz, O.; Merino, D.; Arzamendi, G.; Gandía, L.M.; Montes, M. Kinetic analysis and microstructured reactors modeling for the Fischer – Tropsch synthesis over a Co – Re/Al2O3 catalyst. Catal. Today 2013, 215, 103–111. [Google Scholar] [CrossRef]
- Keyser, M.J.; Everson, R.C.; Espinoza, R.L. Fischer-Tropsch Kinetic Studies with Cobalt-Manganese Oxide Catalysts. Ind. Eng. Chem. Res. 2000, 39, 48–54. [Google Scholar] [CrossRef]
- Nikparsaa, P.; Mirzaeia, A.A.; Atashib, H. Effect of reaction conditions and Kinetic study on the Fischer-Tropsch synthesis over fused Co-Ni/Al2O3 catalyst. J. Fuel Chem. Technol. 2014, 42, 710–718. [Google Scholar] [CrossRef]
- Ghouri, M.M.; Afzal, S.; Hussain, R.; Blank, J.; Bukur, D.B.; Elbashir, N.O. Multi-scale modeling of fixed-bed Fischer Tropsch reactor. Comput. Chem. Eng. 2016, 91, 38–48. [Google Scholar] [CrossRef]
- Cheng, J.; Hu, P.; Ellis, P.; French, S.; Kelly, G.; Lok, C.M. A DFT study of the chain growth probability in Fischer–Tropsch synthesis. J. Catal. 2008, 257, 221–228. [Google Scholar] [CrossRef]
- Goda, A.M.; Neurock, M.; Barteau, M.A.; Chen, J.G. Effect of hydrocarbon chain length and cyclization on the adsorption strength of unsaturated hydrocarbons on Pt/3d bimetallic surfaces. Surf. Sci. 2008, 602, 2513–2523. [Google Scholar] [CrossRef]
- Froment, G.F.; Bischoff, K.B.; De Wilde, J. Chemical Reactor Analysis and Design; John Wiley & Sons, Inc.: Hoboken, NJ, USA, 2010; Volume 91. [Google Scholar]
- Chen, W.; Filot, I.A.W.; Pestman, R.; Hensen, E.J.M. Mechanism of Cobalt-Catalyzed CO Hydrogenation: 2. Fischer− Tropsch Synthesis. ACS Catal. 2017, 7, 8061–8071. [Google Scholar] [CrossRef] [PubMed]
- Rytter, E.; Tsakoumis, N.E.; Holmen, A. On the selectivity to higher hydrocarbons in Co-based Fischer-Tropsch synthesis. Catal. Today 2016, 261, 3–16. [Google Scholar] [CrossRef]
- Kasun, G.T.; Gunasooriya, K.; Van Bavel, A.P.; Kuipers, H.P.C.E.; Saeys, M. Key Role of Surface Hydroxyl Groups in C−O Activation during Fischer−Tropsch Synthesis. ACS Catal. 2016, 6, 3660–3664. [Google Scholar]
- Kruit, K.D.; Vervloet, D.; Kapteijn, F.; Van Ommen, J.R. Selectivity of the Fischer-Tropsch process: Deviations from single alpha product distribution explained by gradients in process conditions. Catal. Sci. Technol. 2013, 3, 2210–2213. [Google Scholar] [CrossRef]
- Yang, R.; Zhou, L.; Gao, J.; Hao, X.; Wu, B.; Yang, Y.; Li, Y. Effects of experimental operations on the Fischer-Tropsch product distribution. Catal. Today 2017, 298, 77–88. [Google Scholar] [CrossRef]
- Scherrer, P. Bestimmung der Grosse und der inneren Struktur von Kolloidterilchen mittels Rontgestrahlen. Nachrichten von der Gesellschaft der Wissenschaften zu Göttingen, Math. Klasse 1918, 98–100. [Google Scholar]
- Boyer, C.; Gazarian, J.; Lecocq, V.; Maury, S.; Forret, A.; Schweitzer, J.M.; Souchon, V. Development of the Fischer-Tropsch Process: From the Reaction Concept to the Process Book. Oil Gas Sci. Technol. – Rev. d’IFP Energies Nouv. 2016, 71, 44. [Google Scholar] [CrossRef]
- Botes, F.G.; van Dyk, B.; Mcgregor, C. The Development of a Macro Kinetic Model for a Commercial Co/Pt/Al2O3 Fischer-Tropsch Catalyst. Ind. Eng. Chem. Res. 2009, 2, 10439–10447. [Google Scholar] [CrossRef]
- Yang, J.; Liu, Y.; Chang, J.; Wang, Y.-N.; Bai, L.; Xu, Y.-Y.; Xiang, H.-W.; Li, Y.-W.; Zhong, B. Detailed Kinetics of Fischer−Tropsch Synthesis on an Industrial Fe−Mn Catalyst. Ind. Eng. Chem. Res. 2003, 42, 5066–5090. [Google Scholar] [CrossRef]
- Evans, M.G.; Polanyi, M. Inertia and Driving Force of Chemical Reactions. Trans. Faraday Soc. 1937, 34, 11–24. [Google Scholar] [CrossRef]
- Sánchez-López, J.R.G.; Hernández-Ramírez, A.; Martínez-Hernández, A. Modeling of transport phenomena in fixed-bed reactors for the Fischer-Tropsch reaction: a brief literature review. Rev Chem Eng 2017, 33, 109–142. [Google Scholar] [CrossRef]
- Mears, D.E. Tests for Transport Limitations in Experimental Catalytic Reactors. Ind. Eng. Chem. Process Des. Dev. 1970, 10, 541–547. [Google Scholar] [CrossRef]
- Vik, C.B.; Solsvik, J.; Hillestad, M.; Jakobsen, H.A. Interfacial mass transfer limitations of the Fischer-Tropsch synthesis operated in a slurry bubble column reactor at industrial conditions. Chem. Eng. Sci. 2018, 192, 1138–1156. [Google Scholar] [CrossRef]
- Vervloet, D.; Kapteijn, F.; Nijenhuis, J.; Ruud Van Ommen, J. Fischer–Tropsch reaction–diffusion in a cobalt catalyst particle: aspects of activity and selectivity for a variable chain growth probability. Catal. Sci. Technol. 2012, 2, 1221–1233. [Google Scholar] [CrossRef]
- Fratalocchi, L.; Visconti, C.G.; Groppi, G.; Lietti, L.; Tronconi, E. Intensifying heat transfer in Fischer-Tropsch tubular reactors through the adoption of conductive packed foams. Chem. Eng. J. 2018, 349, 829–837. [Google Scholar] [CrossRef]
- Mandić, M.; Todić, B.; Živanić, L.; Nikačević, N.; Bukur, D.B. Effects of Catalyst Activity, Particle Size and Shape, and Process Conditions on Catalyst Effectiveness and Methane Selectivity for Fischer-Tropsch Reaction: A Modeling Study. Ind. Eng. Chem. Res. 2017, 56, 2733–2745. [Google Scholar] [CrossRef]
- Zohdi-Fasaei, H.; Atashi, H.; Farshchi Tabrizi, F.; Mirzaei, A.A. Effects of mass transfer on Fischer-Tropsch kinetics over mesoporous silica-supported CoeMneCe nano catalysts in a fixed-bed reactor. J. Nat. Gas Sci. Eng. 2016, 32, 262–272. [Google Scholar] [CrossRef]
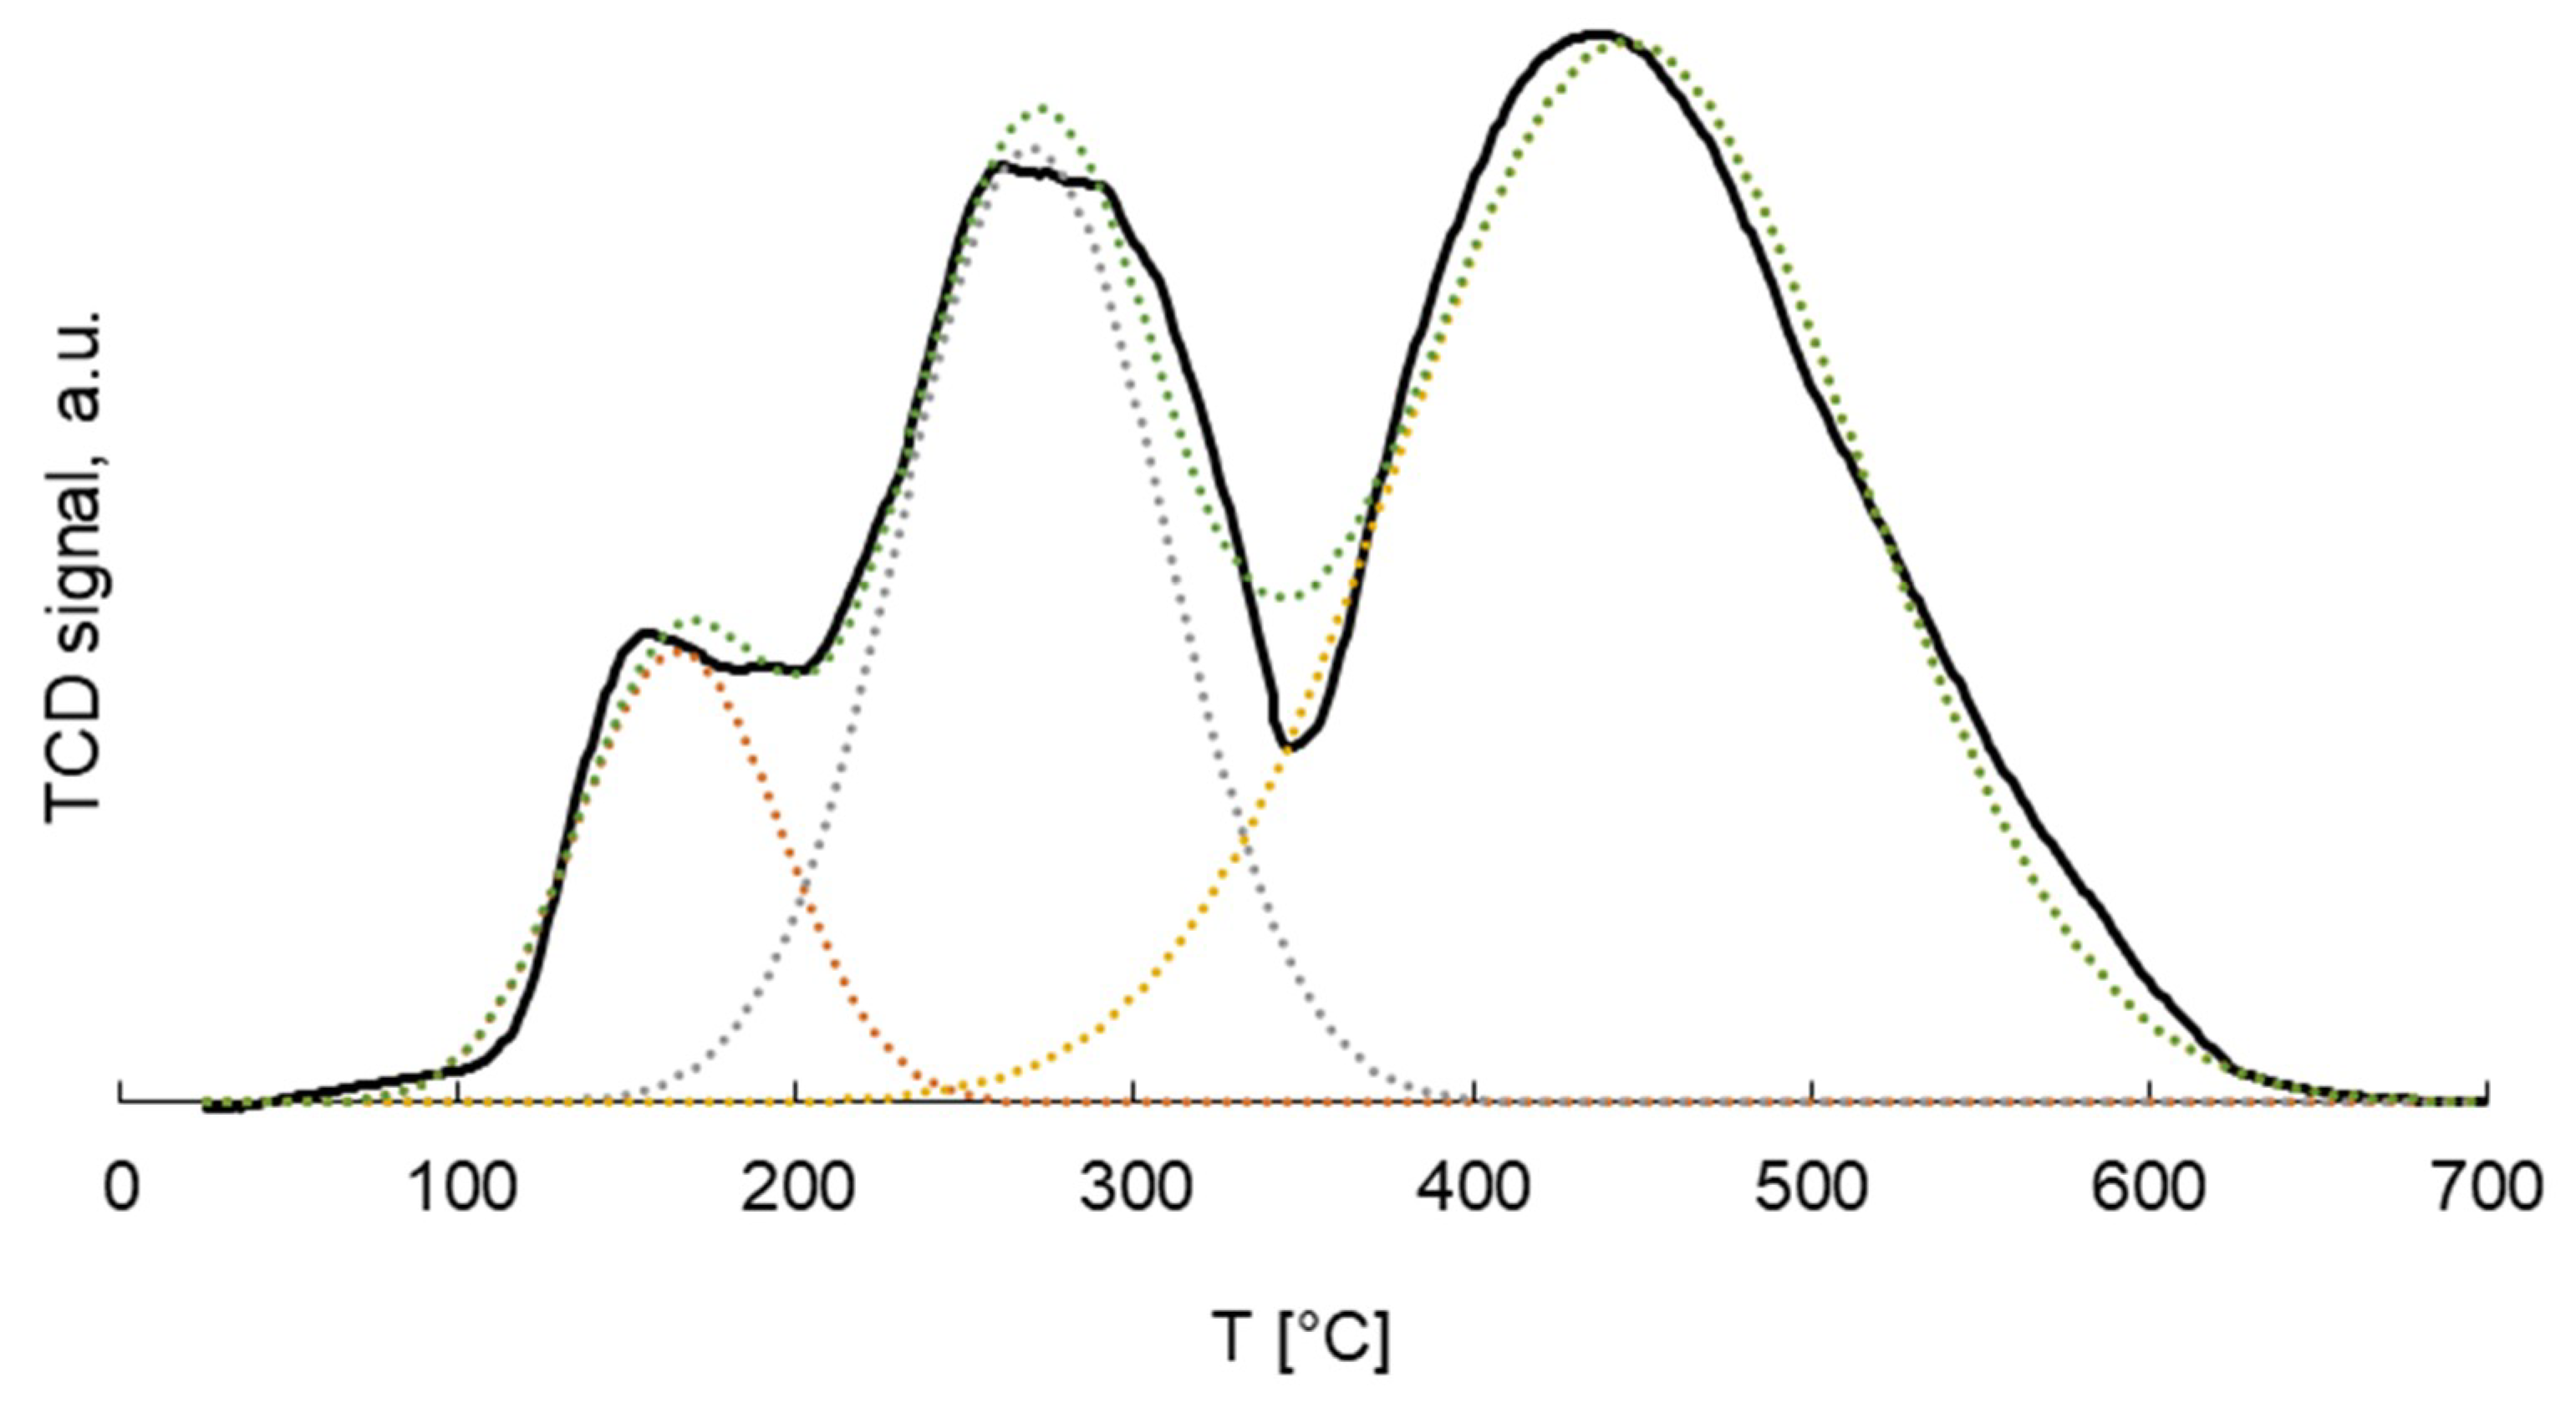
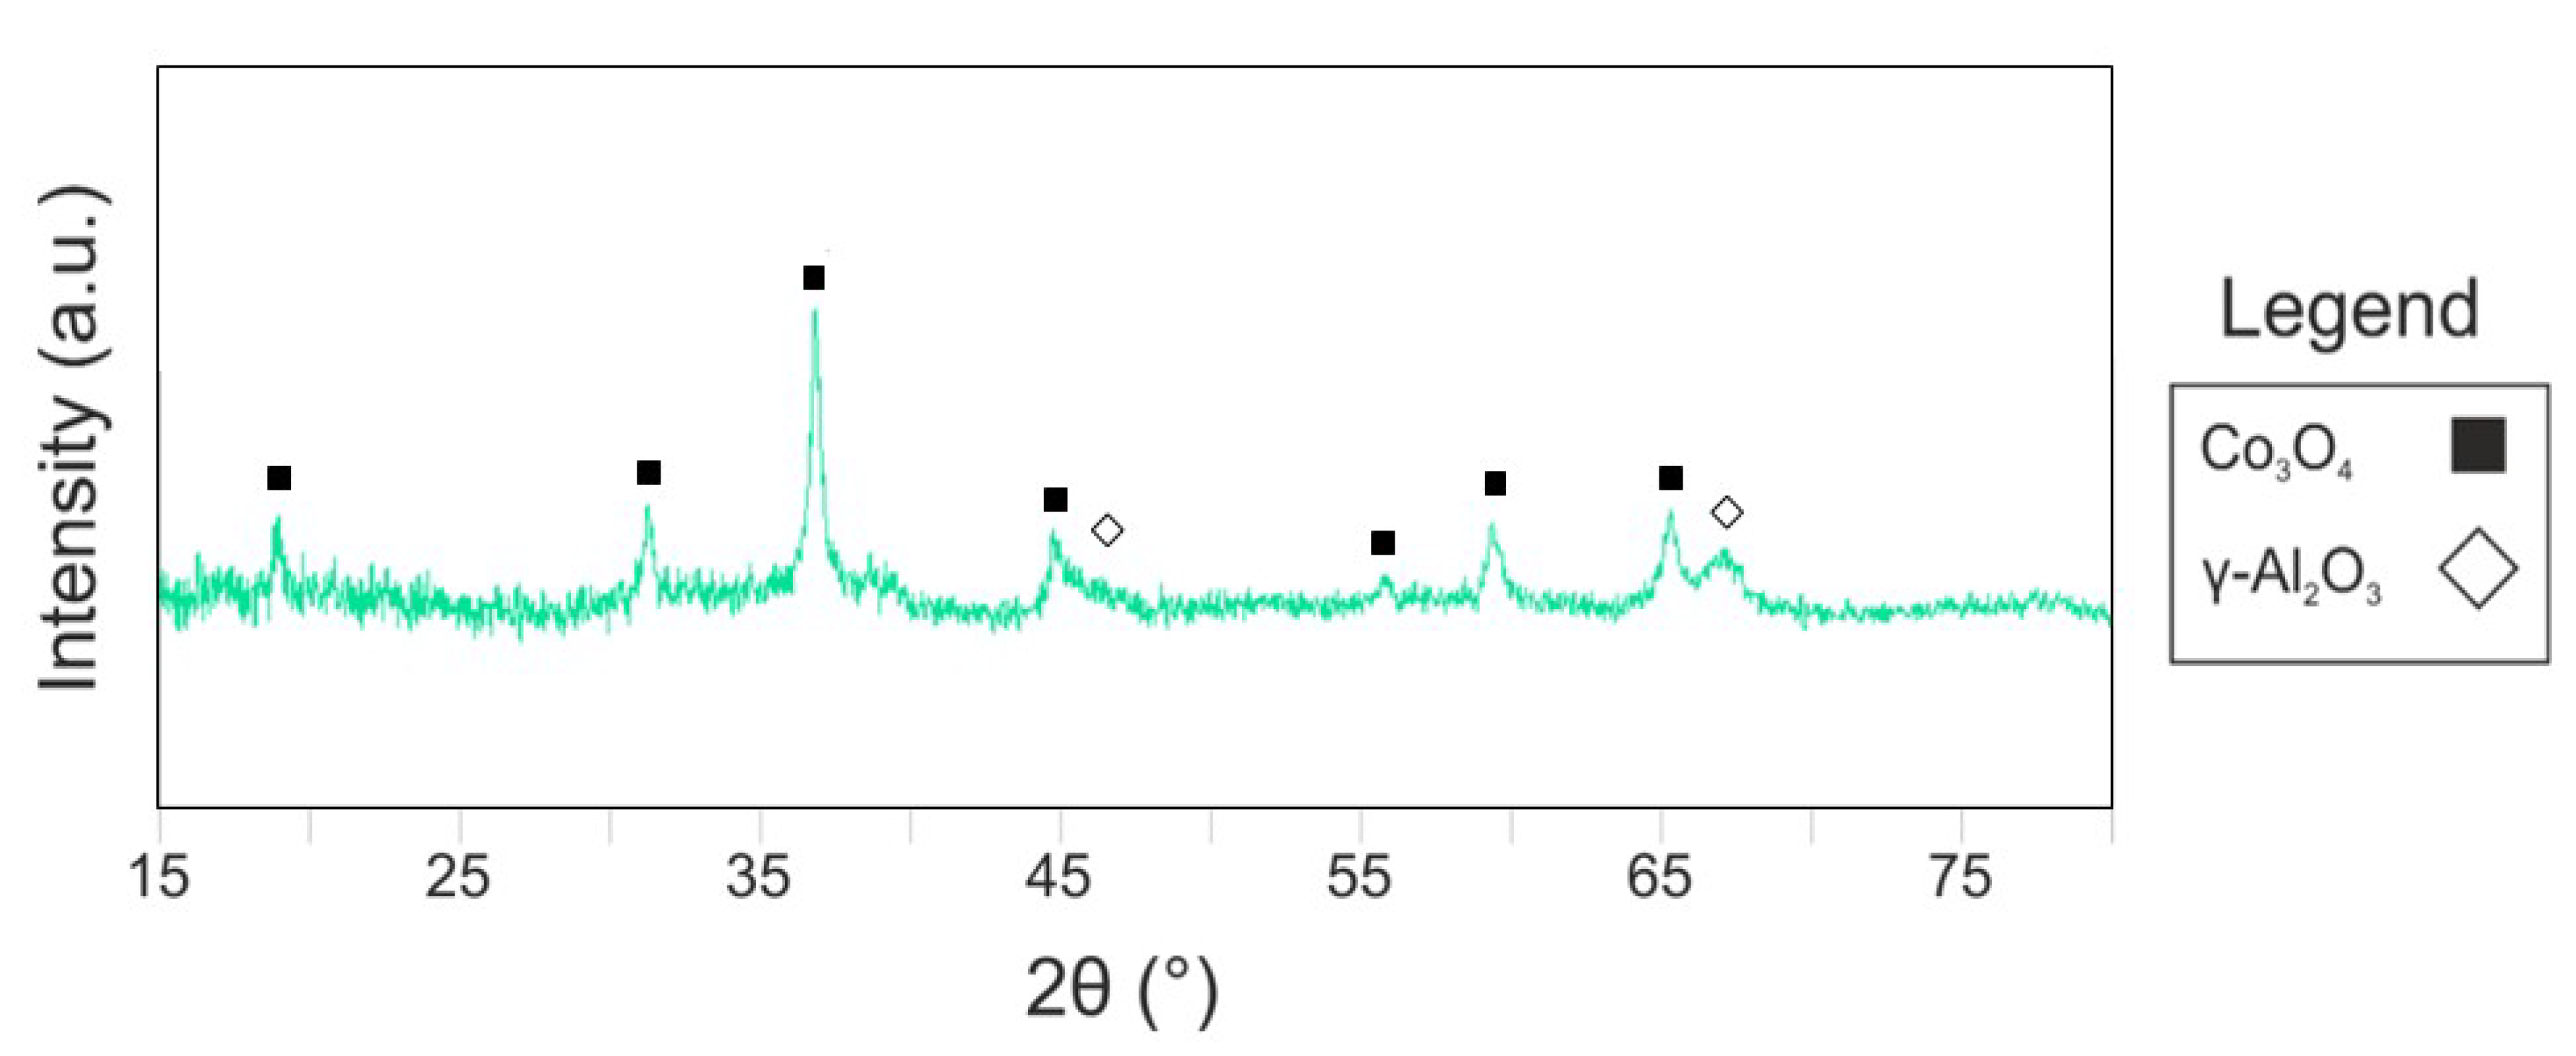
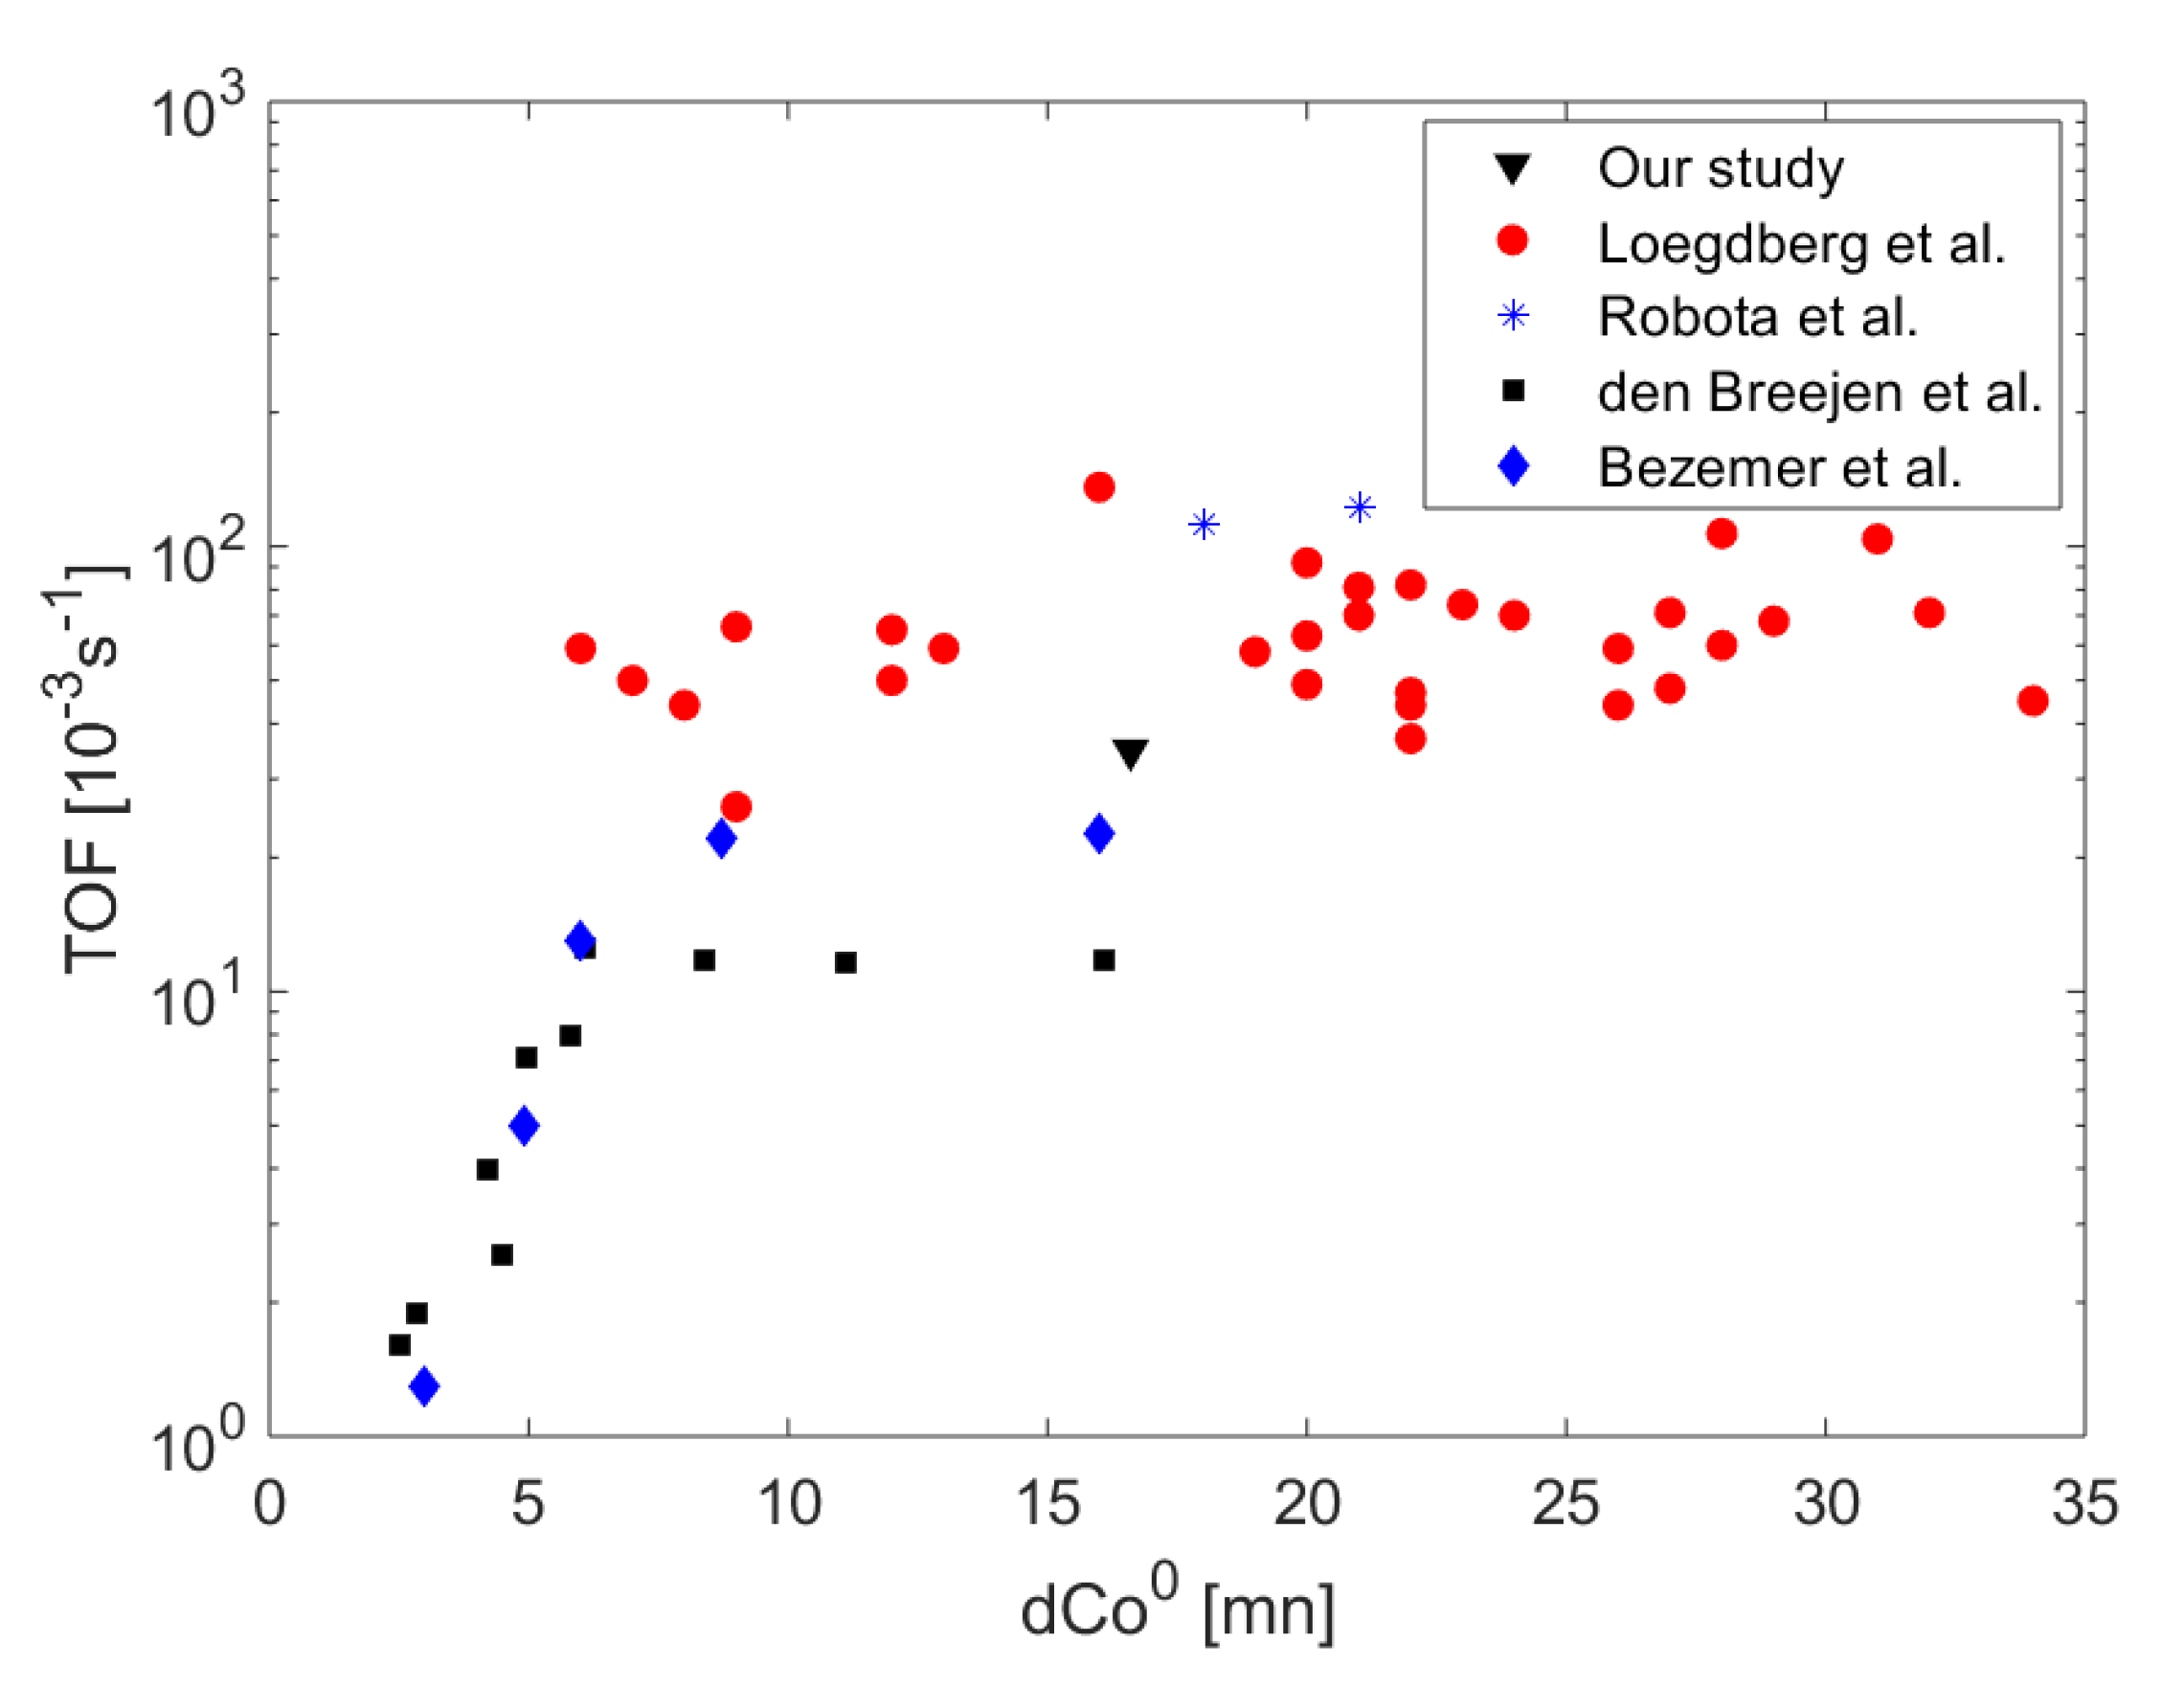
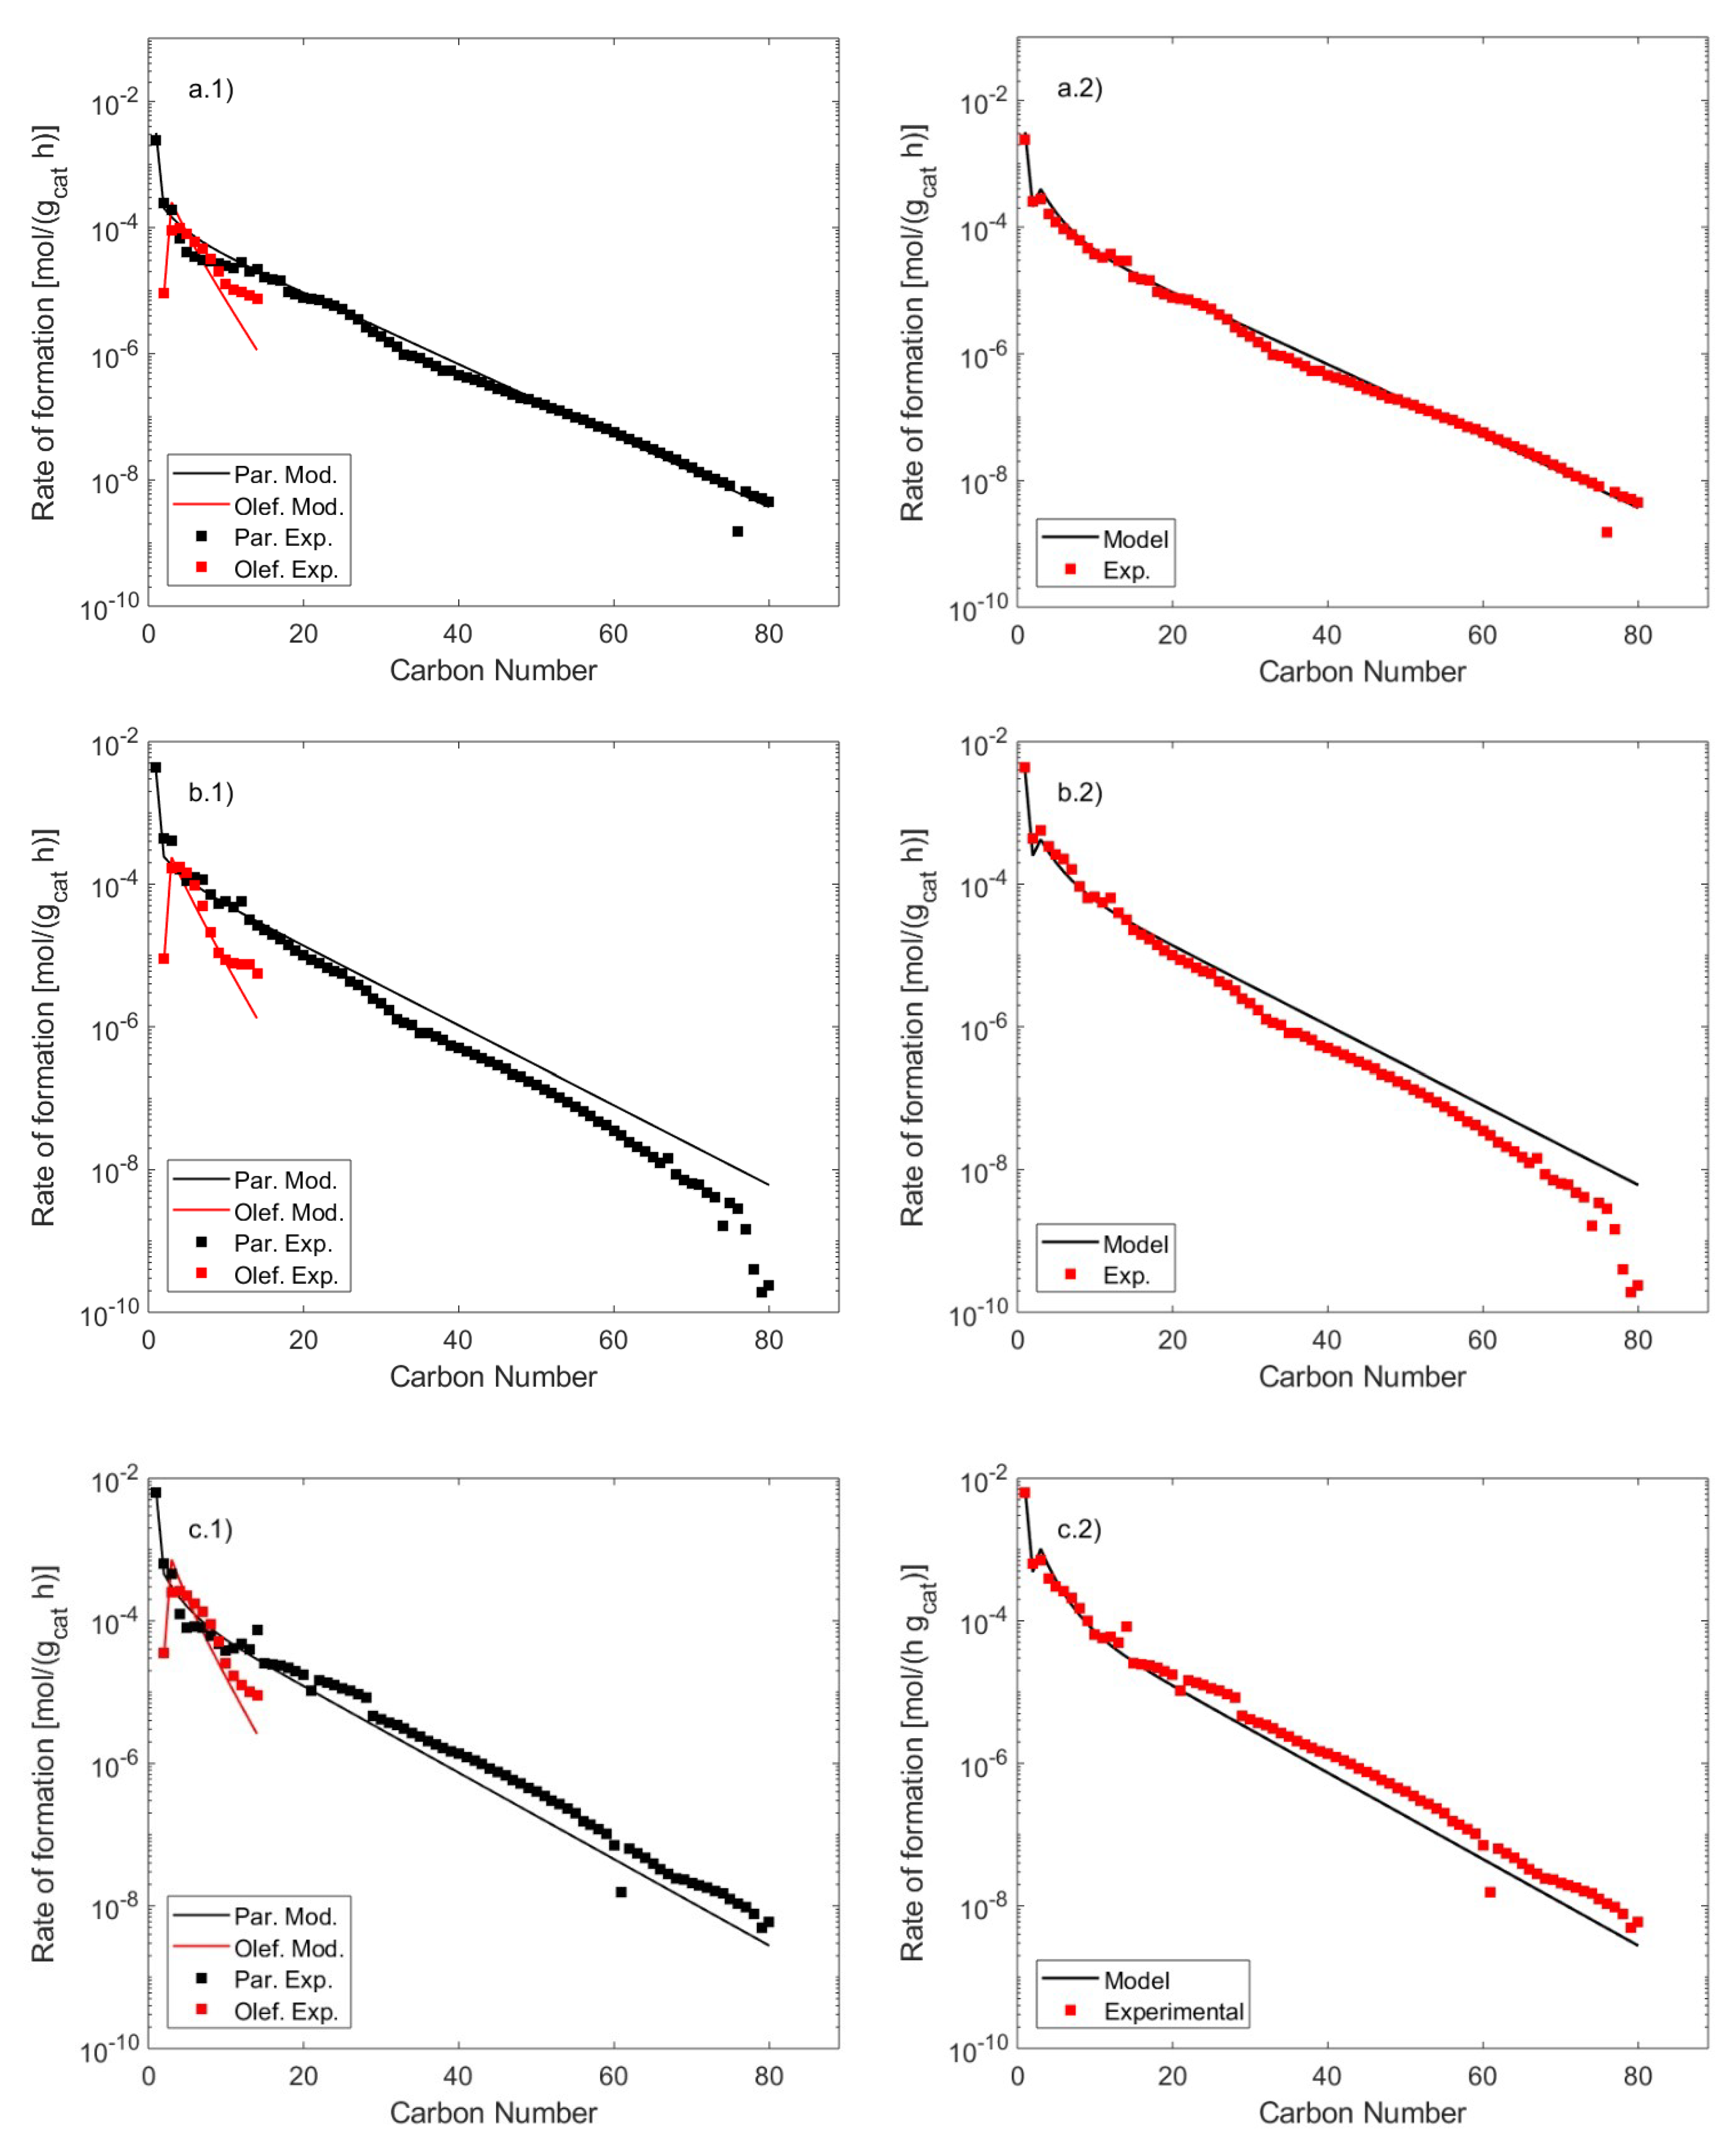
| Catalyst | 21%Co 0.2%Pt/γ-Al2O3 |
|---|---|
| Dispersion (%) a | 8.2 |
| BET surface area (m2/g) b | 53.5 |
| Average pore diameter (nm) | 11.7 |
| Pore volume (cm3/g) | 0.15 |
| d(Co0) c (nm) | 16.6 |
| d(Co3O4) d (nm) | 17.5 |
| Reaction | Reaction Step | Constant Parameter |
|---|---|---|
| 0 | H2 + 2* ↔ 2H* | KH |
| 1 rds | CO + H* ↔ H*CO | kCO |
| CO + CnH2n+1* ↔ Cn+1OH2n+1* | ||
| 2 | H*CO + H* ↔ CH* + OH* | K1 |
| Cn+1OH2n+1* + H* ↔ CnH2n−1* + OH* | ||
| 3 | CnH2n−1* + H* ↔ CnH2n* + * | K2 |
| 4 | CnH2n* + H* ↔ CnH2n+1* + * | K3 |
| 5 | OH* + H* ↔ H2O + 2* | K4 |
| 6 rds | CH3* + H2 → CH4 + H* | kMeth |
| CnH2n+1* + H2 → CnH2n+2 + H* | kPar | |
| 7 rds | C2H5* → C2H4 + H* | kEth |
| CnH2n+1* → CnH2n + H* | kOl |
| Parameter | Unit | tvalue | Parameter | Unit | tvalue | Lit. Range | ||
|---|---|---|---|---|---|---|---|---|
| AH | 1.83 × 10⁻² | MPa−1 | 88.8 | ΔHH | −5.97 | kJ/mol | 133.8 | −2.1/−25 [24,39,53] |
| ACO | 9.11 × 10⁷ | mol·(h gcat MPa) −1 | 139.3 | ECO | 82.39 | kJ/mol | 756.4 | 80/120 [17,24,54] |
| APar | 1.02 × 10⁸ | mol·(h gcat MPa) −1 | 58.7 | EPar | 93.65 | kJ/mol | 767.9 | 60/100 [24,39] |
| AMeth | 5.57 × 10⁸ | mol·(h gcat MPa) −1 | 94.1 | EMeth | 89.97 | kJ/mol | 138.9 | 60/100 [24,39] |
| AOl | 6.27 × 10⁸ | mol·(h gcat) −1 | 739.6 | EOl | 95.24 | kJ/mol | 565.4 | 90/130 [24,32] |
| AEth | 8.63 × 10⁸ | mol·(h gcat) −1 | 3.2 | EEth | 112.82 | kJ/mol | 112.7 | 90/130 [24,32] |
| ΔE | 1.249 | kJ/mol(CHx) | 32.7 | 1.1/2.15 [17,38] | ||||
| A1 | 1.84 × 10² | - | 36.1 | ΔH1 | 27.98 | kJ/mol | 249.3 | - |
| A2 | 7.77 × 10² | - | 71.9 | ΔH2 | 37.00 | kJ/mol | 323.1 | - |
| A3 | 9.02 × 10³ | - | 35.3 | ΔH3 | 9.60 | kJ/mol | 82.5 | - |
| A4 | 14.3 | MPa | 105.7 | ΔH4 | 13.39 | kJ/mol | 194.3 | - |
| Temp. | Pres. | H2 | CO | N2 | H2/CO | XCO | WHSV |
|---|---|---|---|---|---|---|---|
| [K] | [bar,a] | [mol %] | [mol %] | [mol %] | [mol %] | [mol %] | [mlN/(min gcat)] |
| 478 | 30 | 54% | 26% | 20% | 2.08 | 6.87 | 188.9 |
| 488 | 15 | 63% | 30% | 7% | 2.10 | 8.33 | 285.7 |
| 498 | 30 | 40% | 36% | 24% | 1.11 | 8.50 | 475.0 |
| 503 | 15 | 50% | 25% | 25% | 2.00 | 8.60 | 720.0 |
| 488 | 25 | 60% | 30% | 10% | 2.00 | 8.76 | 400.0 |
| 488 | 25 | 45% | 36% | 19% | 1.25 | 8.88 | 322.2 |
| 493 | 20 | 33% | 31% | 36% | 1.06 | 9.53 | 606.1 |
| 493 | 25 | 65% | 31% | 4% | 2.10 | 9.53 | 146.2 |
| 498 | 25 | 58% | 28% | 14% | 2.07 | 10.05 | 682.8 |
| 482 | 20 | 50% | 24% | 26% | 2.08 | 10.22 | 370.0 |
| 488 | 30 | 51% | 25% | 24% | 2.04 | 10.67 | 205.8 |
| 483 | 25 | 60% | 30% | 10% | 2.00 | 10.98 | 166.7 |
| 483 | 30 | 51% | 25% | 24% | 2.04 | 11.35 | 196.1 |
| 483 | 20 | 46% | 22% | 32% | 2.09 | 12.03 | 304.4 |
| 488 | 21 | 59% | 28% | 13% | 2.11 | 12.42 | 177.9 |
| Reaction | Paraffins Formation (n ≥ 1) | Olefin Formation (n ≥ 2) |
|---|---|---|
| CO | −n | −n |
| H2 | −(2n+1) | −(2n) |
| CnH2n+2 | 1 | 0 |
| CnH2n | 0 | 1 |
| H2O | n | n |
© 2019 by the authors. Licensee MDPI, Basel, Switzerland. This article is an open access article distributed under the terms and conditions of the Creative Commons Attribution (CC BY) license (http://creativecommons.org/licenses/by/4.0/).
Share and Cite
Marchese, M.; Heikkinen, N.; Giglio, E.; Lanzini, A.; Lehtonen, J.; Reinikainen, M. Kinetic Study Based on the Carbide Mechanism of a Co-Pt/γ-Al2O3 Fischer–Tropsch Catalyst Tested in a Laboratory-Scale Tubular Reactor. Catalysts 2019, 9, 717. https://doi.org/10.3390/catal9090717
Marchese M, Heikkinen N, Giglio E, Lanzini A, Lehtonen J, Reinikainen M. Kinetic Study Based on the Carbide Mechanism of a Co-Pt/γ-Al2O3 Fischer–Tropsch Catalyst Tested in a Laboratory-Scale Tubular Reactor. Catalysts. 2019; 9(9):717. https://doi.org/10.3390/catal9090717
Chicago/Turabian StyleMarchese, Marco, Niko Heikkinen, Emanuele Giglio, Andrea Lanzini, Juha Lehtonen, and Matti Reinikainen. 2019. "Kinetic Study Based on the Carbide Mechanism of a Co-Pt/γ-Al2O3 Fischer–Tropsch Catalyst Tested in a Laboratory-Scale Tubular Reactor" Catalysts 9, no. 9: 717. https://doi.org/10.3390/catal9090717
APA StyleMarchese, M., Heikkinen, N., Giglio, E., Lanzini, A., Lehtonen, J., & Reinikainen, M. (2019). Kinetic Study Based on the Carbide Mechanism of a Co-Pt/γ-Al2O3 Fischer–Tropsch Catalyst Tested in a Laboratory-Scale Tubular Reactor. Catalysts, 9(9), 717. https://doi.org/10.3390/catal9090717


