Article

An External Energy Independent WO3/MoCl5 Nano-Sized Catalyst for the Superior Degradation of Crystal Violet and Rhodamine B Dye

Department of Chemistry and Biology, KSA of KAIST, 105-47, Baegyanggwanmun-ro, Busanjin-gu, Busan 47162, Korea
*
Author to whom correspondence should be addressed.
Catalysts 2019, 9(8), 642; https://doi.org/10.3390/catal9080642
Submission received: 6 July 2019 / Revised: 21 July 2019 / Accepted: 26 July 2019 / Published: 27 July 2019
(This article belongs to the Special Issue Environmental Catalysis for Water Remediation)

Abstract

:
In this study, the synthesis of a novel catalyst WO3/MoCl5 was carried out by the thermal method. The method gave an entirely different product compared to previous studies that doped Mo on the surface of semiconductor metal oxides. The degradation reaction of crystal violet (CV) and rhodamine B (RB) dye were done without any energy source. The results showed an incomparably superior result for degradation, with a reaction rate constant of 1.74 s−1 for 30 ppm CV, 1.08 s−1 for 30 ppm RB, and a higher value than 1 s−1 for both cases of 50 ppm dye solution. To the author’s knowledge, this catalyst has the highest reaction rate compared to other studies that targeted CV and RB, with an immense reaction rate increase of more than 100 times. Reusability of the three trials was verified, and the only process required was washing the catalyst after the reaction. One of the drawbacks of the advanced oxidation process (AOP), which has a degradation percent limit, has been solved, since 100% mineralization of the dye was available using this catalyst. FT-IR spectroscopy revealed that W-O-Mo linkage was successfully processed while Mo-Cl linkage has retained. 1H-NMR spectroscopy results confirmed that the degradation product of the dye treated by simple MoCl5 and WO3/MoCl5 was different. Deep inspection of specific regions of NMR fields gave necessary information about the degradation product using WO3/MoCl5.

1. Introduction

Due to the heavy usage of organic chemicals, the extensive industrial spoilage has occurred. Throughout aquatic environments. Since a noticeable increase in the disposal of refractory organic materials has the potential for environmental and biological damage and has already severely impacted water quality [1], a novel technology for water treatment has gained significant interest. Dyes in wastewater are proposed to be pollutants that cause considerable environmental damage, including toxicological effects on micro-organisms and color pollution [2,3,4]. Specifically, rhodamine B (RB), which is one of the target compounds in this study, is a dye extensively used in various industries, such as textiles, leather, and food [5]. Nevertheless, RB is also a well-known carcinogen and irritant for the skin, eyes, and respiratory tract. It also possesses reproductive and developmental toxicity and neurotoxicity in humans and animals [6,7,8,9]. Further, crystal violet (CV) has been widely used in veterinary and human medicine as a biological stain, as well as a mutagenic and bacteriostatic agent in medical solutions [10], and is known to have genotoxicity and functions as a carcinogen [11,12,13]. Therefore, various researchers have focused on the development of a method to remove this organic pollutant from the aqueous phase. Adsorption, oxidation, reduction, electrochemical reactions [14,15,16], and many other methods have been considered. Especially in recent years, Advanced Oxidation Processes (AOPs) have been verified to be very promising for organic degradation [17,18,19].
As one of the most effective and widespread AOPs, the Fenton process has distinctive advantages due to its generation and usage of an active hydroxyl radical by simple redox reactions between H2O2 and Fe(II). The Fenton process also requires a low cost and has few environmental risks [20]. Most organic compounds can be degraded into less toxic compounds under ambient temperature and pressure conditions [20,21]. However, due to the difficulty of reusability caused by homogeneous features, a heterogeneous Fenton-like process has been investigated instead of the Fenton process and Fenton-related processes. For instance, iron-free catalysts, including gold [22], copper [23], and manganese [24], were developed for a heterogeneous Fenton-like process in the presence of H2O2. However, such AOPs require additional supplies, such as H2O2, ozone, or an external energy source and need a relatively long time for catalysis. Therefore, a novel mechanism for organic pollutants should be developed to enhance wastewater treatment methods.
WO3 has been widely used as a visible light-response photocatalyst absorbing light at wavelengths up to 480 nm and has intriguing advantages, such as its harmless low cost and stability [25,26,27,28]. MoCl5 is an aggressive oxidant but cannot be recycled [29,30]. Therefore, by combining the semiconductor WO3 and the oxidant, a recyclable oxidant can be constructed.
Herein, a WO3/MoCl5 catalyst was prepared by thermal synthesis and assessed for the oxidative degradation of Crystal Violet (CV) and Rhodamine B (RB) in the aqueous phase. The characterizations of synthesized materials were done using FT-IR, XRD, EDS-SEM, and TEM which all justify the successful linkage between MoCl5 and WO3 and the conservation of basic structures of the metal oxides during synthesis and also after reaction. NMR analysis of degradation products using pristine MoCl5 and the synthesized material also legitimized the difference between simple mixture and the catalysts. The synthesized catalyst showed a prominent degradation efficiency and an incomparably short-term degradation compared to previous studies, without any additional supplies or external energy sources. Additionally, we conducted a series of experiments and analyses on degradation kinetics, such as dark reaction and a radical scavenger reaction, which included reaction and recycling.

2. Results

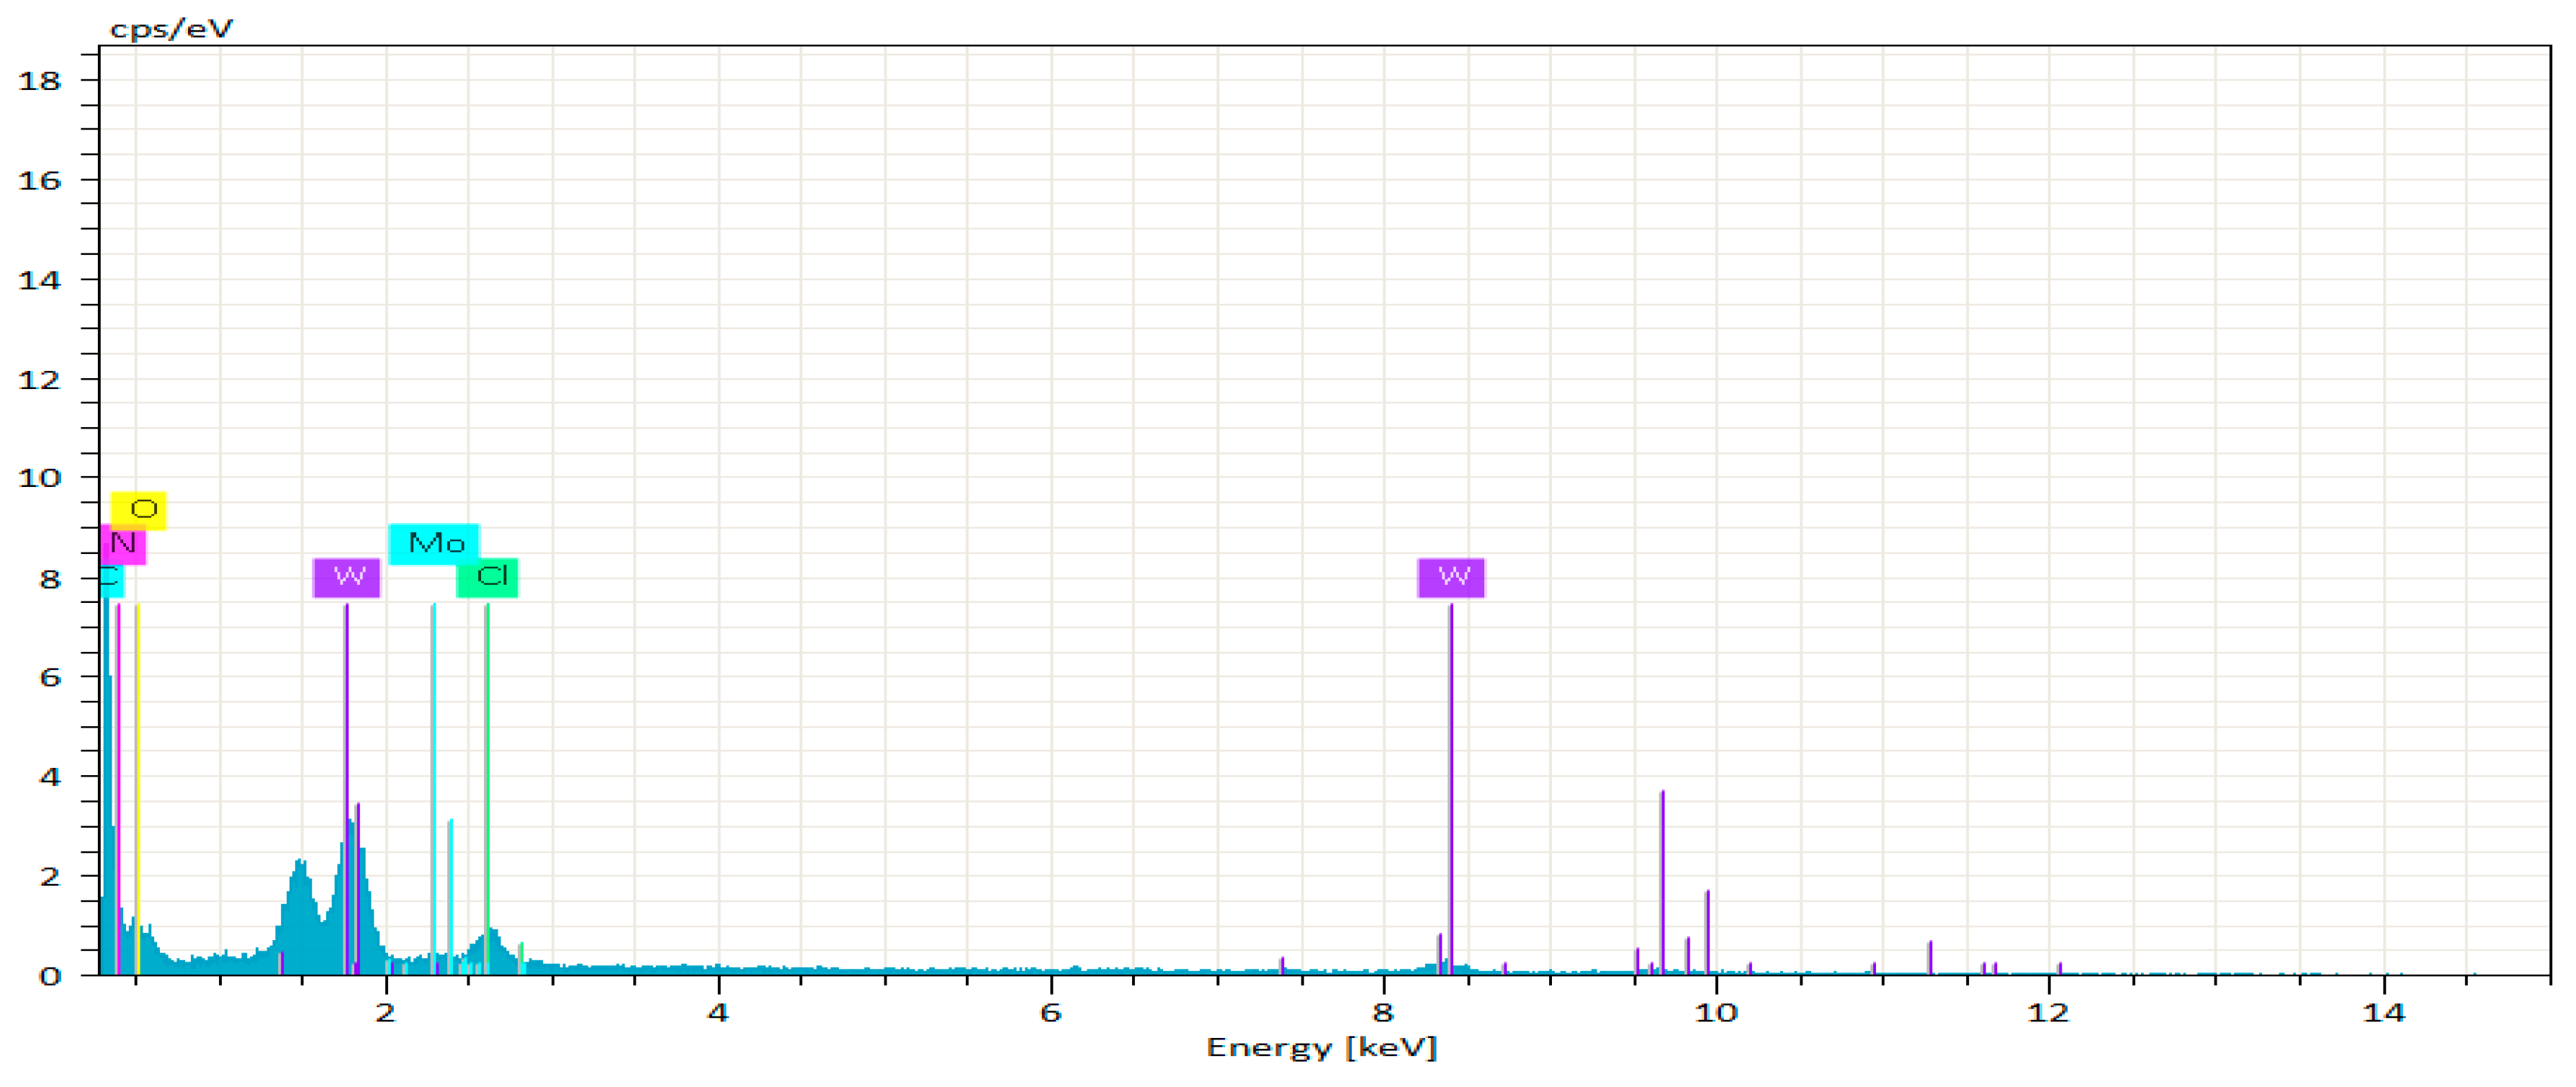
2.1. Morphological and Microstructural Analysis

The morphology of the precursors and MoCl5 linked catalysts was shown by the TEM images in Figure 1. The particle sizes of the precursor and WO3/MoCl5 had high randomness in both shape and size. However, the metal precursor had a greater deviation of size and was typically bigger than the synthesized catalyst. The new particle sizes, which are all in the range of nanoparticles, ranged from 60 to 90 nm. The synthesized Mo-doped catalyst had more blurred and uncertain boundaries than the pristine precursor.
Figure 2 and Table 1 show the result of the EDS analysis of the synthesized catalyst. Figure 2 shows the reflected characteristic K α signals of specific elements, which were used to assign each element deposited on the catalyst surface. Table 1 shows the element proportion of the catalyst on the surface, which was usually composed of Tungsten, Chlorine, Oxygen, and Molybdenum. The coexistence of Mo and Cl on the surface confirmed that MoCl5 was linked to Tungsten oxide. To exclude the probability of small remnants of MoCl5 effecting the EDS result, the synthesized catalysts were washed with toluene until the proportion of Mo and Cl reversed. A high percentage of nitrogen on the surface was due to adsorbed N2 gas. The absence of carbon in the surface assures that there were no remaining residuals, such as 1,1,3,3-Tetramethylguanidine (TMG) and other precursors. TMG was used in the synthesizing procedure to deprotonate the WO3 precursor. The EDS analysis result shows that the precursor had been totally washed away by toluene. In summary, MoCl5 successfully made a conjunction with tungsten oxide.

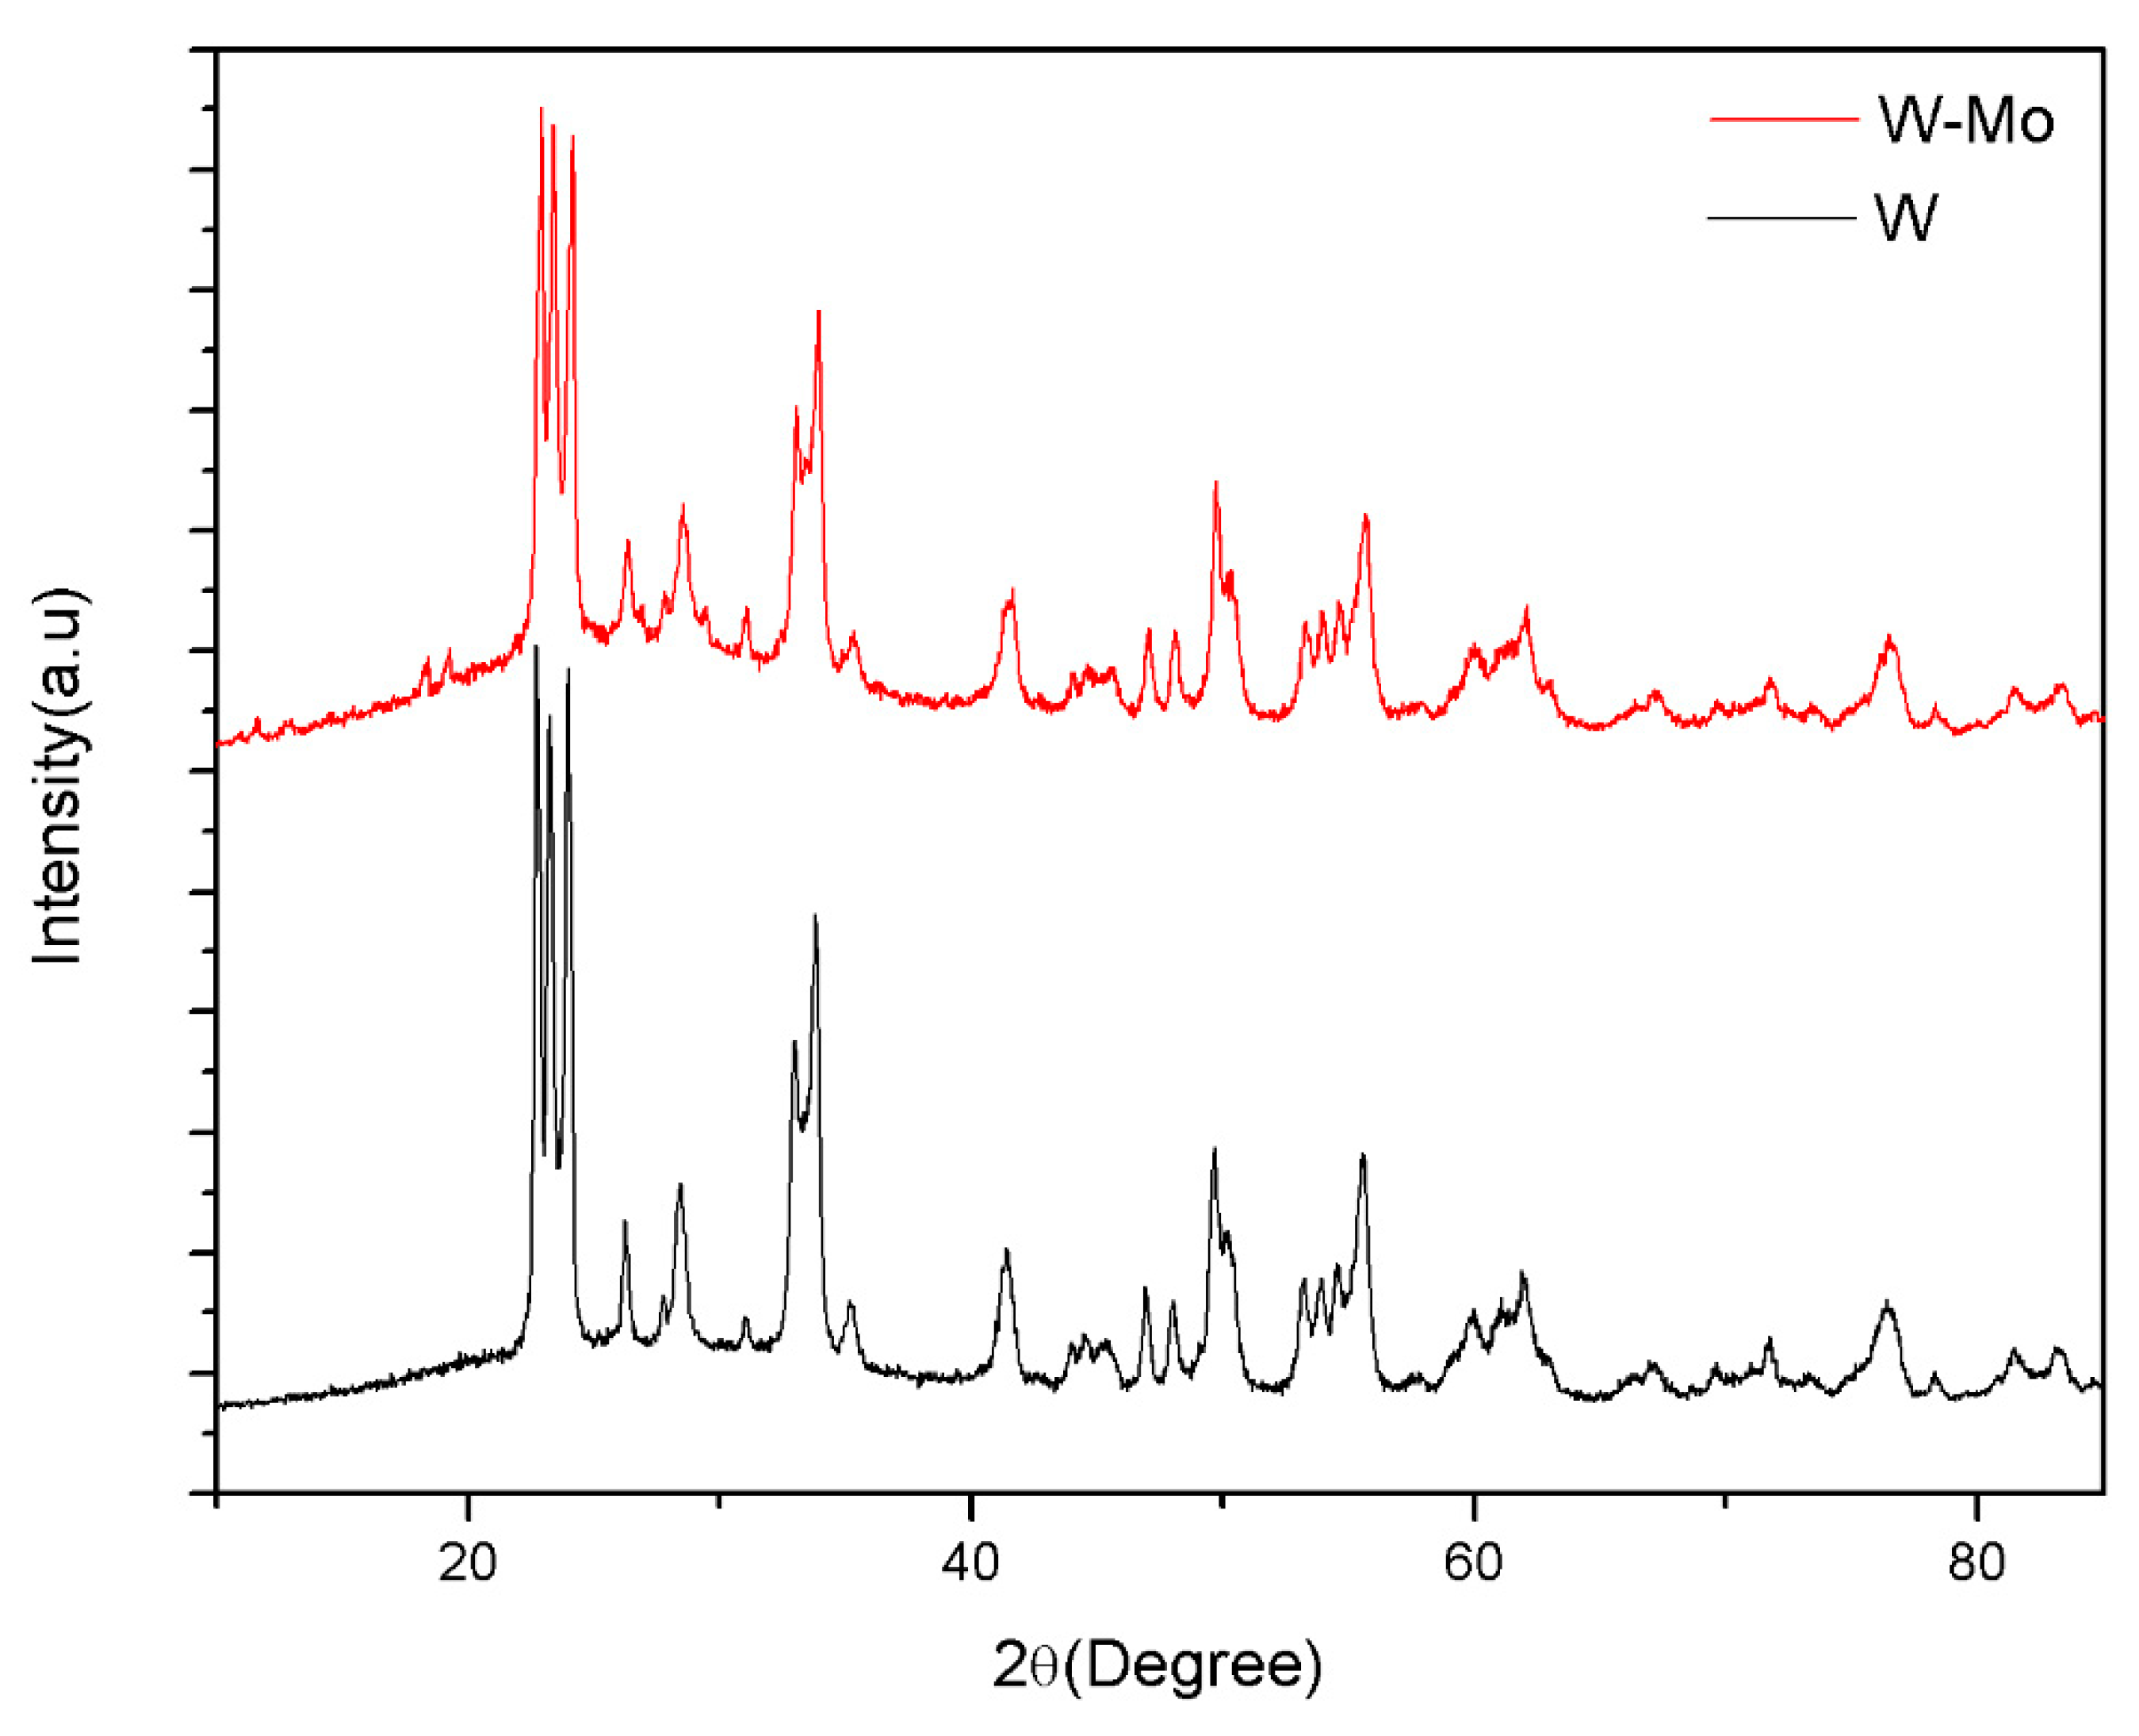
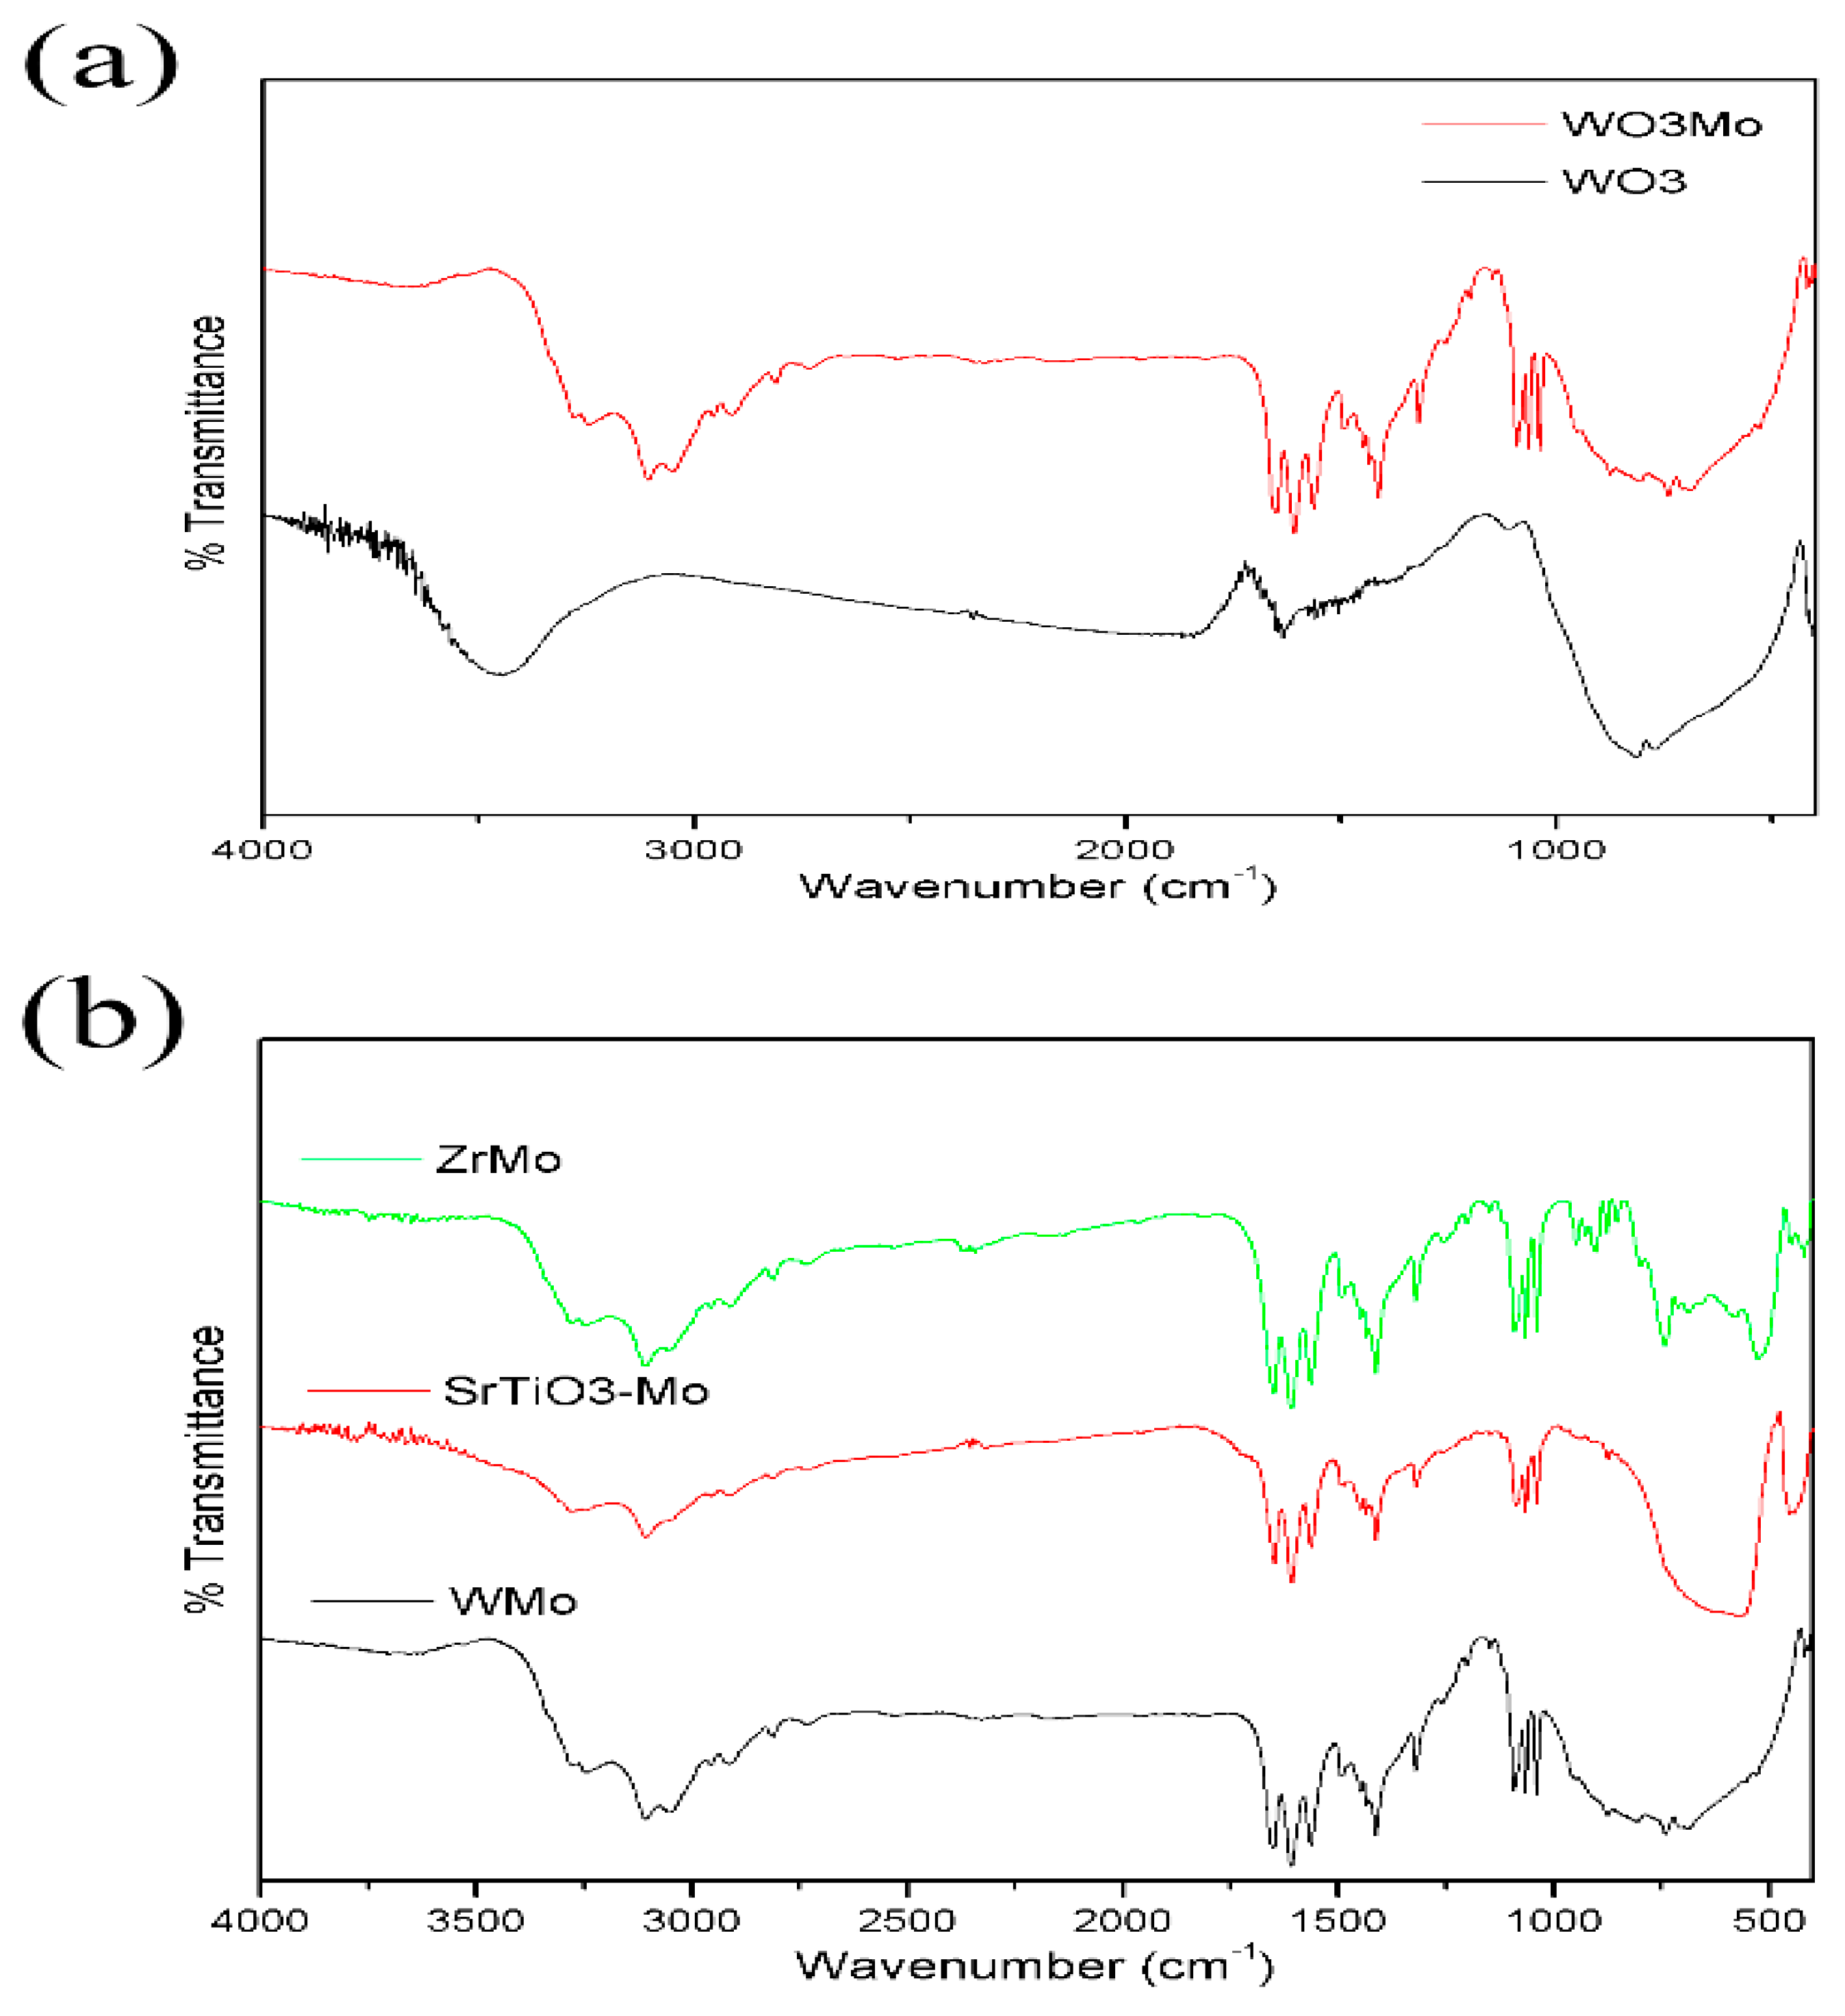
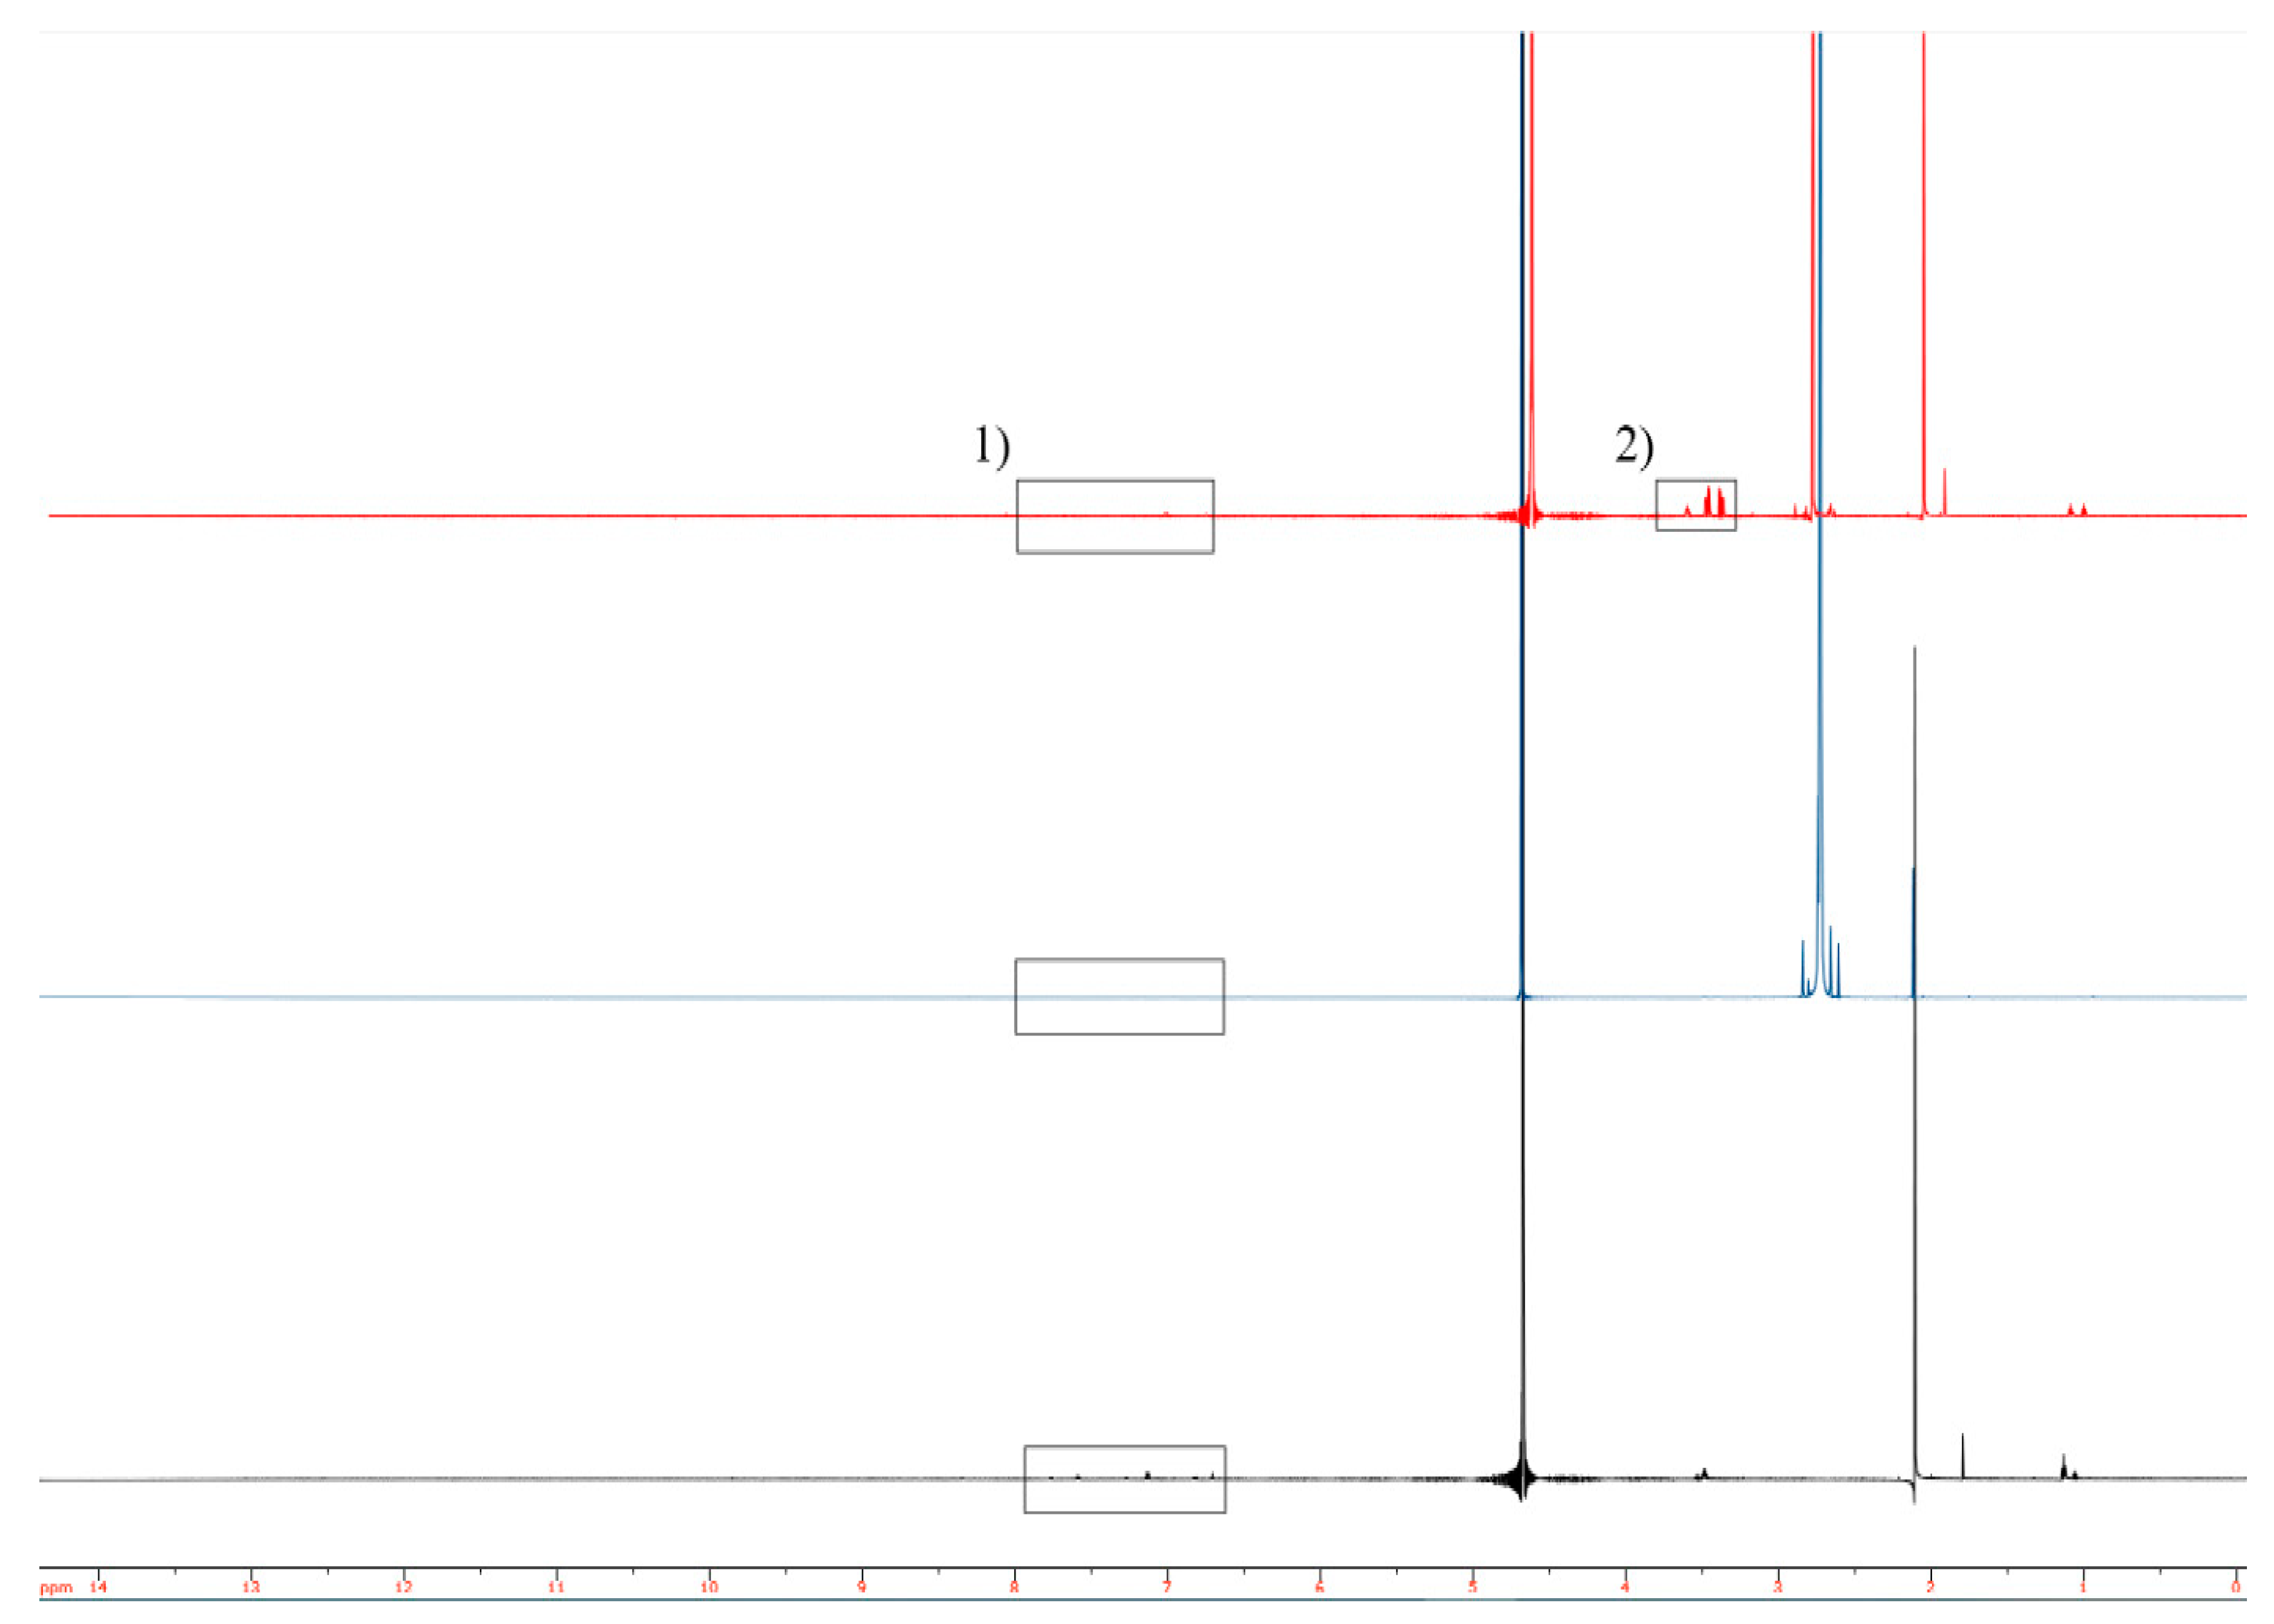
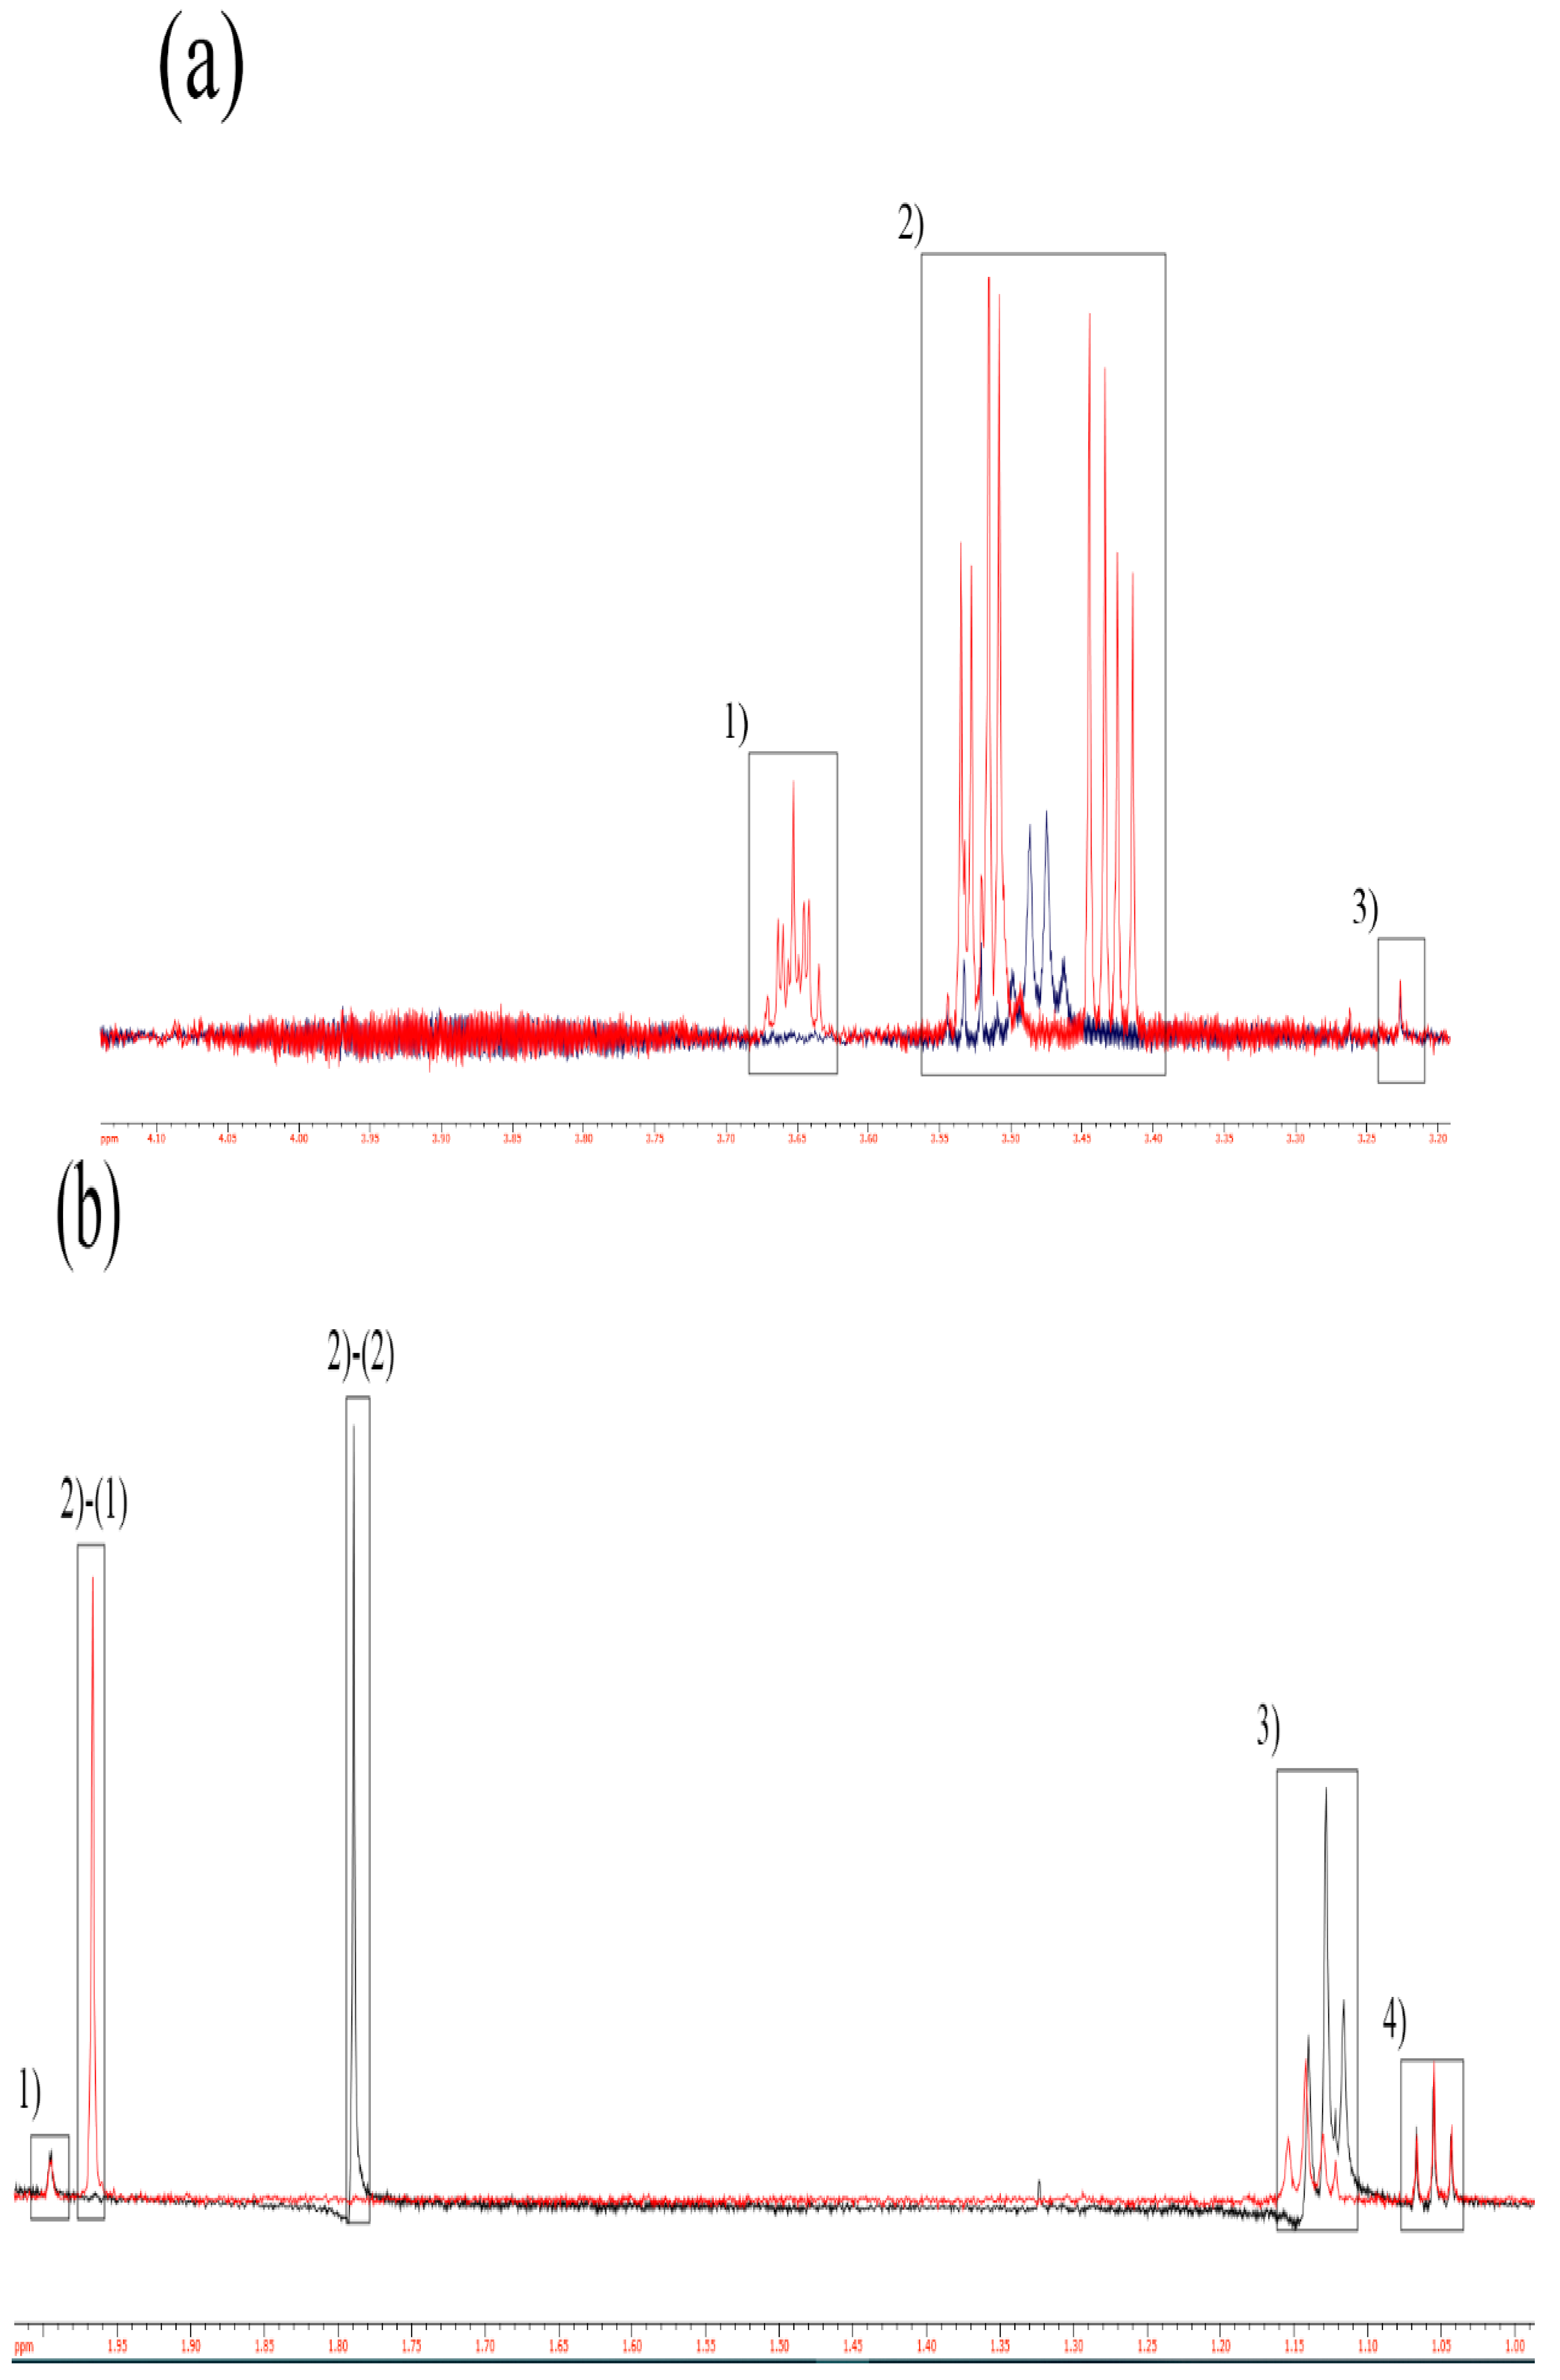
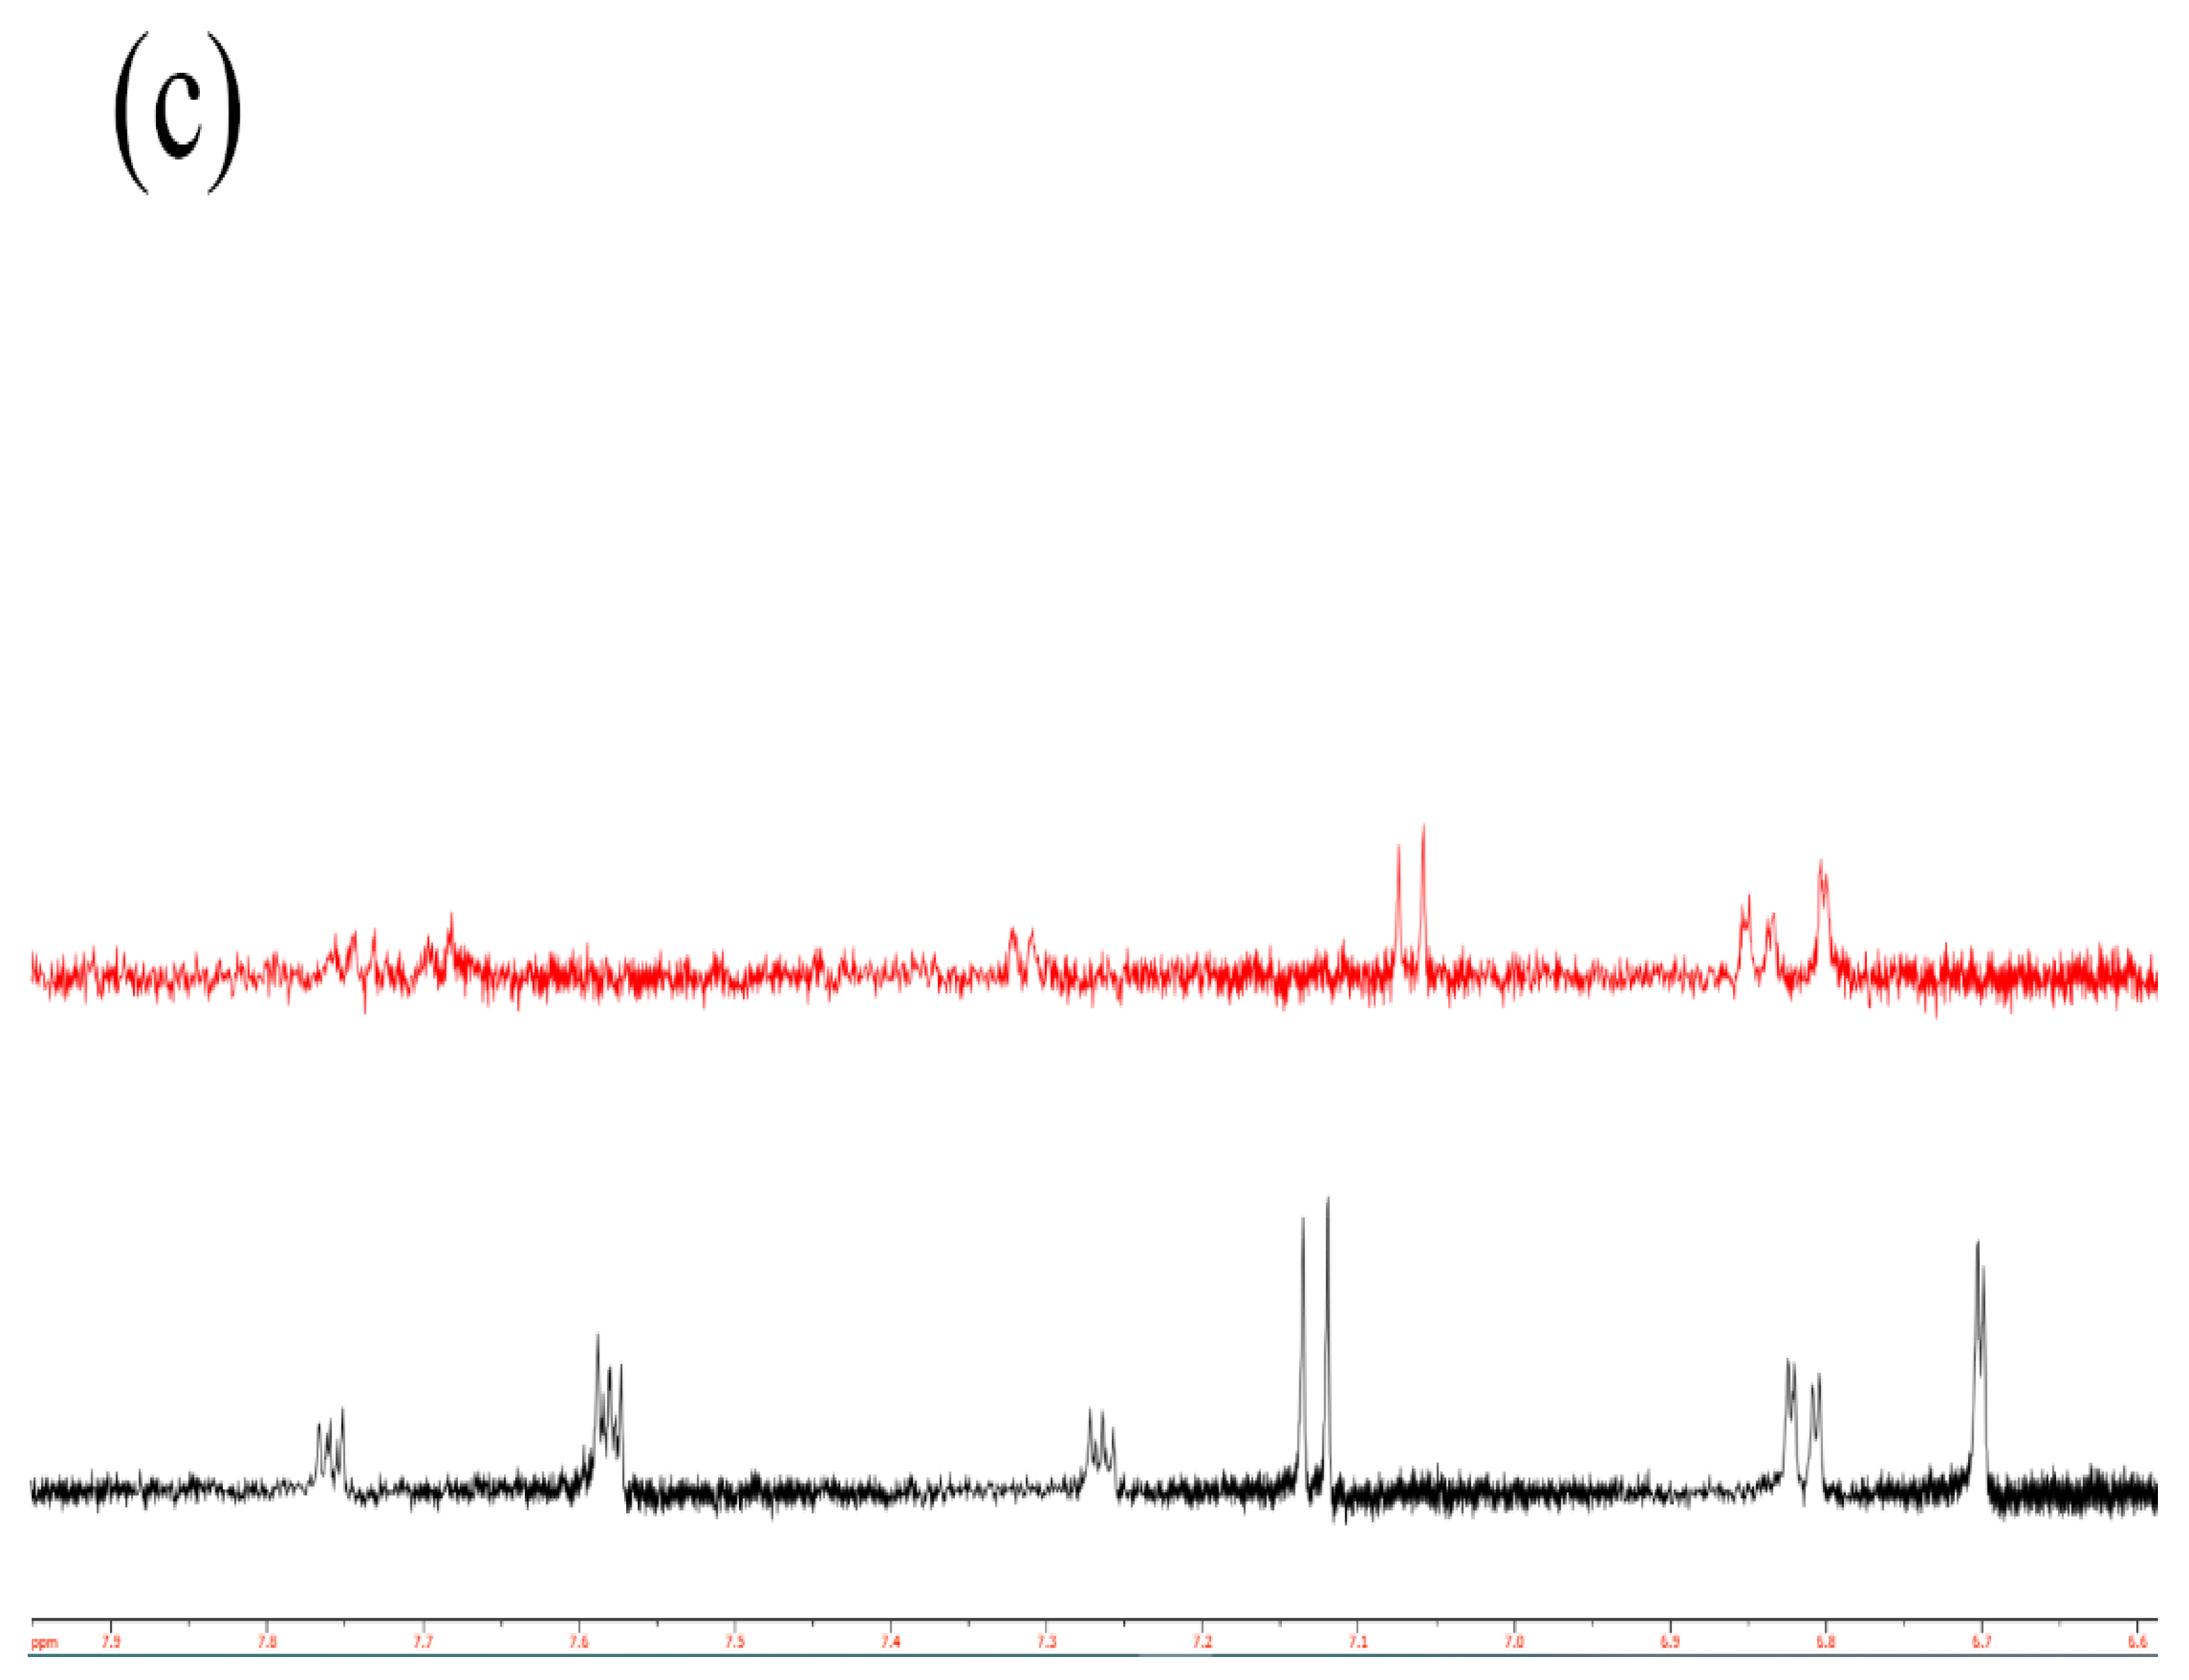
2.2. Structural Analysis

The XRD pattern of WO3 was assigned via JCPDS No. 75-2072. At   2 θ = 17 ~ 19 ° , the calculated characteristic peak of the orthorhombic structure of MoCl5 newly appears, indicating that the total MoCl5 is linked to the original structure of the metal precursors. This result matches well with the EDS result, showing the existence of Mo and Cl on the surface of the catalyst. Peak broadening and intensity decreasing were induced by the MoCl5 linking on the crystalline structure of WO3.
The infrared spectra of WO3 and WO3/MoCl5 are shown in Figure 3. The infrared spectra of the previously synthesized and published ZrO2/MoCl5 and SrTiO3/MoCl5 particles are compared in Figure 3 with WO3/MoCl5 spectra to support the IR peak assignation. For WO3, the broad peak observed in the regions of 3600–3400 cm−1 and 1600 cm−1 are attributable to the presence of hydroxyl groups bonded to the metal at the surface [31]. These signals are no longer visible at the spectra of the synthesized catalysts, which implies that the hydroxyl groups have first been deprotonated by the basicity of TMG and then formed a new Mo-O-W bond during the synthesis. A peak at 975 cm−1 and weak signals at 565 cm−1 and 450 cm−1 are suspected to be evidence for the successful MoCl5 linkage. The primary peak (975 cm−1) indicates the stretching vibration mode of the bond of Mo-O-Metal [32]. The rest signals result from the Mo-O bond (565 cm−1) and Mo-Cl bond (450 cm−1), respectively [32,33]. These analyses rationalize the formation of the bond between Mo and O and the remaining of Mo-Cl bond, which is conclusive evidence that Molybdenum linked to the metal precursor, retaining its linkage to Cl. All of the peaks are common among WO3/MoCl5, ZrO2/MoCl5, and SrTiO3/MoCl5, which suggests that the assignments are replicable and, therefore, plausible.
Other newly formed familiar peaks of the synthesized catalysts are broad bands at the 3000–3400 cm−1 region, with noticeable peaks at around 1600, 1032, 1065, and 1083 cm−1 (Figure 4). These peaks are assigned to the adsorbed TMG FT-IR spectrum via the SDBS No. 10085 file. The existence of TMG peaks is acceptable because the synthesized catalyst was not washed by toluene, unless it produces new peaks or shifts preexisting peaks. The specified signals of the spectra are assigned for each characteristic vibration by a comparison between the precursor and the Mo-doped metal oxide. Standard signals in the WO3 and WO3/MoCl5 ranges at 1048 and 984 cm−1 correspond to the W-O and W=O bonds, respectively [34]. The natural metal oxide and MoCl5 linked metal oxide showed identical signals with respect of the characteristic W-O bond. This result substantiates that the doping of Molybdenum occurred without modifying the structures of the precursors.

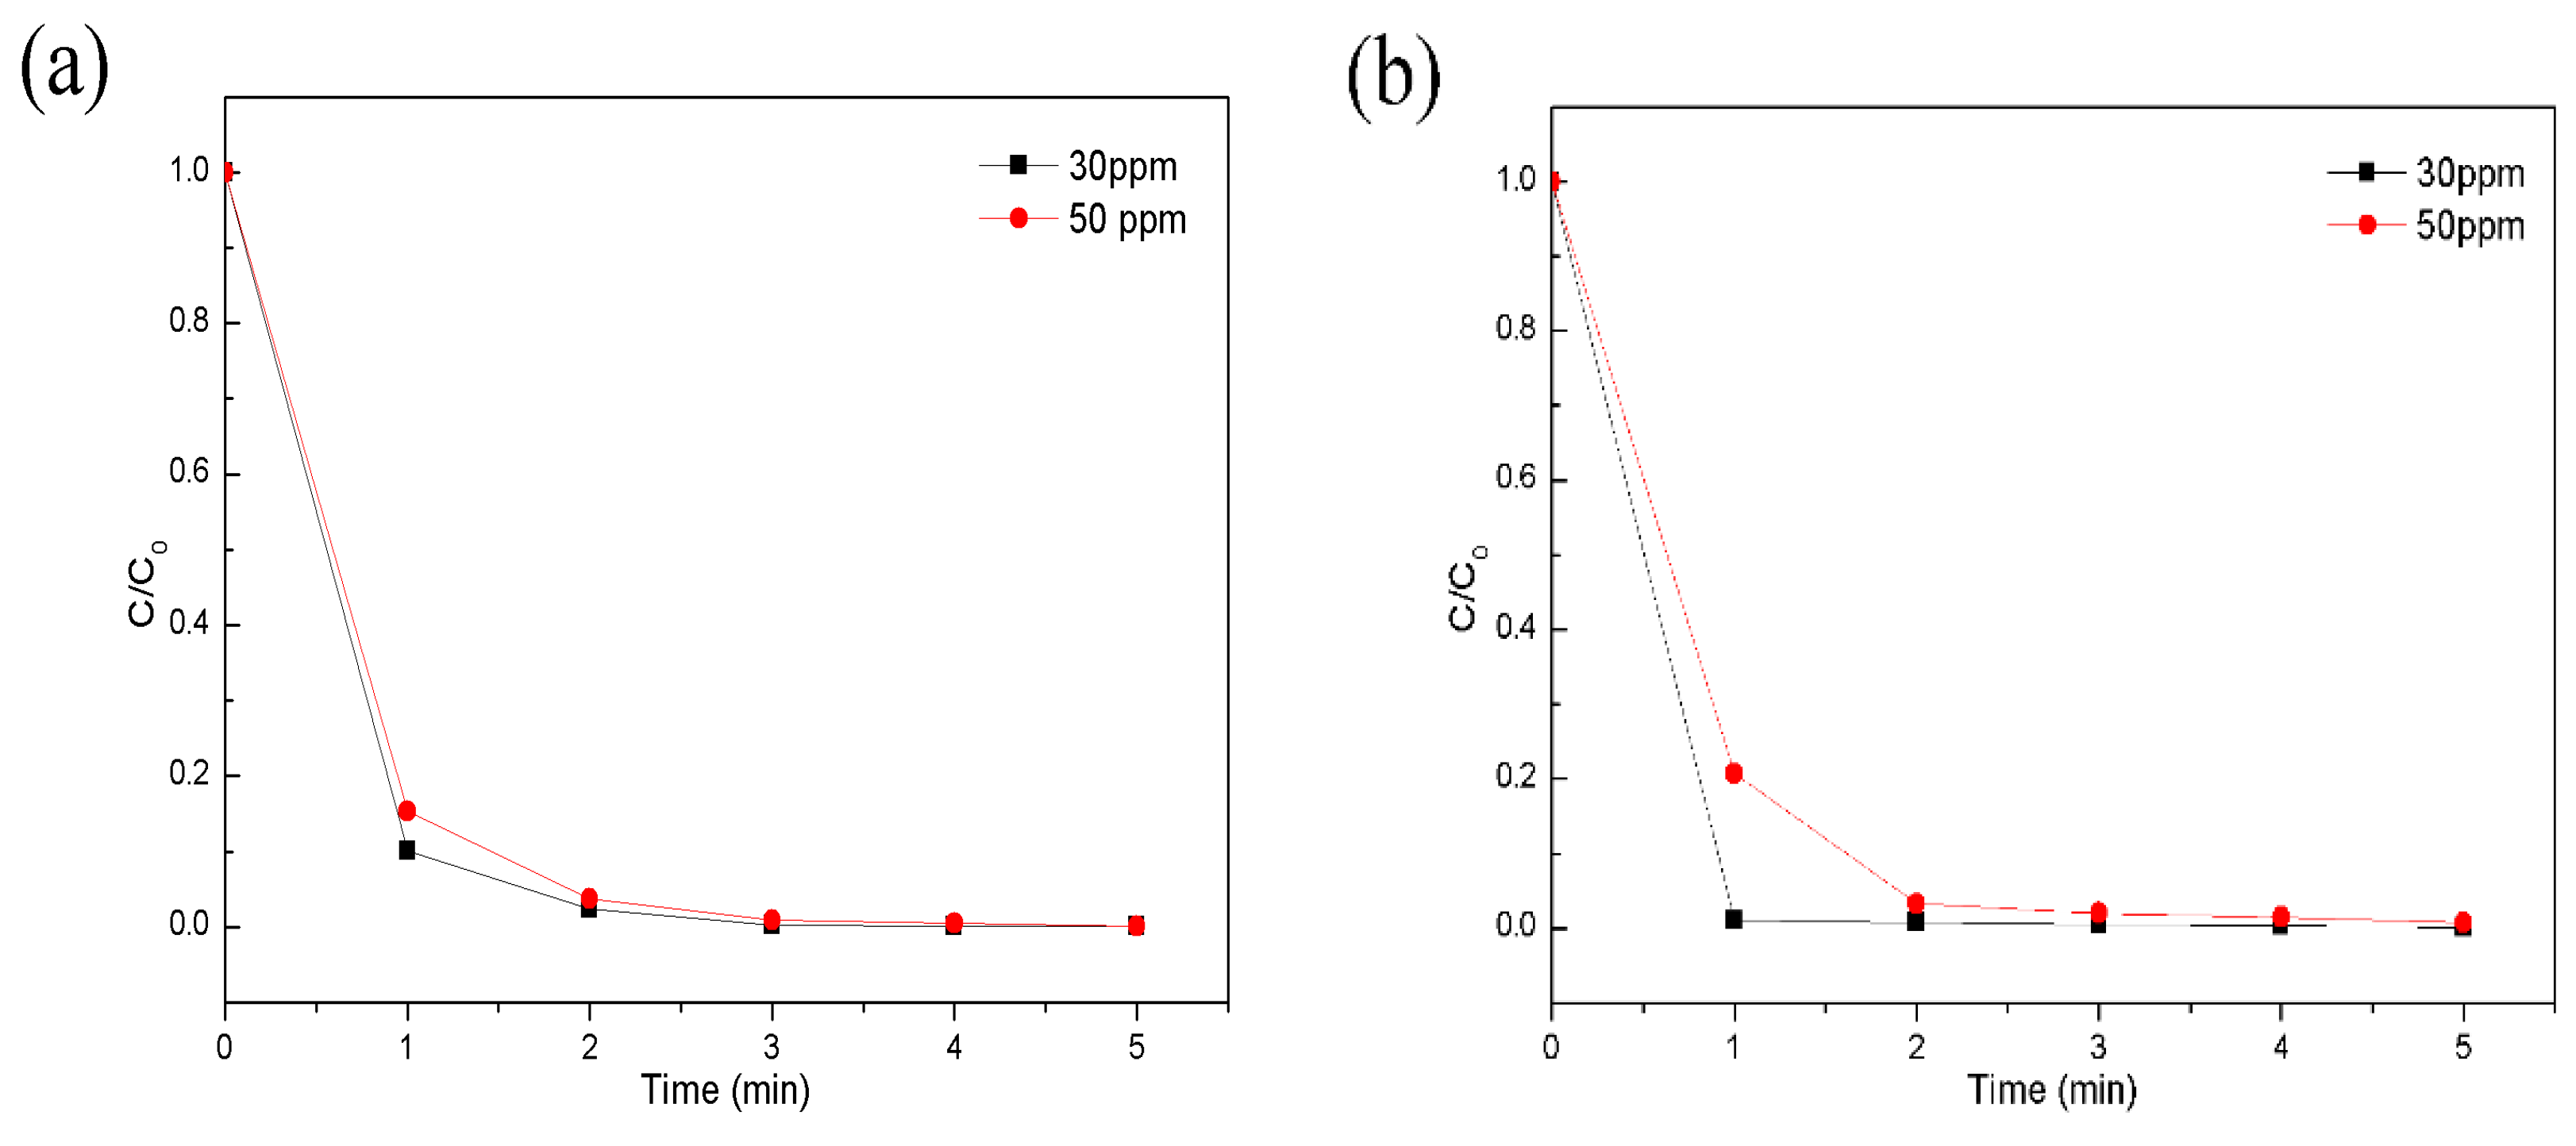
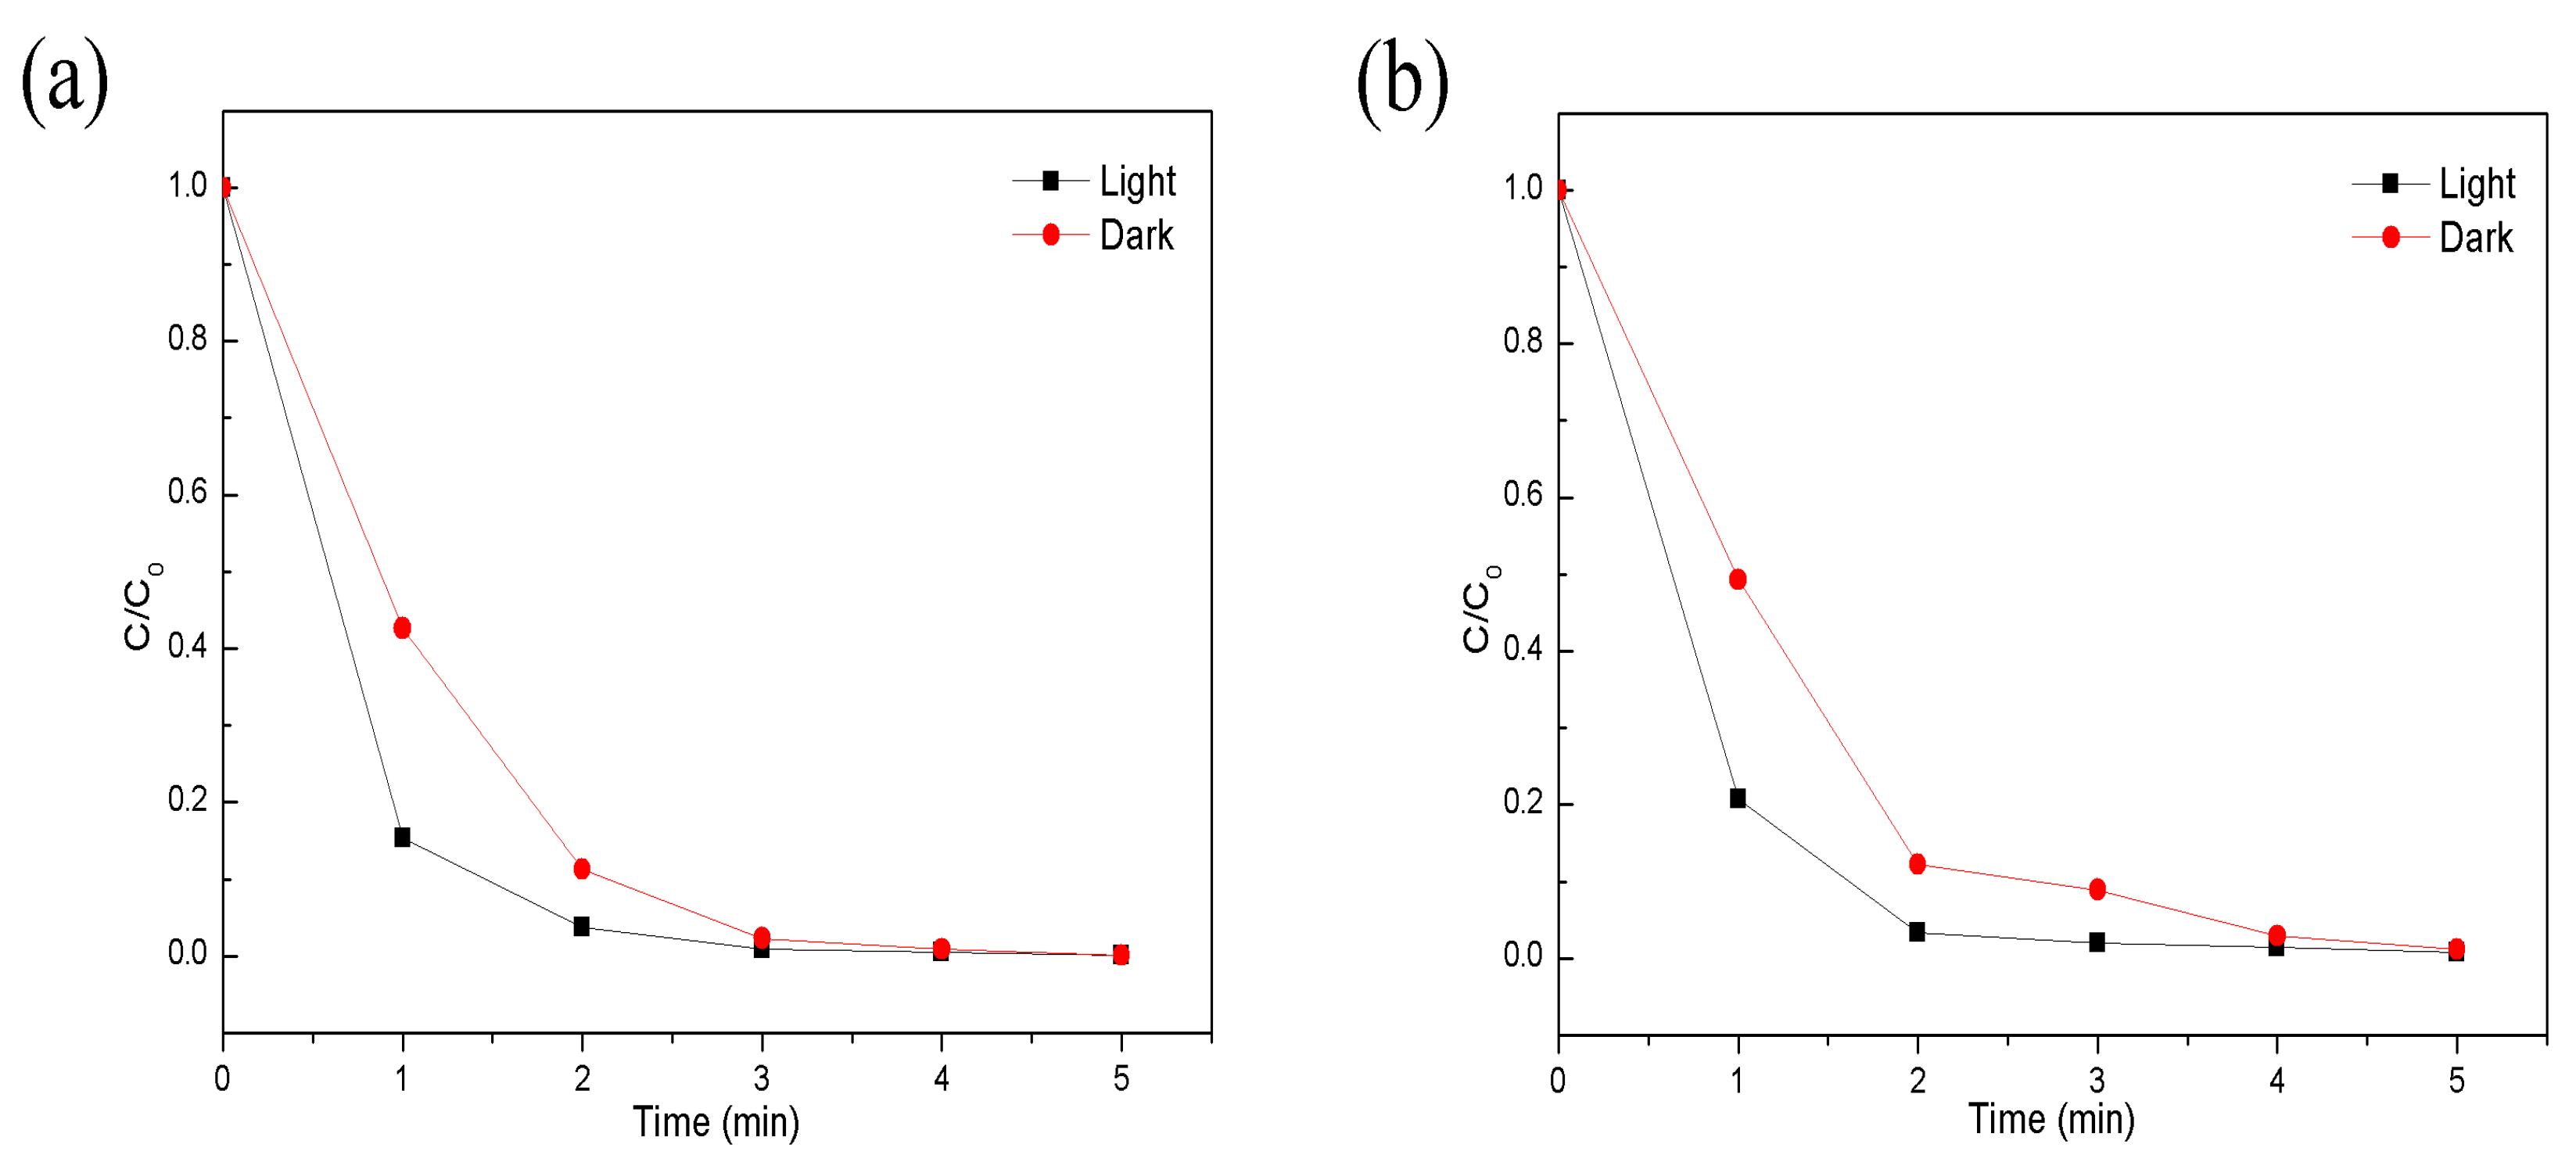
2.3. Catalytic Study

Figure 5 shows the catalytic results of CV and RB using synthesized catalysts under normal light conditions. The only light energy that the reaction could gain was from a fluorescent lamp located at the ceiling to brighten the laboratory. This light is almost negligible.
The reaction was conducted to degrade 30 ppm and 50 ppm of the dyes, which is a high concentration compared to other studies about CV and RB degradation [35,36,37,38,39,40,41]. Trials with 10 ppm and 20 ppm were unable to be analyzed since all of the degradations were done within a minute, and observing the concentration for each shorter time interval was too risky from the perspective of accuracy. Even though 30 ppm and 50 ppm of dyes required three to five minutes to degrade fully, at least 80% of the dyes were degraded within a minute for all cases. The reaction rate constant was 1.74/s (104.4/min) in the case of the 30 ppm crystal violet, which is the highest to the author’s knowledge. RB degrading studies done by Yao W. et al., Wilke K. et al., and Wei B.X. et al. showed a degradation rate constant of 1.3/min using Ag3PO4/TiO2 nanoparticles, 1.1/min using Cr3+ doped TiO2, and 0.6/min using ZrO2-coated TiO2, respectively [35,36,37,41]. CV degrading studies done by Sahoo C. et al., Ameen, S. et al., and Sajid, M. et al. showed a degradation rate constant of 0.83/min using Ag doped TiO2, 1.25/min using flower shaped ZnO nanoparticles, and 1.12/min using BiVO4/FeVO4 nanoparticles, respectively [38,39,40]. Other degradation coefficients of this study are summarized in Table 2. One of the drawbacks of AOPs was that the majority of the case reached their equilibrium limit in degradation, and only a rare case of treatment could give total degradation. Examples of degradation reactions reaching their equilibrium limits include studies done by Catala et al. (degrading mixture of drugs, 70% removal, 6 h using silica supported iron nanoparticles), Chong et al. (degrading Diclofenac 20 ppm, 85.2% removal, 40 min using Fe doped CeO2), and Jaafarzadeh et al. (degrading Tetracycline 20 pppm, 44.8% removal, 180 min using nano carbon and Fe3O4) [42,43,44]. On the other hand, examples of total degradation include studies done by Arzate et al. (100% degradation of 30 ppm diclofenac after 90 min using an Fe2O3 catalyst with 500 W/m2 light intensity) and Bobu et al. (100% degradation of 0.15 mM ciprofloxacin after 30 min using Fe-clay nanocomposites with a 125 W lamp) [45,46]. However, the newly synthesized catalysts were both extremely fast and could eliminate the dye in solution.
Comparative studies on the perspective of catalytic activity were done with WO3 nanoparticles to emphasize the change after linking MoCl5 to a pristine metal oxide. A 100 mJ laser pulse induced degradation of C.I. Acid Red 87 (25 ppm), using WO3 catalysts, in a study Qamar M. et al., which showed a 20/min degradation rate [47]. Another laser induced degradation of Safranin-O (20 ppm), using nanocrystalline WO3, was done by Hayat K. et al., who a showed 10/min degradation rate when the laser was used, and showed a 1.2 min degradation rate when no other energy was given to the reaction [48]. Other studies using only natural WO3 as a catalyst without an energy source were unable to be found, which is natural since WO3 is a semiconductor, which needs external energy to excite their electrons. This comparative study with pure WO3 and WO3/MoCl5 restated the effect of linking MoCl5 to WO3, especially considering other studies that showed lower reaction rates than the reaction rate of the new catalyst of this study, even after using high energy laser sources.
After being added to the catalysts, the dye solution showed an instant color change for both dyes. In the case of Rhodamine B, the original pink color changed to purple, and the purple crystal violet solution changed to yellow. Related to the fact that the crystal violet changed its color in acidic condition, we used a pH meter to check the pH of each solution after adding the catalyst. The pH value was measured straightaway after adding the catalyst to the dye solution, while the solution color remained purple and yellow for RB and CV, respectively. Both of the solutions had a pH value of 0.5–1.0, which is extremely acidic. This result suggests that new material different from separate MoCl5 and WO3 was synthesized. A color change of RB, which is not an indicator, may be attributed to a difference in the optical properties of the pure RB and the RB-catalyst complex. After 1 min, the color of the solution disappeared totally, as all of the dyes were degraded into colorless molecules.
To preclude the effect of the dim light extant when the normal light reaction occurred, dark condition degradation was also conducted, and the results are shown in Figure 6.
Analyzing the effect of light was done by comparing a 50 ppm concentration solution degradation of both CV and RB. The results showed that more time was needed for the degradation of dyes in the dark condition. Furthermore, the dyes in the dark condition had smaller reaction rate constants compared to those in the normal light condition. Nevertheless, the dye solution was completely decolorized in the dark dark condition after 5 min. This result shows that energy sources in this reaction might provide a difference from kinetic perspective but not from a thermodynamical one, at least for the 50 ppm dye. Additionally, this lag in the time required for total degradation did not affect the prestige of the catalyst, since 5 min is, relatively, 12–30 times shorter than the time for the other catalysts [35,36,37,38,39,40,41].
Table 2 presents pseudo first-order kinetics of the degradation of RB and CV at the normal light condition and the dark condition. The first-order kinetics were calculated by using the equation, ln ( C C 0 ) = k t . C, C0, k, and t represent each concentration at each time, the original concentration, the reaction rate in s−1 units, and the corresponding time, respectively. The respective reaction rate constants (k [s1]) and the determination coefficients (R2) have been listed. The reaction rate constants were measured in s−1 since they almost exceeded 100 in min−1. Three trials were done with each reaction, showing repetition, with a value of uncertainty of 0.0007 in the maximum on reaction rate values. All values in Table 2 are an average of the three trials, and the values are only written to three digits after the period due to uncertainty. Compared to many other previous studies [35,36,37,38,39,40,41], the synthesized catalyst had eminently high reaction rate constants. Except for the CV 30 ppm degradation, all of the regression coefficients had values that were high enough to demonstrate that each reaction occurred according to first-order kinetics. The assumption that a blank solution would have a value of 0.001 might have been a major factor for tge regression coefficient of CV 30 ppm, with the normal light condition having relatively low value. The regression coefficient calculated from CV, 30 ppm (normal light condition), excluding the fourth and fifth minute, showed 0.9372, which is justifiably assumed to possess first-order kinetics.
Although various analysis of the catalyst suggest that new catalysts different from crude precursors were synthesized, it is still disputable if the degradation process results from residual MoCl5 or the catalyst. Additionally, it should be verified if the process is degradation or simple adsorption. Figure 7; Figure 8, which are both 1H-NMR spectroscopy data, suggest a conclusive result for each problem, respectively.
Figure 7 shows 600 MHz quality 1H-NMR spectroscopy data at full scale for   δ = 0 14   ppm . To compare the degradation product of MoCl5 and WO3/MoCl5, all data were merged with the data of RB 1H-NMR and are displayed in one figure. Based on Figure 7, the degradation peak of MoCl5 and WO3/MoCl5 showed a noticeable difference. In the box labeled as 1), it is observable that the original peak of RB in the region of δ = 6.5 8   ppm remains after being treated by WO3/MoCl5, whereas the RB solution treated by MoCl5 is deficient with the corresponding peak. Besides the 1) box, the region is slightly upfield from 3 ppm (a broad peak at   δ = 2.5 3   ppm ) and   δ = 2 2.2   ppm ;   δ = 1.8 2.0   ppm has a different peak appearance. Among all characteristic peak differences, the alteration that occurred at the box labeled as 2) is the most noteworthy, since a new peak appeared, and this peak exactly matches previous research on the degradation of RB conducted by Steve D. et al. [49]. This is key evidence that WO3/MoCl5 follows the process of degradation that is already well studied and different from that of pure MoCl5. To give a detailed comparison of the 1H-NMR peak of RB and RB treated with WO3/MoCl5, a magnified image at a specific region with a size of 1 ppm is shown (Figure 8).
Each of the comparisons of a specific region of the 600 MHz 1H-NMR peak shows the same tendency, in which some of the peaks remain, and other peaks are either shifted or eliminated. Several new peaks became visible, too (Figure 8a–c).
δ = 3 4   ppm represents hydrogen in RO-C1H and NC-C1H, and the degradation results show (Figure 8a) that the peak inside the box labeled as 3) remains, while the peak inside the box labeled as 1) newly appeared. The peak in box 2) has either divided into two from the initial peak or the original peak might have disappeared, while two new peaks appeared. The peaks in the box labeled 2) suggest the unsymmetrical cracking of the RB molecule into two fragments both including NC-C1H but with a different shape (Figure 8a).
Saturated alkane linked hydrogens appear in the range of δ = 1 2   ppm (Figure 8b). Peaks included in the boxes labeled as 1) and 4) remained, and the peaks in 3) shifted. The peaks in 2)-(1) and 2)-(2) are both singlets, and the relationship between two peaks might be that 2)-(2) shifted to 2)-(1), or 2)-(1) could be an entirely different peak.
Aromatic hydrogens appear in the region of δ = 6.5 8   ppm (Figure 8c). The included peaks were shifted or eliminated as WO3/MoCl5 was treated. All of the results by 1H-NMR eliminated the probability of simple adsorption, since the same RB solution with a different concentration only shows a difference in peak intensity and not in peak allocation and shape. Summarizing all of the 1H-NMR results in Figure 7; Figure 8, synthesized WO3/MoCl5 followed the degradation pathway, and the degradation products seemed to be different. Notably, a full-scale comparison ( δ = 0 14   ppm ) of 1H-NMR shows that the 1H-NMR peaks matched up with other studies on RB degradation [49], and peaks at δ = 3 4   ppm shows that the degradation product might have resulted from the two molecules cracking unsymmetrically, with both including nitrogen as a component.

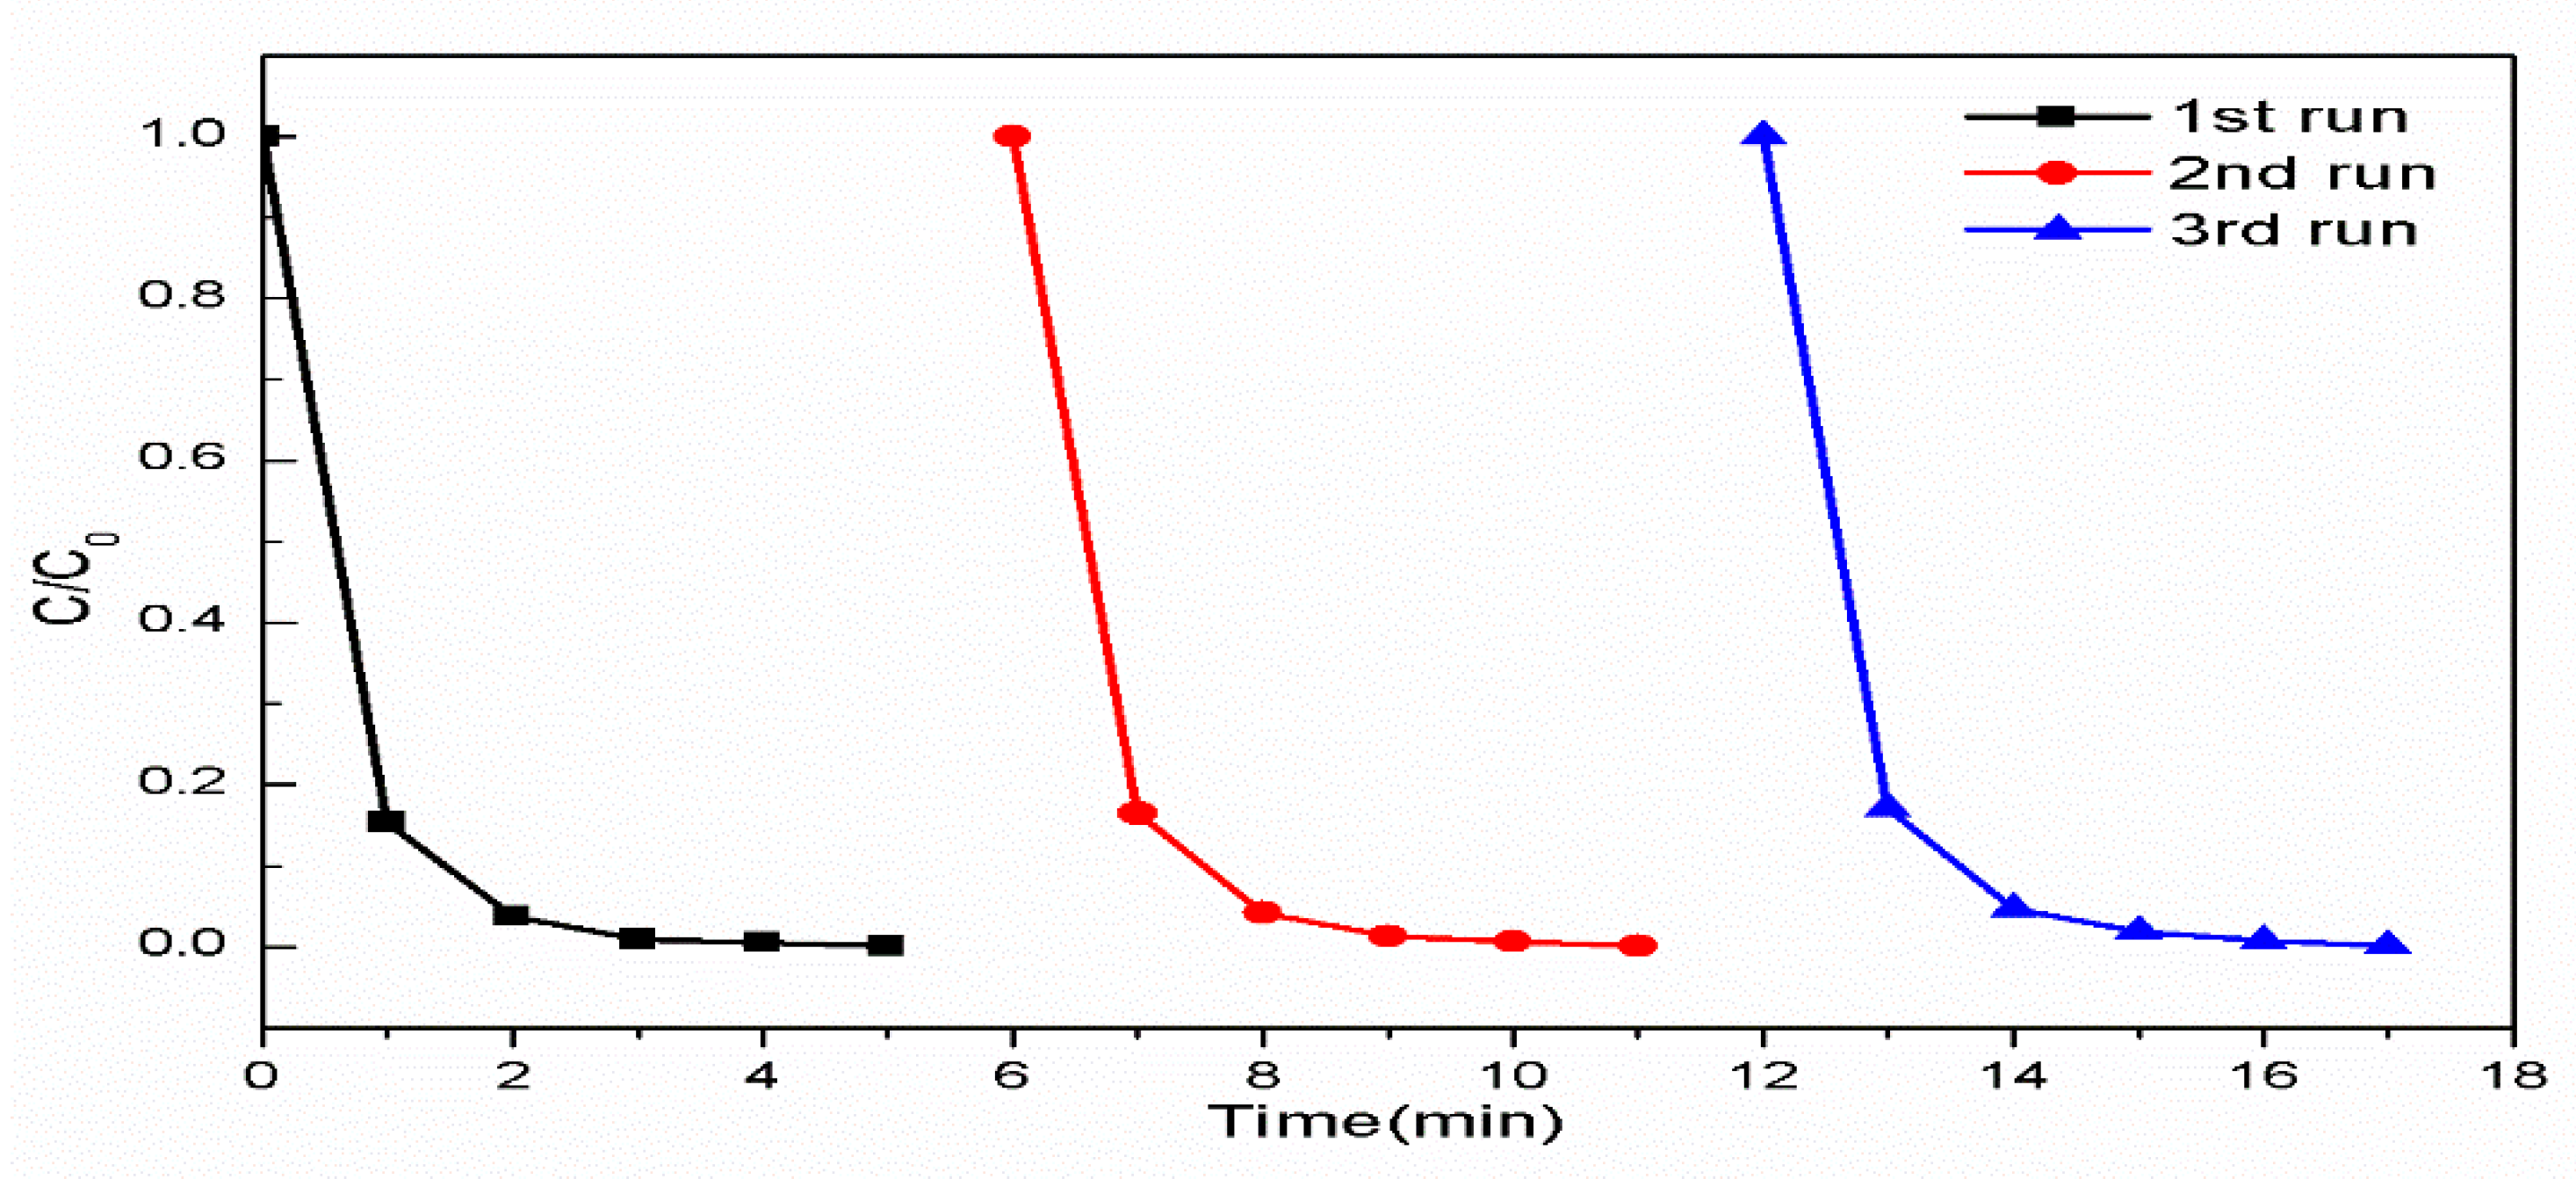
2.4. Reusability of WO3/MoCl5

The reusability of WO3/MoCl5 was studied via three reaction trials using the same catalyst batch after simple treatment (Figure 9). Once used, the catalyst was dried in the 90 °C oven and was washed with water several times to desorb some dyes that were adsorbed previously. The results show that there was almost no difference in the efficiency of the catalyst during three reaction times. Due to its high reusability, the catalyst is anticipated to be used as an industrial catalyst.

3. Materials and Methods

3.1. Materials

Tungsten(VI) oxide was bought from Sigma Aldrich (Sigma Aldrich Korea, Yongin, Korea) and was dehydrated for 12 h before use. RB and CV were purchased from Sigma Aldrich and were made, respectively, into a 30 ppm and 50 ppm solution with Millipore 18 MΩ pure water. Other chemicals also purchased from Sigma Aldrich, such as toluene, 1,1,3,3-tetramethylguanidine, and hexane were used for precursors or solvents during synthesis and SEM analysis.

3.2. Synthesis of the Molybdenum(V) Chloride-Tungsten Oxide Complex

This procedure was followed to synthesize a W-O-Mo complex catalyst. 2 g of WO3 was heated in a Schlenk flask under a vacuum condition for 12 h at 100 °C and was continuously stirred with a magnetic bar throughout the heating. 40 mL of toluene along with 2 mL of 1,1,3,3-tetramethylguanidine was added to the flask and was stirred continuously for 2 h. Toluene (40 mL) was mixed with 2 g of MoCl5 in another Schlenk flask. N2 gas was injected into the flask, and the mixture in the flask was stirred for 4 h. To prevent the Mo from reacting with the atmospheric oxygen, the MoCl5 solution was transferred immediately to the flask containing a WO3 toluene solution. The catalyst solution was stirred for 10 h, vacuum filtered after stirring, and put in the oven at 95 °C. The catalyst was washed using toluene for 10 min, and it was dried with a temperature of 110 °C. Dried heterogeneous WO3/MoCl5 was inserted into a glass vial and wrapped to prevent contact with the atmospheric oxygen.

3.3. Catalyst Characterization

Crystalline structures were collected by X-ray diffraction (XRD, Rigaku model, Miniflex 600 m) with Cu-K α radiation ( λ = 1.5417 ) at 40 kV, 15 mA (step size 0.02°) in the range of 10° 2 θ 85 ° . The morphology of the synthesized material was characterized by transmission electron microscopy (TEM, Hitachi, Tokyo, Japan, H-7600) and scanning electron microscopy (SEM, FEI, Quanta 200) with support of energy dispersive spectra (EDS). For TEM analysis, the catalyst was dispersed in toluene using a sonicator for 3 h and was observed. The catalyst was attached to the carbon tape before observation, and 30.0 kV of electrons were used under an intermediate vacuum state. Concentrations of the dye solutions were determined by UV-Vis absorption spectroscopy (Carry 5000, Varian, Sydney, Australia). To gain the optimum result of UV-Vis spectroscopy, the original dye solution and the dye solution treated with WO3/MoCl5 were diluted at the same rate until the highest peak was around an absorbance value of 1.0. Fourier-Transform Infrared Spectroscopy (FT-IR, Thermo Fisher Scientific, Waltham, MA, USA, FT-IR 300) was used to reveal the linkages between the elements of the catalyst. The scan wavelength range was 400–4000 cm−1, the step size was 0.5 cm−1, and 16 signals were used to clear the noise. Nuclear Magnetic Resonance (NMR, Jeol, Tokyo, Japan, JNM ECP-600 MHz) was used to investigate the difference of the peaks before and after degradation.

3.4. Catalytic Tests

The catalytic reaction was conducted in a 15 mL test tube. All dye solutions were made in 1 L volume using purified water with Millipore 18 M Ω . The initial concentrations of CV and RB were both 30 mg × L 1 and 50 mg × L 1 , while the volume was 10 mL for each reaction; 0.01 g of catalysts were employed for each reaction, which is comparably smaller than the quantity of catalysts used in other studies.
The normal light condition was a spontaneous condition, in which there were no highly concentrated light source, such as a UV lamp, directly irradiating the reactor. The only light source that could affect the reaction was a fluorescent light located on the ceiling of the laboratory to light up the whole room. Albeit dim, a bit of light might have influenced the reaction. To exclude at least a portion of the effect of the fluorescent light, the total dark condition was made to verify if the reaction could process without any light. Complete dark was produced by turning off all lights of the laboratory, including lights for the hallway, by conducting the experiment after midnight, and by wrapping the reactor with aluminum foil.

4. Conclusions

This research focused on the study of a novel catalyst WO3/MoCl5 synthesized by thermal synthesis. The degradation reaction of crystal violet dye (CV) and rhodamine B dye (RB) using the synthesized catalyst was studied, including observing the catalyst’s reusability. The catalyst reaction was first conducted in a natural environment (normal light condition), without adding a concentrated energy source or using natural light sources, such as sunlight and fluorescent lights that light up the laboratory. Next, the reaction was conducted without any energy source, such as light (dark condition). Both cases gave an identical result for the final percentage of degradation (100%), but the latter case needed more time than the former case. The normal light conditions gave a reaction rate constant of 1.74 s−1 on 30 ppm CV, which is superior to any other results from research conducted on RB and CV degradation. Moreover, the time required for 80% degradation for both cases of 50 mg × L 1   dye solution was about 1 min, which is extremely rapid. This result was verified for three trials, showing that the catalysts were reusable by simply washing them after the reaction. Moreover, spectroscopic studies revealed that the synthesis progress using the basicity of TMG to deprotonate the hydroxyl hydrogens and adding MoCl5 successfully induced the bondage of W-O-Mo. High-quality 1H-NMR spectroscopy concluded that the degradation product of RB treated by pure MoCl5 and WO3/MoCl5 was different, and careful observation of specific regions offered blueprints for the degradation product.

Author Contributions

D.K. designed and supervised the majority of experiments, wrote the manuscript and analyzed the data. H.B. and G.K. designed several experiments and did the experiments with D.K., E.K., D.C., and B.M., N.H.T. provided the concepts and reviewed the paper prior to submission. All authors contributed on paper revision.

Funding

This work was supported by the Research & Education Program at the Korea Science Academy of KAIST with funds from the Ministry of Science and ICT.

Acknowledgments

All the authors are thankful to Man-Seog Chun, Eun-Young Choi, and Jin Ho Oh for their constant support throughout this research activity.

Conflicts of Interest

The authors declare no conflict of interest.

References

  1. Benbachir, H.; Gaffour, H.; Mokhtari, M. Photodegradation of 2, 4, 6-trichlorophenol using natural hematite modified with chloride of zirconium oxide. React. Kinet. Mech. Catal. Lett. 2017, 122, 635–653. [Google Scholar] [CrossRef]
  2. Zaied, M.; Chutet, E.; Peulon, S.; Bellakhal, N.; Desmazières, B.; Dachraoui, M.; Chaussé, A. Spontaneous oxidative degradation of indigo carmine by thin films of birnessite electrodeposited onto SnO2. App. Catal. B Environ. 2011, 107, 42–51. [Google Scholar] [CrossRef]
  3. Oeztuerk, A.; Abdullah, M.J. Toxicological effect of indole and its azo dye derivatives on some microorganisms under aerobic conditions. Sci. Total Environ. 2006, 358, 137–142. [Google Scholar] [CrossRef] [PubMed]
  4. Tünay, O.; Kabdasli, I.; Ermektar, G.; Orhon, D. Color removal from textile wastewaters. Water Sci. Technol. 1996, 34, 9–16. [Google Scholar] [CrossRef]
  5. Carmine, L.; Andrea, A.; Katia, D.C.; Bianca, D.; Nadia, G.; Giancarlo, C.; Simelys, H.; Valentina, C. Sonophotocalytic degradation mechanisms of Rhodamine B dye via radicals generation by micro and nanoparticles of ZnO. Appl. Catal. B Environ. 2019, 243, 629–640. [Google Scholar]
  6. Jain, R.; Mathur, M.; Sikarwar, S.; Mittal, A. Removal of the hazardous dye rhodamine B through photocatalytic and adsorption treatments. J. Environ. Manag. 2007, 85, 956–964. [Google Scholar] [CrossRef]
  7. Rochat, J.; Demenge, P.; Rerat, J.C. Toxicologic study of a fluorescent tracer: Rhodamine B. Toxical. Eur. Res. 1978, 1, 23–26. [Google Scholar]
  8. IARC. Overall Evaluations of Carcinogenicity: An Updating of IARC Monographs Volumes 1–42; WHO: Lyon, France, 1987. [Google Scholar]
  9. Shimida, T.; Yamazaki, H.; Mimura, M.; Inui, Y.; Guengrich, F.P. Interindividual variations in human liver cytochrome P-450 enzymes involved in the oxidation of drugs, carcinogens, toxic chemicals; studies with liver microsomes of 30 Japanese, 30 Caucasians. J. Pharmacol. Exp. Ther. 1994, 270, 414–423. [Google Scholar]
  10. Mittal, A.; Mittal, J.; Malviya, A.; Kaur, D.; Gupta, V.K. Adsorption of hazardous dye crystal violet from wastewater by waste materials. J. Colloid. Interf. Sci. 2010, 343, 463–473. [Google Scholar] [CrossRef]
  11. Mani, S.; Bharagava, R.N. Exposure to crystal violet, its toxic, genotoxic and carcinogenic effects on environment and its degradation and detoxification for environmental safety. Rev. Environ. Contam. Toxicol. 2015, 237, 71–104. [Google Scholar]
  12. Au, W.; Pathak, S.; Collie, C.J.; Hsu, T.C. Cytogenetic toxicity of gentian violet and crystal violet on mammalian cells in vitro. Mutat. Res. Genet. Toxicol. 1978, 58, 269–276. [Google Scholar] [CrossRef]
  13. Fernanda, R.G.; Silvia, N.J.M.; Wanderley, D.S.; Fernando, S.C.R.D. The mitochondrion of Trypanosoma cruzi is a target of crystal violet toxicity. Mol. Biochem. Parasitol. 1989, 34, 117–126. [Google Scholar]
  14. Crini, G. Non-conventional low-cost adsorbents for dye removal: a review. Bioresour. Technol. 2006, 97, 1061–1085. [Google Scholar] [CrossRef] [PubMed]
  15. Zaied, M.; Peulon, S.; Bellakhal, N.; Desmazières, B.; Chaussé, A. Studies of N-demethylation oxidative and degradation of methylene blue by thin layers of birnessite electrodeposited onto SnO2. Appl. Catal. B Environ. 2011, 101, 441–450. [Google Scholar] [CrossRef]
  16. Awad, H.S.; Galwa, N.A. Electrochemical degradation of Acid Blue and Basic Brown dyes on Pb/PbO2 electrode in the presence of different conductive electrolyte and effect of various operating factors. Chemosphere 2005, 61, 1327–1335. [Google Scholar] [CrossRef] [PubMed]
  17. Lente, G.; Espenson, J.H. Oxidation of 2, 4, 6-trichlorophenol by hydrogen peroxide. Comparison of different iron-based catalysts. Green Chem. 2005, 7, 28–34. [Google Scholar] [CrossRef]
  18. Sarma, H.; Bhattacharyya, K.G. Catalytic wet oxidation of 2, 4, 6-trichlorophenol with Fe(III) supported ZSM5. Int. J. Interdiscip. Multidiscip. Stud. 2014, 2, 11–16. [Google Scholar]
  19. Rengaraj, S.; Li, X.Z. Enhanced photocatalytic activity of TiO2 by doping with Ag for degradation of 2, 4, 6-trichlorophenol in aqueous suspension. J. Mol. Catal. A Chem. 2006, 243, 60–67. [Google Scholar] [CrossRef]
  20. Babuponnusami, A.; Muthukumar, K. A review on Fenton and improvements to the Fenton process for wastewater treatment. J. Chem. Eng. 2014, 2, 557–572. [Google Scholar] [CrossRef]
  21. Bokare, A.D.; Choi, W. Review of iron-free Fenton-like systems for activating H2O2 in advanced oxidation processes. J. Hazard. Mater. 2014, 275, 121–135. [Google Scholar] [CrossRef]
  22. Yang, X.; Tian, P.; Zhang, C.; Deng, Y.; Xu, J.; Gong, J.; Han, Y. Au/carbon as Fenton-like catalysts for the oxidative degradation of bisphenol A. Appl. Catal. B Environ. 2013, 134, 145–152. [Google Scholar] [CrossRef]
  23. Zhang, L.; Xu, D.; Hu, C.; Shi, Y. Framework Cu-doped AlPO4 as an effective Fenton-like catalyst for bisphenol A degradation. Appl. Catal. B Environ. 2017, 207, 9–16. [Google Scholar] [CrossRef]
  24. Zbiljic, J.; Vajdle, O.; Guzsvany, V.; Molnar, J.; Agbaba, J.; Dalmacija, B.; Kalcher, K. Hydrodynamic chronoamperometric method for the determination of H2O2 using MnO2-based carbon paste electrodes in groundwater treated by Fenton and Fenton-like reagents for natural organic matter removal. J. Hazard. Mater. 2015, 283, 292–301. [Google Scholar] [CrossRef] [PubMed]
  25. Dong, P.; Yang, B.; Liu, C.; Xu, F.; Xi, X.; Hou, G.; Shao, R. Highly enhanced photocatalytic activity of WO3 thin films loaded with Pt-Ag bimetallic alloy nanoparticles. RSC Adv. 2017, 7, 947–956. [Google Scholar] [CrossRef]
  26. Jan’aky, C.; Rajeshwar, K.; De Tacconi, N.; Chanmanee, W.; Huda, M. Tungsten-based oxide semiconductors for solar hydrogen generation. Catal. Today 2013, 199, 53–64. [Google Scholar] [CrossRef]
  27. Bamwenda, G.R.; Arakawa, H. The visible light induced photocatalytic activity of tungsten trioxide powders. Appl. Catal. A Gen. 2001, 210, 181–191. [Google Scholar] [CrossRef]
  28. Sayama, K.; Hayashi, H.; Arai, T.; Yanagida, M.; Gunji, T.; Sugihara, H. Highly active WO3 semiconductor photocatalyst prepared from amorphous peroxo-tungstic acid for the degradation of various organic compounds. Appl. Catal. B Environ. 2010, 94, 150–157. [Google Scholar] [CrossRef]
  29. Kristina, H.; Gregor, S.; Siegfried, R.W. Novel Domino Oxidative Coupling: C–C Bond Formation Sequence to Highly Functionalized Dibenzo[a,c]cycloheptenes. Org. Lett. 2011, 13, 916–919. [Google Scholar]
  30. Trosien, S.; Bottger, P.; Waldbogel, S.R. Versatile oxidative approach to carbazoles and related compounds using MoCl5. Org. Lett. 2014, 16, 402–405. [Google Scholar] [CrossRef]
  31. Tian, W.; Liao, H.; Wu, J.-G.; Yang, G.-D. Study on the coordination of the hydroxyl group: Crystal structure and FT-IR spectra of potassium hydrogen galactarate. Polyhedron 1997, 16, 2055–2058. [Google Scholar] [CrossRef]
  32. Kee, C.W. Assignment of O–O and Mo=O Stretching Frequencies of Molybdenum/Tungsten Complexes Revisited. J. Chem. 2015, 2015, 1–10. [Google Scholar] [CrossRef]
  33. Konings, R.J.M.; Booji, A.S. Infrared Spectra of NbCl5 and MoCl5 in the gas phase. Vib. Spectrosc. 1994, 6, 345–349. [Google Scholar] [CrossRef]
  34. Zhuiykov, S.; Kats, E. Enhanced electrical properties in sub-10-nm WO3 nanoflakes prepared via a two-step sol-gel-exfoliation method. Nanoscale Res. Lett. 2014, 9, 401–410. [Google Scholar] [CrossRef] [PubMed]
  35. Yao, W.; Zhang, B.; Huang, C.; Ma, C.; Song, X.; Xu, Q. Synthesis and characterization of the high efficiency and stable Ag3PO4/TiO2 visible light photocatalyst for the degradation of methylene blue and rhodamine B solutions. J. Mater. Chem. 2012, 22, 4050–4055. [Google Scholar] [CrossRef]
  36. Wilke, K.; Breuer, H.D. The influence of transition metal doping on the physical and photocatalytic properties of titania. J. Photochem. Photobiol. A Chem. 1999, 121, 49–53. [Google Scholar] [CrossRef]
  37. Wei, B.X.; Zhao, L.; Wang, T.J.; Gao, H.; Wu, H.X.; Jin, Y. Photo-stability of TiO2 particles coated with several transition metal oxides and its measurement by rhodamine-B degradation. Adv. Powder Technol. 2013, 24, 708–713. [Google Scholar] [CrossRef]
  38. Sahoo, C.; Gupta, A.K.; Pal, A. Photocatalytic degradation of Crystal Violet (C.I. Basic Violet 3) on silver ion doped TiO2. Dyes Pigments 2005, 66, 189–196. [Google Scholar] [CrossRef]
  39. Ameen, S.; Akhtar, M.S.; Nazim, M.; Shin, H.S. Rapid photocatalytic degradation of crystal violet dye over ZnO flower nanomaterials. Mater. Lett. 2013, 96, 228–232. [Google Scholar] [CrossRef]
  40. Sajid, M.M.; Khan, S.B.; Shad, N.A.; Amin, N.; Zhang, Z. Visible light assisted photocatalytic degradation of crystal violet dye and electrochemical detection of ascorbic acid using BiVO4/FeVO4 heterojunction composite. RSC Adv. 2018, 42, 23489–23498. [Google Scholar] [CrossRef]
  41. Claudia, C.; Hua, X.; Federica, B.; Cinzia, B.; Teresa, S.; Elvio, C.; Valeria, V.; Giuseppe, G.; Giuseppe, C. Controllable One-Pot Synthesis of Anatase TiO2 Nanorods with the Microwave-Solvothermal Method. Sci. Adv. Mater. 2014, 6, 1668–1675. [Google Scholar]
  42. Catala, M.; Dominguez-Morueco, N.; Migens, A.; Molina, R.; Martinez, F.; Valcarcel, Y.; Mastroianni, N.; Lopez de Alda, M.; Barcelo, D.; Segura, Y. Elimination of drugs of abuse and their toxicity from natural waters by photo-Fenton treatment. Sci. Total Environm. 2015, 520, 198–205. [Google Scholar] [CrossRef] [PubMed]
  43. Chong, S.; Zhang, G.; Zhang, N.; Liu, Y.; Zhu, J.; Huang, T.; Fang, S. Preparation of FeCeOx by ultrasonic impregnation method for heterogeneous Fenton degradation of diclofenac. Ultrason. Sonochem. 2016, 32, 231–240. [Google Scholar] [CrossRef] [PubMed]
  44. Jaafarzadeh, N.; Kakavandi, B.; Takdastan, A.; Kalantary, R.R.; Azizi, M.; Jorfi, S. Powder activated carbon/Fe3O4 hybrid composite as a highly efficient heterogeneous catalyst for Fenton oxidation of tetracycline: Degradation mechanism and kinetic. RSC Adv. 2015, 5, 84718–84728. [Google Scholar] [CrossRef]
  45. Arzate-Salgado, S.-Y.; Morales-Perez, A.-A.; Solis-Lopez, M.; Ramirez-Zamora, R.-M. Evaluation of metallurgical slag as a Fenton-type photocatalyst for the degradation of an emerging pollutant: Diclofenac. Catal. Today 2016, 266, 126–135. [Google Scholar] [CrossRef]
  46. Bobu, M.; Yediler, A.; Siminiceanu, I.; Schulte-Hostede, S. Degradation studies of ciprofloxacin on a pillared iron catalyst. Appl. Catal. B Environ. 2008, 83, 15–23. [Google Scholar] [CrossRef]
  47. Qamar, M.; Gondal, M.A.; Hayat, K.; Yamani, Z.H.; Al-Hooshani, K. Laser-induced removal of a dye C.I. Acid Red 87 using n-type WO3 semiconductor catalyst. J. Hazard. Mater. 2009, 170, 584–589. [Google Scholar] [CrossRef] [PubMed]
  48. Hayat, K.; Gondal, M.A.; Khaled, M.M.; Yamani, Z.H. Laser induced photocatalytic degradation of hazardous dye (Safranin-O) using self synthesized nanocrystallne WO3. J. Hazard. Mater. 2011, 186, 1226–1233. [Google Scholar] [CrossRef] [PubMed]
  49. Cui, Y.; Goldup, S.M.; Dunn, S. Photodegradation of Rhodamine B over Ag modified ferroelectric BaTiO3 under simulated solar light: Pathways and mechanism. RSC Adv. 2015, 5, 30372–30379. [Google Scholar] [CrossRef]
Figure 1. TEM images of the precursor and MoCl5 linked catalyst: (a) WO3; (b) WO3/MoCl5.
Catalysts 09 00642 g001
Figure 2. Element assignment by EDS analysis of WO3/MoCl5.
Catalysts 09 00642 g002
Figure 3. The XRD pattern of the precursor WO3 and WO3-Mo.
Catalysts 09 00642 g003
Figure 4. (a) FT-IR spectra of WO3 and Mo doped WO3 (b) Comparison of FT-IR peaks of Mo doped metal oxides.
Catalysts 09 00642 g004
Figure 5. (a) Degradation of Crystal Violet (CV), 30 ppm (black) and 50 ppm (red); (b) degradation of Rhodamine B, 30 ppm (black) and 50 ppm (red).
Catalysts 09 00642 g005
Figure 6. (a) Degradation of Crystal Violet (CV) 50 ppm at ordinary light conditions (black) and a totally dark condition (red); (b) degradation of Rhodamine B 50 ppm at ordinary light conditions (black) and a totally dark condition (red).
Catalysts 09 00642 g006
Figure 7. 600 MHz 1H-NMR peaks of rhodamine B (RB) (black), the degradation product of RB by MoCl5 (blue), and the degradation product of RB by the synthesized catalyst (red).
Catalysts 09 00642 g007
Figure 8. 600 MHz 1H-NMR characteristic peak comparison of the degradation product of Rhodamine B by synthesized catalyst (red) and RB (black), focusing on the (a) δ = 3 4   ppm ,   (b) δ = 1 2   ppm , and (c) δ = 6.5 8   ppm shifts.
Catalysts 09 00642 g008aCatalysts 09 00642 g008b
Figure 9. Reusability of WO3/MoCl5 as a catalyst for CV and RB degradation.
Catalysts 09 00642 g009
Table 1. Element proportion analysis of WO3-Mo.
ElementAtom No.Mass Norm [%]Atom [%]Abs. Error [%]
Nitrogen752.372.1719.38
Chlorine173.972.160.52
Oxygen818.9722.928.62
Carbon6000
Tungsten7423.242.453.1
Molybdenum421.520.310.31
Table 2. First order kinetics of dye degradation reaction (RB and CV; normal (light) and dark condition).
DyeCV 30CV 50RB 30RB 50
R2k [sec−1]R2k [sec−1]R2k [sec−1]R2k [sec−1]
Normal
Condition
0.9861.7440.9901.1780.7371.080.8980.928
Dark
Condition
0.9611.3780.9841.3630.9321.2180.9860.884

