Wastewater Treatment and Electricity Production in a Microbial Fuel Cell with Cu–B Alloy as the Cathode Catalyst


Abstract
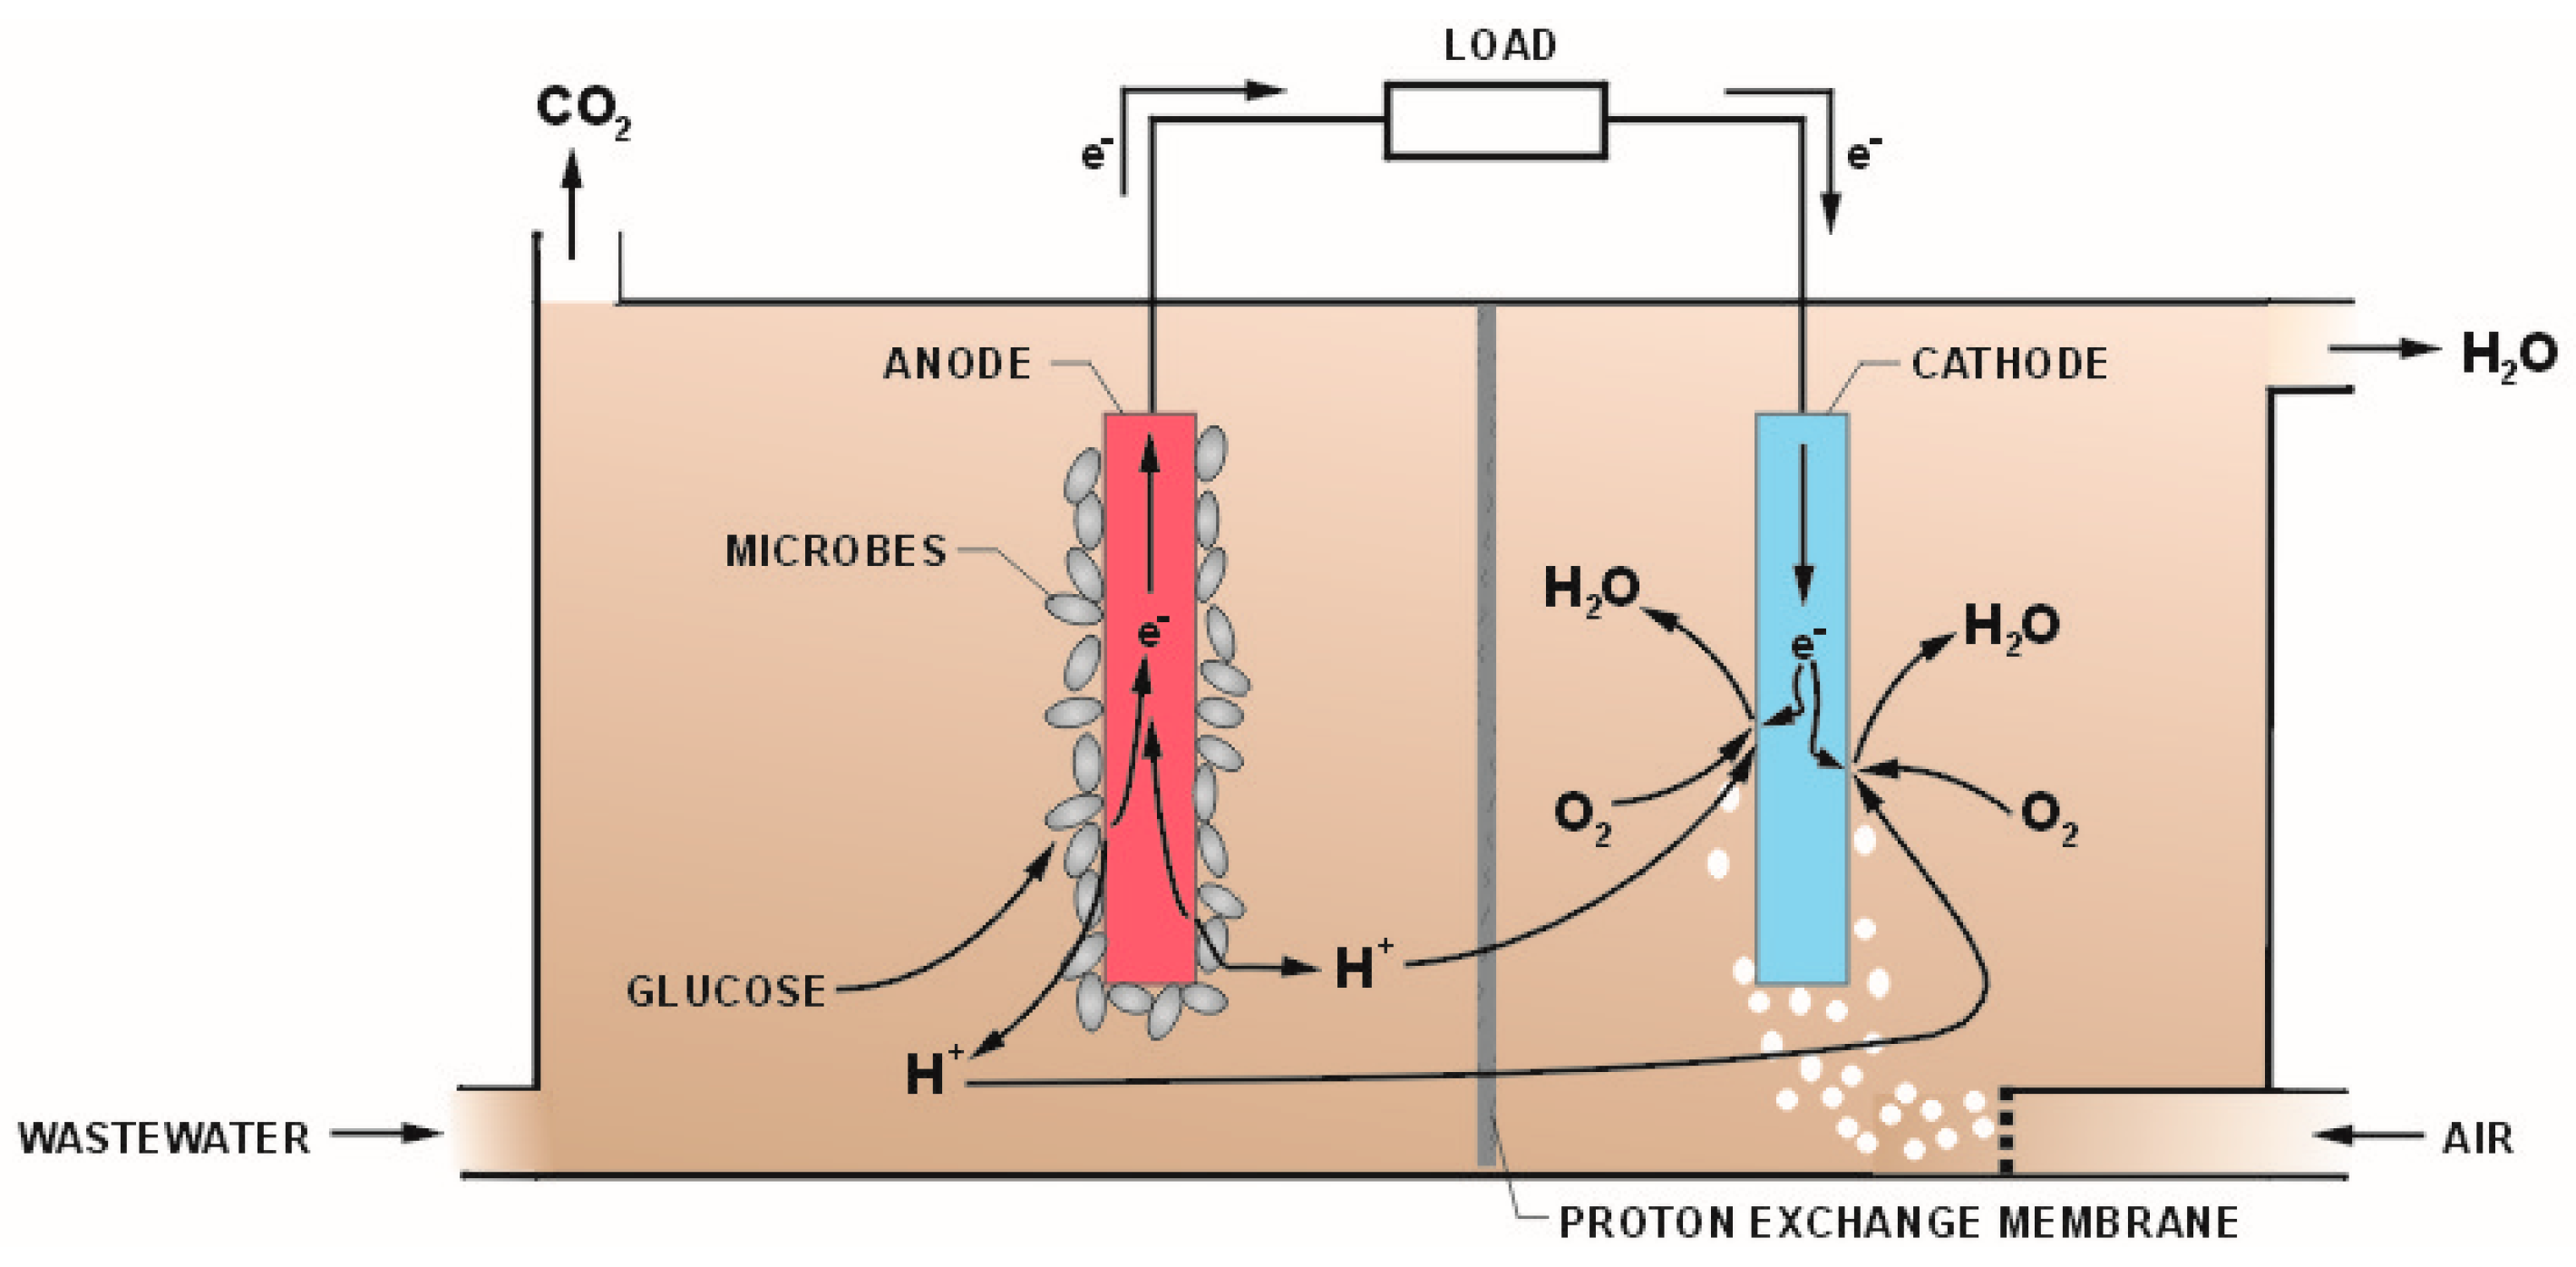
1. Introduction
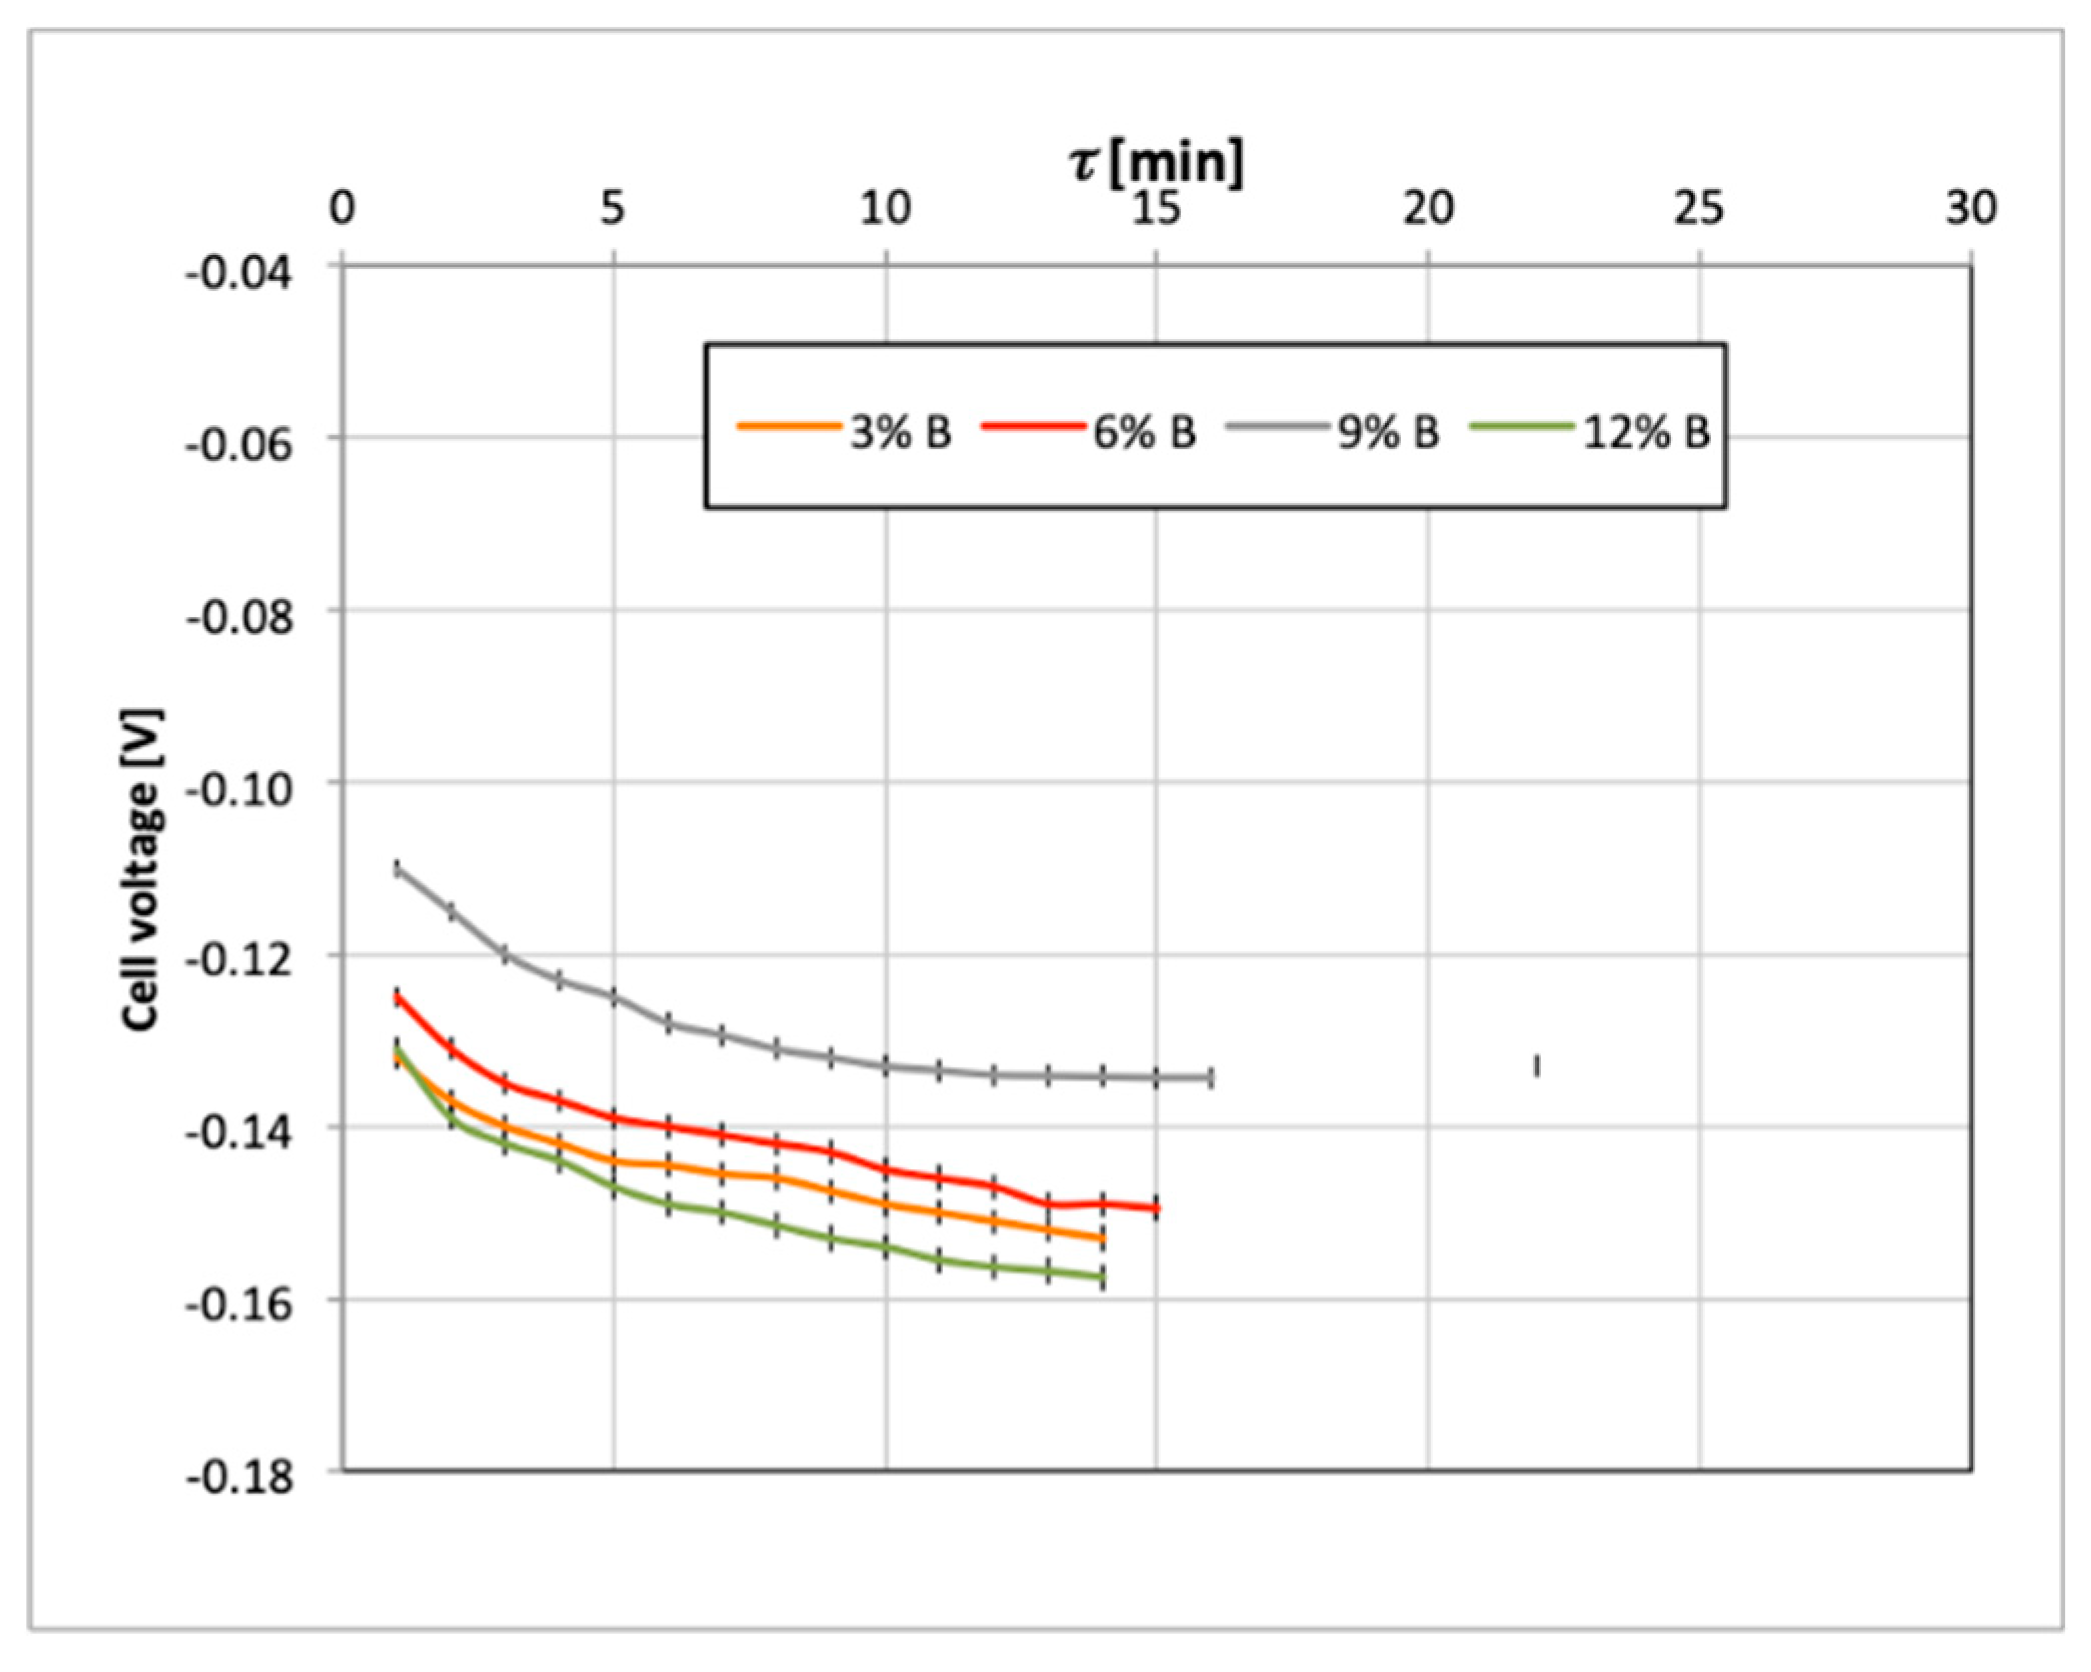
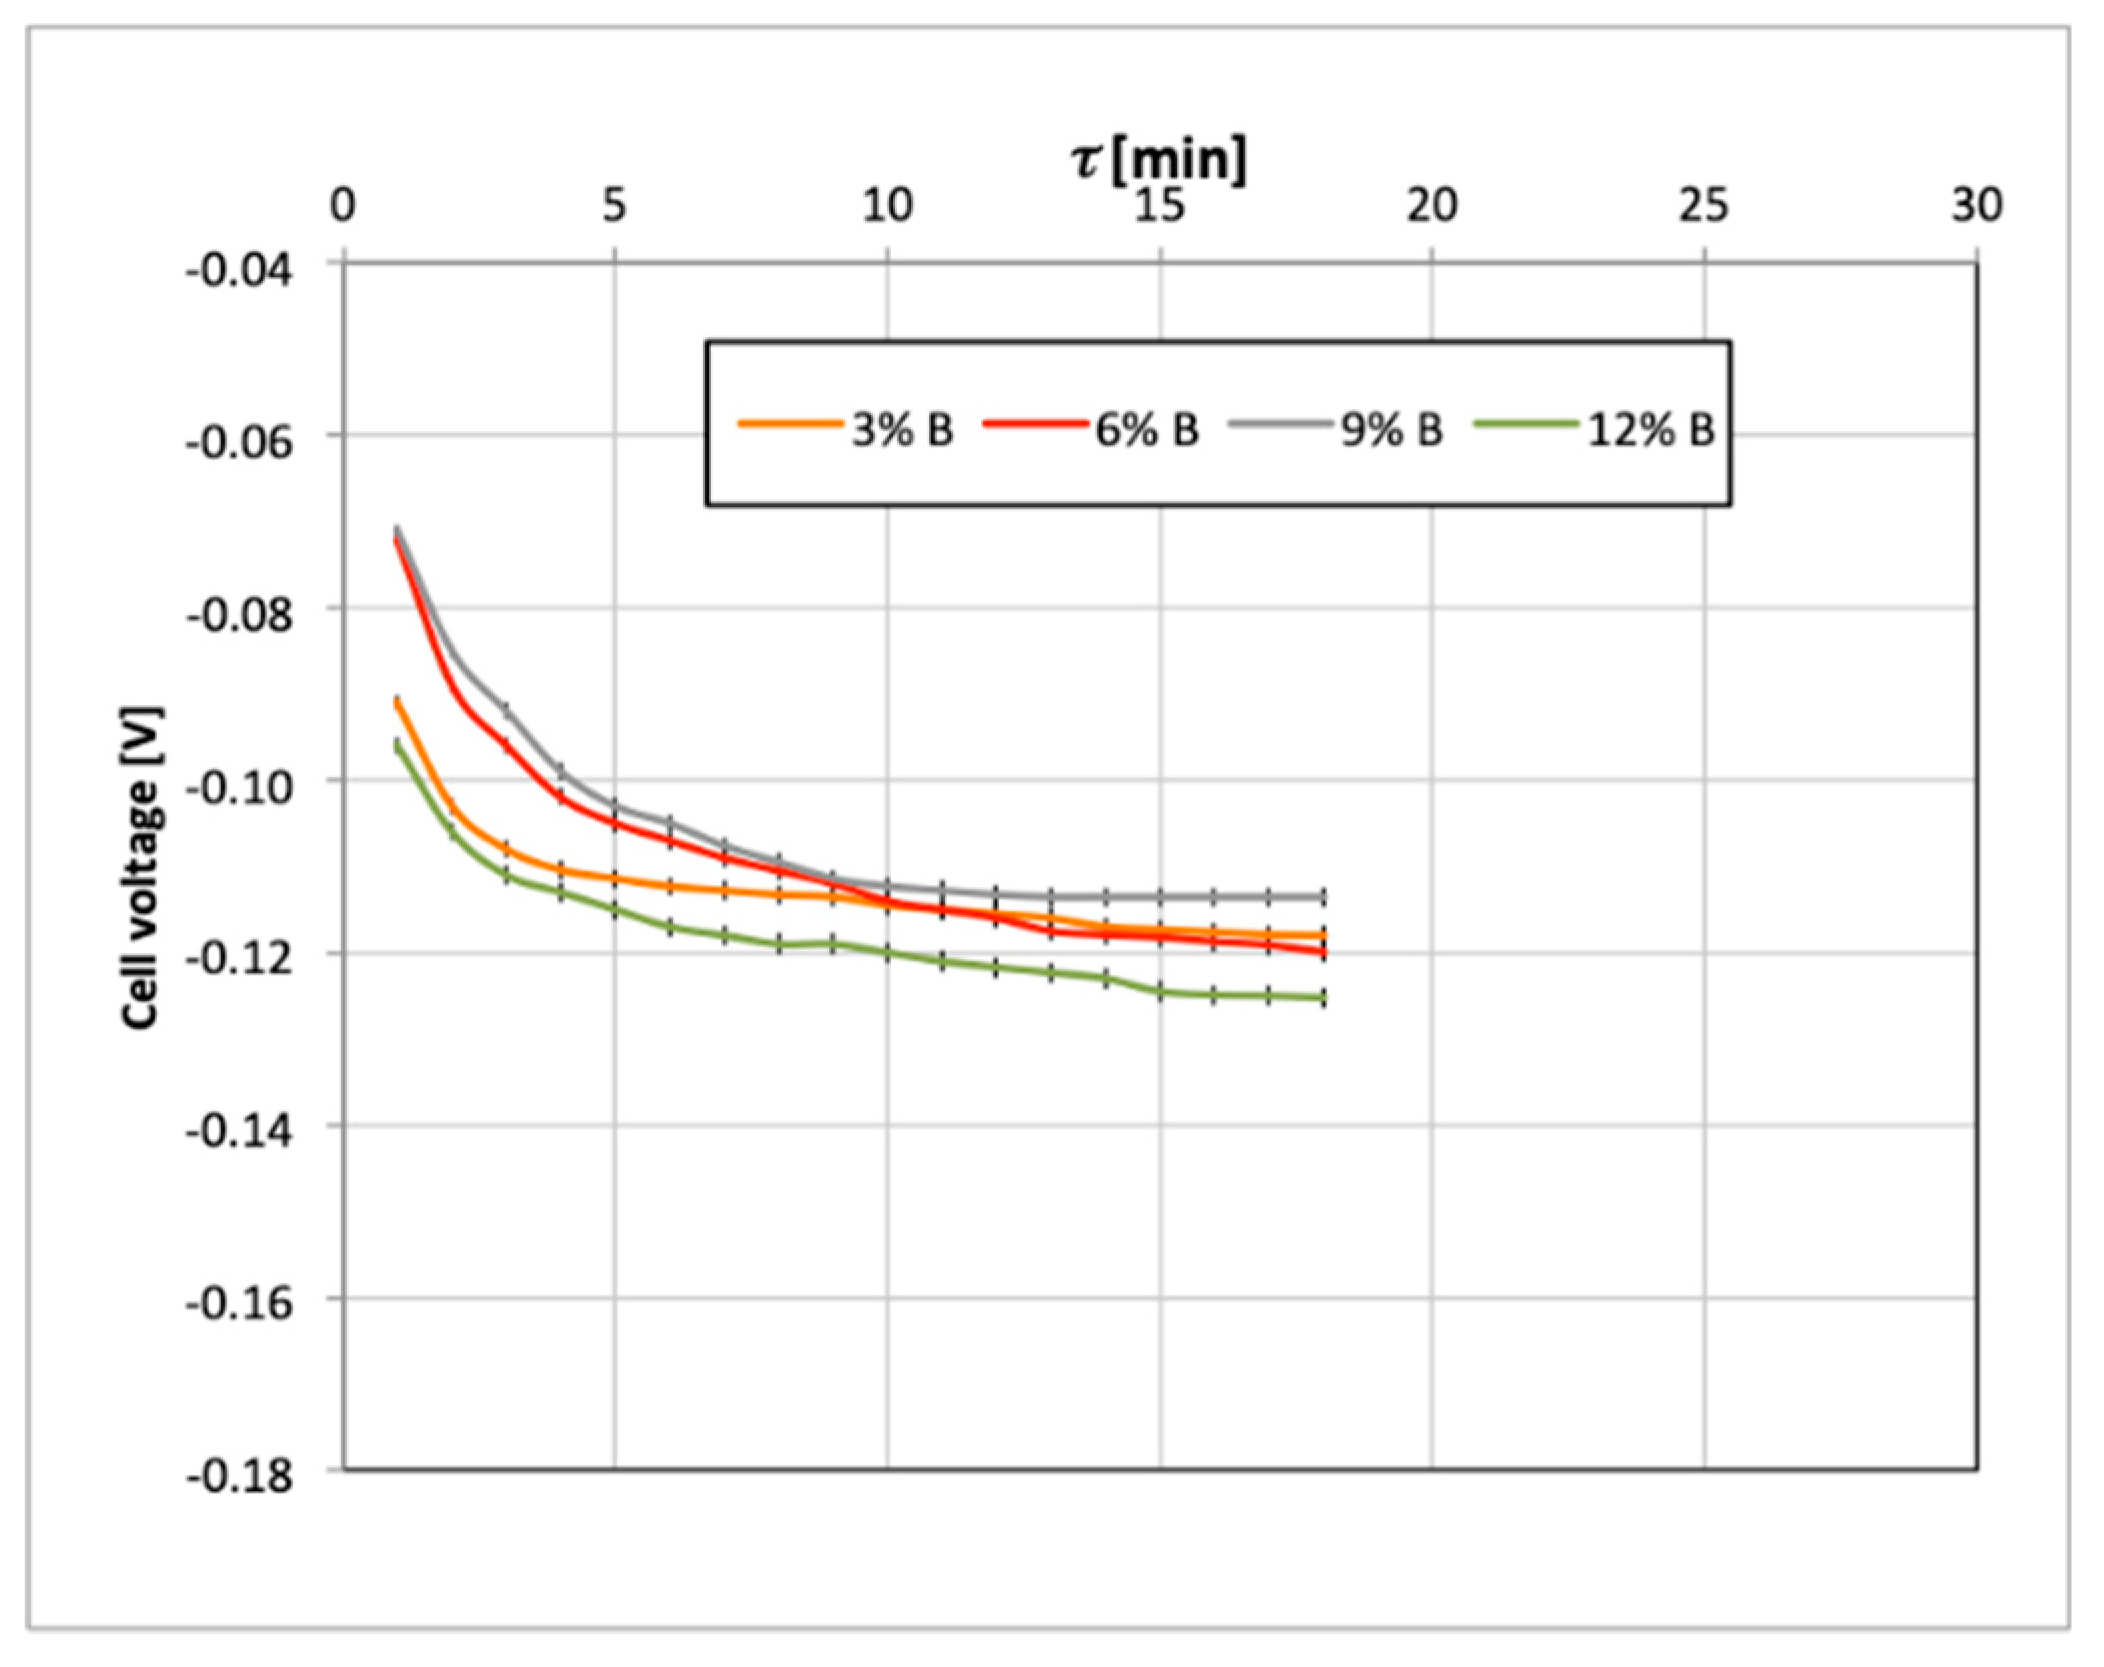
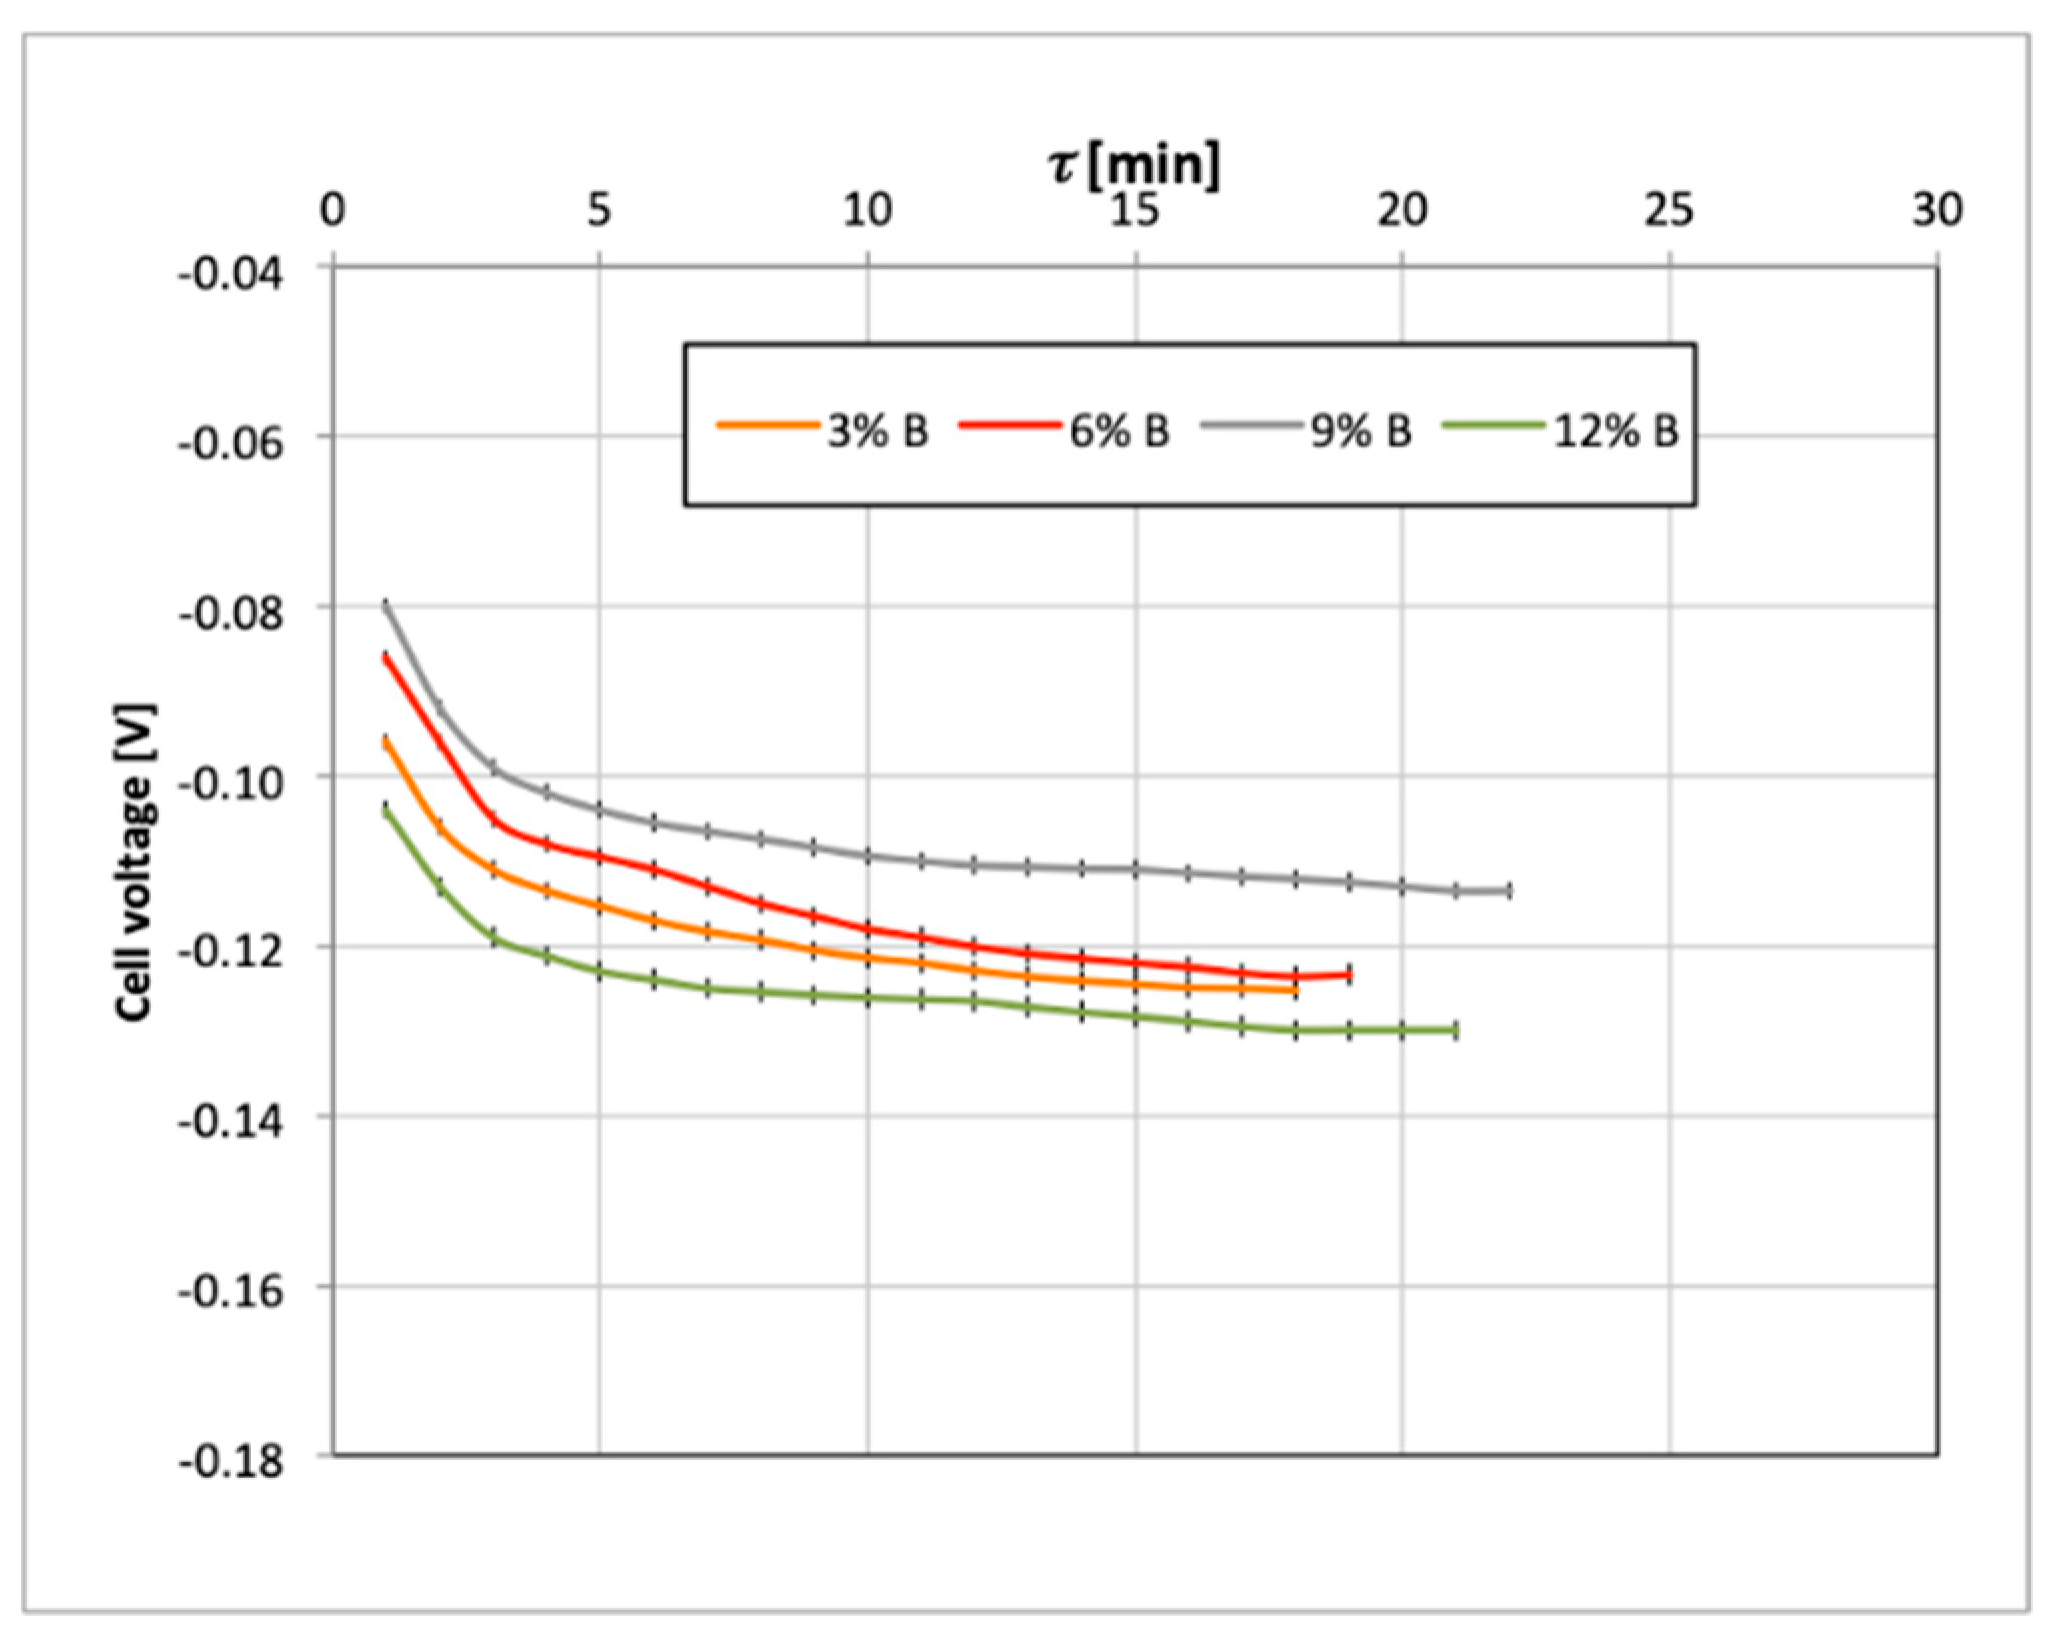
2. Results and Discussion
3. Materials and Methods
3.1. Preparation of a Cathode with Cu–B Catalyst
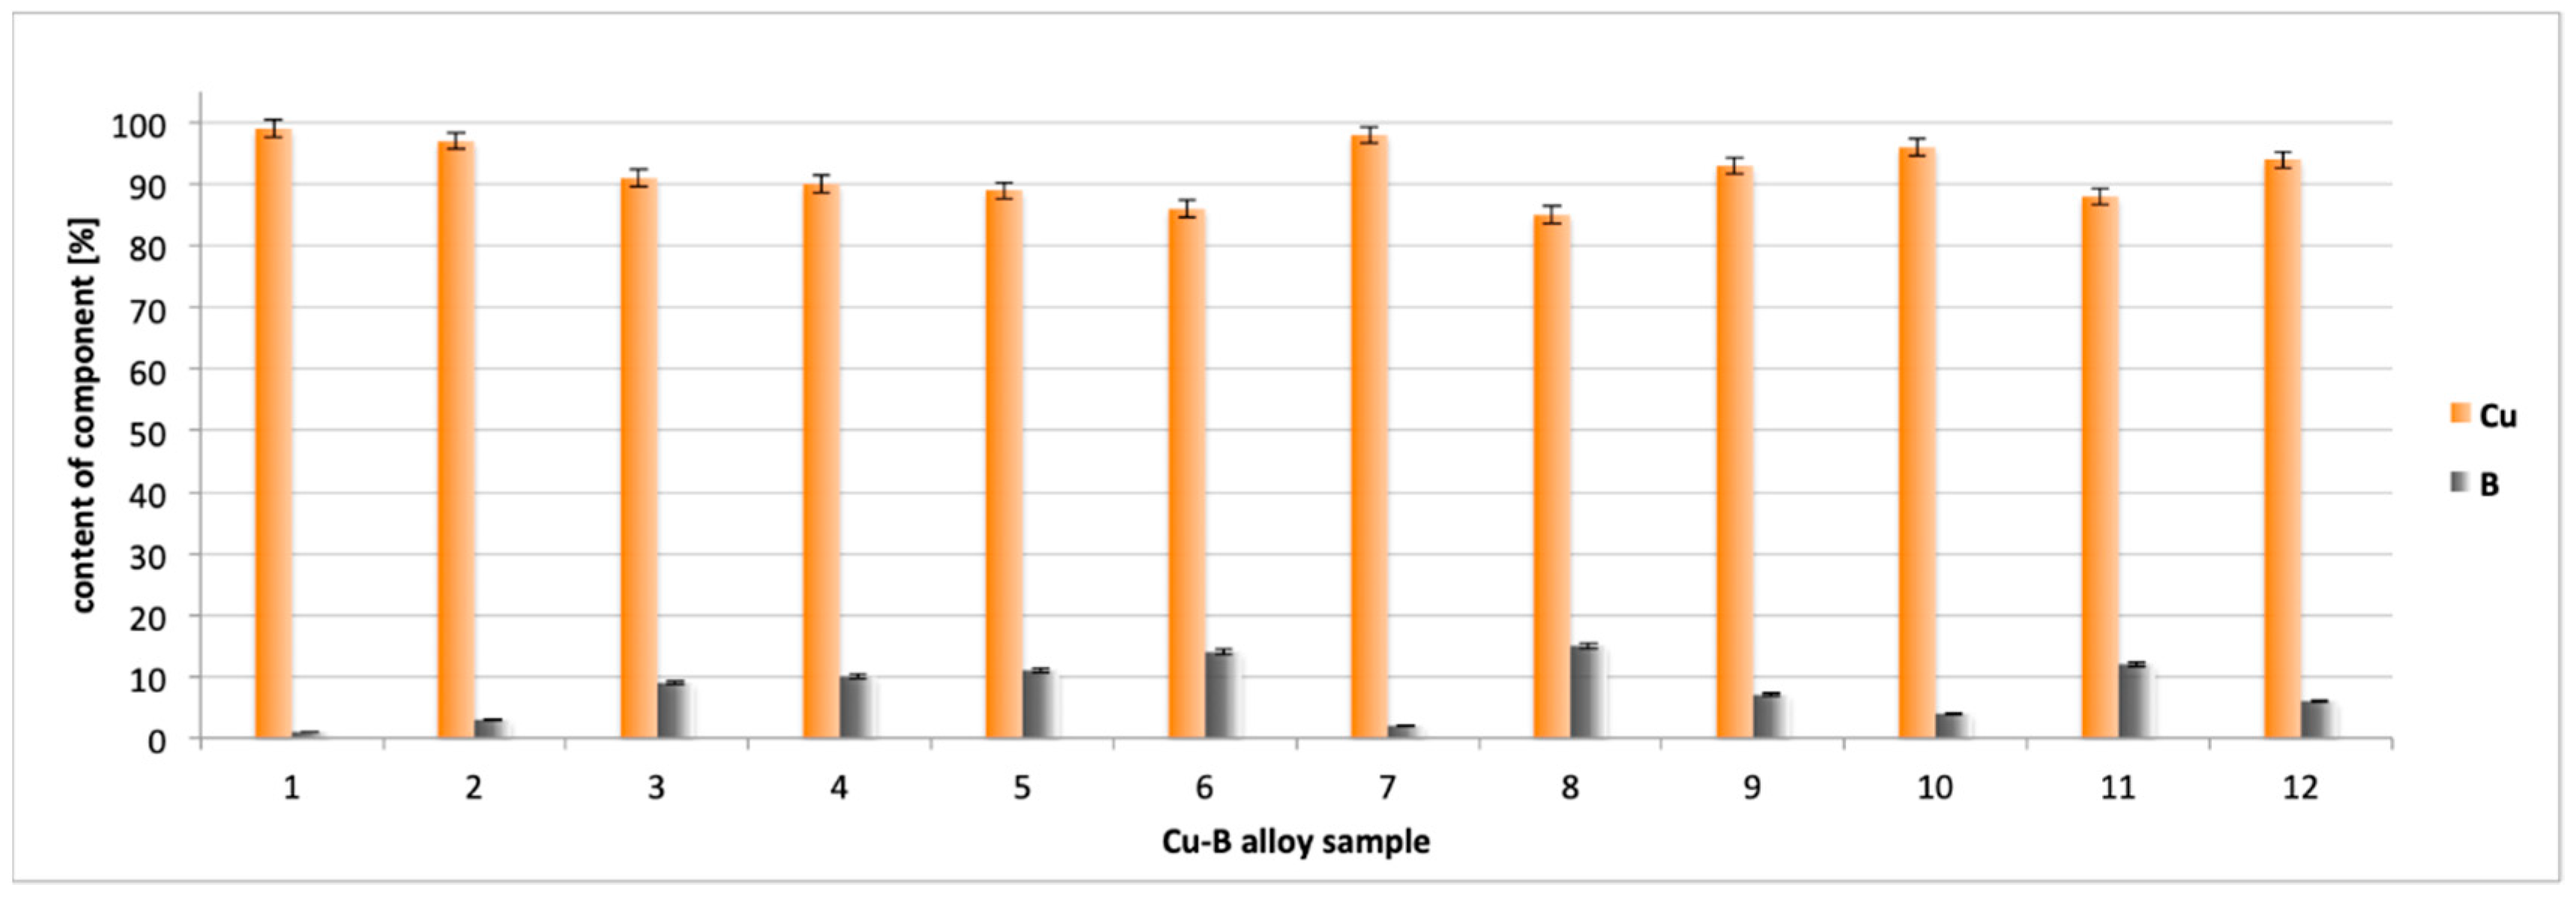
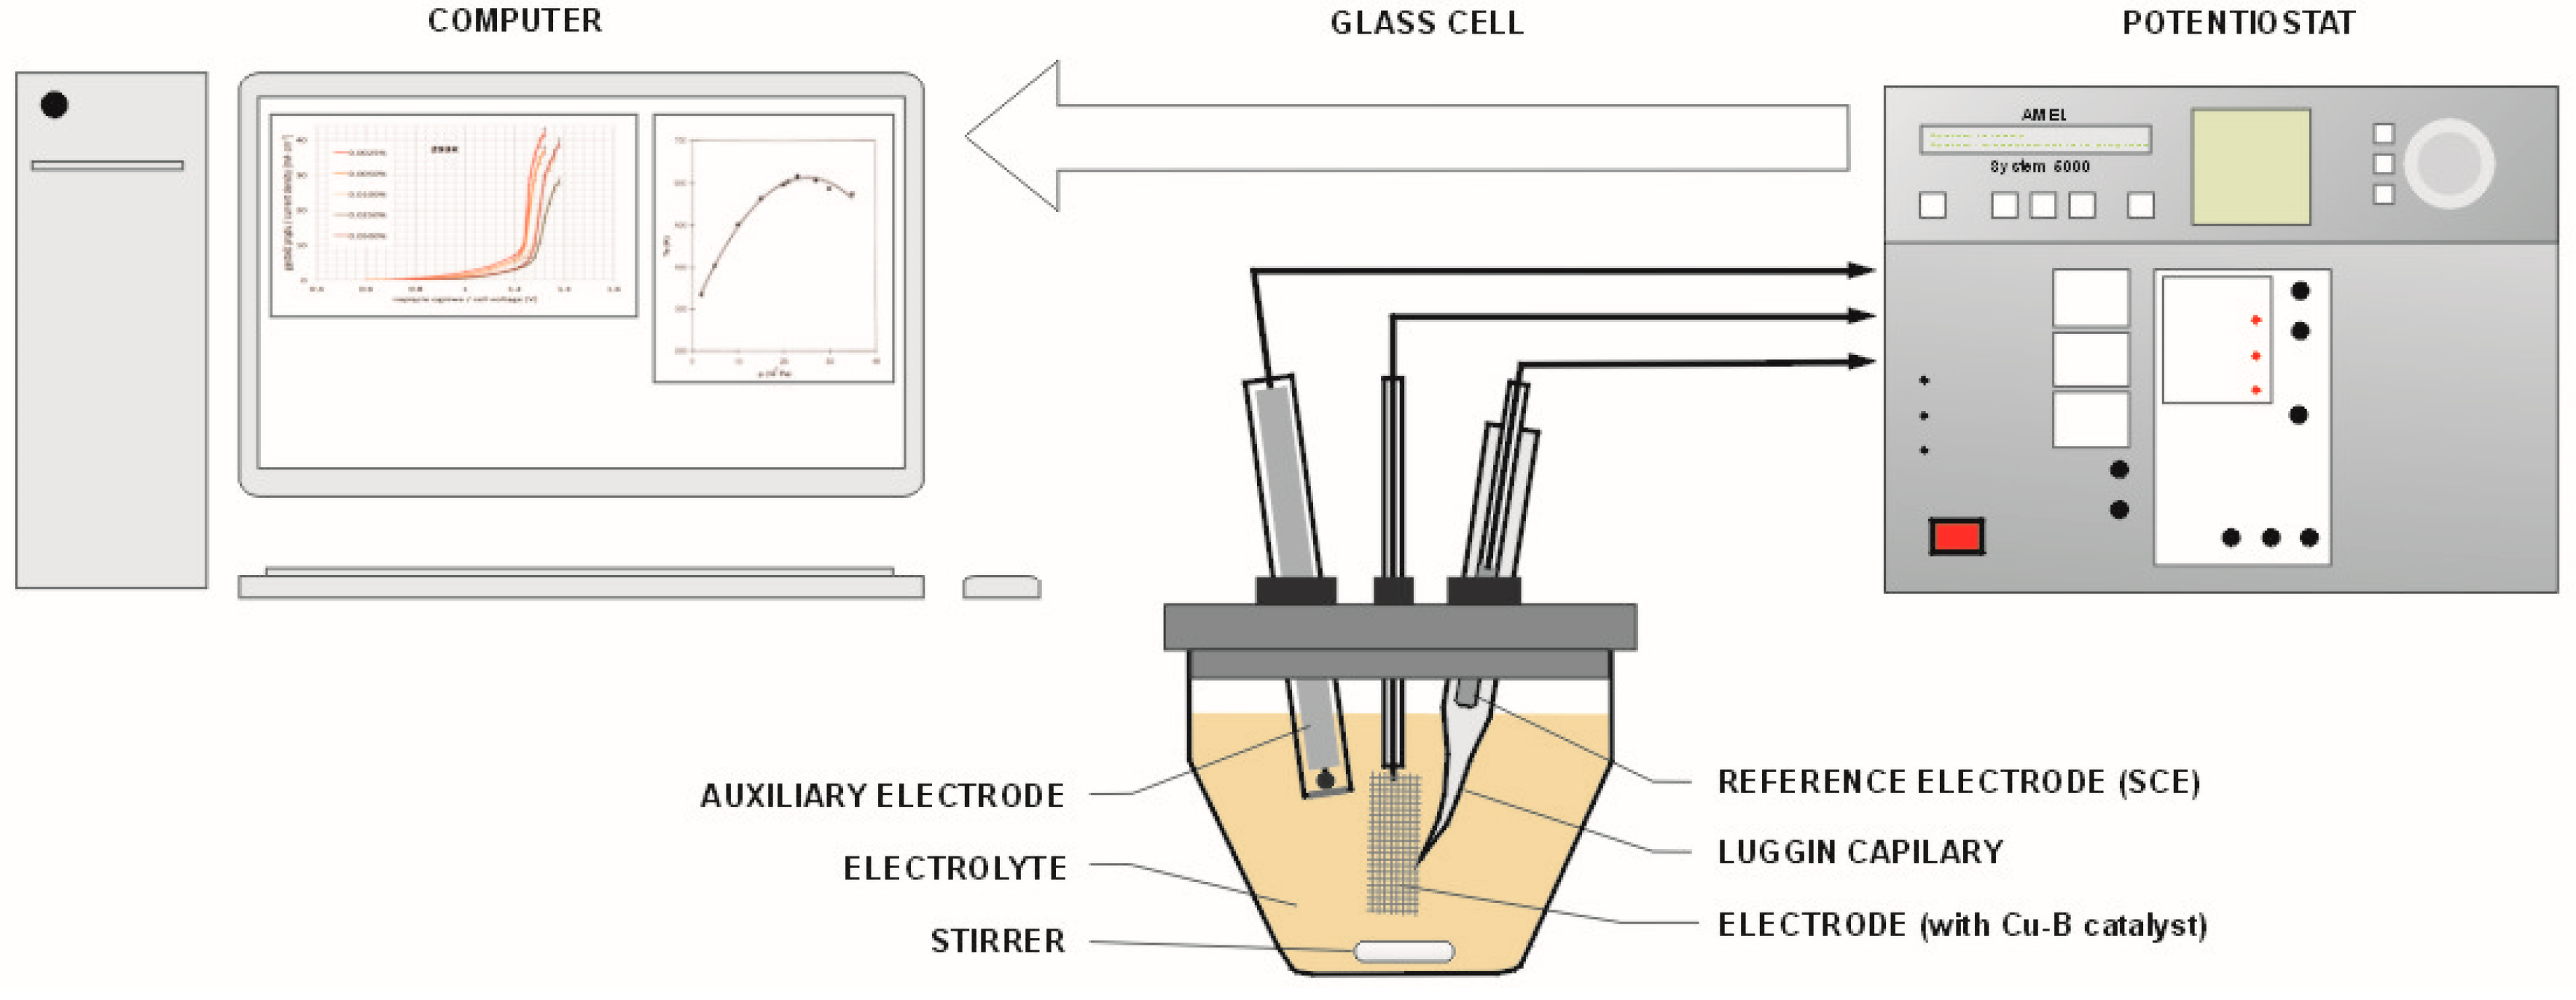
3.2. Selection of the Electrodes (with Cu–B Catalyst) for Measurements
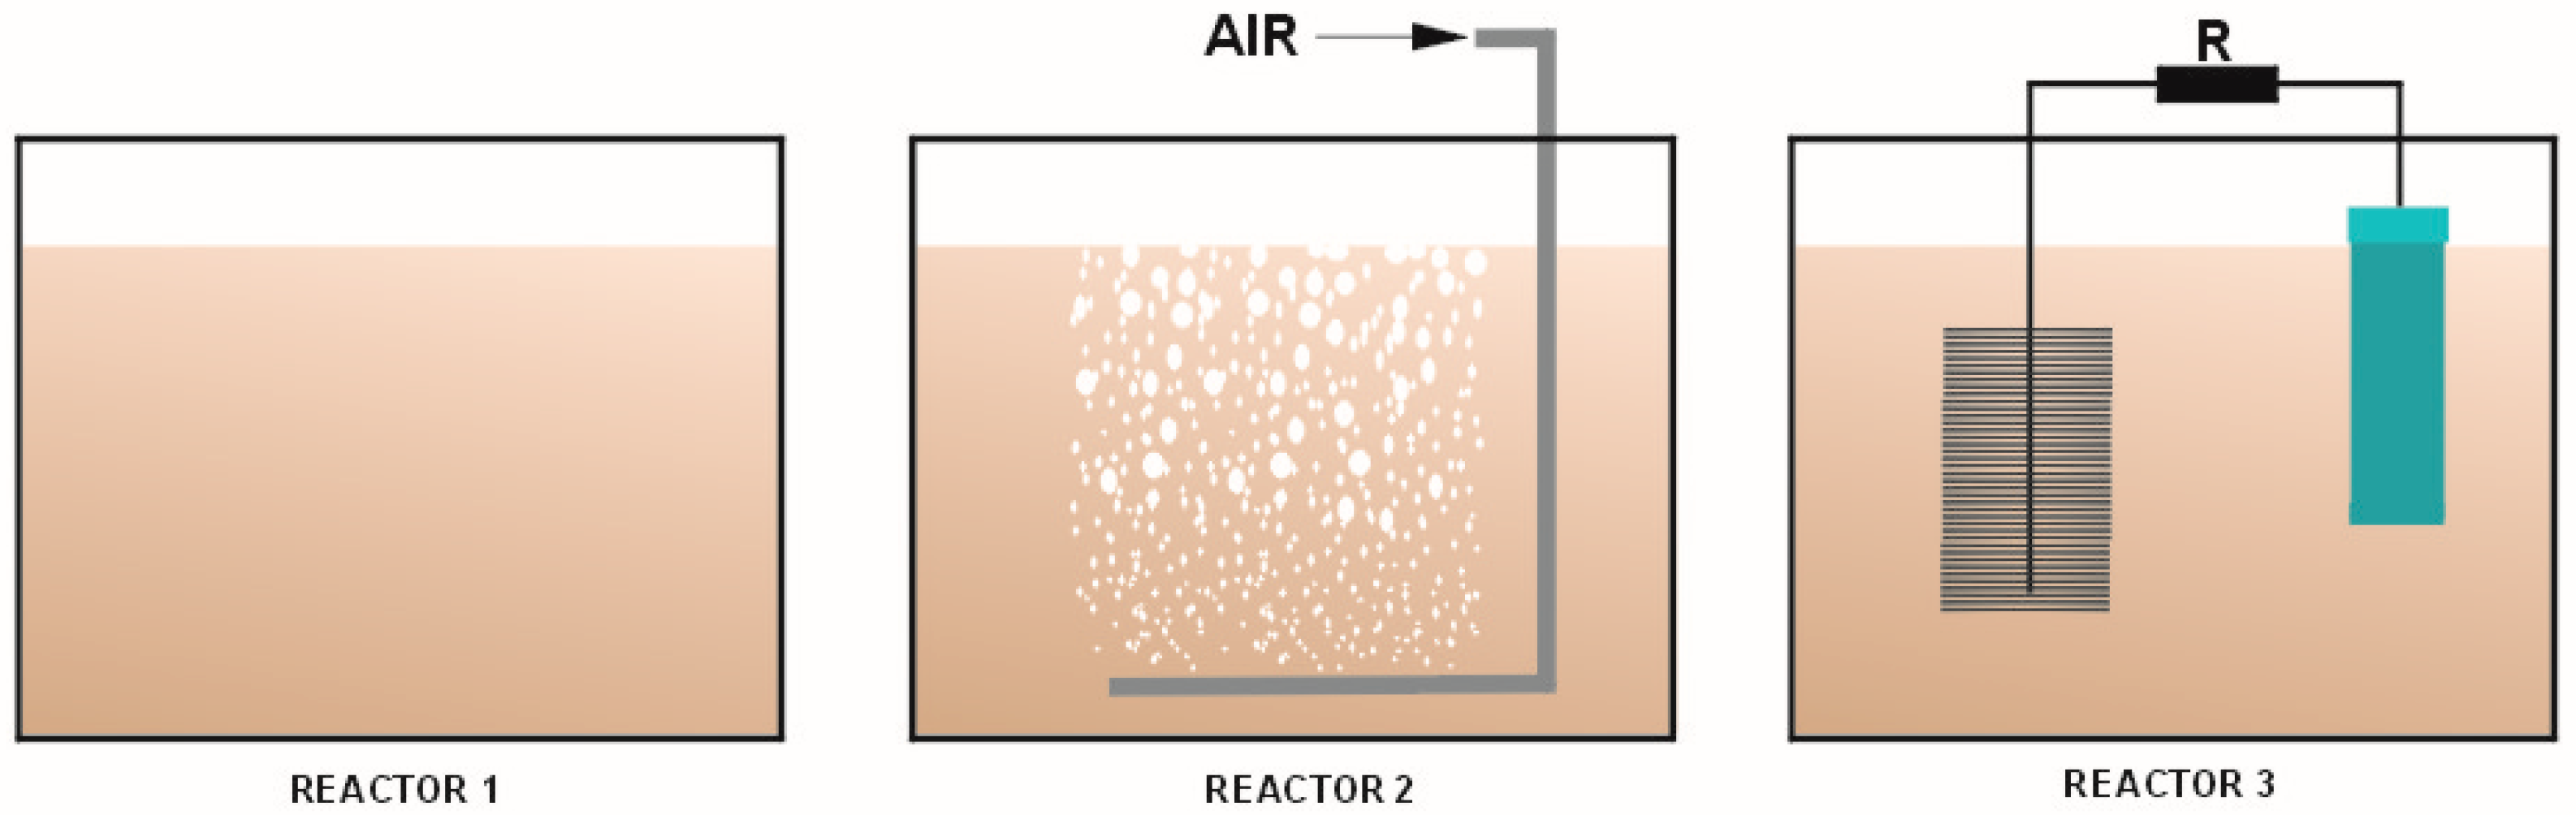
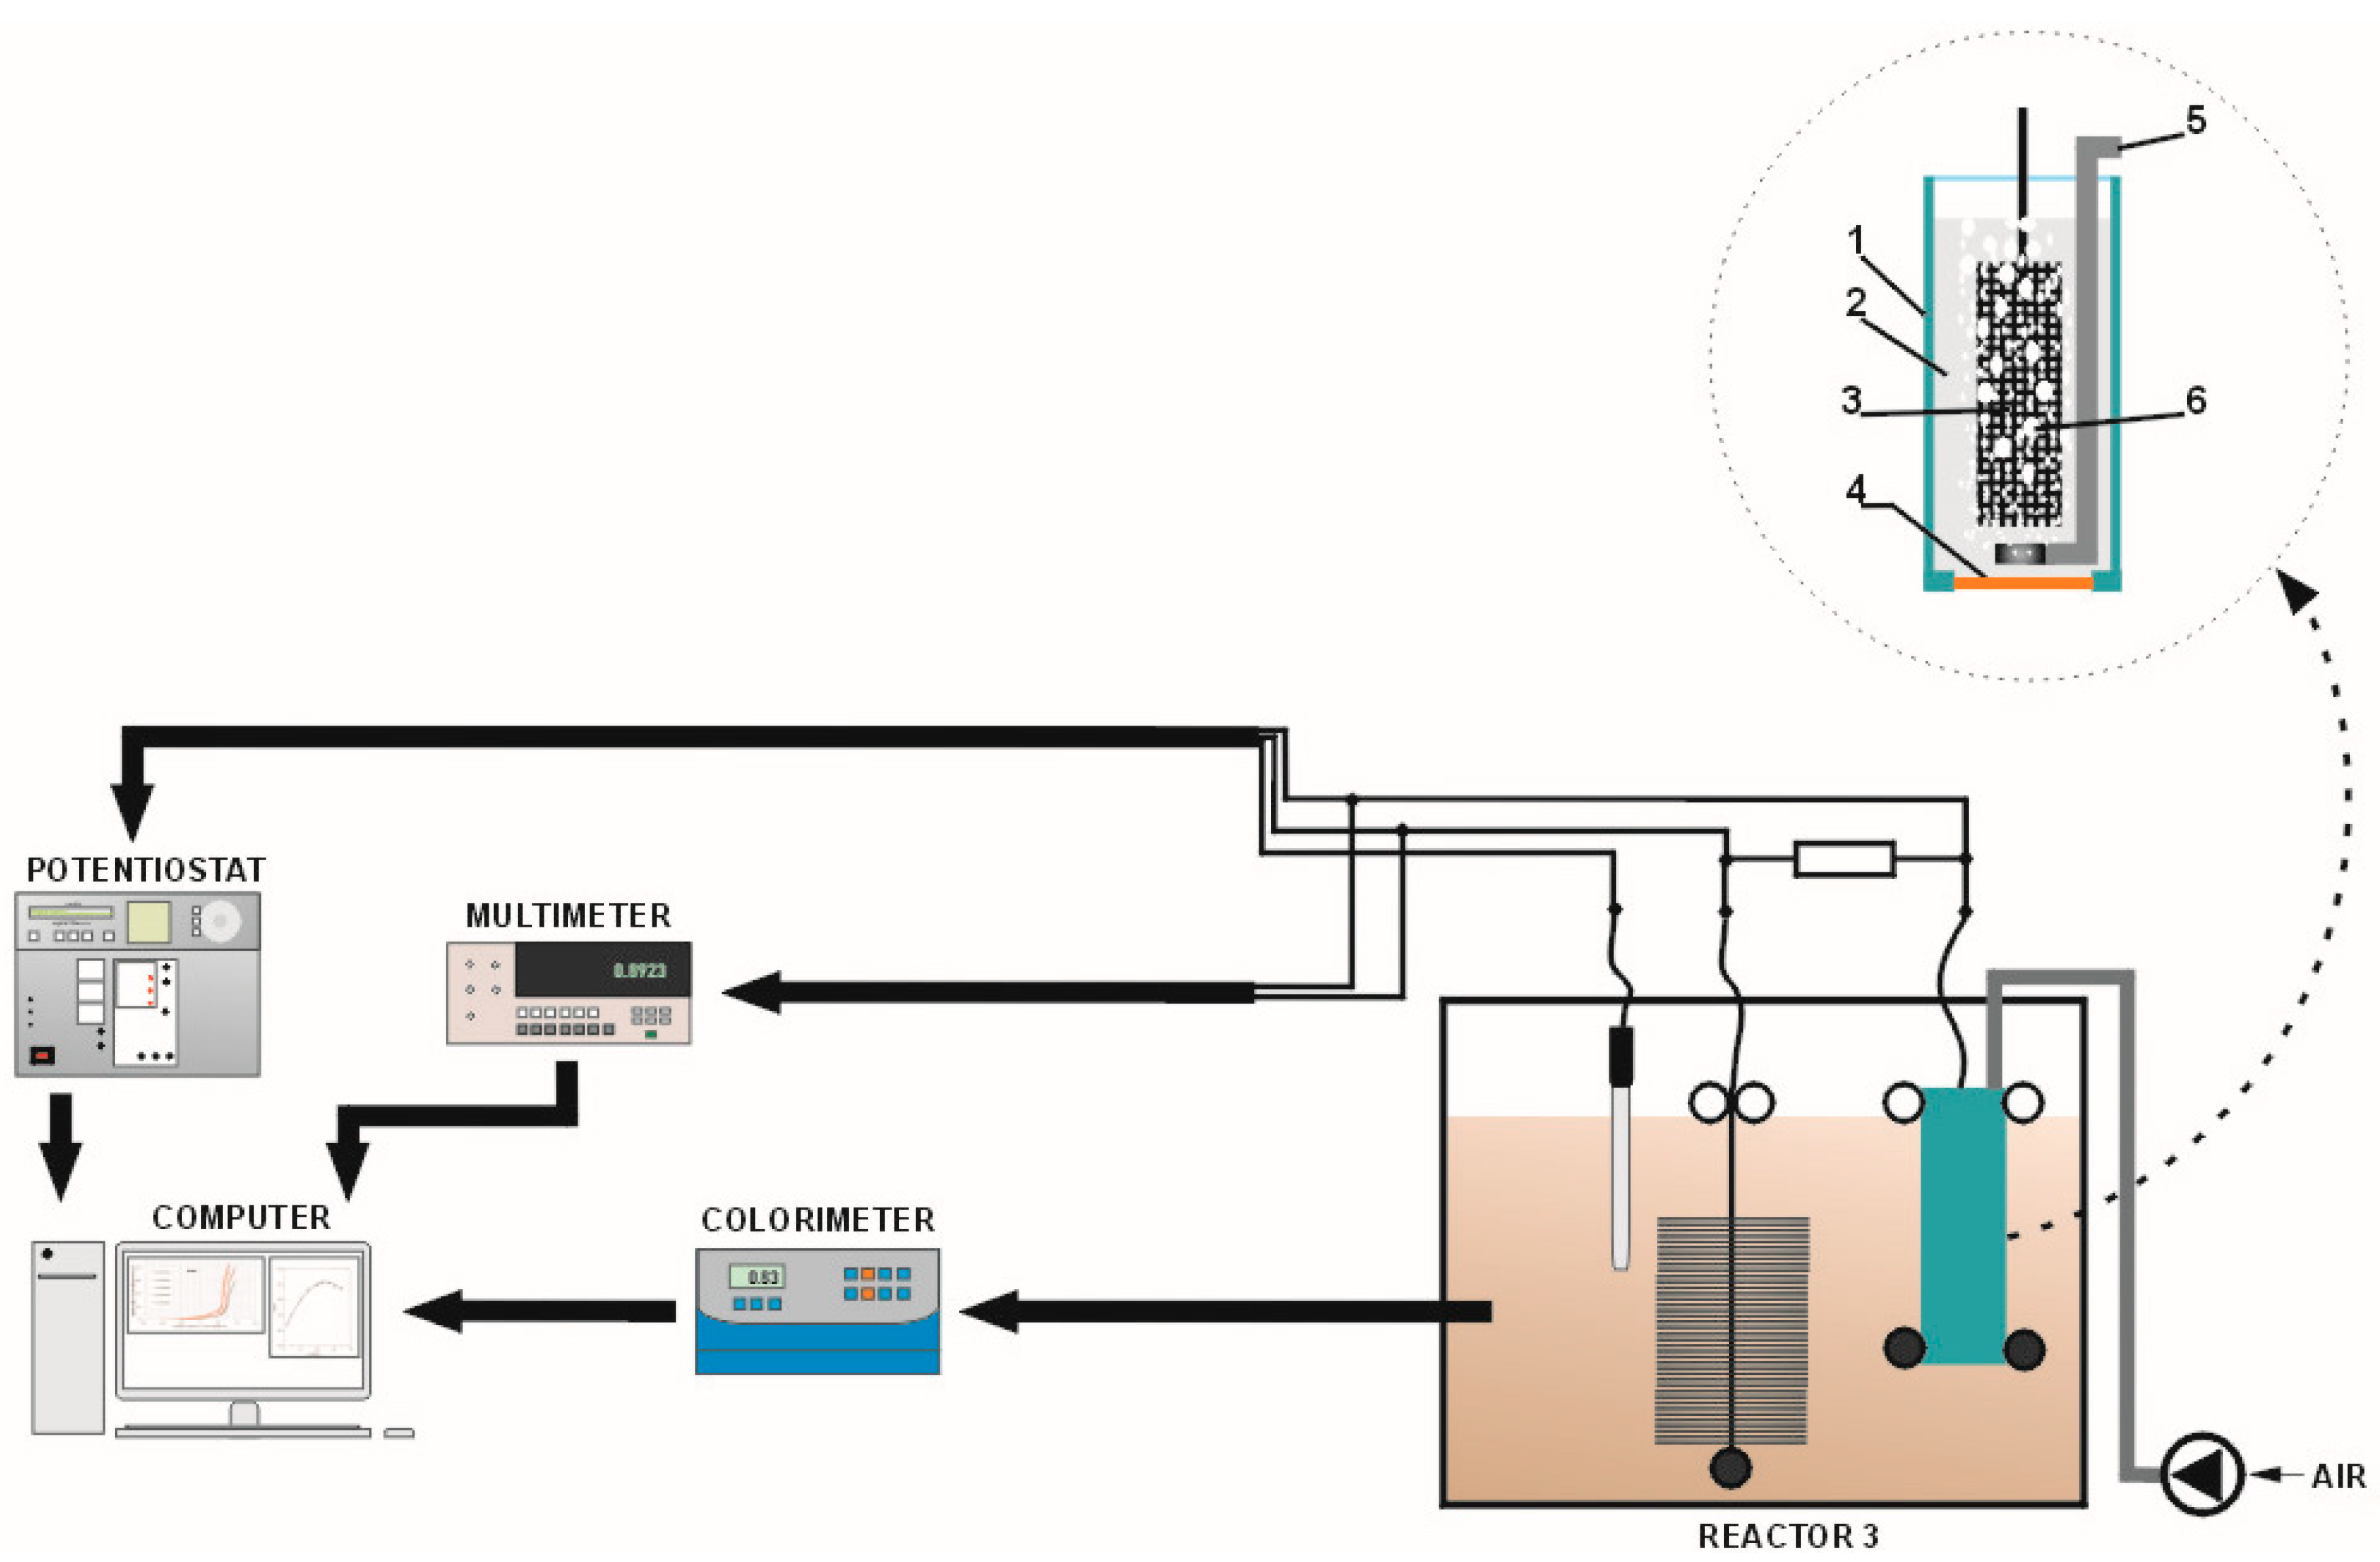
3.3. Measurements of Wastewater Treatment and Electricity Production in the MFC with a Cu–B Cathode
4. Conclusions
Author Contributions
Funding
Conflicts of Interest
References
- US EPA Report. Clean Watersheds Needs Survey Overview; United States Environmental Protection Agency: Galloway, NJ, USA, 2008.
- Logan, B. Microbial Fuel Cells; Wiley: Hoboken, NJ, USA, 2008. [Google Scholar]
- Rabaey, K.; Verstraete, W. Microbial fuel cells: Novel biotechnology for energy generation. Trends Biotechnol. 2005, 23, 291–298. [Google Scholar] [CrossRef] [PubMed]
- Sivasankar, V.; Mylsamy, P.; Omine, K. Microbial Fuel Cell Technology for Bioelectricity, 1st ed.; Springer: Berlin, Germany, 2018. [Google Scholar]
- Potter, M.C. Electrical effects accompanying the decomposition organic compounds. Proc. Roy. Soc. Lond. Ser. 1911, B84, 260–276. [Google Scholar] [CrossRef]
- Davis, J.B.; Yarbrough, H.F., Jr. Preliminary experiments on a microbial fuel cell. Science 1962, 137, 615–616. [Google Scholar] [CrossRef] [PubMed]
- Berk, R.S.; Canfield, J.H. Bioelectrochemical energy conversion. Appl. Microbiol. 1964, 12, 10–12. [Google Scholar] [PubMed]
- Lewis, K. Symposium on bioelectrochemistry of microorganisms: IV. Biochemical fuel cells. Bacteriol. Rev. 1966, 30, 101–113. [Google Scholar] [PubMed]
- Allen, R.M.; Benetto, H.P. Microbial fuel cells: Electricity production from carbohydrates. Appl. Biochem. Biotechnol. 1993, 39, 27–40. [Google Scholar] [CrossRef]
- Kim, B.H.; Park, H.S.; Shin, P.K.; Chang, I.S.; Kim, H.J. Mediator-Less Biofuel Cell. U.S. Patent 5,976,719, 2 November 1999. [Google Scholar]
- Kim, H.J.; Hyun, M.S.; Chang, I.S.; Kim, B.H. A microbial fuel cell type lactate biosensor using a metal-reducing bacterium. Shewanella Putrefaciens J. Microbiol. Biotechnol. 1999, 9, 365–367. [Google Scholar]
- Min, B.; Logan, B.E. Continuous electricity generation from domestic wastewater and organic substrates in a at plate microbial fuel cell. Environ. Sci. Technol. 2004, 38, 5809–5814. [Google Scholar] [CrossRef]
- Min, B.; Cheng, S.; Logan, B.E. Electricity generation using membrane and salt bridge microbial fuel cells. Water Res. 2005, 39, 1675–1686. [Google Scholar] [CrossRef]
- Logan, B.E.; Hamelers, B.; Rozendal, R.; Schroder, U.; Keller, J.; Verstraete, W.; Rabaey, K. Microbial Fuel Cells: Methodology and Technology. Environ. Sci. Technol. 2006, 40, 5181–5192. [Google Scholar] [CrossRef]
- Franks, A.E.; Nevin, K.P. Microbial fuel cells, a current review. Energies 2010, 3, 899–919. [Google Scholar] [CrossRef]
- Liu, H.; Ramnarayanan, R.; Logan, B.E. Production of electricity during wastewater treatment using a single chamber microbial fuel cell. Environ. Sci. Technol. 2004, 38, 2281–2285. [Google Scholar] [CrossRef] [PubMed]
- Rabaey, K.; Alterman, P.; Clauwaert, P.; De Schamphelaire, L.; Boon, N.; Verstraete, W. Microbial fuel cells in relation to conventional anaerobic digestion technology. Eng. Life Sci. 2006, 6, 285–292. [Google Scholar]
- Bond, D.R.; Lovley, D.R. Electricity production by Geobacter sulfurreducens attached to electrodes. Appl. Environ. Microbiol. 2003, 69, 1548–1555. [Google Scholar] [CrossRef]
- Chaudhuri, S.K.; Lovley, D.R. Electricity generation by direct oxidation of glucose in mediatorless microbial fuel cells. Nat. Biotechnol. 2003, 21, 1229–1232. [Google Scholar] [CrossRef] [PubMed]
- Kim, H.J.; Park, H.S.; Hyun, M.S.; Chang, I.S.; Kim, M.; Kim, B.H. A Mediator-Less Microbial Fuel Cell Using a Metal Reducing Bacterium. Shewanella Putrefaciens. Enzym. Microb. Technol. 2002, 30, 145–152. [Google Scholar] [CrossRef]
- Park, H.S.; Kim, B.H.; Kim, H.S.; Kim, H.J.; Kim, G.T.; Kim, M.; Chang, I.S.; Park, Y.K.; Chang, H.I. A novel electrochemically active and Fe(III)-reducing bacterium phylogenetically related to Clostridium butyricum isolated from a microbial fuel cell. Anaerobe 2001, 7, 297–306. [Google Scholar] [CrossRef]
- Pham, C.A.; Jung, S.J.; Phung, N.T.; Lee, J.; Chang, I.S.; Kim, B.H.; Yi, H.; Chun, J. A novel electrochemically active and Fe(III)-reducing bacterium phylogenetically related to Aeromonas hydrophila, isolated from a microbial fuel cell. FEMS Microbiol. Lett. 2003, 223, 129–134. [Google Scholar] [CrossRef]
- Bond, D.R.; Lovley, D.R. Evidence for involvement of an electron shuttle in electricity generation by Geothrix fermentans. Appl. Environ. Microbiol. 2005, 71, 2186–2189. [Google Scholar] [CrossRef]
- Reguera, G.; McCarthy, K.D.; Mehta, T.; Nicoll, J.S.; Tuominen, M.T.; Lovley, D.R. Extracellular electron transfer via microbial nanowires. Nature 2005, 435, 1098–1101. [Google Scholar] [CrossRef]
- Reguera, G.; Nevin, K.P.; Nicoll, J.S.; Covalla, S.F.; Woodard, T.L.; Lovley, D.R. Biofilm and nanowire production leads to incre- ased current in Geobacter sulfurreducens fuel cells. Appl. Environ. Microbiol. 2006, 72, 7345–7348. [Google Scholar] [CrossRef] [PubMed]
- Patil, S.A.; Surakasi, V.P.; Koul, S.; Ijmulwar, S.; Vivek, A.; Shouche, Y.S.; Kapadnis, B.P. Electricity generation using chocolate industry wastewater and its treatment in activated sludge based microbial fuel cell and analysis of developed microbial community in the anode chamber. Bioresour. Technol. 2009, 100, 5132–5139. [Google Scholar] [CrossRef] [PubMed]
- Logan, B.E.; Regan, J.M. Electricity-producing bacterial communities in microbial fuel cells. Trends Microbiol. 2006, 14, 512–518. [Google Scholar] [CrossRef] [PubMed]
- Logan, B.E.; Regan, J.M. Microbial fuel cells—Challenges and applications. Environ. Sci. Technol. 2006, 40, 5172–5180. [Google Scholar] [CrossRef] [PubMed]
- Asensio, Y.; Montes, I.B.; Fernández-Marchante, C.M.; Lobato, J.; Cañizares, P.; Rodrigo, M.A. Selection of cheap electrodes for two-compartment microbial fuel cells. J. Electroanal. Chem. 2017, 785, 235–240. [Google Scholar] [CrossRef]
- Erbay, C.; Yang, G.; de Figueiredo, P.; Sadr, R.; Yu, C.; Han, A. Three-dimensional porous carbon nanotube sponges for high-performance anodes of microbial fuel cells. J. Power Sources 2015, 298, 177–183. [Google Scholar] [CrossRef]
- Liu, Y.; Harnisch, F.; Fricke, K.; Schroeder, U.; Climent, V.; Feliu, J.M. The study of electrochemically active microbial biofilms on different carbon-based anode materials in microbial fuel cells. Biosens. Bioelectron. 2010, 25, 2167–2171. [Google Scholar] [CrossRef] [PubMed]
- Penteado, E.D.; Fernández-Marchante, C.M.; Zaiat, M.; Cañizares, P.; Gonzalez, E.R.; Rodrigo, M.A. Influence of carbon electrode material on energy recovery from winery wastewater using a dual-chamber microbial fuel cell. Environ. Technol. 2017, 38, 1333–1341. [Google Scholar] [CrossRef]
- Yuan, Y.; Zhou, S.; Zhuang, L. Polypyrrole/carbon black composite as a novel oxygen reduction catalyst for microbial fuel cells. J. Power Sources 2010, 195, 3490–3493. [Google Scholar] [CrossRef]
- Zuo, K.; Liang, S.; Liang, P.; Zhou, X.; Sun, D.; Zhang, X.; Huang, X. Carbon filtration cathode in microbial fuel cell to enhance wastewater treatment. Bioresour. Technol. 2015, 185, 426–430. [Google Scholar] [CrossRef]
- Dumas, C.; Mollica, A.; Féron, D.; Basséguy, R.; Etcheverry, L.; Bergel, A. Marine microbial fuel cell: Use of stainless steel electrodes as anode and cathode materials. Electrochim. Acta 2006, 53, 468–473. [Google Scholar] [CrossRef]
- Martin, E.; Tartakovsky, B.; Savadogo, O. Cathode materials evaluation in microbial fuel cells: A comparison of carbon, Mn2O3, Fe2O3 and platinum materials. Electrochim. Acta 2011, 58, 58–66. [Google Scholar] [CrossRef]
- Bockris, J.O.M.; Reddy, A.K.N. Modern Electrochemistry; Kulwer Academic/Plenum Publishers: New York, NY, USA, 2000. [Google Scholar]
- Twigg, M.V. Catalyst Handbook; Wolfe Publishing Ltd.: London, UK, 1989. [Google Scholar]
- Cheng, S.; Liu, H.; Logan, B.E. Power densities using different cathode catalysts (Pt and CoTMPP) and polymer binders (Nafion and PTFE) in single chamber microbial fuel cells. Environ. Sci. Technol. 2006, 40, 364–369. [Google Scholar] [CrossRef] [PubMed]
- Wu, W.; Niu, H.; Yang, D.; Wang, S.-B.; Wang, J.; Lin, J.; Hu, C. Controlled layer-by-layer deposition of carbon nanotubes on electrodes for microbial fuel cells. Energies 2019, 12, 363. [Google Scholar] [CrossRef]
- McMurry, J.E.; Ballantine, D.S.; Hoeger, C.A.; Peterson, V.E.; Castellion, M.E. Fundamentals of Inorganic, Organic and Biological Chemistry; Pearson: London, UK, 2009. [Google Scholar]
- Włodarczyk, B.; Włodarczyk, P.P. Microbial fuel cell with Cu–B cathode powering with wastewater from yeast production. J. Ecol. Eng. 2017, 18, 224–230. [Google Scholar] [CrossRef]
- Łomotowski, J.; Szpindor, A. Modern Wastewater Treatment Systems (in Polish); Arkady: Warsaw, Poland, 2002. [Google Scholar]
- Włodarczyk, B.; Włodarczyk, P.P. Microbial fuel cell with Ni-Co cathode powered with yeast wastewater. Energies 2018, 11, 3194. [Google Scholar] [CrossRef]
- Włodarczyk, B.; Włodarczyk, P.P. Use of Ni-Co alloy as cathode catalyst in single chamber microbial fuel cell. Ecol. Eng. 2017, 18, 210–216. [Google Scholar] [CrossRef]
- Włodarczyk, B.; Włodarczyk, P.P. Methanol electrooxidation with Cu–B catalyst. Infrastruct. Ecol. Rural Areas (Polish Acad. Sci. Crac.) 2016, 4, 1483–1492. [Google Scholar] [CrossRef]
- Włodarczyk, B.; Włodarczyk, P.P. Electricity production in microbial fuel cell with Cu–B alloy as catalyst of anode. Civ. Eng. QUAESTI 2015, 3, 305–308. [Google Scholar] [CrossRef]
- Włodarczyk, P.P.; Włodarczyk, B. Possibility of Using Ni-Co Alloy as Catalyst for Oxygen Electrode of Fuel Cell. Chin. Bus. Rev. 2015, 14, 159–167. [Google Scholar] [CrossRef]
- Włodarczyk, P.P.; Włodarczyk, B. Ni-Co alloy as catalyst for fuel electrode of hydrazine fuel cell. China-USA Bus. Rev. 2015, 14, 269–279. [Google Scholar] [CrossRef]
- Huggins, T.; Fallgren, P.H.; Jin, S.; Ren, Z.J. Energy and performance comparison of microbial fuel cell and conventional aeration treating of wastewater. J. Microb. Biochem. Technol. 2013, S6:002, 1–5. [Google Scholar] [CrossRef]
- Ren, Z.; Yan, H.; Wang, W.; Mench, M.M.; Regan, J.M. Characterization of microbial fuel cells at microbially and electrochemically meaningful time scales. Environ. Sci. Technol. 2011, 45, 2435–2441. [Google Scholar] [CrossRef] [PubMed]


| Component | Volume |
|---|---|
| NaBH4 | 0.02 mol·L−1 |
| CuSO4·7H2O | 0.05 mol·L−1 |
| NaOH | 1.00 mol·L−1 |
| Trilon B | 0.12 mol·L−1 |
| Parameter | Value |
|---|---|
| COD [mg·L−1] | 1811.0 |
| NH4+ [mg·L−1] | 11.1 |
| NO3– [mg·L−1] | 4.2 |
| pH | 6.5 |
© 2019 by the authors. Licensee MDPI, Basel, Switzerland. This article is an open access article distributed under the terms and conditions of the Creative Commons Attribution (CC BY) license (http://creativecommons.org/licenses/by/4.0/).
Share and Cite
Włodarczyk, P.P.; Włodarczyk, B. Wastewater Treatment and Electricity Production in a Microbial Fuel Cell with Cu–B Alloy as the Cathode Catalyst. Catalysts 2019, 9, 572. https://doi.org/10.3390/catal9070572
Włodarczyk PP, Włodarczyk B. Wastewater Treatment and Electricity Production in a Microbial Fuel Cell with Cu–B Alloy as the Cathode Catalyst. Catalysts. 2019; 9(7):572. https://doi.org/10.3390/catal9070572
Chicago/Turabian StyleWłodarczyk, Paweł P., and Barbara Włodarczyk. 2019. "Wastewater Treatment and Electricity Production in a Microbial Fuel Cell with Cu–B Alloy as the Cathode Catalyst" Catalysts 9, no. 7: 572. https://doi.org/10.3390/catal9070572
APA StyleWłodarczyk, P. P., & Włodarczyk, B. (2019). Wastewater Treatment and Electricity Production in a Microbial Fuel Cell with Cu–B Alloy as the Cathode Catalyst. Catalysts, 9(7), 572. https://doi.org/10.3390/catal9070572