Article

Modeling and Simulations of NOx and SO2 Seawater Scrubbing in Packed-Bed Columns for Marine Applications

Department of Chemical Engineering, Laval University 1065, Avenue de la Médecine, Québec, QC G1V 0A6, Canada
*
Author to whom correspondence should be addressed.
Catalysts 2019, 9(6), 489; https://doi.org/10.3390/catal9060489
Submission received: 2 May 2019 / Revised: 14 May 2019 / Accepted: 17 May 2019 / Published: 28 May 2019
(This article belongs to the Special Issue Reactors and Models in Catalysis)

Abstract

:
Seawater scrubbing of nitrogen oxides and sulfur oxide from marine emissions was simulated in packed-bed columns exposed to static inclination and heaving/oscillating motions. Fourth generation random packings (Raschig super-Rings) while providing much smaller pressure drop than traditional Pall-Rings ensure comparable absorption efficiency for the pollutants. Complete removal of SO2 was predicted over the tested pressure range with absorption efficiency indifferent to scrubber inclination or heaving/oscillating motions. In contrast, NOx and CO2 absorptions are negatively impacted for inclined seawater scrubbers. Removal efficiency is not lowered significantly owing to larger scrubber pressure and because diffusion of N2O4 into the liquid phase is associated with a rapid pseudo first-order reaction. The asymmetrical oscillating motion of the scrubber degrades the removal performance which exhibits wavy patterns close to the steady-state solution of the average inclination angle. NO and CO2 absorption performance waves are moving toward a steady-state solution of vertical scrubber when the asymmetry of the two inclined positions of the scrubber downgrades. Symmetric oscillation and heaving motion led to performance disturbance waves around a steady-state solution of the vertical scrubber which are determined by the parameters of angular/heaving motion.

1. Introduction

Marine shipping represents more than 90% of the whole international commerce [1] and is the highest energy-efficient way for long-distance transport. However, the shipping emissions affect significantly the ocean ecosystems and human health [2]. Sulfur and nitrogen oxides, and particulate matter emissions from marine diesel engines have a significant impact on the environment and are moved to a certain extent over the continental land where they enhance the ground-based pollutant load. SO2 initiates acid rains and NOx emissions generate photochemical smog, which increases the level of ozone in the lower atmosphere, and dangerous organic compounds [3]. Particulate matter (condensed hydrocarbons and sulphates) can insert in the lungs and attempt the circulation system, giving cardiovascular and pulmonary illnesses [3].
Sulfur and nitrogen oxides can be eliminated from the exhaust gas via typical selective catalytic/non-catalytic reduction and flue gas desulfurization processes [4,5,6] which enhance the complexity of the equipment, the capital cost and the energy need [5]. Additionally, the selective catalytic reduction is challenged by the deactivation of the catalyst by SO2 and selective non-catalytic reduction needs elevated temperatures (900–1000 °C) with complex temperature control to prevent ammonia slip and to conclude the NOx removal process. Alternatively, the removal of NOx and SOx involves processes that apply the nitric and sulfuric acid chemistry. Keilin and Wallit [7] proposed a process where, in the presence of NO2, SO2 is oxidized to SO3 which is absorbed in water in a sulfuric acid absorber. The recycled sulfuric acid is utilized to absorb NO and directed in a catalytic stripping column where NO is oxidized to NO2. NO2 generated in the catalytic stripping column is reprocessed in SO2 oxidation reactor or removed, the excess, as HNO3 in a nitric acid absorber. White et al. [8] suggested a low-temperature process that removes sulfur and nitrogen oxides in two absorption columns connected in series. Direct oxidation of NO to NO2 at high pressure replaces NO catalytic oxidation. The first absorption column works at intermediate pressure and is mainly in charge of SO2 absorption and the second absorption column removes the non-absorbed NO2 at high pressure. Iloeje et al. [5] modified this two-column process design with a single reactive absorption column operated at high pressure which succeeds the complete removal of SOx and NOx.
In the above-mentioned land-based NOx and SO2 removal processes, water can be substituted with seawater and sulfur and nitrogen oxides removal by scrubbing can be applied on marine ships. The major advantage of performing with seawater includes the simultaneous elimination of NOx and SO2 from exhaust gas, undemanding plant design, compact scrubber system, no chemicals and absence of solid by-products. Furthermore, in the case of open loop scrubbers the acidified effluent is discharged into the ocean after neutralization [9]. Additionally, seawater scrubbers working under pressure excludes the losing of marine engines power because of the backpressure (no need to compensate the backpressure as in the case of seawater scrubbers operated at atmospheric pressure). Moreover, at large pressure SO2 is totally removed even if the content of sulfur in the fuel is larger than 3.5%. SO2 seawater scrubbing becomes a promising alternative for marine applications, which allows for the use of Heavy Fuel Oil as a substitute of high-priced low sulfur fuels, such as Marine Diesel Oil or Marine Gas Oil imposed by International Maritime Organization which established stringent limits on NOx and SOx emissions of marine diesel engines [10,11]. In marine shipping the fuel cost is two-thirds of the total transportation cost, explaining while the substitution of Heavy Fuel Oil (3.5–4.5% w/w S) with Marine Diesel Oil (1.0% w/w S) or Marine Gas Oil (0.1% w/w S) would involve a substantial increase of costs [1,6].
A limited number of studies have been focusing on the sulfur and nitrogen oxides removal from marine emissions. Andreasen and Mayer [12] studied SO2 seawater scrubbing of marine engine exhaust gas at different values of SO2 concentration, seawater temperature, alkalinity and salinity and noticed that SO2 absorption capacity reduces with the decline of alkalinity and salinity and SO2 removal capacity of normal seawater is approximatively two times larger than of brackish water. Moreover, Darake et al. [13] studied experimentally and theoretically SO2 seawater scrubbing of flue gas from industrial plants in a countercurrent packed-bed column and found that liquid and gas flow rates, gas temperature and SO2 concentration affect significantly SO2 removing efficiency. Nielsen et al. [1] exposed the modeling and design of an ingenious marine machinery system, with potential in marine applications concerning both the environment and energy, which incorporates a waste heat recovery system and the removal of SO2 via a wet sulfuric acid process. Tang et al. [14] investigated the desulphurization efficiency of a magnesium-based seawater scrubber on-board large marine ships and found that the ratio between the liquid and gas flow rates and pH are key parameters influencing the desulphurization efficiency. Flagiello et al. [9] analyzed experimentally and theoretically SO2 removal from flue gas in a seawater packed-bed column filled with a structured packing (Mellapak 250X) at 0.1 MPa and 25 °C. Yang et al. [6] proposed the removal of NOx and SO2 from ship emissions in a semi-continuous bubble column reactor using electrolyzed seawater. The results illustrate that NOx removal efficiency can be improved by the increase of the inlet NO concentration, the concentration of CO2 and O2 (coexisting gases), reaction temperature and active chlorine concentration, but is impeded by the increase of the gas velocity.
However, there are important operative and technical challenges to managing sulfur and nitrogen oxides removal on-board large marine ships and offshore processing platforms, the one more noticeable being the impact of weather and ocean conditions on the performance of absorption process. Packed-bed columns for seawater scrubbing of marine engine exhaust gas on-board large marine ships and floating production, storage and offloading (FPSO) nonstationary platforms may be defined by the ocean physical constraints (ocean state, surface ocean currents because of the wind, wind waves and weather variables) via heaving and angular ship motions which could possibly change the seawater scrubber functioning [15,16,17]. Therefore, the best design of absorption packed-bed columns working in changeable ocean conditions requests for advanced comprehension and quantification of the hydrodynamics, mass and energy transport associated with the reaction kinetics and thermodynamics [15,16]. Furthermore, the exploitation of offshore seawater scrubbers demands corrective design measures to preempt, or to compensate for, any deviation in removal efficiency with respect to conventional onshore sulfur and nitrogen oxides removal units [18].
Even if the progression realized in the modeling and design of sulfur and nitrogen oxides removal from the marine exhaust gas is evident none of the available investigations attempted to explore the case of NOx and SOx seawater scrubbing in packed-bed columns on-board large marine ships or offshore floating nonstationary platforms. This study presents an analysis about the performance of simultaneous removal of SO2, NOx and CO2 (coexisting gas) by seawater scrubbing in countercurrent random packed-bed columns exposed to static inclination and rolling/heaving motion (Figure 1) via a Eulerian 3-D dynamic model. The performance attained in inclined and oscillating/heaving seawater scrubbing packed-bed columns is compared with the removal efficiency in a standard vertical column. The impact of angular/heaving motion parameters on gas-liquid flow hydrodynamics and removal efficiency is highlighted.

2. Mathematical Model

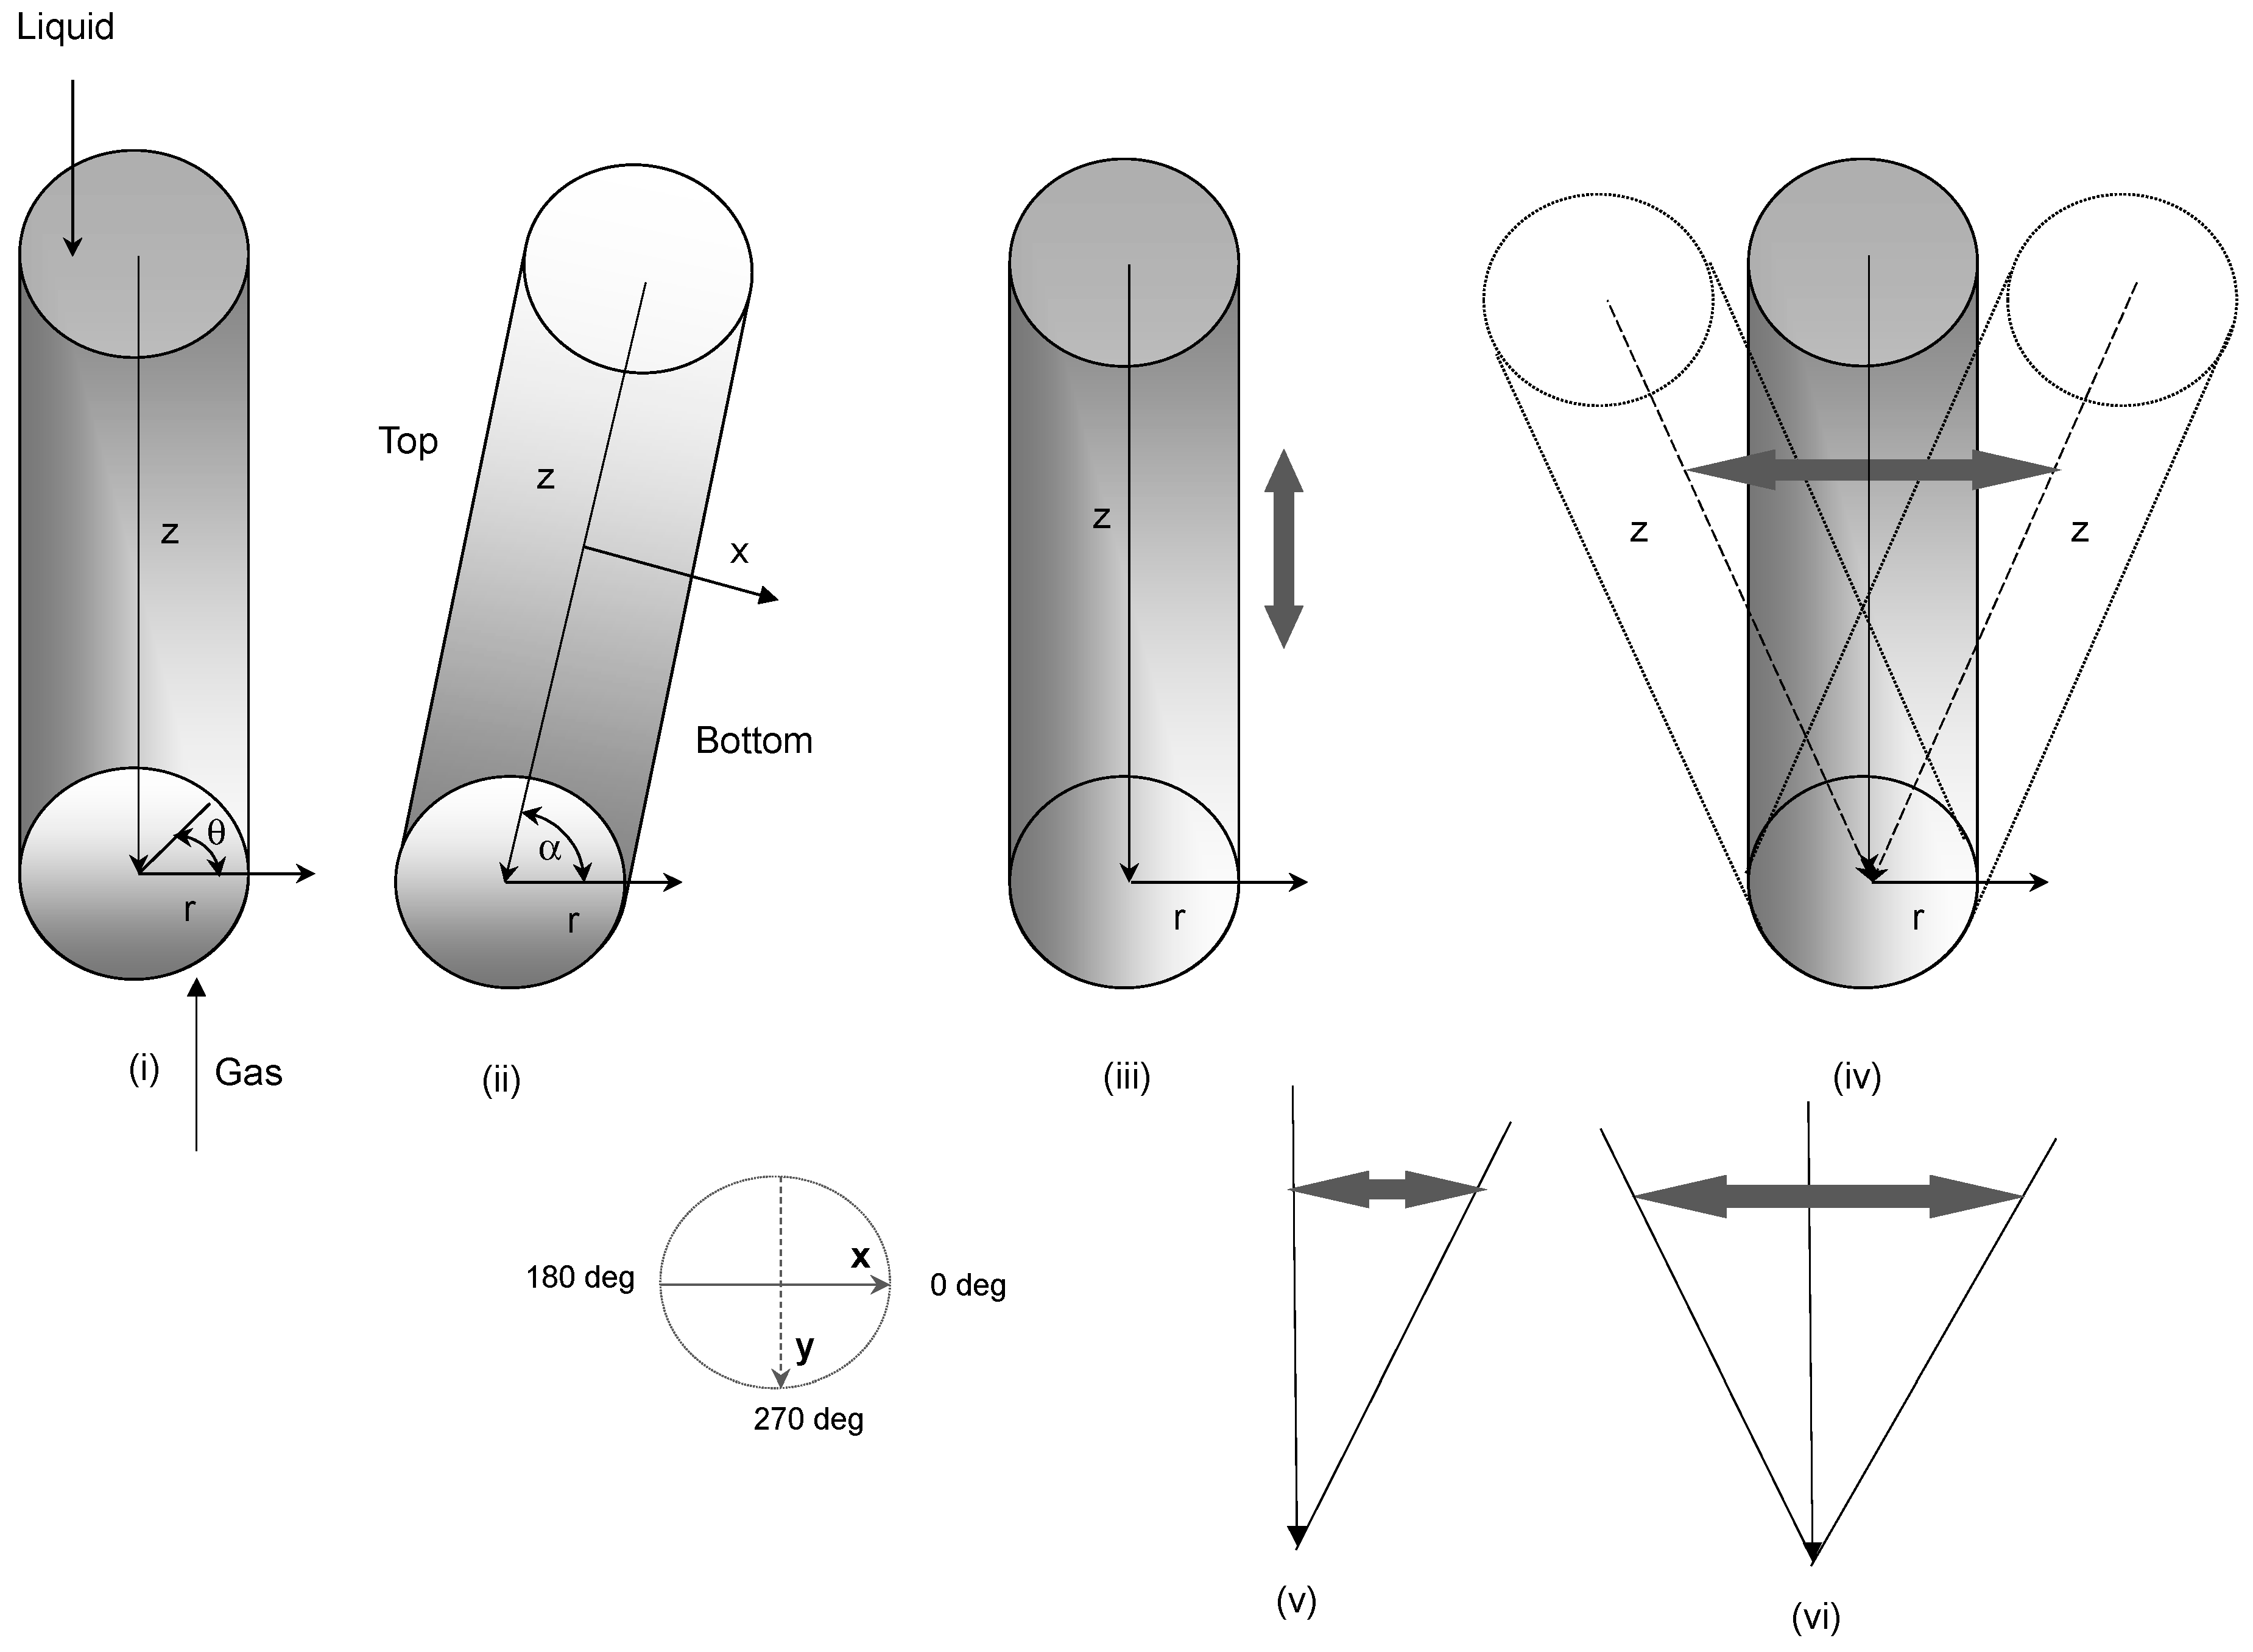
2.1. Hydrodynamic Model

The hydrodynamic platform is the basis of the more complex model of countercurrent random packed-bed columns on-board marine ships and offshore floating units used for the simultaneous seawater absorption of SO2, NOx and CO2. A Eulerian 3-D model was proposed for two-phase unsteady flow (assumed annular and separated) in vertical, inclined and oscillating/heaving countercurrent packed-bed columns. 3-D hydrodynamic model includes volume-averaged momentum and continuity equations, closures equations for interphase drag forces (evaluated via the two-zone two-fluid model developed by Iliuta et al. [19]), mechanical dispersion forces (result of velocity fluctuation in the tortuous packed bed structure–[20,21,22]) and gas-liquid pressure discontinuity [23]. For the episode of heaving motion, the axial momentum balance equations were amended with the heaving acceleration term. The model has been presented elsewhere [22,24,25,26] and is only succinctly summarized here:
● Continuity and momentum balance equations for the incompressible and viscous Newtonian liquid phase,
t ( ρ ε ) + z ( ρ ε u z ) + 1 r r ( r ρ ε u r ) + 1 r θ ( ρ ε u θ ) = 0 ,
t ( ρ ε u z ) + u r r ( ρ ε u z ) + u θ r θ ( ρ ε u z ) + u z z ( ρ ε u z ) = ε P z + μ e f [ 1 r r ( r ( ε u z ) r ) + 1 r 2 2 ( ε u z ) θ 2 + 2 ( ε u z ) z 2 ] + ε ρ ( g + a h ) sin α + f int , , z + F d , , z m ,
t ( ρ ε u r ) + u r r ( ρ ε u r ) + u θ r θ ( ρ ε u r ) ρ u θ 2 ε r + u z z ( ρ ε u r ) = ε P r + μ e f [ r ( 1 r ( r ε u r ) r ) + 1 r 2 2 ( ε u r ) θ 2 + 2 ( ε u r ) z 2 2 r 2 ( ε u θ ) θ ] + ε ρ g cos α cos θ + f int , , r + F d , , r m
t ( ρ ε u θ ) + u r r ( ρ ε u θ ) + u θ r θ ( ρ ε u θ ) + ρ u θ u r ε r + u z z ( ρ ε u θ ) = ε r P θ + μ e f [ r ( 1 r ( r ε u θ ) r ) + 1 r 2 2 ( ε u θ ) θ 2 + 2 ( ε u θ ) z 2 + 2 r 2 ( ε u r ) θ ] ε ρ g cos α sin θ + f int , , θ + F d , , θ m
● Continuity and momentum balance equations for the viscous Newtonian and ideal gas phase,
t ( ρ g ε g ) + z ( ρ g ε g u g z ) + 1 r r ( r ρ g ε g u g r ) + 1 r θ ( ρ g ε g u g θ ) = j N j a M j ,
t ( ρ g ε g u g z ) + u g r r ( ρ g ε g u g z ) + u g θ r θ ( ρ g ε g u g z ) + u g z z ( ρ g ε g u g z ) = ε g P g z + μ g e f [ 1 r r ( r ( ε g u g z ) r ) + 1 r 2 2 ( ε g u g z ) θ 2 + 2 ( ε g u g z ) z 2 ] + ε g ρ g ( g + a h ) sin α + f int , g , z + F d , g , z m ,
t ( ρ g ε g u g r ) + u g r r ( ρ g ε g u g r ) + u g θ r θ ( ρ g ε g u g r ) ρ g u g θ 2 ε g r + u g z z ( ρ g ε g u g r ) = ε g P g r + μ g e f [ r ( 1 r ( r ε g u g r ) r ) + 1 r 2 2 ( ε g u g r ) θ 2 + 2 ( ε g u g r ) z 2 2 r 2 ( ε g u g θ ) θ ] + ε g ρ g g cos α cos θ + f int , g , r + F d , g , r m ,
t ( ρ g ε g u g θ ) + u g r r ( ρ g ε g u g θ ) + u g θ r θ ( ρ g ε g u g θ ) + ρ g u g θ u g r ε g r + u g z z ( ρ g ε g u g θ ) = ε g r P g θ + μ g e f [ r ( 1 r ( r ε g u g θ ) r ) + 1 r 2 2 ( ε g u g θ ) θ 2 + 2 ( ε g u g θ ) z 2 + 2 r 2 ( ε g u g r ) θ ] ε g ρ g g cos α sin θ + f int , g , θ + F d , g , θ m .
● Volume conservation,
ε + ε g = ε .
Discussion and justifications of the boundary conditions are provided in Iliuta and Larachi [24] and Iliuta and Larachi [25].

2.2. Mass and Energy Transport Model

2.2.1. Nitrogen Oxides Absorption Mechanism

The mechanism of nitrogen oxides absorption is extremely complex connecting reactions in both liquid and gas phases and gas-liquid mass transfer [5,27]. The main route of the absorption mechanism engages N2O4 as the liquid phase reactant. The generation of N2O4 in the gas phase, the gas-liquid mass transfer and the reaction in the liquid phase follow the sequence:
Reaction   1 :   2 N O ( g ) + O 2 2 N O 2 ( g ) .
Reaction   2 :   2 N O 2 ( g ) N 2 O 4 ( g ) .
Reaction   3 :   N 2 O 4 ( g ) N 2 O 4 ( ) .
Reaction   4 :   N 2 O 4 ( ) + H 2 O ( ) H N O 3 ( ) + H N O 2 ( ) .
Reaction   5 :   3 H N O 2 ( ) H N O 3 ( ) + H 2 O ( ) + 2 N O ( g ) .
The equilibrium and kinetics of reaction 1 (NO gas phase oxidation) have been investigated by Bodenstein [28,29]. The oxidation rate expression is [27]:
R 1 = k 1 ( P N O 2 P O 2 P N O 2 K 1 ) ,   [ kPa / s ] ,
where   k 1 = exp ( 1468 / T 10.9043 ) ,   [ kPa 2 s 1 ] ,
K 1 = exp ( 8.002 + 1.75 ln T 0.000217 T 2496 / T ) ,   [ kPa 2 ] .
NO gas phase oxidation reaction is the rate limiting step in the absorption process and is significantly influenced by the pressure [5,27]. NO2 gas phase dimerization (Reaction 2) attains quickly the equilibrium. The equilibrium of this reaction has been studied by Bodenstein [29] and the equilibrium constant is:
K 2 = P N 2 O 4 P N O 2 2     K 2 = exp ( 6893 / T 25.865 ) ,   [ kPa 1 ] .
The liquid phase reactions 4 and 5 are often assembled into a global reaction with an effective rate that considers both the kinetic and transport process [5,27]:
3 2 N 2 O 4 ( ) + H 2 O ( ) 2 H N O 3 ( ) + N O ( g ) .
Dekker et al. [30] used the penetration theory to determine the rate of absorption of NO2 in water considering the following assumptions: (a) NO2 and N2O4 are in a permanent chemical equilibrium in the gas phase and are transferred from the bulk to the gas-liquid interface by molecular diffusion; (b) N2O4 is the only species dissolved in H2O at the gas-liquid interface; (c) the liquid mass transfer of N2O4 is accompanied by a rapid pseudo first-order reaction (H2O is in large excess). The N2O4 absorption rate was stated as [30]:
N N 2 O 4 = H N 2 O 4 P N 2 O 4 k 4 , 5 D N 2 O 4 .

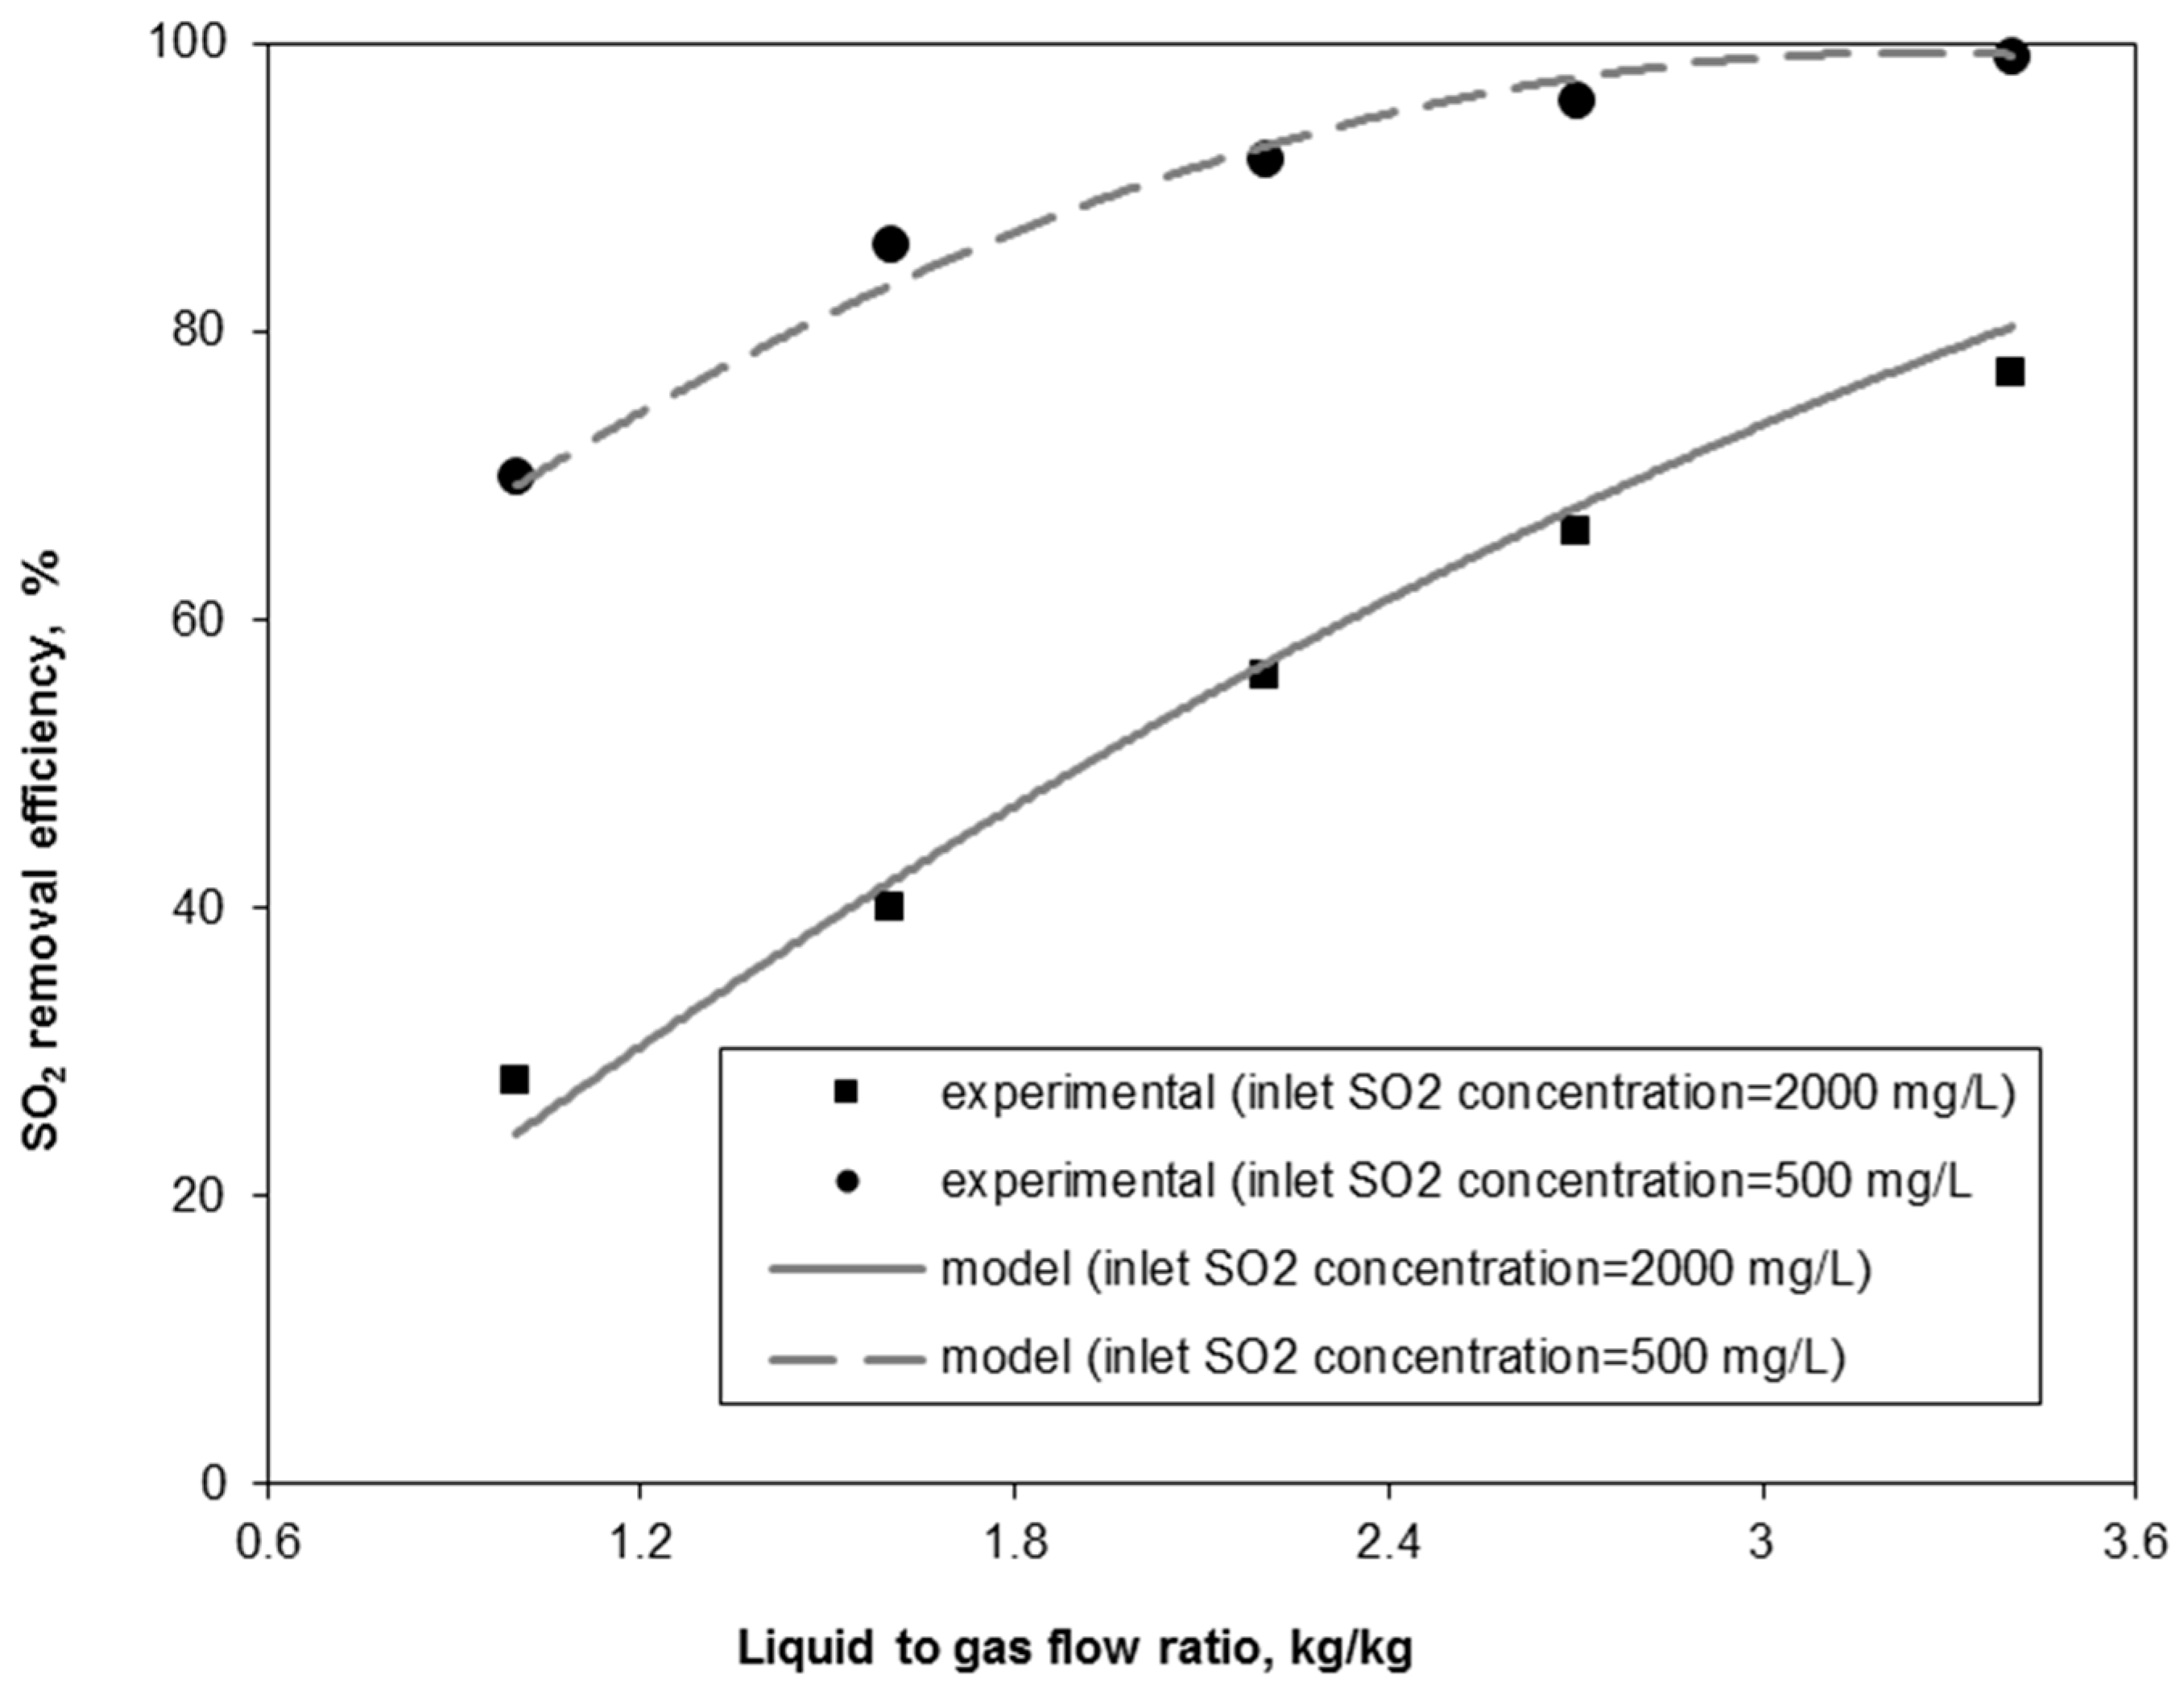
2.2.2. SO2 Absorption Mechanism

The major component of SOx emissions from ships engines is SO2 [3]. When SO2 is absorbed in pure water the ensuing reaction occurs in the liquid phase:
S O 2 + H 2 O H + + H S O 3 .
The forward reaction rate constant was approximated to be very high (>106 s−1) at 293 K [31] and this reaction can be assumed to be an instantaneous reaction with respect to mass transfer [32]. The SO2 absorption rate can be written as [32]:
N S O 2 = k a ( C S O 2 , i C S O 2 , ) E .
The absorption of SO2 into seawater, which contains NaCl, can be considered a reversible reaction A ( S O 2 ) B ( H S O 3 ) + C ( H + ) and the mass transfer enhancement factor was estimated, with the surface renewal model, as [32]:
E = 1 + D C D A C C , i C C , C A , i C A , ,
in which
C C , i = C C , D B D C C B , + ( C C , D B D C C B , ) 2 + 4 D B D C C A , i K c 2 .

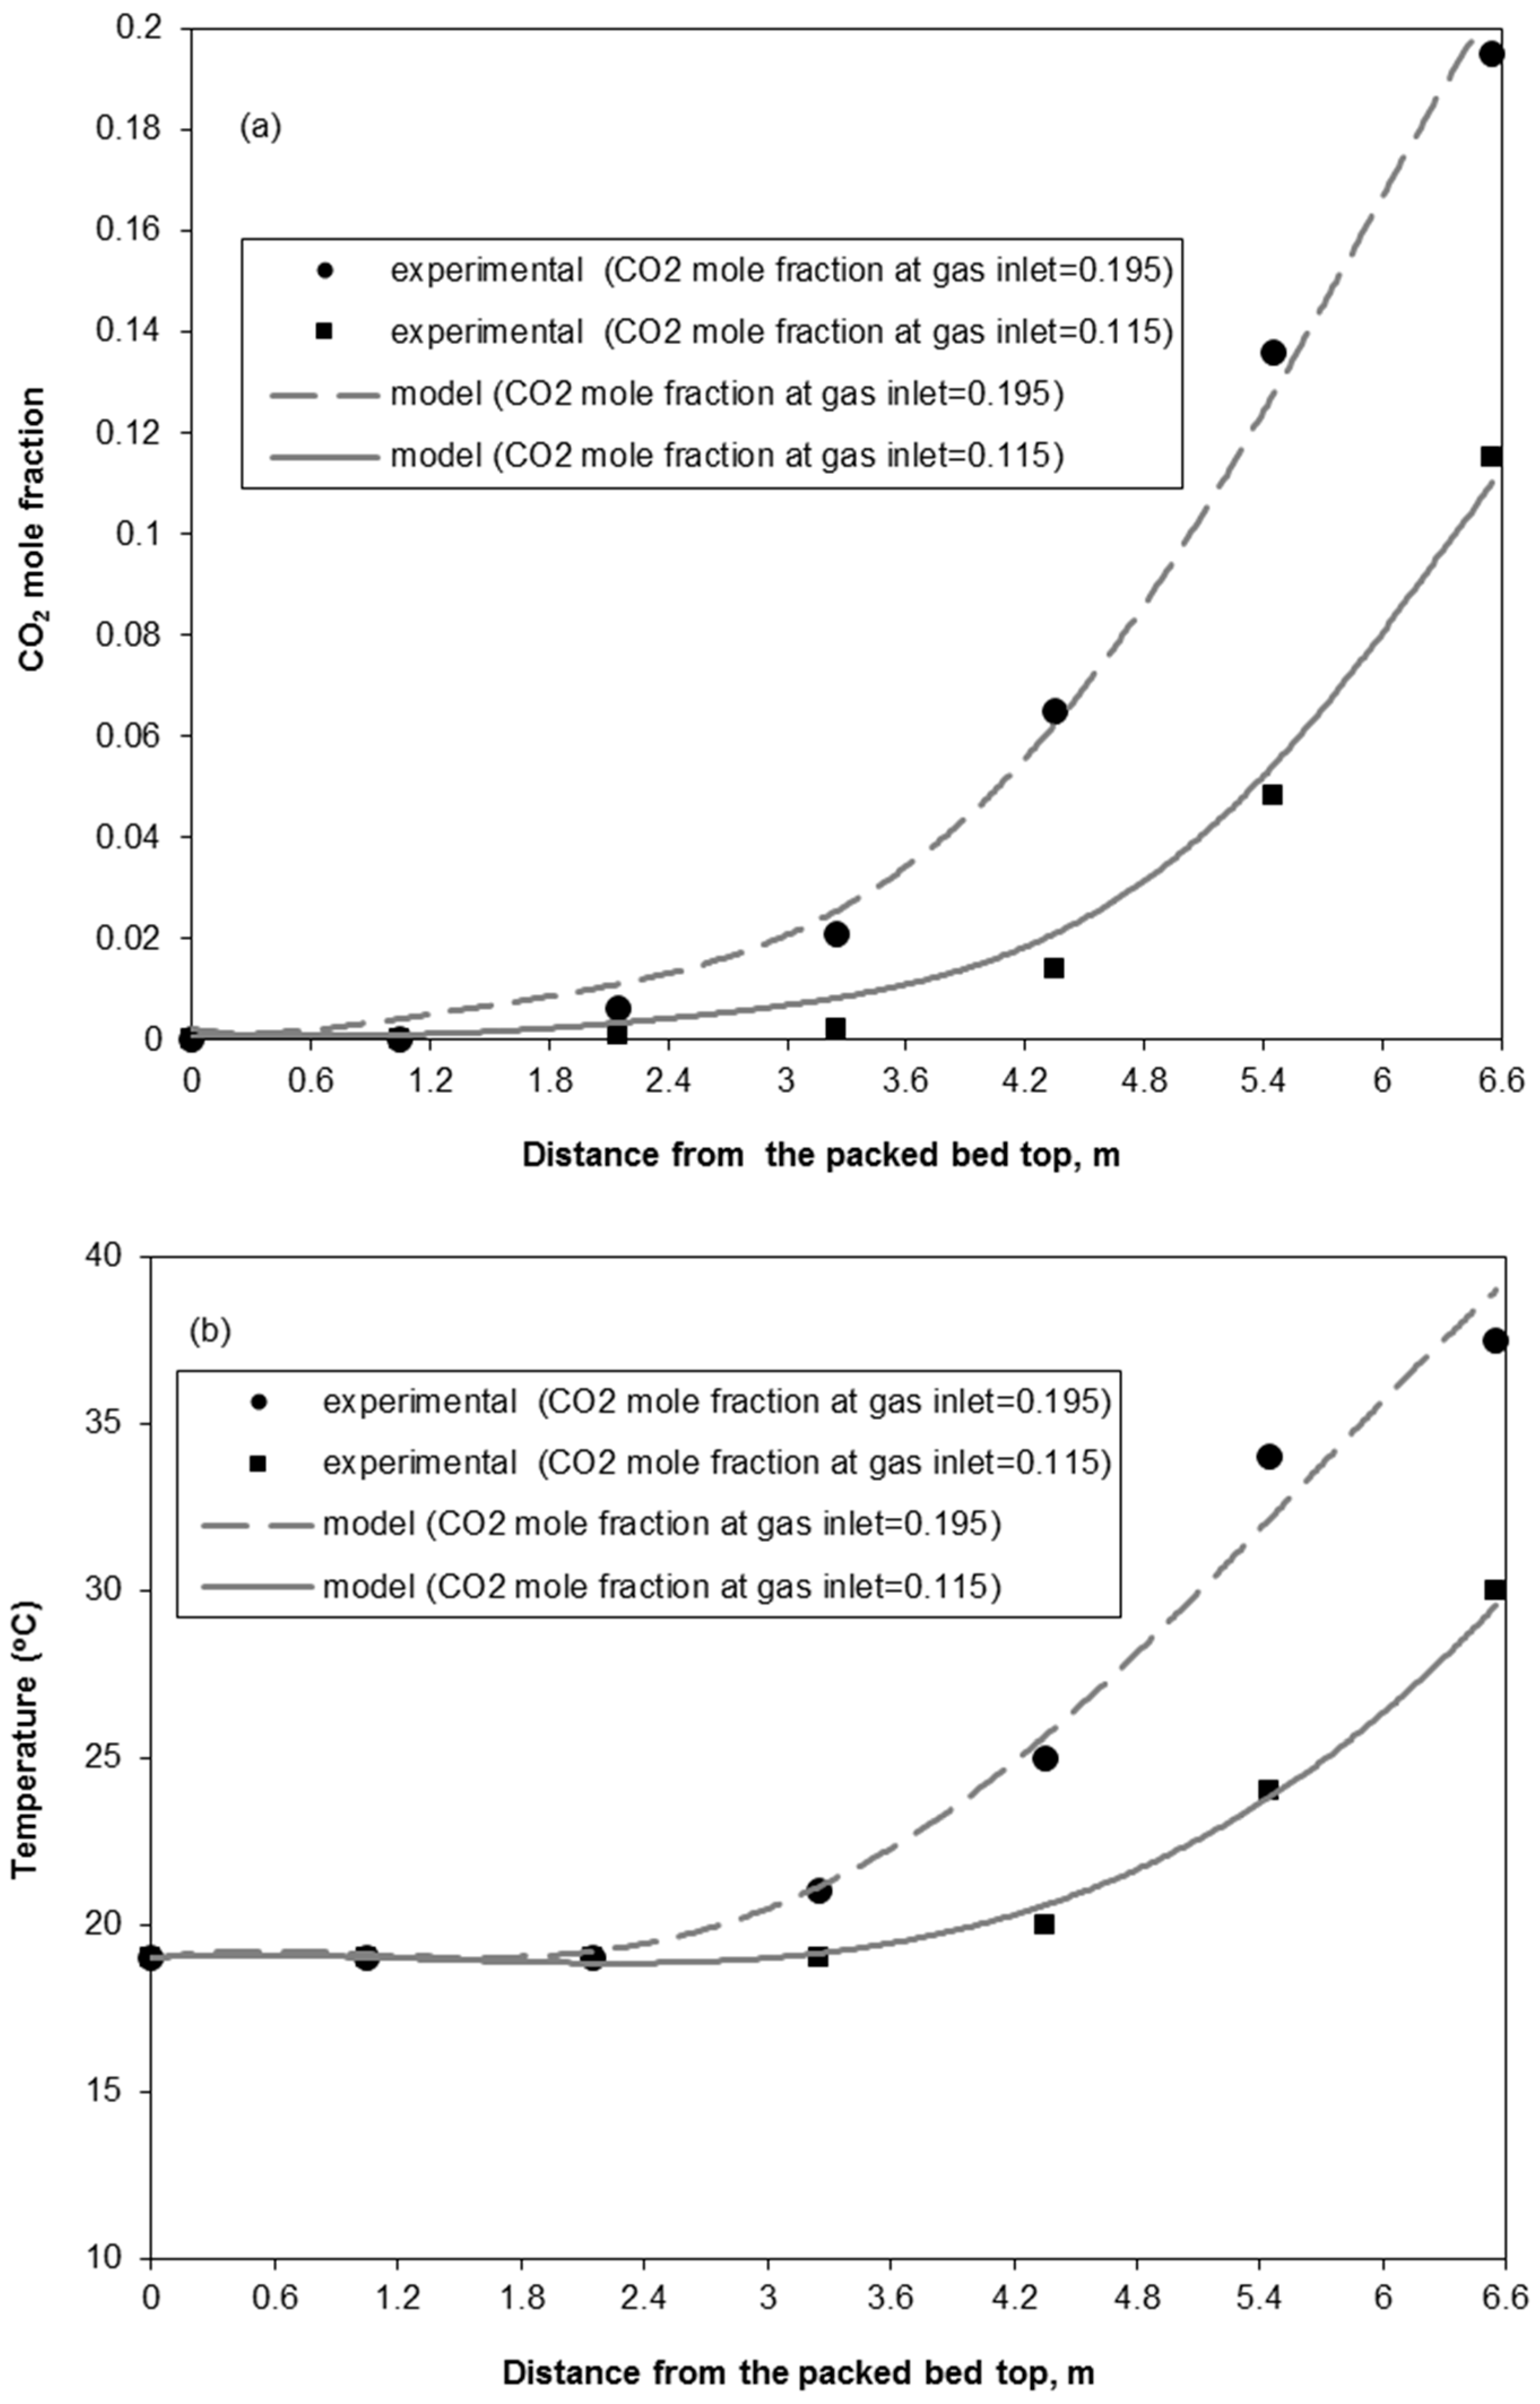
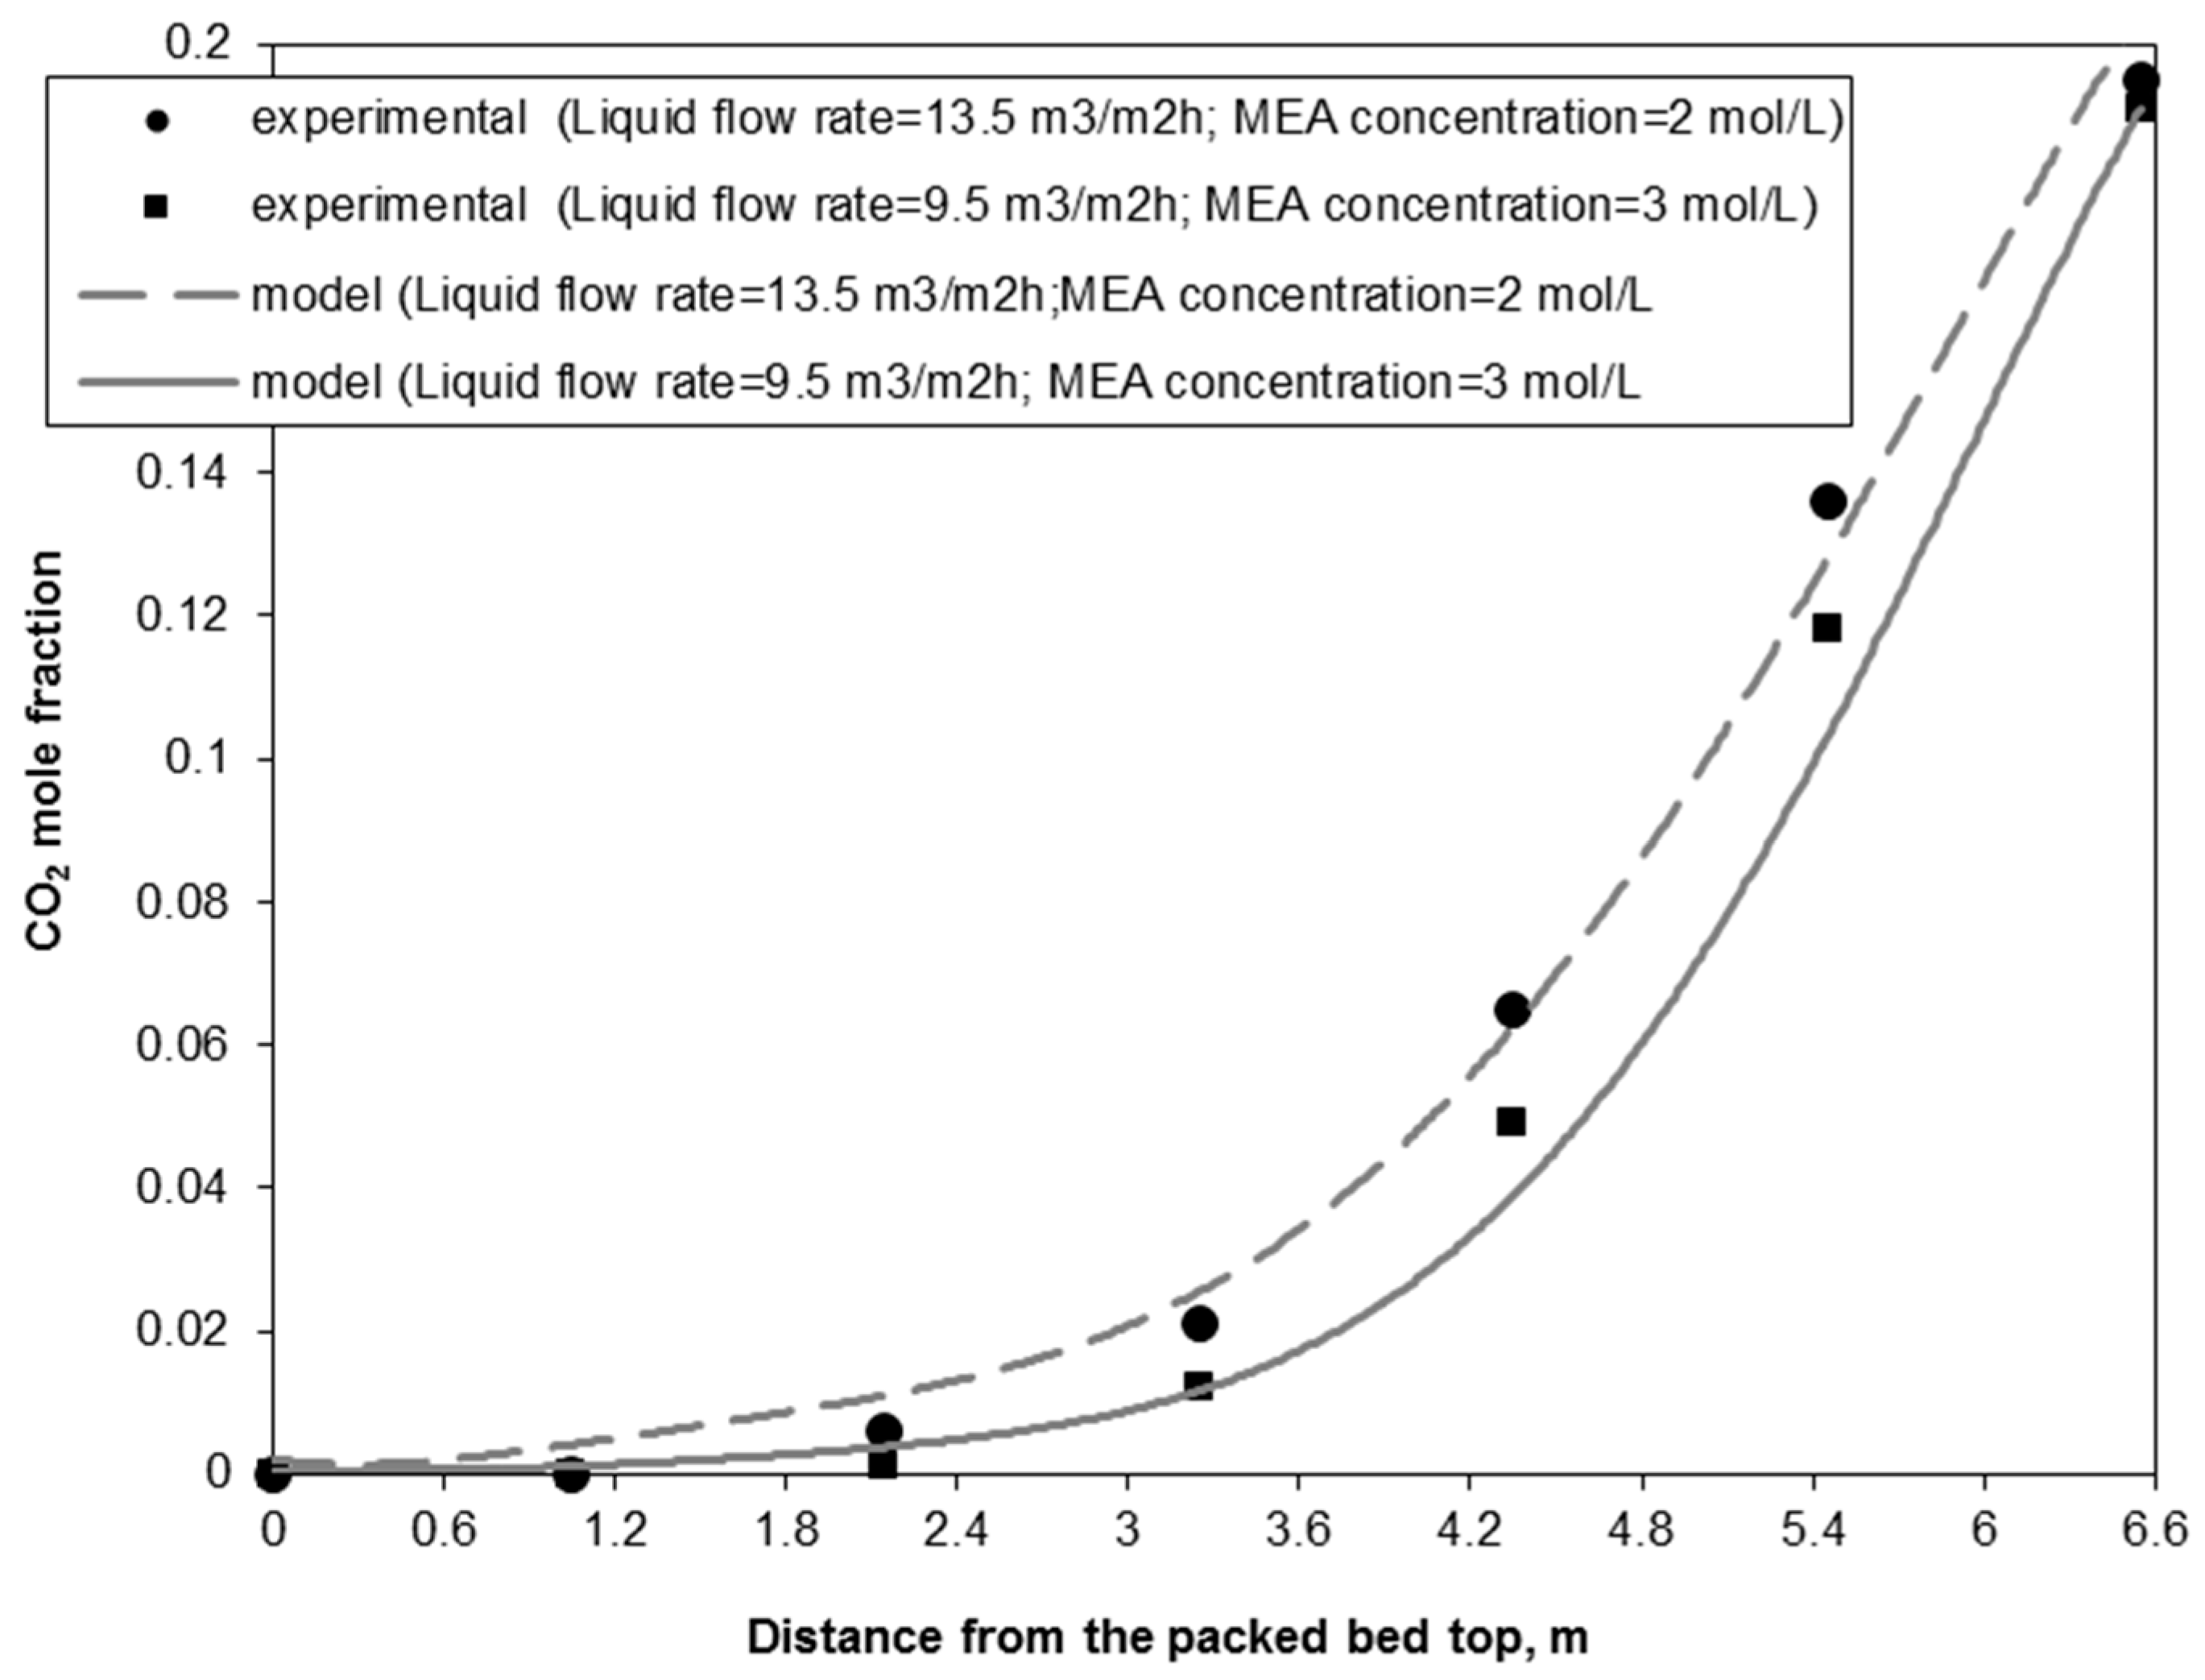
2.2.3. CO2 Absorption Mechanism

Only the physical absorption in seawater was considered for CO2 and the rate of absorption was given by Equation (22) with E = 1.

2.2.4. Mass Conservative Equations

In the gas phase, only NO oxidation reaction was considered. The reaction between SO2 and NO2 was neglected and SO2 was considered to be oxidized via the liquid phase routes, which is the slowest one [5]. SO2 and NO2 are absorbed separately in the liquid film and react independently with seawater (Ellison and Eckert 1984; Iloeje et al., 2015). The catalytic effect of NO2 on aqueous phase SO2 oxidation was neglected [5,33]. At high pressure, when gas phase NO oxidation rate is large [5], SO2 and NOx simultaneous absorption in seawater is accompanied by very fast reactions in the liquid film neighboring the gas-liquid interface, and, consequently, the liquid bulk concentrations for SO2 and NO2 can be neglected. Therefore, the dynamic mass transport model includes the species balance equations for CO2, H+ and HSO 3 in the liquid phase and CO2, SO2, NO and NO2 in the gas phase. N2O4 concentration in the gas phase was evaluated via the equilibrium equation (Equation (18)). The unsteady-state 3-D species balance equations accounting for the non-uniform velocity profiles and the matching boundary conditions are:
● Species balance equations in the gas phase,
t ( ε g P C O 2 , g ) + u g r r ( ε g P C O 2 , g ) + u g θ r θ ( ε g P C O 2 , g ) + u g z z ( ε g P C O 2 , g ) = D g r r r ( r ε g P C O 2 , g r ) + D g θ r 2 2 θ 2 ( ε g P C O 2 , g ) + D g z 2 z 2 ( ε g P C O 2 , g ) ( N C O 2 a ) R T g ,
t ( ε g P S O 2 , g ) + u g r r ( ε g P S O 2 , g ) + u g θ r θ ( ε g P S O 2 , g ) + u g z z ( ε g P S O 2 , g ) = D g r r r ( r ε g P S O 2 , g r ) + D g θ r 2 2 θ 2 ( ε g P S O 2 , g ) + D g z 2 z 2 ( ε g P S O 2 , g ) ( N S O 2 a ) R T g ,
t ( ε g P N O , g ) + u g r r ( ε g P N O , g ) + u g θ r θ ( ε g P N O , g ) + u g z z ( ε g P N O , g ) = D g r r r ( r ε g P N O , g r ) + D g θ r 2 2 θ 2 ( ε g P N O , g ) + D g z 2 z 2 ( ε g P N O , g ) 2 R 1 ( P j , g ) R T g ,
t ( ε g P N O 2 , g ) + u g r r ( ε g P N O 2 , g ) + u g θ r θ ( ε g P N O 2 , g ) + u g z z ( ε g P N O 2 , g ) = D g r r r ( r ε g P N O 2 , g r ) + D g θ r 2 2 θ 2 ( ε g P N O 2 , g ) + D g z 2 z 2 ( ε g P N O 2 , g ) + 2 R 1 ( P j , g ) R T g 2 ( N N 2 O 4 a ) R T g .
● Species balance equations in the liquid phase,
t ( ε C C O 2 , ) + u r r ( ε C C O 2 , ) + u θ r θ ( ε C C O 2 , ) + u z z ( ε C C O 2 , ) = D r r r ( r ε C C O 2 , r ) + D θ r 2 2 θ 2 ( ε C C O 2 , ) + D z 2 z 2 ( ε C C O 2 , ) + N C O 2 a ,
t ( ε C H + , ) + u r r ( ε C H + , ) + u θ r θ ( ε C H + , ) + u z z ( ε C H + , ) = D r r r ( r ε C H + , r ) + D θ r 2 2 θ 2 ( ε C H + , ) + D z 2 z 2 ( ε C H + , ) + N S O 2 a ,
t ( ε C H S O 3 , ) + u r r ( ε C H S O 3 , ) + u θ r θ ( ε C H S O 3 , ) + u z z ( ε C H S O 3 , ) = D r r r ( r ε C H S O 3 , r ) + D θ r 2 2 θ 2 ( ε C H S O 3 , ) + D z 2 z 2 ( ε C H S O 3 , ) + N S O 2 a ,
z = 0       u z ε C j , i n = u z ε C j , | z = 0 + ε D z C j , z | z = 0 P j , g z = 0 ,
z = H       C j , z = 0       u g z ε g P j , g i n = u g z ε g P j , g | z = H ε g D g z P j , g z | z = H ,
r = 0       C j , r = 0       P j , g r = 0 ,
r = R       C j , r = 0       P j , g r = 0 ,
θ = 0 , 2 π       C j , θ = 0       P j , g θ = 0 .

2.2.5. Energy Balance Equations

Convection, conduction in radial and azimuthal directions, gas-liquid heat transfer and absorption reaction heats were included in the energy balance equations for gas and liquid phases. The interfacial temperature was evaluated via the continuity of the energy flux throughout the gas-liquid interface [34]. The heat of CO2 physical absorption and the heat losses were neglected.
● Heat balance equations in liquid and gas phase,
ρ c p ε T t + ρ c p ε u r T r + ρ c p ε u θ 1 r T θ + ρ c p ε u z T z = λ , r e f r r ( r T r ) + λ , θ e f r 2 2 T θ 2 + ( Δ H r , N 2 O 4 ) N N 2 O 4 a + ( Δ H r , S O 2 ) N S O 2 a α g a ( T T i ) ,
ρ c g p g ε g T g t + ρ c g p g ε g u g r T g r + ρ c g p g ε g u g θ 1 r T g θ + ρ c g p g ε g u g z T g z = λ g , r e f r r ( r T g r ) + λ g , θ e f r 2 2 T g θ 2 + α g a ( T T i ) .
● Heat balance at the gas-liquid interface,
j N j t r a n s a H j g + j N j t r a n s a H j = α g a ( T T i ) α g g a ( T i T g ) .
The boundary conditions are:
z = 0       T | z = 0 = T i n       T g z = 0 ,
z = H       T z = 0       T g | z = H = T g i n ,
r = 0       T ( g ) r = 0 ,
r = R       T ( g ) r = 0 ,
θ = 0 , 2 π       T ( g ) θ = 0 .

2.3. Model Parameters

The local wetting fraction of the packed bed was approximated as the ratio between the local gas-liquid interfacial area and the specific surface area of the packing (in preloading countercurrent flow region the liquid texture is provided by a liquid film via the films and rivulets). Effective viscosities ( μ α = g , e f ), integrating viscous and pseudo-turbulence stress tensors, were formulated as suggested by Dankworth et al. [35]. H+ and HSO 3 molecular diffusion coefficients in seawater were taken from Hikita et al. [36] and Chang and Rochelle [32]. The additional molecular diffusion coefficients were estimated via the Wilke-Chang method (in Poling et al. [37]). Solubilities of gaseous components in seawater were evaluated using the gas-liquid equal-fugacity conditions proposed by Rodriguez-Sevilla et al. [38]:
m j = P j ϕ j H j , m 0 γ j .
CO2 and SO2 Henry’s constant correlations in water were taken from Plummer and Busenberg [39] and Rodriguez-Sevilla et al. [40]. The activity coefficients in seawater have been evaluated with the correlation suggested by Schumpe [41]:
log γ j = i ( h i , j + h j ) C i ,
hi,j is the specific parameter of the ion i, hj is the gas specific parameter, and Ci is the molar concentration of the ion i. hi,j and hSO2 were obtained from Schumpe [41], Weisenberger and Schumpe [42] and Rodriguez-Sevilla et al. [38] and hCO2 and hN2O4 were taken from Chang and Rochelle [32] and Armor [43].
Effective thermal conductivities were calculated with the relationship of Weekman and Myers [44] and seawater thermal conductivity was evaluated with Filippov equation and Sastri method (in Poling et al., [37]). Chilton-Colburn heat/mass transfer analogy was applied to calculate the interfacial conductive heat transfer coefficient (Taylor and Krishna, [34]). Gas-liquid mass transfer parameters (gas-liquid interfacial area and gas-liquid mass transfer coefficients) at the local level were evaluated via the macroscopic mass transfer correlations of Onda et al. [45] quantified as a function of local liquid velocity. Liquid and gas dispersion coefficients in the axial direction were acquired from Sater and Levenspiel [46] and Otake and Kunugita [47] and the ratio between the axial and azimuthal/radial dispersion coefficients was presumed to be 10 [48].

2.4. Numerical Implementation

The partial differential equations which define the dynamics of gas-liquid countercurrent flow and simultaneous absorption of SO2, NOx and CO2 in vertical, inclined and oscillating/heaving countercurrent packed-bed column reactors were resolved in Aspen Custom Modeler. The discretization of the model equations in the three spatial directions was realized via the second and third order orthogonal collocation on finite elements technique. Newton and Gear integration procedures were implemented to resolve steady-state and unsteady-state models.

3. Results and Discussion

3.1. Model Experimental Validation

Figure 2 shows a comparison between theoretical and experimental SO2 absorption data obtained by Flagiello et al. [9] via a seawater scrubbing process in a structured packed-bed column (D = 0.1 m; H = 0.892 m) with Sulzer Mellapak 250X. Theoretical SO2 removal efficiency matches the experimental SO2 removal efficiency generated at different gas and liquid flow rates and SO2 concentrations in the gas phase.
Figure 3 and Figure 4 illustrate the theoretical and experimental CO2 chemical absorption data obtained by Tontiwachwuthikul et al. [49] via a CO2-MEA absorption process in a random packed-bed column reactor with 12.7 mm ceramic Berl saddles (D = 0.1 m; H = 6.55 m). Simulated CO2 absorption results are acceptably close to the experimental data performed at various monoethanolamine (MEA)/CO2 concentrations in the liquid/gas phase and different values for gas and liquid flow rates. However, these conditions are different from the ones simulated with the current model (absorption in seawater and not amine solutions). Simulations of the CO2-MEA absorption process behavior in vertical, static inclined, and dynamic inclined countercurrent random packed-bed columns were presented in Iliuta and Larachi [26].
In addition, the enzymatic CO2 removal experimental data generated by Rambo et al. [50] in a structured packed-bed column (D = 0.05 m; H = 1.06 m) with immobilized human carbonic anhydrase II (hCA II) on Sulzer Mellapak 500X were compared with the predictions of a similar dynamic 3-D model which associates the macroscopic momentum and mass balance equations in the gas and liquid phases with concomitant diffusion and reaction within the hCA II enzyme washcoat [22]. Table 1 shows that theoretical enzymatic CO2 removal results suit the experimental data generated at different hCA II loadings.

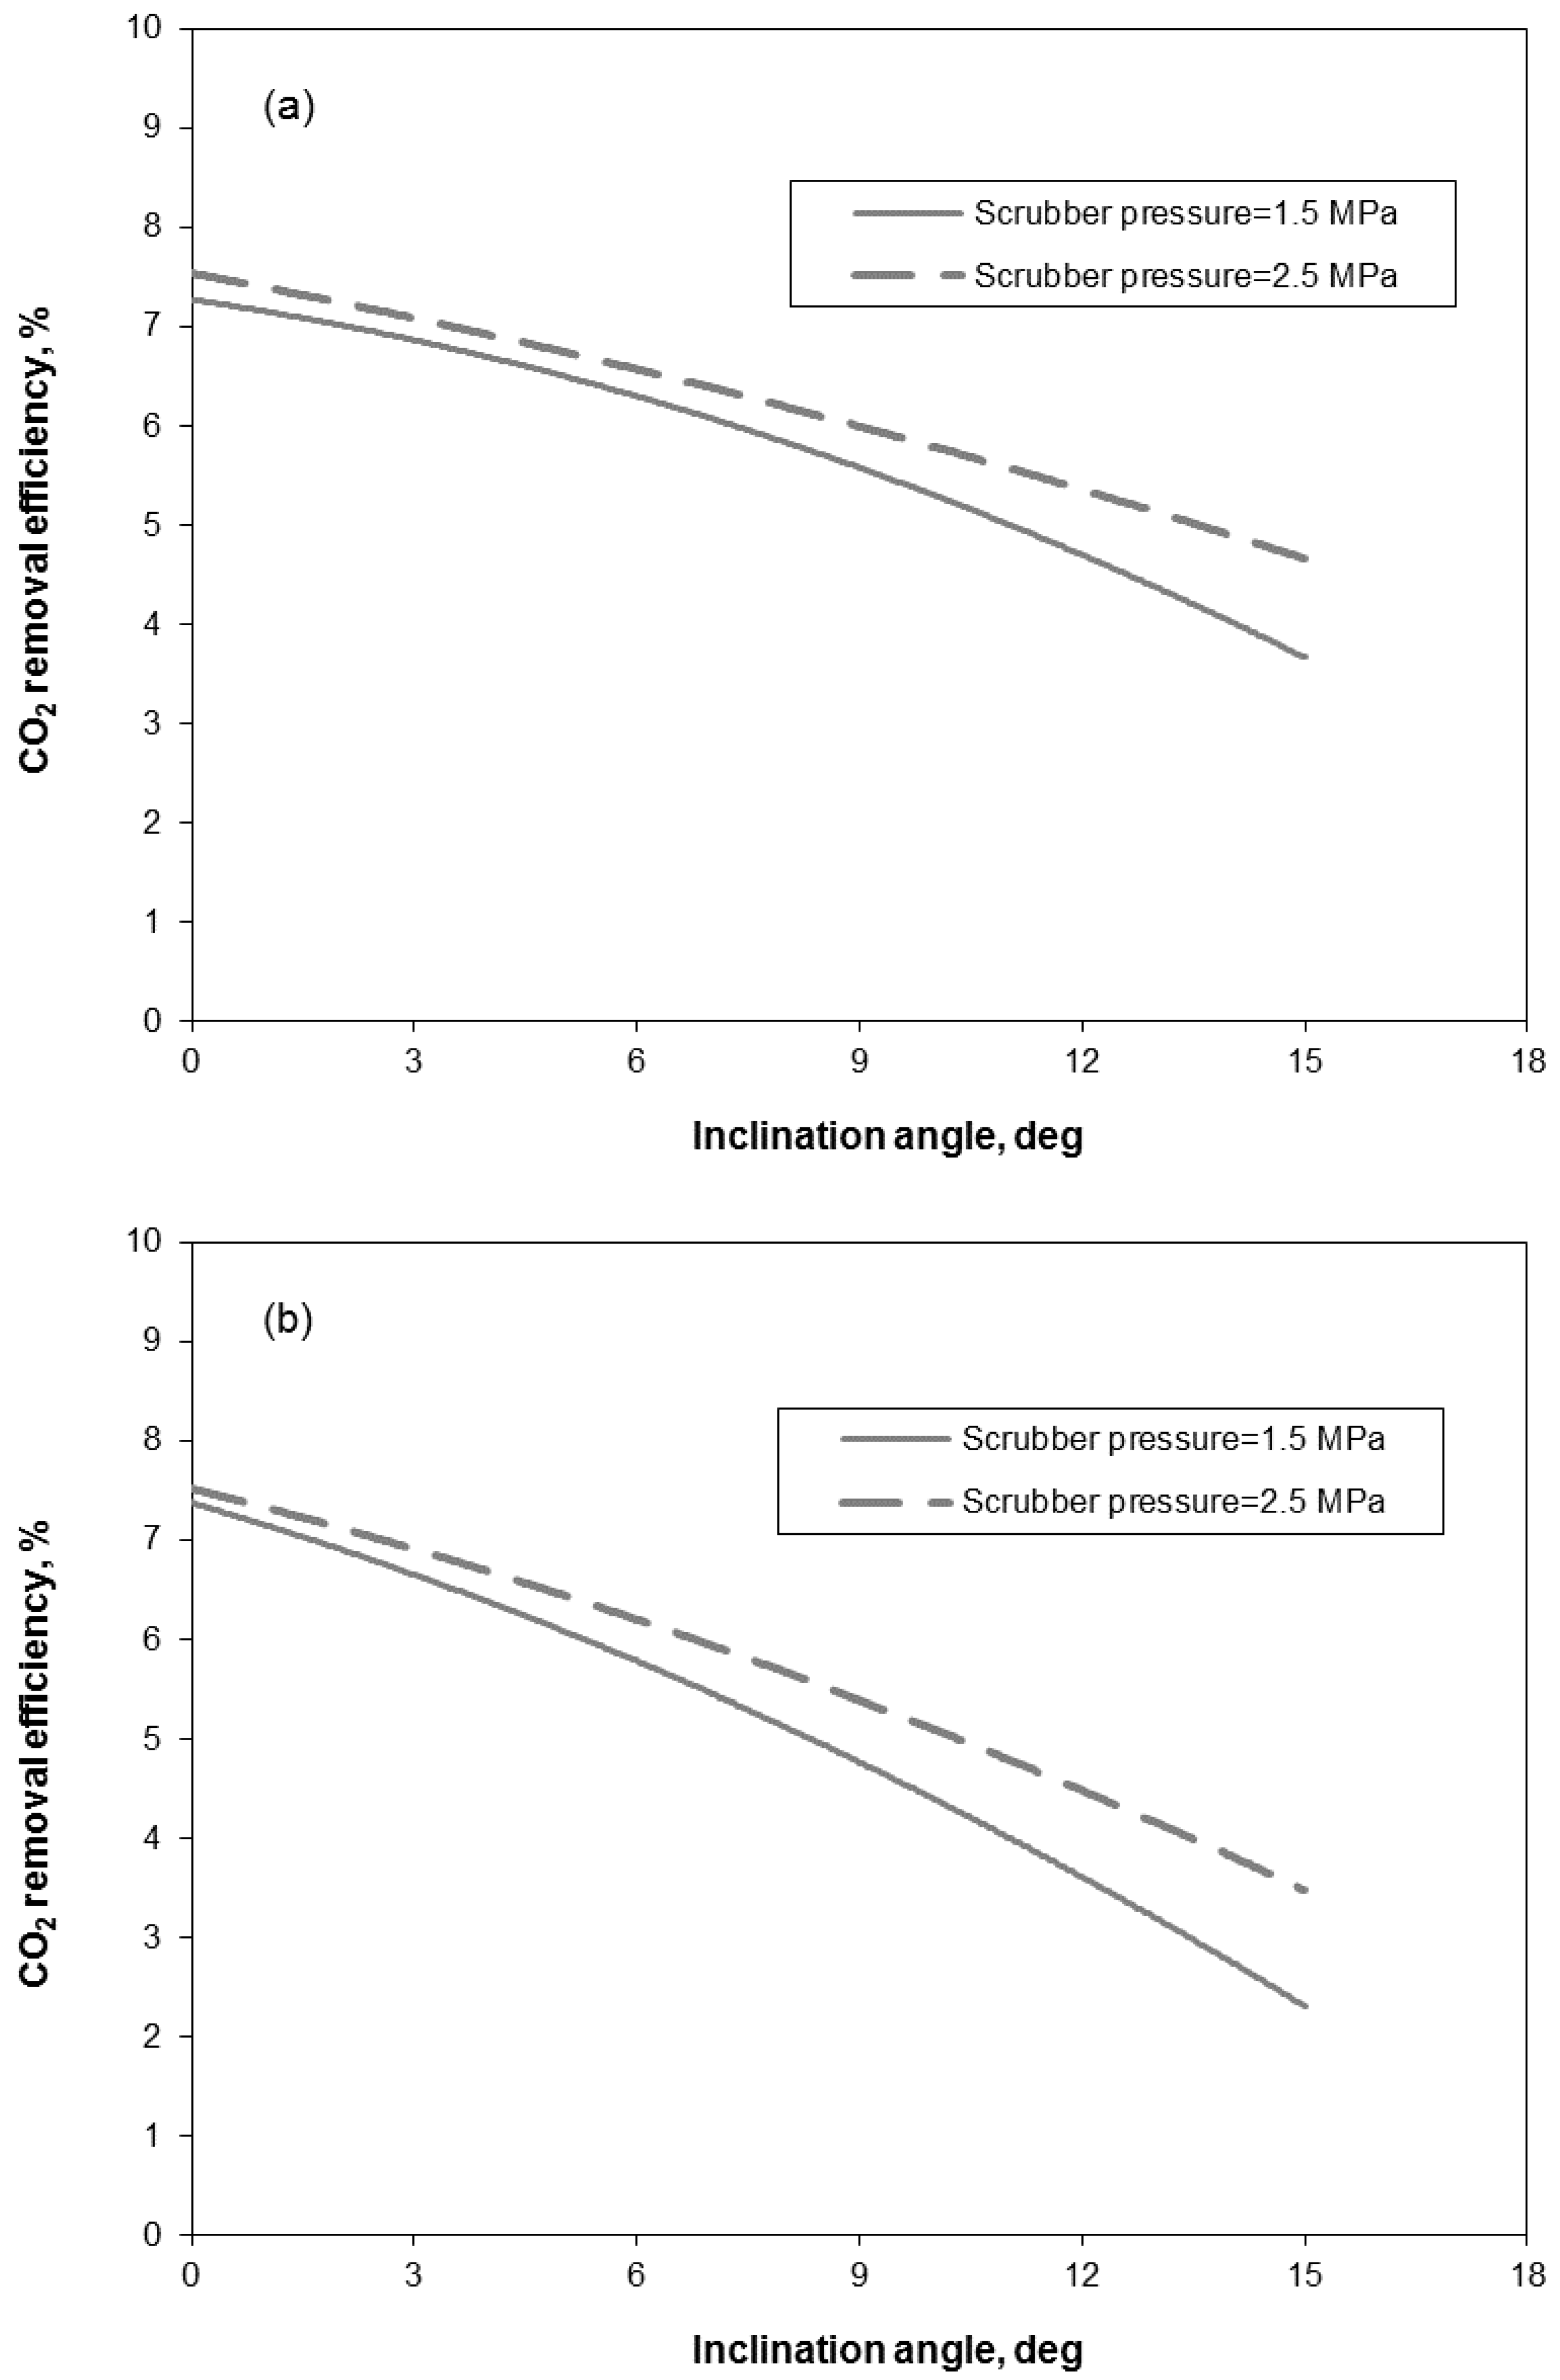
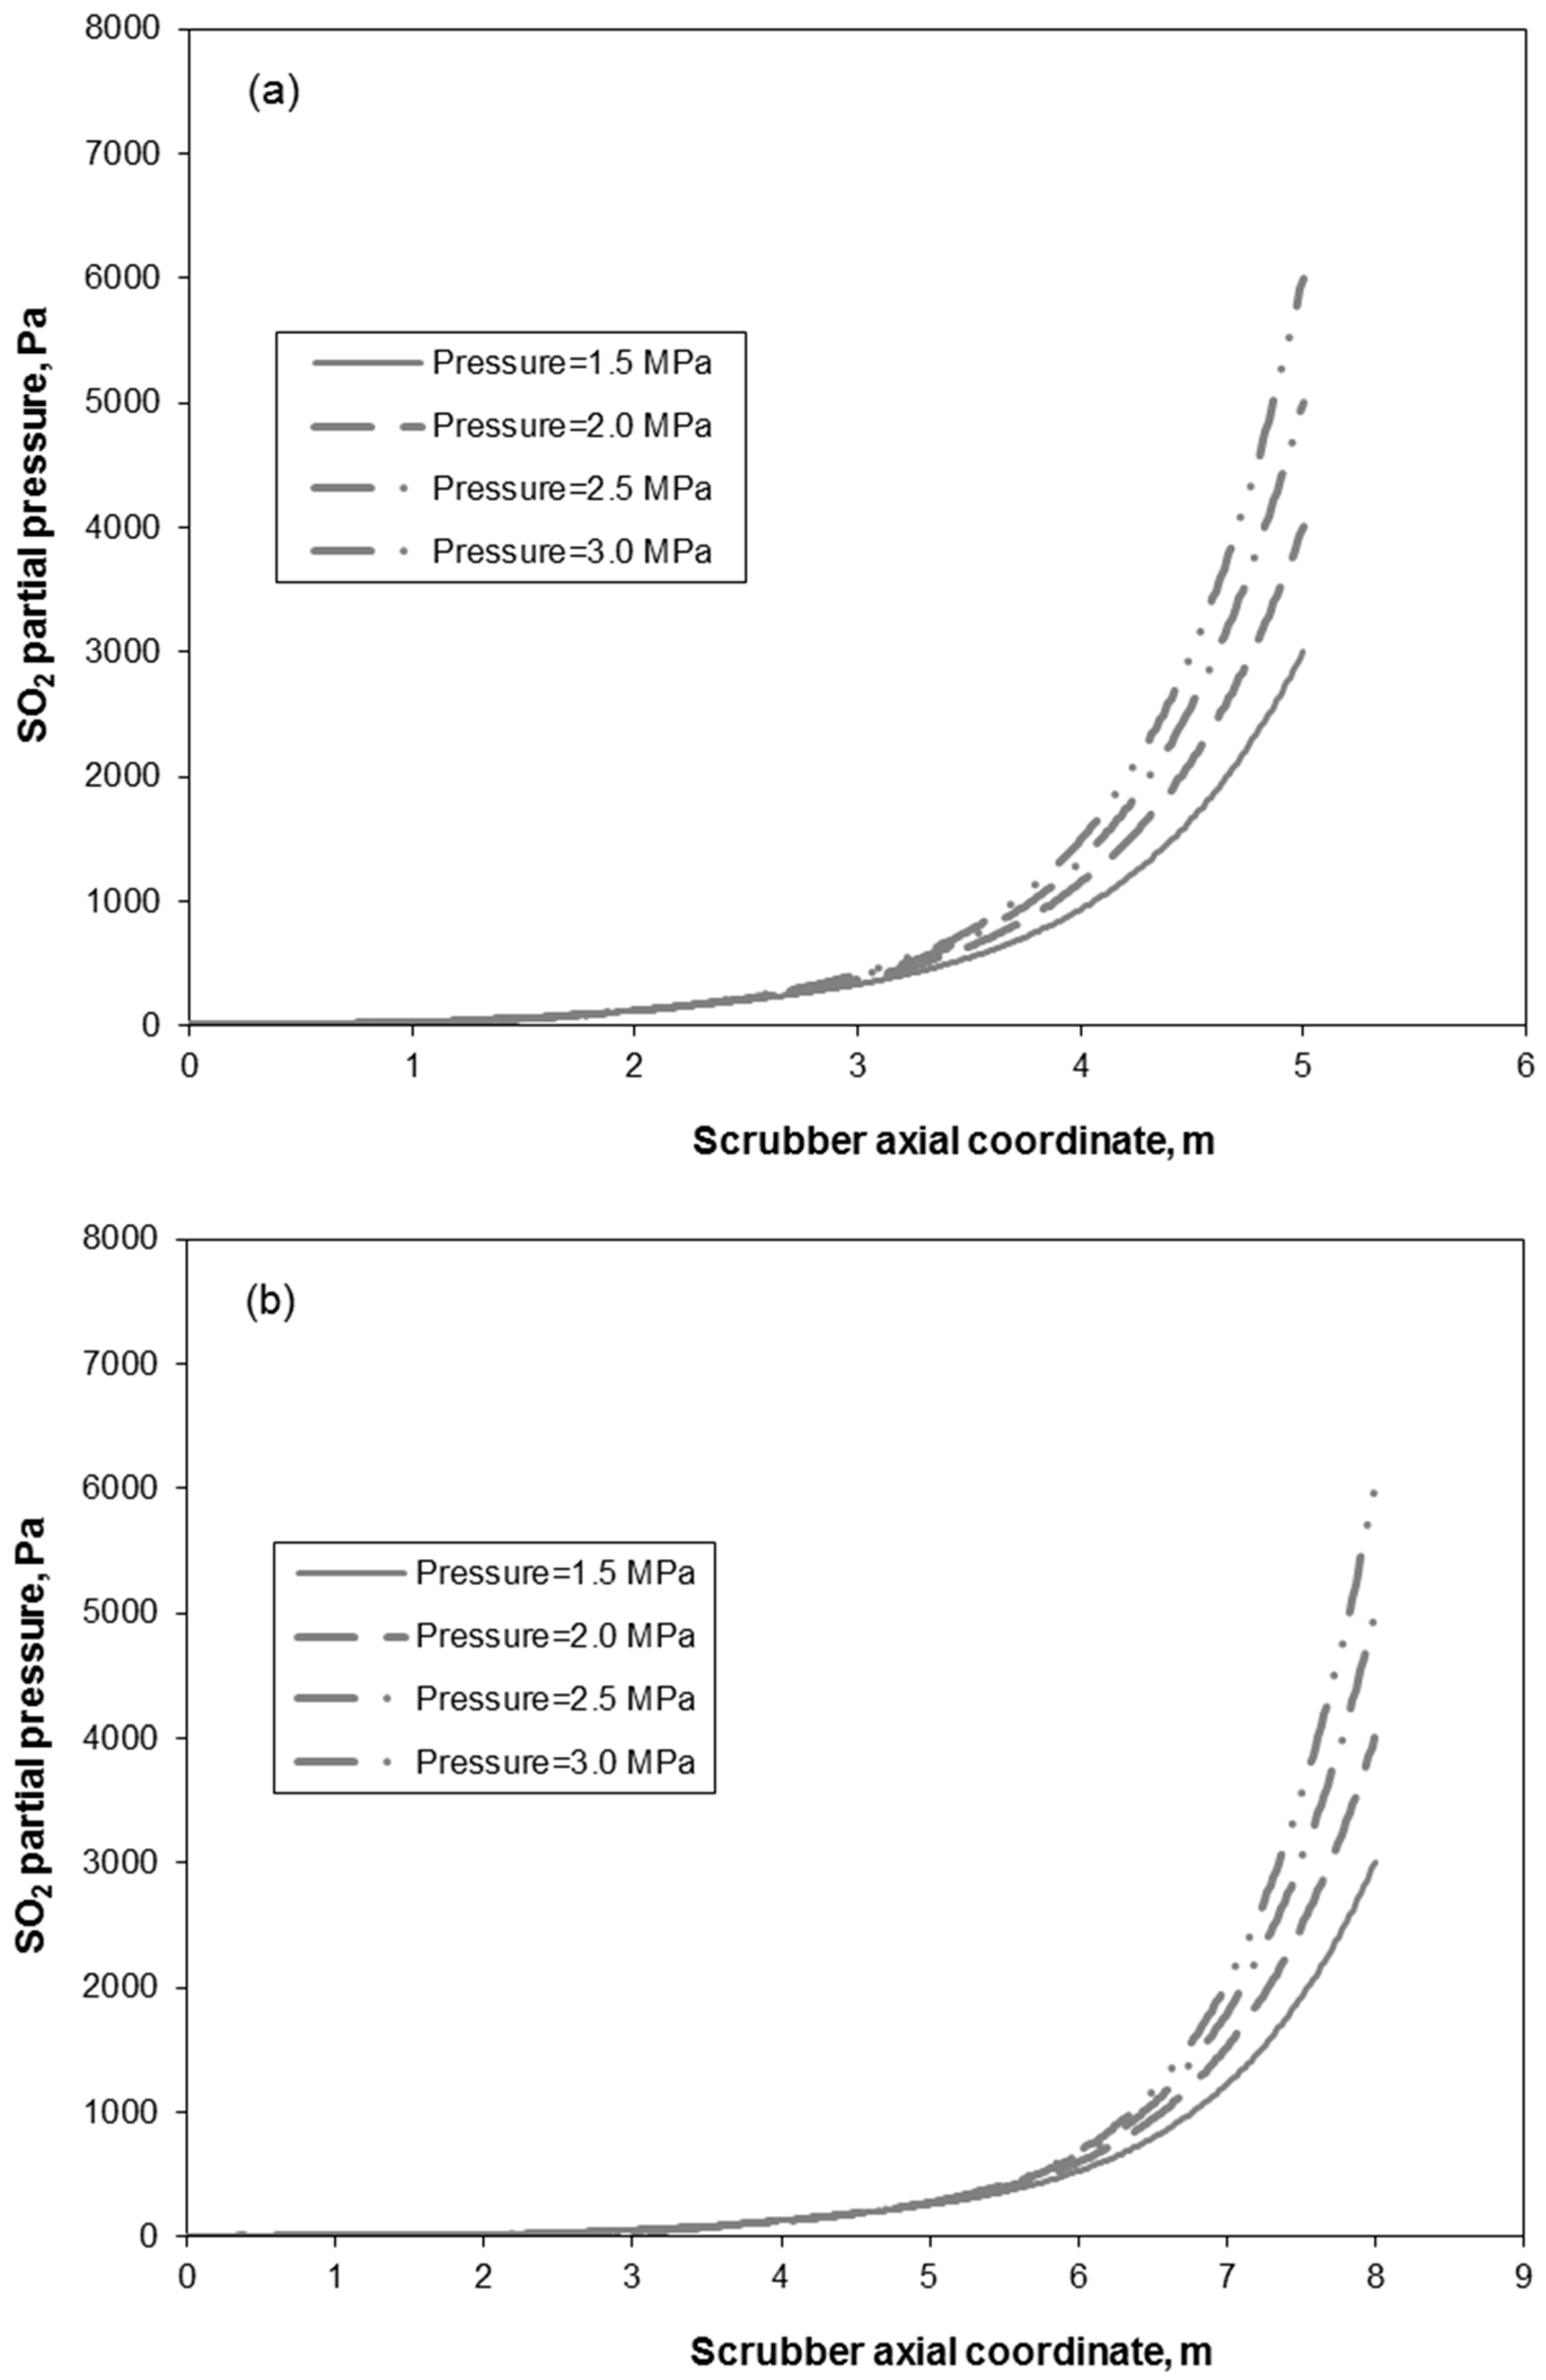
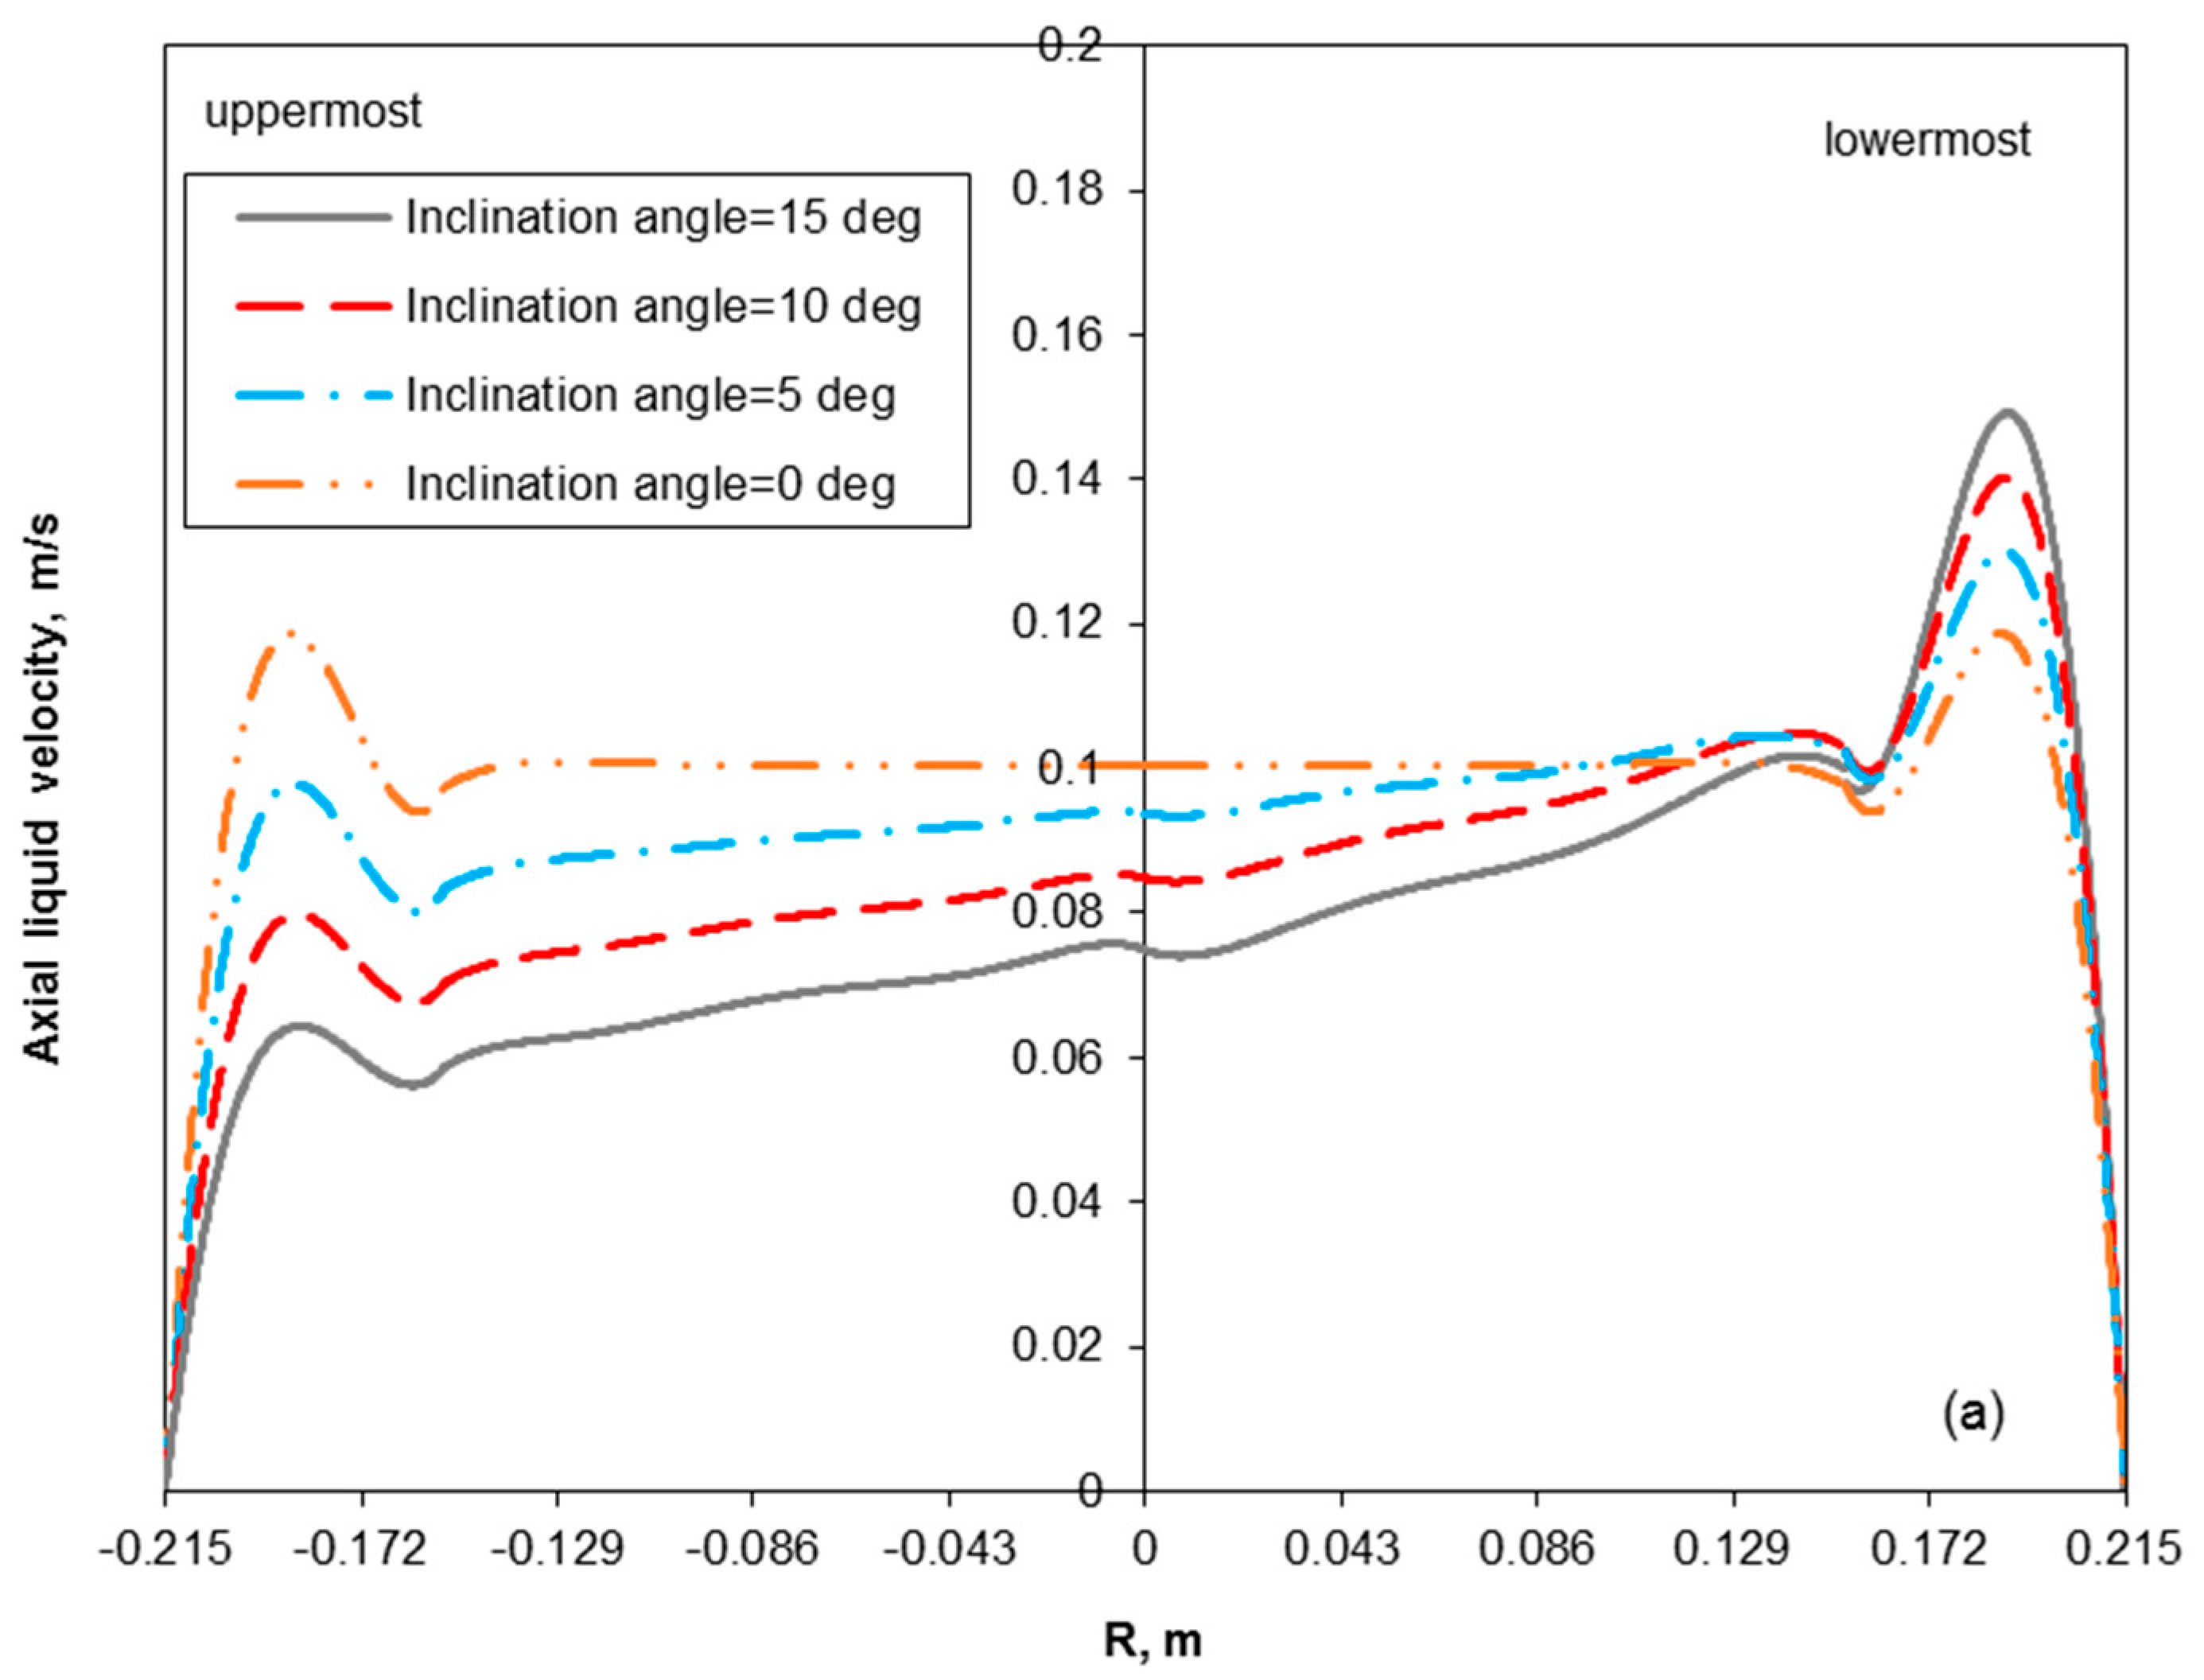
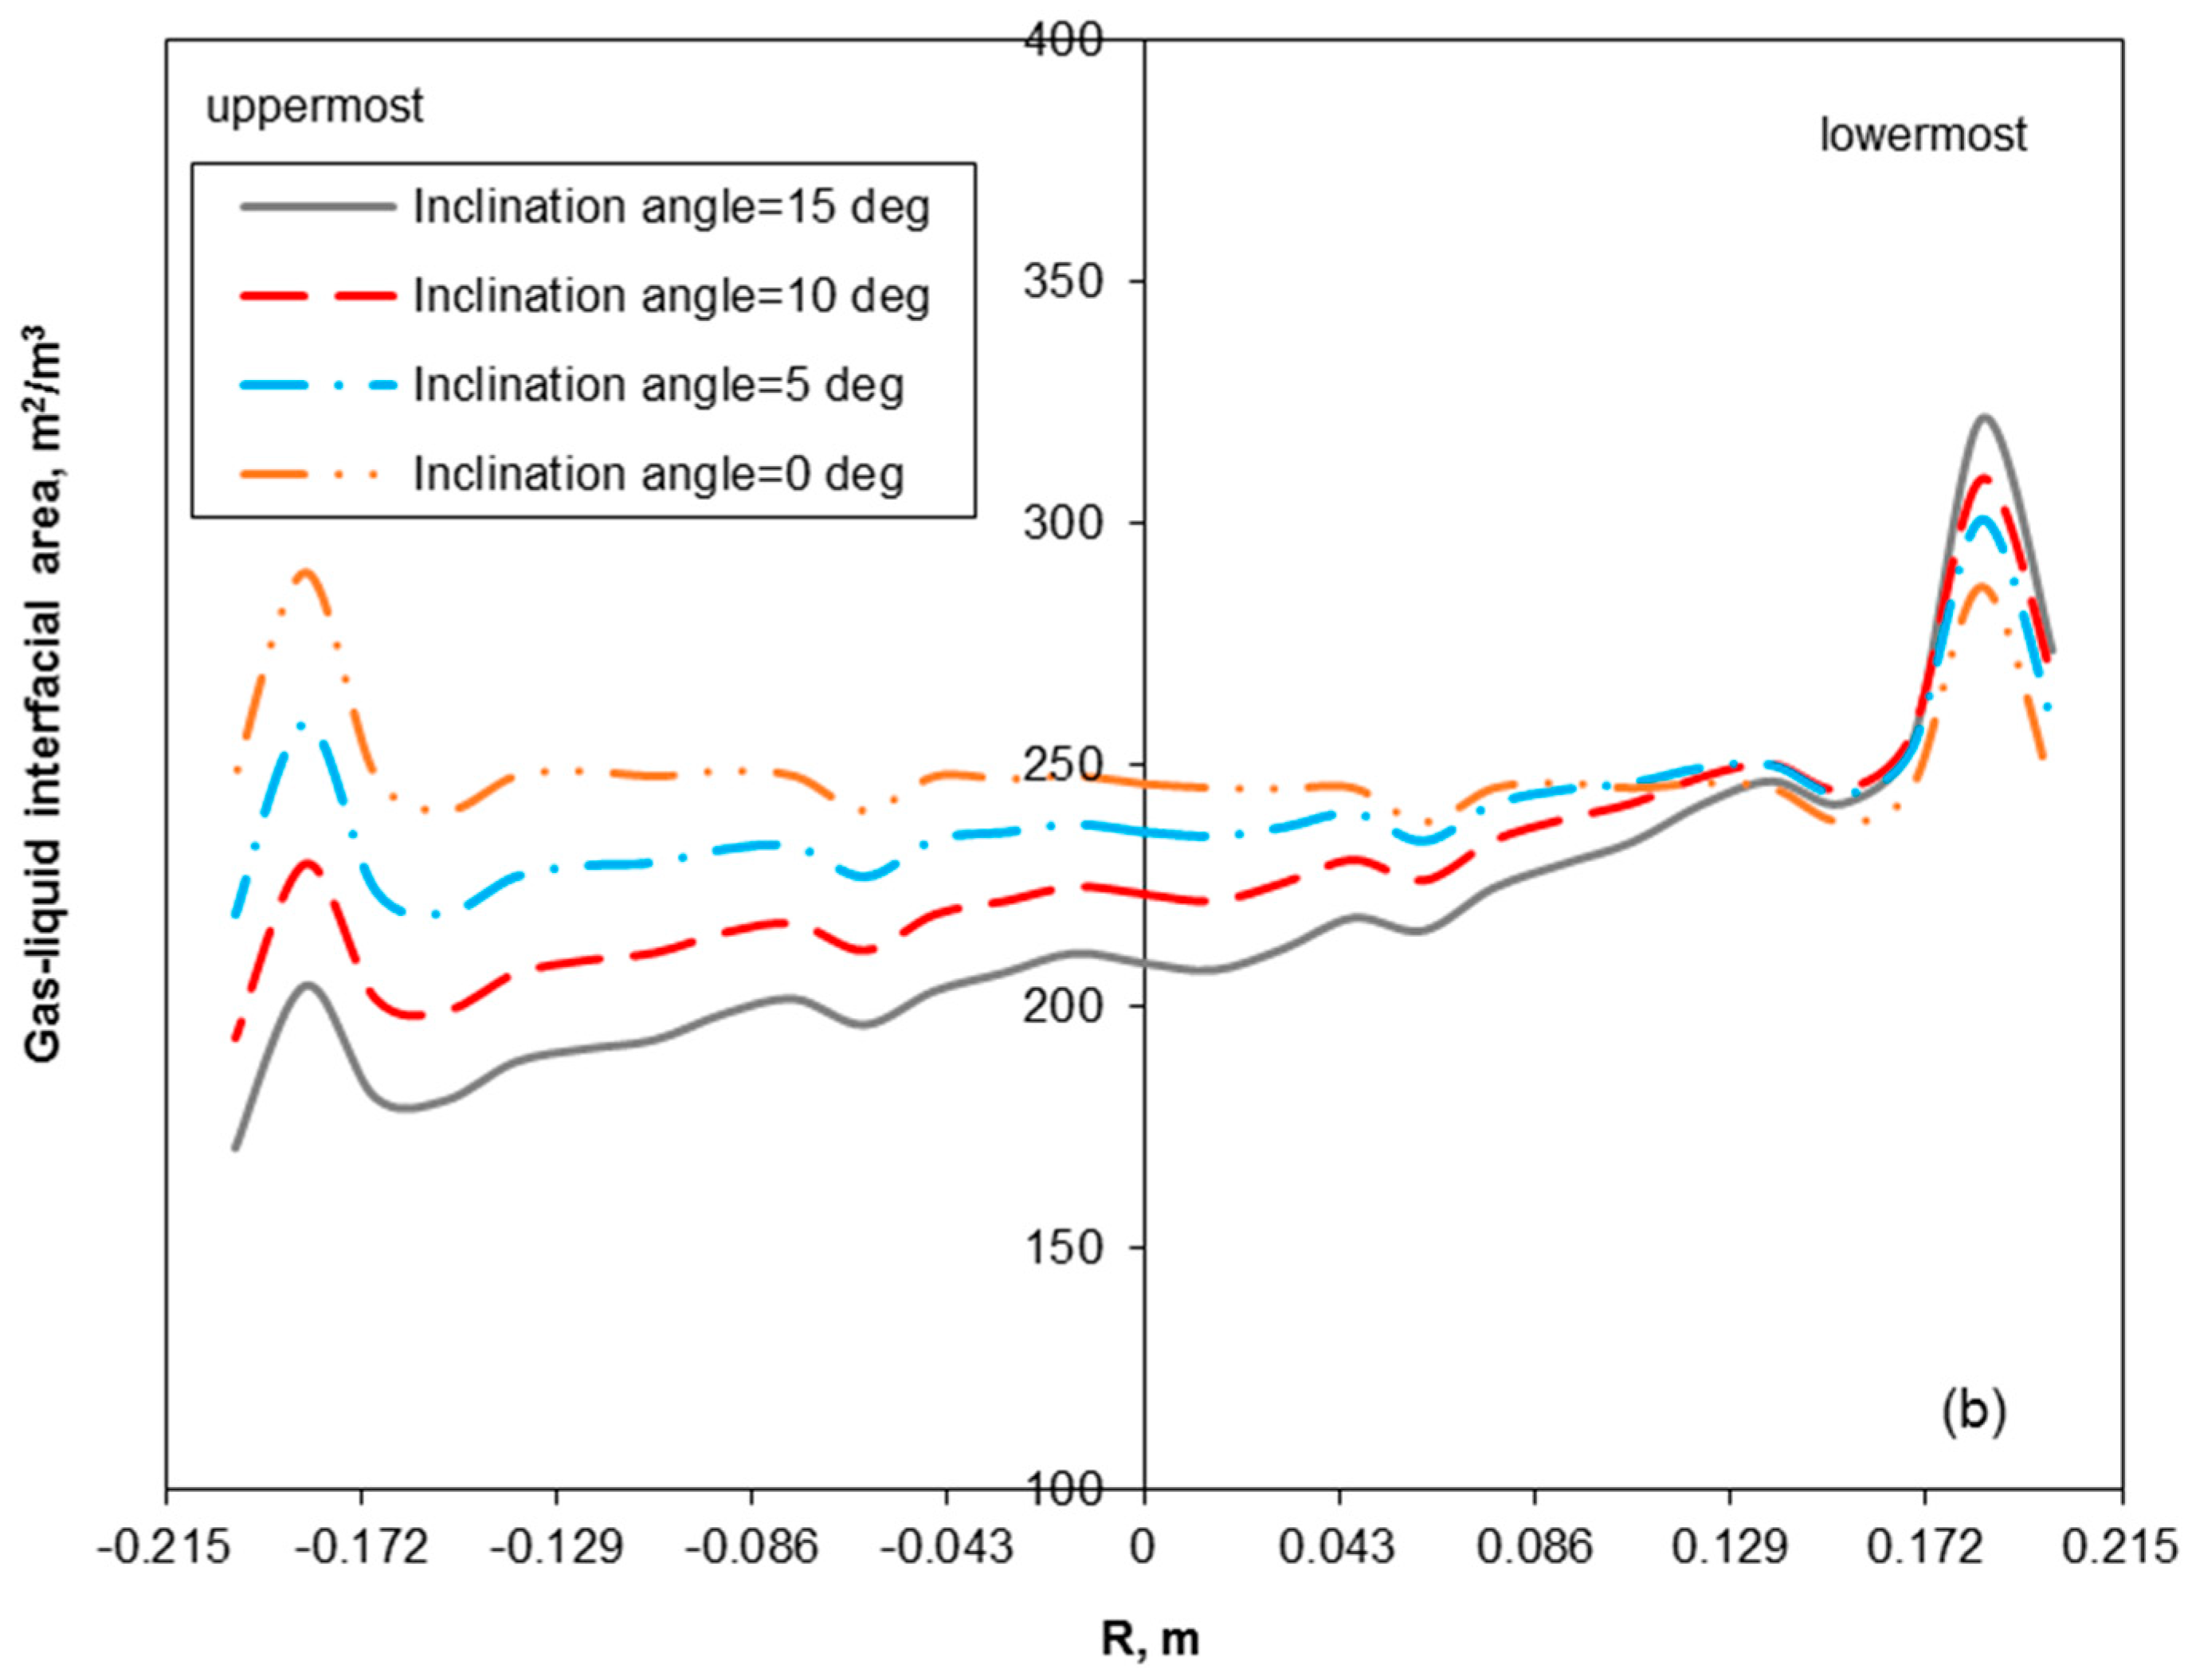
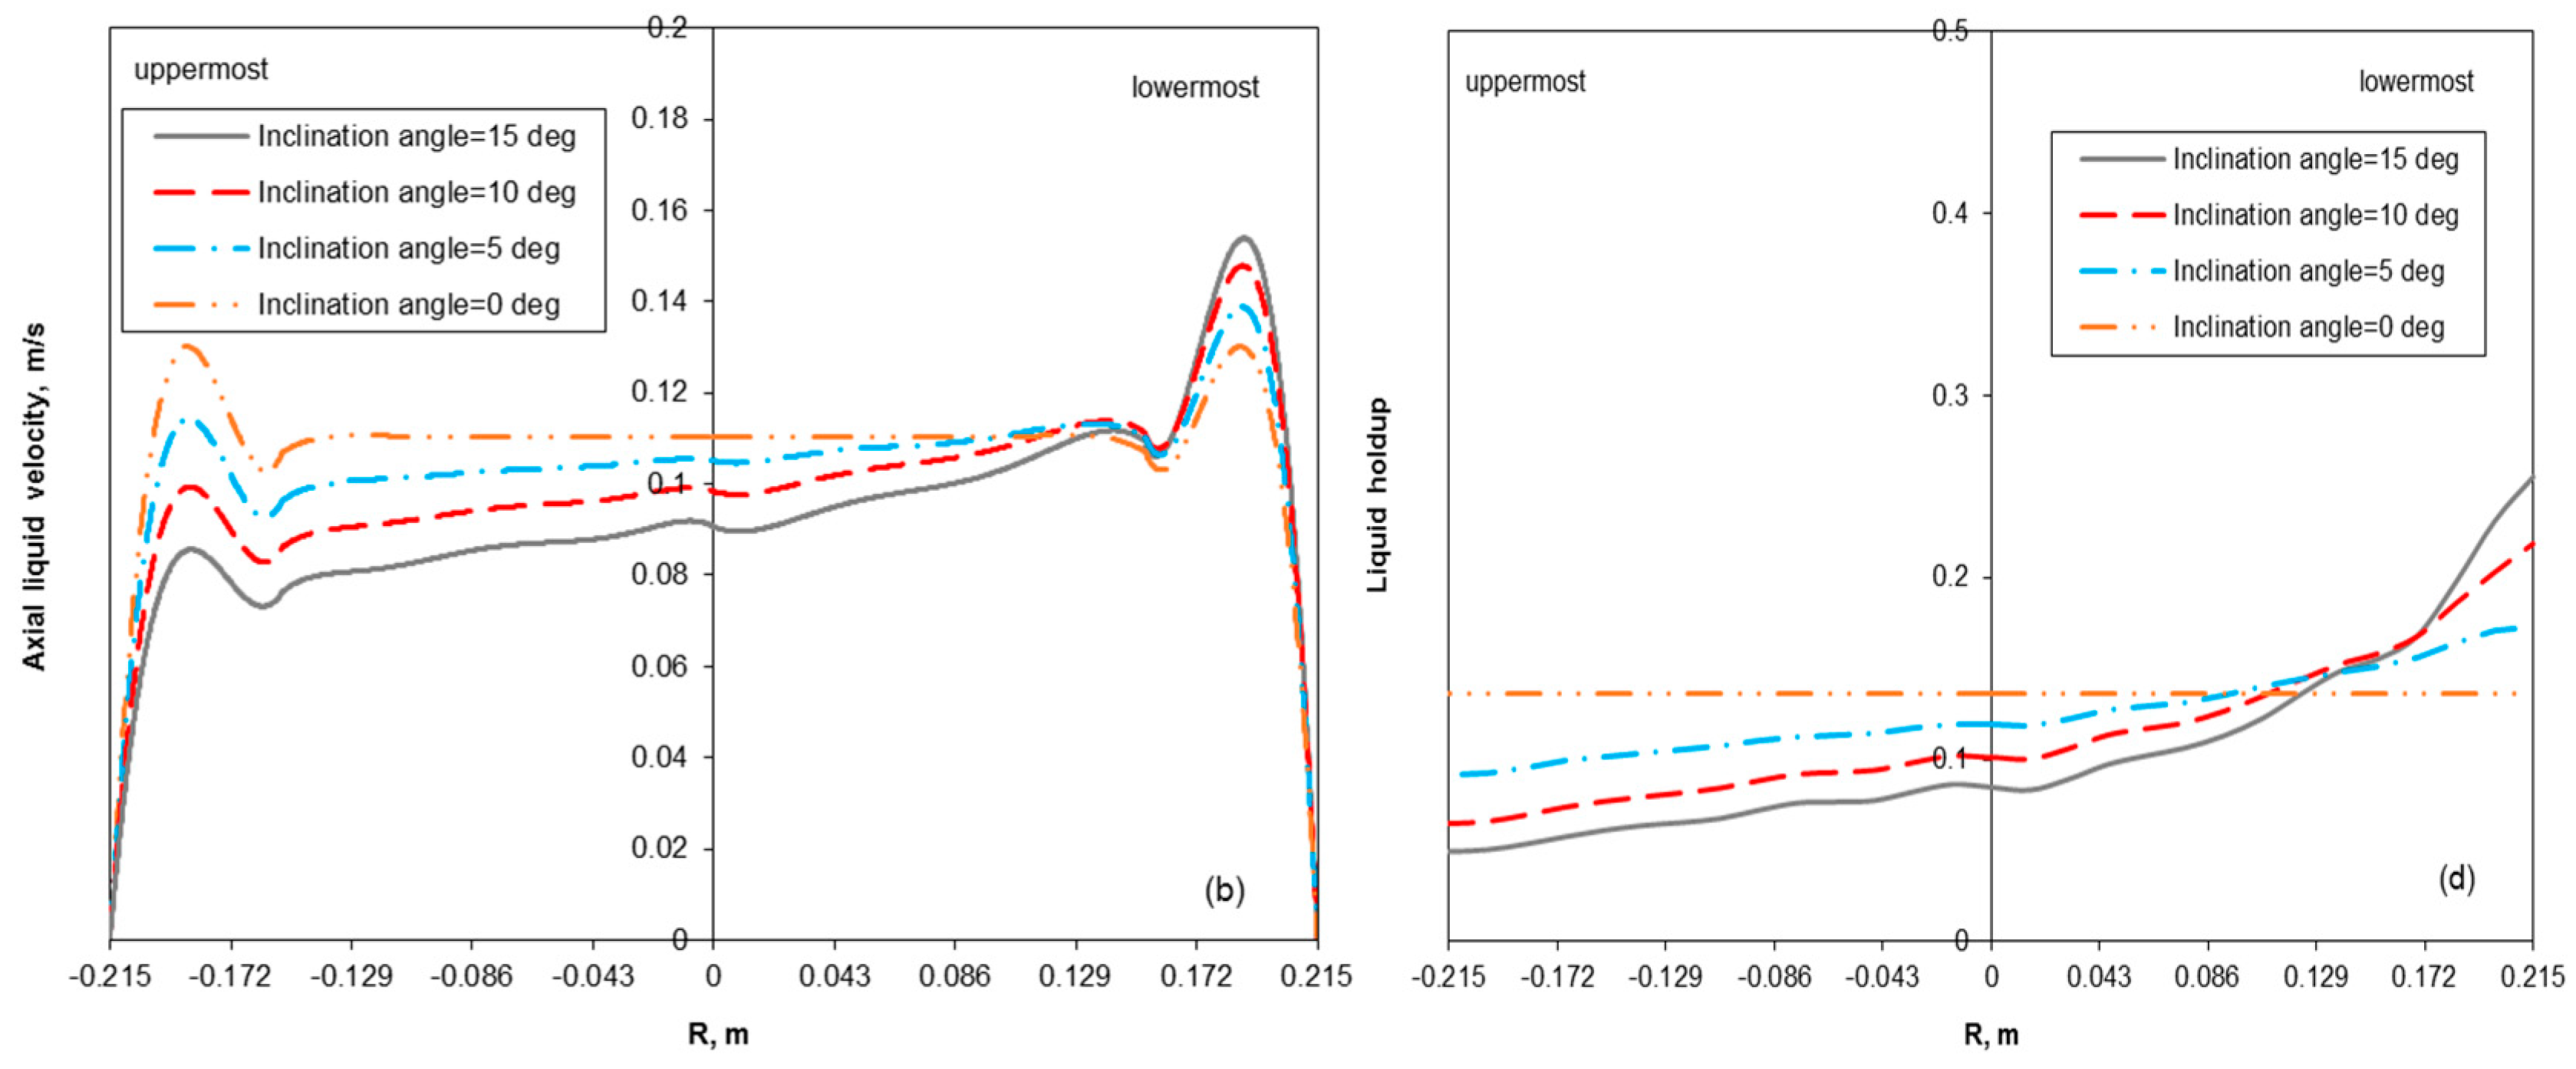
3.2. Removal Performance in Vertical and Inclined Packed-Bed Columns

In vertical packed-bed columns, under similar operating conditions (Table 2), the comparable preloading hydrodynamics (not shown) generates a similar NOx, SO2 and CO2 removal efficiency when working with third generation (I-Rings) and fourth generation (Raschig super-Rings No. 0.3) packings (Figure 5 and Figure 6). The removal performance of packed-bed column with Pall-Rings exceeds marginally the removal performance of scrubbers filled with I-Rings and Raschig super-Rings, due to the larger specific surface area of the packings. However, the modern random packings give much smaller two-phase pressure drop than Pall-Rings (Figure 7), while maintaining comparable removal efficiency (Figure 5 and Figure 6). The similar hydrodynamics of packed-bed column reactors with third and fourth generation random packings results from comparable bed porosity and packing specific area (Table 2). With the increase of scrubber pressure, the NOx removal process is improved because of the increased reaction rate of NO gas phase oxidation which is rate-limiting in the absorption process. The impact of pressure on SO2 removal is even more significant and, at large pressure, SO2 is totally removed in the entrance region of the scrubber. SO2 removal is completely in the entire range of scrubber pressure and when the pressure increases SO2 is removed more quickly. Working with large pressure and large packed bed heights speed up the rate limiting pressure dependent NO oxidation reaction leading to a large NOx removal efficiency. Moreover, the physical absorption of CO2 in seawater is significantly amplified at high pressure. However, even if the seawater scrubbing at elevated pressure increases the capital cost and the energy requirement we implemented this approach for offshore conditions because of: (i) Simultaneous cut of SO2 and NOx from exhaust gas; (ii) 100% removal of SO2 although the sulfur concentration in the fuel is larger than 3.5%; (iii) avoidance of the losing of engine power because of the large counter pressure to the incoming exhaust (which takes place in scrubbers operated at atmospheric pressure because of the pressure drop in the packed-bed column). Additional advantages are given in Section 1.
NOx removal efficiency declines at larger packed-bed column inclinations (Figure 8 and Figure 9), even if the local N2O4 absorption process improves in the lowermost area located in the neighborhood of the wall on the slanted side of the scrubber. The higher scrubber pressure pulls up NO oxidation reaction yielding additional NO2 for absorption, especially in the lowermost area. This averts large deficits in NOx removal at large scrubber inclinations. In the case of packed-bed columns with considerable height, the rate of production of NO2 from NO is balanced by the rate of consumption via N2O4 absorption in seawater in the entire range of scrubber inclination (Figure 9). However, NOx removal efficiency is not downgraded significantly by the inclination of packed-bed column, as in the case of other removal processes [22,24,26], because of the large operational pressure and because the diffusion of N2O4 into the liquid phase is associated with a rapid pseudo first-order reaction between N2O4 and a large excess of water. CO2 physical absorption efficiency is lowered at larger packed-bed column inclinations (Figure 10) although the local physical absorption process expands in the lowermost area. As in the case of NOx removal, the higher scrubber pressure reduces the deficit in CO2 removal at large packed-bed column inclinations. Thus, the pressure is a key design parameter which affects the operation of the scrubber column and the removal of both NOx and CO2 under vertical and inclined conditions. SO2 is removed quickly (verifying the assumption of no reaction between SO2 and NO2 in the gas phase) and the removal efficiency is not reduced by the inclination of packed-bed column (Figure 11) because the absorption is an instantaneous reversible reaction with respect to mass transfer (enhancement factor between 6 and 10) and the absorption rate is entirely limited by reactants diffusion. The simulations were carried out in inclined packed-bed columns with fourth generation Raschig super-Rings under the operating conditions listed in Table 2 (the gas composition emulates typical emissions of marine diesel engines: Nielsen et al. [1]; Yang et al. [6]; Tang et al. [14]).
The downgrading of NOx and CO2 removal performance at scrubber inclination is linked to the loss of axial symmetry of two-phase flow in the radial direction (e.g., Figure 12 for liquid holdup and axial velocity) which leads to an asymmetric gas-liquid mass transfer because of asymmetric gas-liquid interfacial areas (Figure 13), and asymmetric temperature and scrubber performance (Figure 14). Such setbacks are the result of secondary liquid flows induced by the gravity-forced movement of liquid towards the lowermost area [17,24]. This tendency is slightly amplified by the higher temperature (mainly in the area with considerable NO, SO2 and CO2 gas phase concentration) initiated in the uppermost side of the scrubber (Figure 14), where liquid flow decelerated occasioning weakening of the local NOx and CO2 removals. Another factor at the decrease of NOx and CO2 absorption efficiency at larger scrubber inclinations is linked to the deterioration of gas-liquid mass transfer in the uppermost zone which is partially caught up by the improved NOx and CO2 removal in the lowermost zone. However, the reduction of NOx and CO2 absorption performance at large inclinations can be contained by rising the scrubber pressure.
Rise of liquid flow rate in the vertical position improves NOx and CO2 removal performance. Contrarily, at considerable scrubber inclinations the underperformance of NOx and CO2 removal process becomes higher with the increase of liquid velocity (Figure 15) and follows the considerable shift of axial symmetry of two-phase flow in the radial direction (illustrated in Figure 16a,b for liquid axial velocity and in Figure 16c,d for liquid holdup). The reason of this atypical behavior is the high complexity of the mechanism of nitrogen oxides absorption involving reactions in both liquid and gas (NO oxidation reaction: Limiting step in the absorption process) phases and gas-liquid mass transfer. Also, the significant decline of the liquid holdup and velocity in the uppermost area (Figure 16) is related with the reinforcement of the gas-liquid mass transfer resistance which downgrades considerably the local N2O4 and CO2 absorption processes (the increase of the gas phase residence time does not affect significantly NOx and CO2 removal). Additionally, NO oxidation reaction and physical CO2 absorption are negatively affected by the amplification of temperature in the uppermost area (Figure 14a) which induces the reduction of gas solubility in the liquid phase. For comparison, in inclined packed-bed columns for simultaneous absorption of CO2 and H2S in MEA the underperformance of the absorption process at considerable packed bed inclinations can be contracted by increasing the liquid velocity [26].

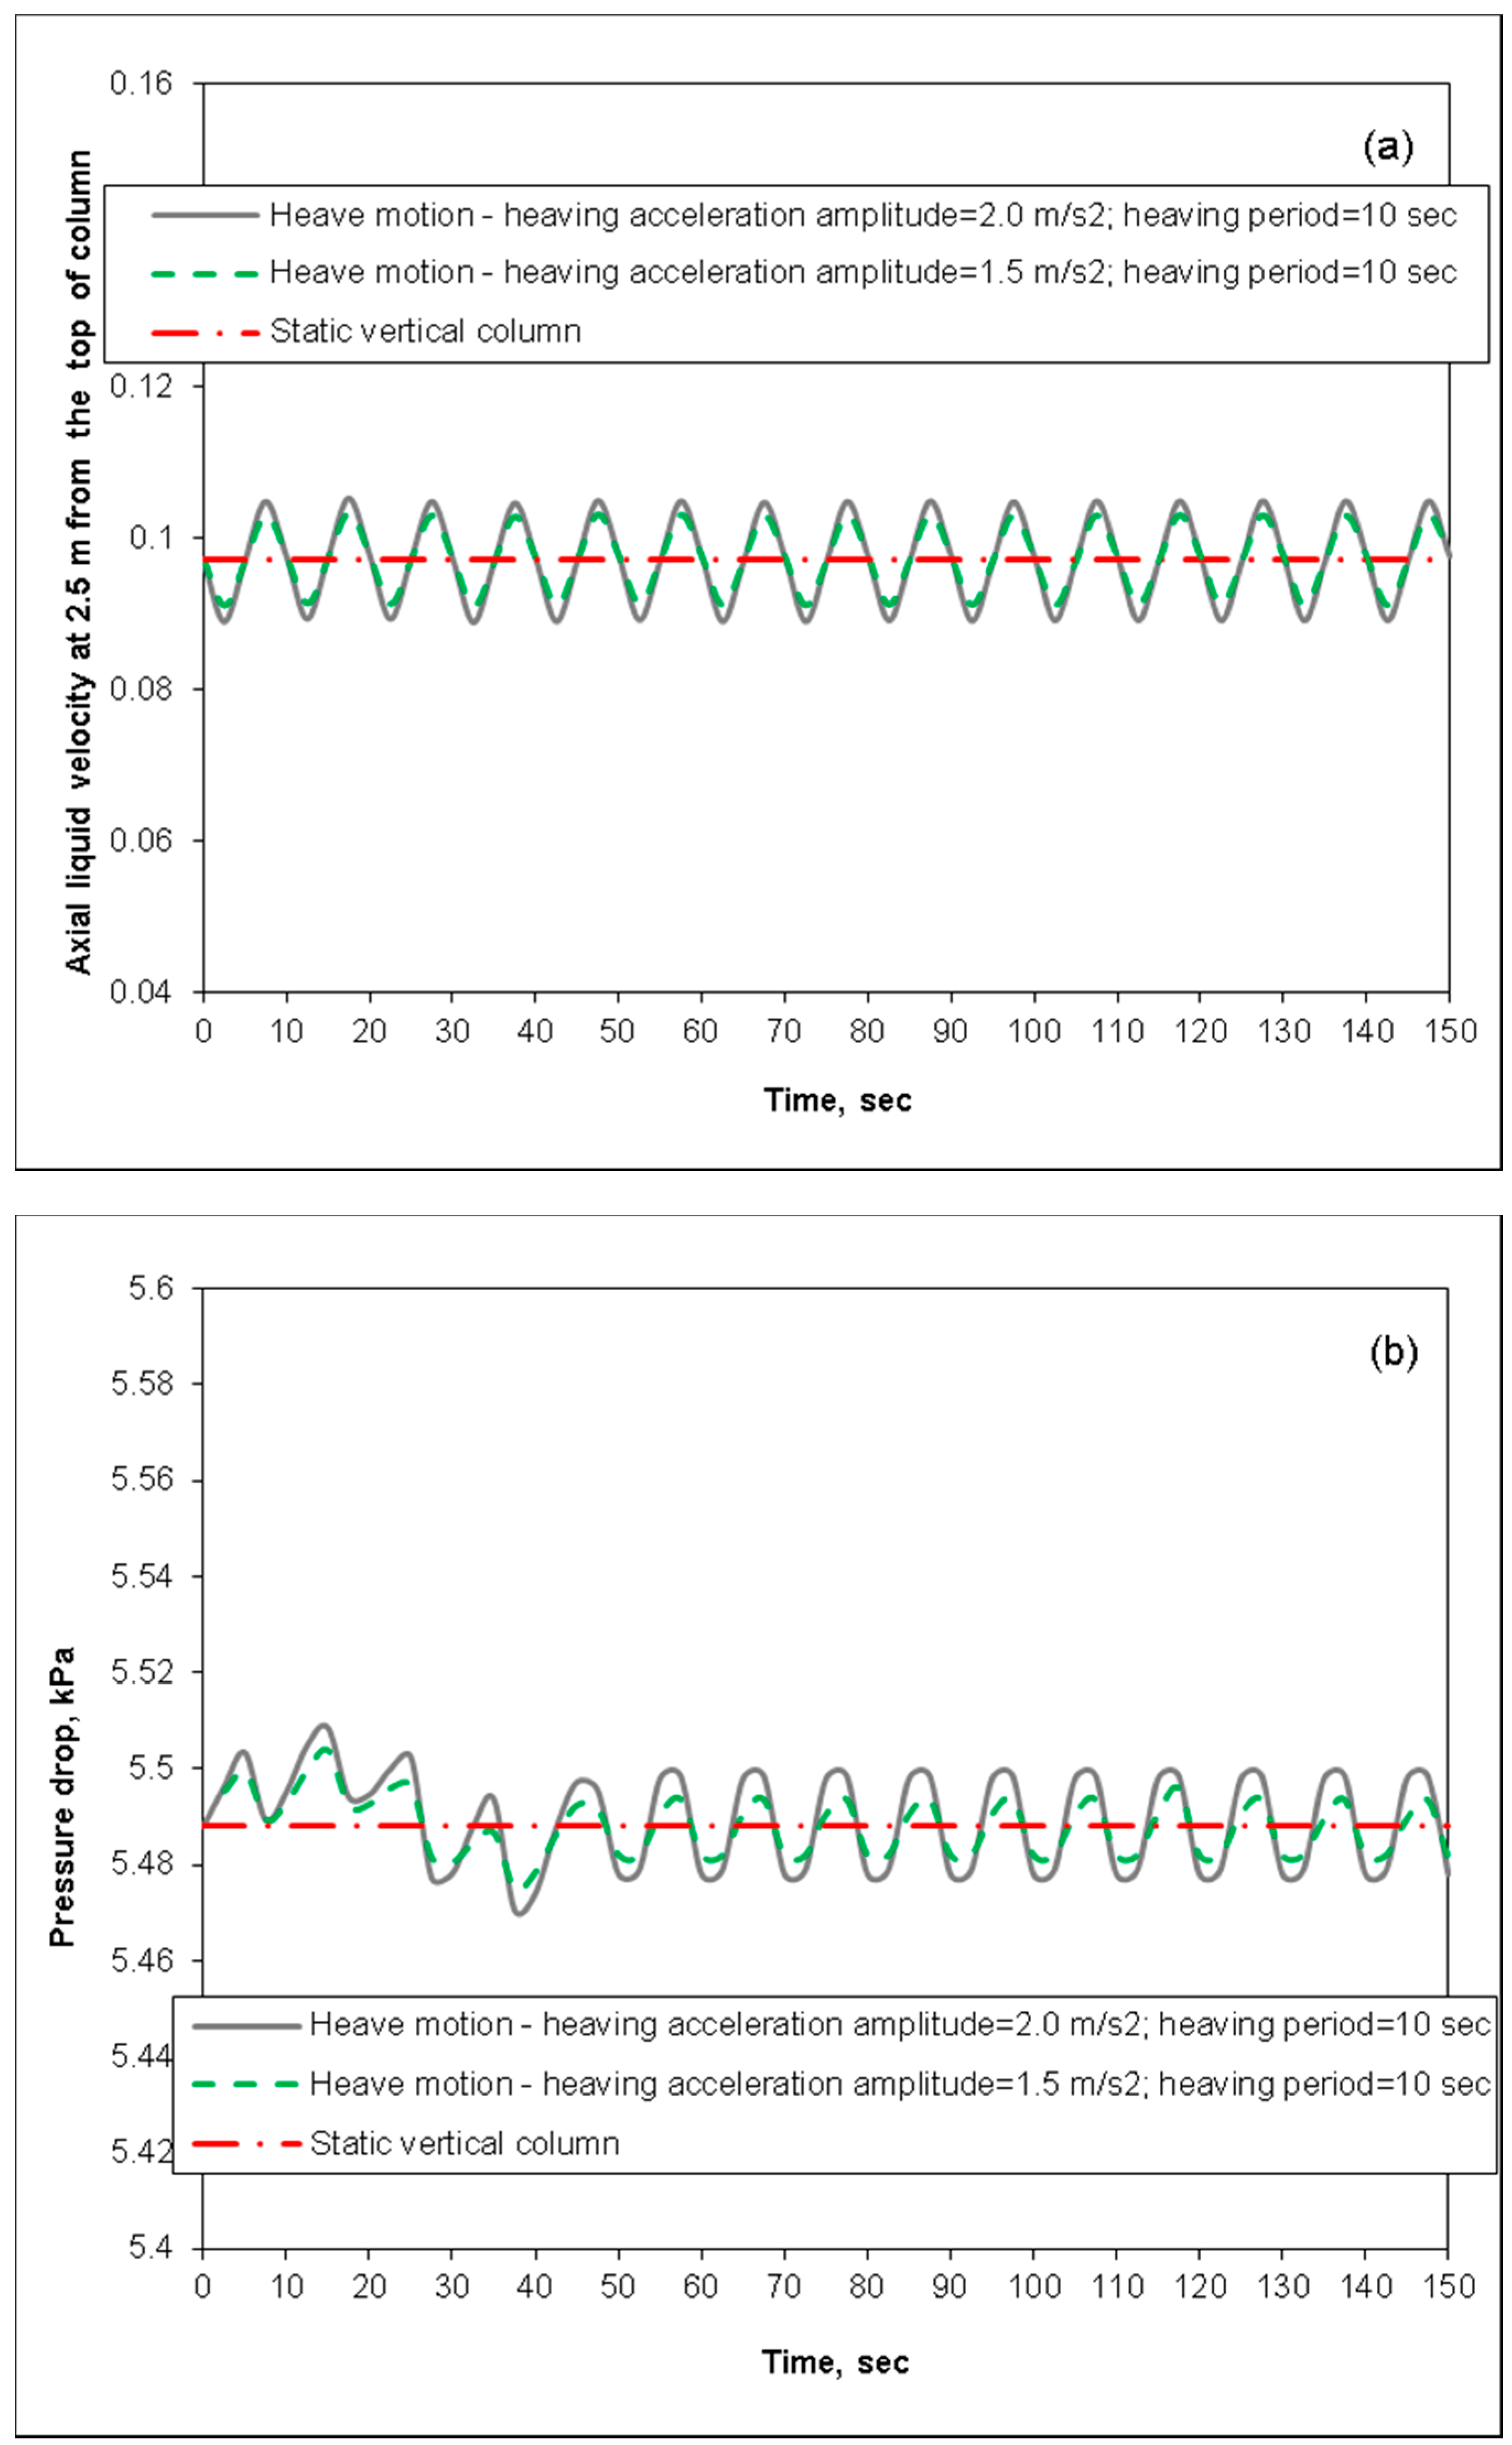
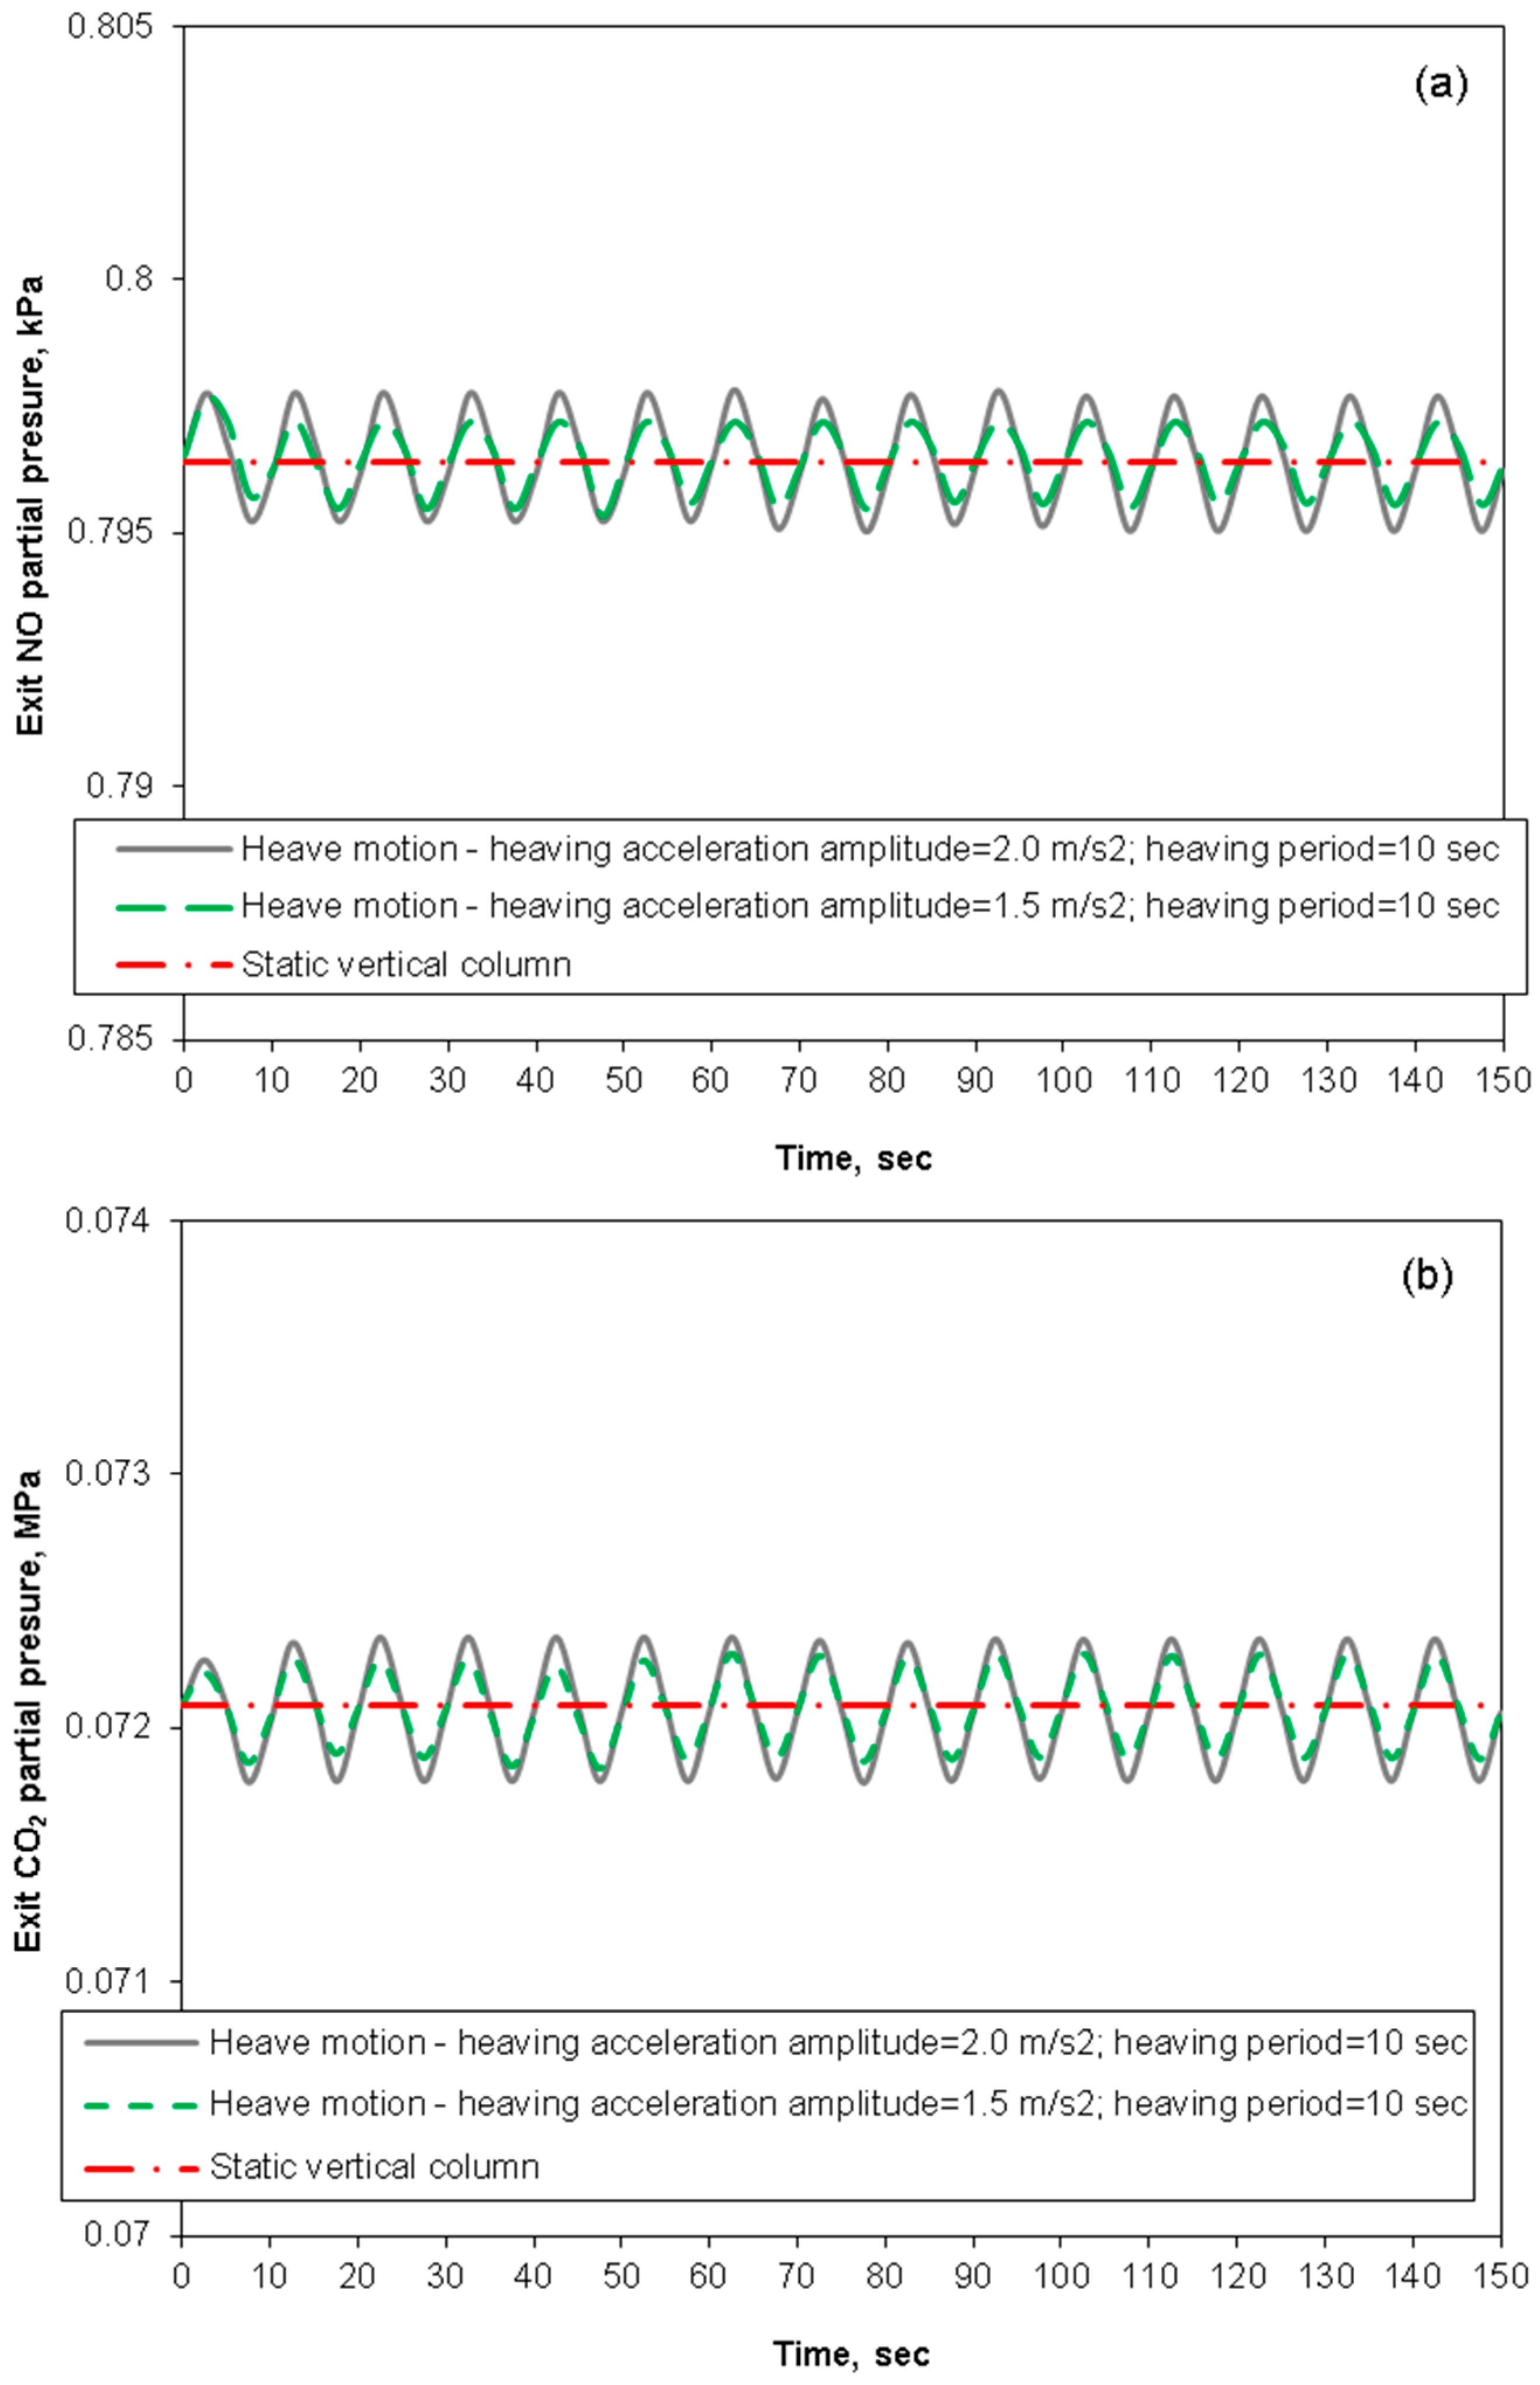
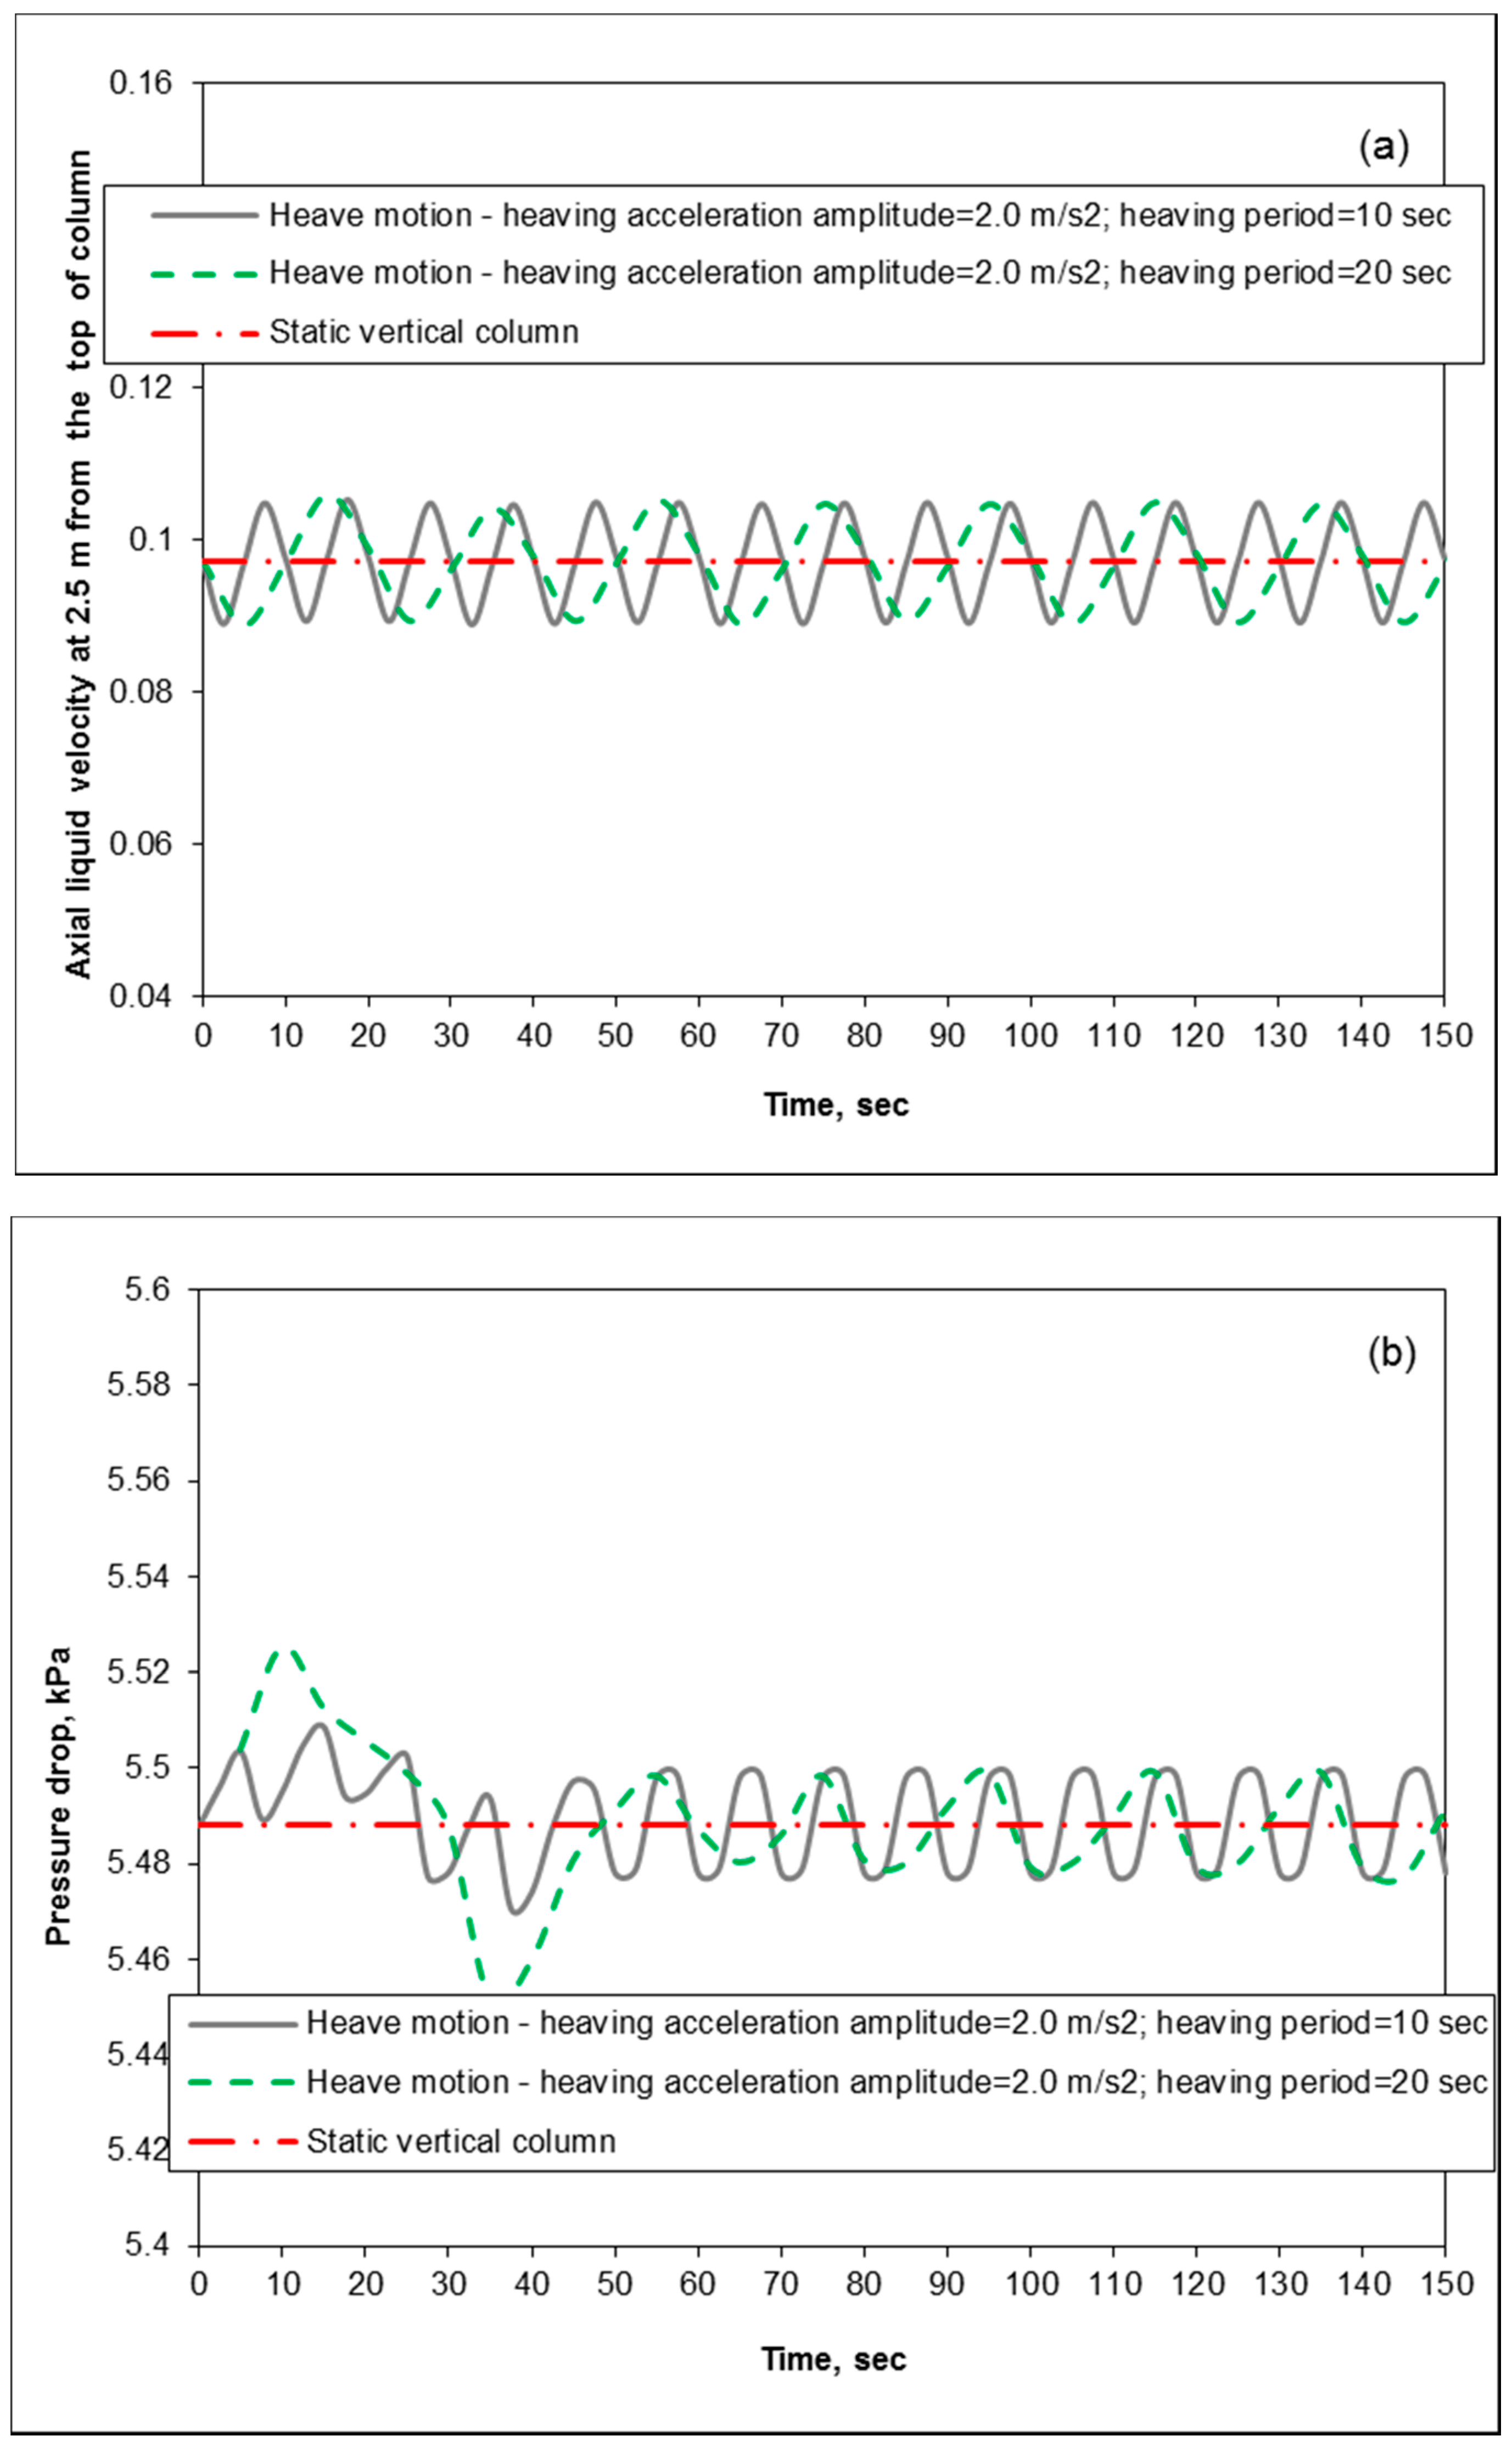
3.3. Removal Performance in Packed-Bed Column under Heaving Motion Conditions

Submitted to a heaving motion (Figure 1iii), the column feels heaving acceleration added to the gravitational acceleration. A sinewave function was used to reproduce the heaving acceleration as a function of time [26].
The impact of heaving on scrubber hydrodynamics and NOx and CO2 removal performance is illustrated in Figure 17, Figure 18, Figure 19 and Figure 20. The heaving acceleration amplitudes were programmed to be 1.5 and 2 m/s2 [51] with heaving periods of 10 and 20 s. Heaving generates disturbance waves in two-phase countercurrent flow (illustrated for two-phase pressure drop and liquid axial velocity in Figure 17 and Figure 19) around the steady-state solutions of the vertical scrubber static condition preceding the heaving motion with the wave height which expands at large heaving acceleration amplitude (Figure 17) and with longer wavelength at large heaving motion periods (Figure 19). As soon as seawater scrubber moves up, liquid axial velocity decreases and becomes smaller than its value in the static state preceding the heaving motion. Subsequently, the local relative velocity between the two fluids decreases and generates lower local interphase momentum exchange rates followed by a lower pressure drop. On the contrary, when seawater scrubber moves down the local liquid axial velocity and two-phase pressure drop increase and becomes higher than their values in the vertical scrubber static state. The waves in two-phase countercurrent flow have the crest and trough when the heaving acceleration comes close to the maximum (scrubber in bottom position) or minimum (scrubber in top position).
The impact of heaving is more notable on NOx and CO2 removal performance because SO2 absorption is an instantaneous reaction with respect to mass transfer. Similarly, the oscillatory seawater scrubber NOx and CO2 removal performance, generated by oscillatory two-phase flow and gas-liquid mass transfer, is a function of the heaving acceleration (Figure 18 and Figure 20). NO and CO2 concentration waves, whose heights follow the extent of heaving acceleration amplitude (Figure 18), vary around the steady-state solution of the scrubber static state preceding the heaving motion. NO and CO2 partial pressure waves attain the crest and trough when the heaving acceleration comes close to minimum (scrubber in top position) or maximum (scrubber in bottom position); these seawater scrubber positions match the trough and crest of two-phase countercurrent flow waves.
Also, the oscillatory seawater scrubber removal performance is shaped by the magnitude of the heaving motion period (Figure 20). Time-dependent waves with longer wavelength are noticed at large heaving motion periods because of the amplification of oscillatory two-phase flow. The fluctuation periods of the waves are similar to the heaving motion period (after a transitional time in the case of two-phase pressure drop).

3.4. Removal Performance in Asymmetric/Symmetric Oscillating Packed-Bed Column

Under the episode of oscillation motion (Figure 1-iv, v, vi), the scrubber moves between vertical and an inclined position or between two asymmetrical/symmetrical inclined positions with a sinusoidal angular velocity [52].
Asymmetric oscillating scrubbers underperform with respect to the vertical configuration (Figure 21). The systematic cyclic variations of the extent of reverse secondary liquid flow, attributable to radial and azimuthal buoyancy force, inducts oscillatory two-phase flow (Figure 22) leading to oscillatory scrubber performances (Figure 21). Under the episode of asymmetric (vertical-inclined position move) oscillation, NO and CO2 partial pressure time-dependent waves evolve not far from the steady-state solution of the median inclination angle (Figure 22) and mirror in magnitude the asymmetry of two-phase flow. The absorption performance waves move toward a steady-state solution of vertical scrubber when the asymmetry of the two inclined positions of the scrubber downgrades (not shown). However, the removal efficiency of SO2 absorption remains unaffected under asymmetric externally-induced periodic oscillations.
Two-phase countercurrent flow and absorption efficiency in symmetric oscillating packed-bed columns have been simulated for other reaction cases [24]. Their trends were found transposable to the present reaction case for simultaneous NOx, SO2 and CO2 absorption in seawater with the exception of SO2 absorption efficiency which keeps unaltered as for asymmetrical oscillatory motion. Symmetric oscillatory motion reflects in NOx and CO2 removal performance disturbance waves around the steady-state vertical column solution with an extent determined by the angular motion parameters.

4. Conclusions

Simultaneous removal of NOx and SO2 emissions from large marine diesel engines by seawater scrubbing was studied in countercurrent random packed-bed columns exposed to static inclination and heaving/oscillating motion via a 3-D dynamic model.
Simulation of seawater scrubber with fourth generation random packing (Raschig super-Rings) predicts smaller two-phase pressure drop in comparison with traditional Pall-Rings while maintaining comparable removal efficiency for the pollutants. Working at elevated pressure promotes the rate limiting NO oxidation reaction leading to a large NOx removal efficiency. Moreover, the physical absorption of CO2 is improved significantly at high pressure.
SO2 is absorbed quickly and the removal efficiency is not lowered by the inclination of seawater scrubber. In contrast, NOx and CO2 removal efficiency are both negatively impacted at large packed-bed column inclinations even if the local N2O4 and CO2 absorption processes improve close to the wall region on the inclined side of the scrubber. The decay of NOx and CO2 removal performance at large scrubber inclinations is reduced rising the pressure promoting gas-phase NO oxidation and yielding additional N2O4 for absorption, especially in the lowermost area. Nevertheless, NOx removal efficiency is not significantly lowered by the scrubber inclination, unlike previously analyzed reaction cases, because of the larger pressure and because liquid diffusion of N2O4 is accompanied by a rapid pseudo first-order reaction.
Heaving motion produces oscillatory patterns for NOx and CO2 removal performance around the steady-state solution of the stationary scrubber. Exit NO and CO2 partial pressure waves attain the crest/trough when the heaving acceleration comes close to the minimum/maximum values (scrubber in top/bottom position), and this matches the trough/crest of two-phase countercurrent flow waves. The oscillatory seawater scrubber removal performance is a function of the heaving acceleration.
Asymmetric oscillating motion (vertical-inclined position move) deteriorates the removal performance which evolves by means of waves not far from the steady-state solution of the middle inclination angle. NO and CO2 absorption performance waves are moving toward a steady-state solution of vertical scrubber when the asymmetry of the two inclined positions of the scrubber downgrades. Symmetric oscillation gives performance disturbance waves around the steady-state solution of the vertical seawater scrubber which is fashioned by the parameters of angular motion.

Author Contributions

Conceptualization, I.I. and F.L.; Methodology, I.I.; Software, I.I.; Validation, I.I.; Formal Analysis, I.I.; Investigation, I.I.; Resources, I.I. and F.L.; Data Curation, I.I.; Writing-Original Draft Preparation, I.I.; Writing-Review & Editing, I.I. and F.L.; Visualization, I.I.; Supervision, F.L.; Project Administration, F.L.; Funding Acquisition, F.L.

Funding

This research was funded by the Canada Research Chair “Sustainable Energy Processes and Materials”, and the FQRNT-funded “Center in Green Chemistry and Catalysis” (CGCC).

Acknowledgments

Support from the Natural Sciences and Engineering Research Council of Canada, the Canada Research Chair “Sustainable Energy Processes and Materials”, and the FQRNT-funded “Center in Green Chemistry and Catalysis” (CGCC) is gratefully acknowledged.

Conflicts of Interest

The authors declare no conflict of interest.

Notation

agas-liquid interfacial area, m2/m3
ahacceleration of heaving, m/s2
a h 0 heaving acceleration amplitude, m/s2
aspacking specific surface area (surface packing area/column volume), m2/m3
cp,αspecific heat capacity of α-phase ( α = g , ), J/kgK
Cjconcentration of species j, kmol/m3
dpeffective particle diameter, m
Dcolumn diameter, m
D j molecular diffusivity coefficient of species j in the liquid phase, m2/s
D ( g ) liquid and gas dispersion coefficients, m2/s
Emass transfer enhancement factor
E1, E2Ergun constants
fewetted fraction of the packing area
f int , g interaction force exerted on gas phase, N/m3, f int , g , z ( r , θ ) = f e F g , z ( r , θ ) + ( 1 f e ) F g s , z ( r , θ )
f int , interaction force exerted on liquid phase, N/m3,
f int , , z ( r , θ ) = ε f e ε ε g [ f e F g , z ( r , θ ) + ( 1 f e ) F g s , z ( r , θ ) ] f e F s , z ( r , θ ) .
F d , g m mechanical dispersion force in gas, N/m3,
F d , g , z ( r , θ ) m = ( 1 f e ) K g s u d g , z ( r , θ ) + ε f e K i g ( u d g , z ( r , θ ) u d , z ( r , θ ) )
F d , m mechanical dispersion force in liquid, N/m3,
F d , , z ( r , θ ) m = f e K s u d , z ( r , θ ) ε f e K i g ( u d g , z ( r , θ ) u d , z ( r , θ ) )
F g gas-liquid drag force, N/m3,
F g , z ( r , θ ) = { E 1 36 a s 2 μ g ( ε ε f e ) 2 + E 2 6 a s ε g ( ε ε f e ) 2 ρ g j r z 2 + j r r 2 + j r θ 2 } j r z ( r , θ ) ε g
F g s gas-solid drag force, N/m3, F g s , z ( r , θ ) = { E 1 36 a s 2 μ g ε g ε 3 + E 2 6 a s ε g 2 ε 3 ρ g u g z 2 + u g r 2 + u g θ 2 } u g z ( r , θ ) ε
F s liquid-solid drag force, N/m3, F s , z ( r , θ ) = { E 1 36 a s 2 μ f e ε 2 + E 2 6 a s ε ρ u z 2 + u r 2 + u θ 2 } u z ( r , θ ) ε
ggravitational acceleration, m/s2
Hscrubber height, m
H j α molar enthalpy of species j in α-phase, kJ/kmol
H j , m 0 Henry’s law constant in molal unit
k4,5pseudo first-order reaction rate constant for N2O4 hydrolysis (Reaction 19), s−1
kggas phase mass transfer coefficient, m/s
k a volumetric liquid phase mass transfer coefficient, 1/s
Kceffective equilibrium constant of the SO2 absorption reaction, mol/L
mjmolal concentration of component j, kmol/kg, C j = m j ρ 1 + m j M H 2 O
Mjmolecular mass of component j, kg/kmol
Njinterfacial molar flux of component j, kmol/m2s, N j = D j C j x | x = 0
Preactor pressure, Pa
Pjpartial pressure of species j, Pa
Pccapillary pressure, Pa
rradial coordinate, m
Rideal-gas constant or reactor radius, m
R1reaction rate, kmol/m3s
Sspreading factor, m
ttime, s
Ttemperature, K
Tperiod of heaving/oscillating motion
uαinterstitial velocity of α-fluid, m/s
u d α drift velocity for phase α, m/s, u d α , z ( r , θ ) = S z ( r , θ ) | u α , z | ε α ε α z ( r , θ )
v s α α-phase superficial velocity, m/s
zaxial coordinate, m
Greek Letters
αangle of packed-bed column inclination with respect to the horizontal plane
α g heat transfer coefficient at the gas-liquid interface, J/m2sK
αmaxamplitude of the angular motion
εpacked bed porosity, -
εαα-phase holdup, -
Δ H r , S O 2 SO2 absorption reaction enthalpy, kJ/Kmol
Δ H r , N 2 O 4 N2O4 absorption reaction enthalpy, kJ/Kmol
λ α , r e f radial effective thermal conductivity of -phase, J/msK
μαα-phase dynamic viscosity, kg/ms
μ α e f α-phase effective viscosity (a combination of bulk and shear terms), kg/m s
ραα-phase density, kg/m3
σsurface tension, N/m
θazimuthal coordinate, m
Subscripts/Superscripts
ggas phase
igas-liquid interface
inscrubber inlet
liquid phase
rradial direction
transtransfer
zaxial direction
wscrubber wall

References

  1. Nielsen, R.F.; Haglind, F.; Larsen, U. Design and modeling of an advanced marine machinery system including waste heat recovery and removal of sulphur oxides. Energy Convers. Manag. 2014, 85, 687–693. [Google Scholar] [CrossRef] [Green Version]
  2. Wan, Z.; Zhu, M.; Chen, S.; Sperling, D. Pollution: Three steps to a green shipping industry. Nature 2016, 530, 275–277. [Google Scholar] [CrossRef] [PubMed]
  3. Goldsworthy, L. Exhaust emissions from ship engines–significance, regulations, control technologies. Aust. N. Z. Marit. Law J. 2010, 24, 21–30. [Google Scholar]
  4. Klara, J.M.; Woods, M.C.; Capicotto, P.J.; Haslbeck, J.L.; Kuehn, N.J.; Matuszewski, M.; Pinkerton, L.L.; Rutkowski, M.D.; Schoff, R.L.; Vaysman, V. Cost and Performance Baseline for Fossil Energy Plants: Volume 1: Bituminous Coal and Natural Gas to Electricity; DOE/NETL-2007/1281. Available online: https://www.nrc.gov/docs/ML1217/ML12170A423.pdf (accessed on 28 May 2019).
  5. Iloeje, C.; Field, R.; Ghoniem, A.F. Modeling and parametric analysis of nitrogen and sulfur oxide removal. Fuel 2015, 160, 178–188. [Google Scholar] [CrossRef]
  6. Yang, S.; Pan, X.; Han, Z.; Zhao, D.; Zheng, D.; Yan, Z. Removal of NOx and SO2 from simulated ship emissions using wet scrubbing based on seawater electrolysis technology. Chem. Eng. J. 2018, 331, 8–15. [Google Scholar] [CrossRef]
  7. Keilin, B.; Walitt, A.L. Method of Converting Sulfur Dioxide to Sulfuric Acid. U.S. Patent 3,649,188, 14 March 1972. [Google Scholar]
  8. White, V.; Torrente-Murciano, L.; Sturgeon, D.; Chadwick, D. Purification of oxyfuel-derived CO2. Int. J. Greenhouse Gas Control 2010, 4, 137–142. [Google Scholar] [CrossRef]
  9. Flagiello, D.; Erto, A.; Lancia, A.; Di Natale, F. Experimental and modelling analysis of seawater scrubbers for Sulphur dioxide removal from flue-gas. Fuel 2018, 214, 254–263. [Google Scholar] [CrossRef]
  10. Makkonen, M.; Repka, S. The innovation inducement impact of environmental regulations on maritime transport: A literature review. Int. J. Innov. Sustain. Dev. 2015, 10, 69–86. [Google Scholar] [CrossRef]
  11. IMO. Marpol Annex VI and NTC 2008, with Guidelines for Implementation, 2017 ed.; International Maritime Organization: London, UK, 2017. [Google Scholar]
  12. Andreasen, A.; Mayer, S. Use of seawater scrubbing for SO2 removal from marine engine exhaust gas. Energy Fuels 2007, 21, 3274–3279. [Google Scholar] [CrossRef]
  13. Darake, S.; Rahimi, A.; Hatamipour, M.S.; Hamzeloui, P. SO2 removal by seawater in a packed-bed tower: Experimental study and mathematical modeling. Sep. Sci. Technol. 2014, 49, 988–998. [Google Scholar] [CrossRef]
  14. Tang, X.-J.; Li, T.; Yu, H.; Zhu, Y.-M. Prediction model for desulphurization efficiency of onboard magnesium-base seawater scrubber. Ocean Eng. 2014, 76, 98–104. [Google Scholar] [CrossRef]
  15. Kim, Y.; Nam, B.W.; Kim, D.W.; Kim, Y.S. Study on coupling effects of ship motion and sloshing. Ocean Eng. 2007, 34, 2176–2187. [Google Scholar] [CrossRef]
  16. Gu, Y.; Ju, Y. LNG-FPSO: Offshore LNG solution. Front. Energy Power Eng. Chin. 2008, 2, 249–255. [Google Scholar] [CrossRef]
  17. Iliuta, I.; Larachi, F. Three-dimensional simulations of gas-liquid cocurrent downflow in vertical, inclined and oscillating packed beds. AIChE J. 2016, 62, 916–927. [Google Scholar] [CrossRef]
  18. Assima, G.P.; Dashliborun, A.M.; Larachi, F. Emulation of gas-liquid flow in packed beds for offshore floating applications using a swell simulation hexapod. AIChE J. 2015, 61, 2354–2367. [Google Scholar] [CrossRef]
  19. Iliuta, I.; Petre, C.F.; Larachi, F. Hydrodynamic continuum model for structured-packing-containing columns. Chem. Eng. Sci. 2004, 59, 879–888. [Google Scholar] [CrossRef]
  20. Lappalainen, K.; Mannienen, M.; Alopaeus, V. CFD modeling of radial spreading of flow in trickle-bed reactors due to mechanical and capillary dispersion. Chem. Eng. Sci. 2009, 64, 207–218. [Google Scholar] [CrossRef]
  21. Iliuta, I.; Larachi, F.; Fourati, M.; Raynal, L.; Roig, V. Flooding limit in countercurrent gas-liquid structured packed beds–Prediction from a linear stability analysis of an Eulerian two-fluid model. Chem. Eng. Sci. 2014, 120, 49–58. [Google Scholar] [CrossRef]
  22. Iliuta, I.; Larachi, F. Enzyme-mediated CO2 capture in oscillating structured packed-bed columns-Hydrodynamics and process performance for offshore applications. Ocean Eng. 2017, 144, 157–174. [Google Scholar] [CrossRef]
  23. Attou, A.; Ferschneider, G. A two-fluid hydrodynamic model for the transition between trickle and pulse flow in a cocurrent gas-liquid packed-bed reactor. Chem. Eng. Sci. 2000, 55, 491–511. [Google Scholar] [CrossRef]
  24. Iliuta, I.; Larachi, F. CO2 abatement in oscillating packed-bed scrubbers—Hydrodynamics and reaction performances for marine applications. AIChE J. 2016, 63, 1064–1076. [Google Scholar] [CrossRef]
  25. Iliuta, I.; Larachi, F. Thermal regeneration of amines in vertical, inclined and oscillating CO2 packed-bed strippers for offshore floating applications. Int. J. Greenhouse Gas Control 2018, 74, 229–250. [Google Scholar] [CrossRef]
  26. Iliuta, I.; Larachi, F. CO2 and H2S absorption by MEA solution in packed-bed columns under inclined and heaving motion conditions-Hydrodynamics and reactions performance for marine applications. Int. J. Greenhouse Gas Control. 2018, 79, 1–3. [Google Scholar] [CrossRef]
  27. Miller, D.N. Mass transfer in nitric acid absorption. AIChE J. 1987, 33, 1351–1358. [Google Scholar] [CrossRef]
  28. Bodenstein, M. The rate of the reaction between nitric oxide and oxygen. Zeit. Elektrochem. 1918, 34, 183–191. [Google Scholar]
  29. Bodenstein, M. Formation and dissociation of the higher nitrogen Oxide. Zeitschrift für Physikalische Chemie 1922, 100, 68–75. [Google Scholar]
  30. Dekker, W.W.; Snoeck, E.; Kramers, H. The rate of absorption of NO2 in water. Chem. Eng. Sci. 1959, 11, 61–71. [Google Scholar] [CrossRef]
  31. Eigen, M.; Kustin, K.; Maas, G. Die Geschwindigkeit der Hydratation von SO2 in Wassriger Losung. Zeitschrift für Physikalische Chemie 1961, 30, 130–136. [Google Scholar] [CrossRef]
  32. Chang, C.S.; Rochelle, G.T. SO2 absorption into aqueous solutions. AIChE J. 1981, 27, 292–298. [Google Scholar] [CrossRef]
  33. Ellison, T.K.; Eckert, C.A. The oxidation of aqueous SO2. The influence of nitrogen dioxide at low pH. J. Phys. Chem. 1984, 88, 2335–2339. [Google Scholar] [CrossRef]
  34. Taylor, R.; Krishna, R. Multicomponent Mass Transfer; John Wiley & Sons: New York, NY, USA, 1993. [Google Scholar]
  35. Dankworth, D.C.; Kevrekidis, I.G.; Sundaresan, S. Dynamics of pulsing in trickle beds. AIChE J. 1990, 36, 605–621. [Google Scholar] [CrossRef]
  36. Hikita, H.; Asai, S.; Nose, H. Absorption of sulfur dioxide into water. AIChE J. 1978, 24, 147–149. [Google Scholar] [CrossRef]
  37. Poling, B.E.; Prausnitz, J.M.; O’Connell, J.P. The Properties of Gases and Liquids, 5th ed.; McGraw-Hill: New York, NY, USA, 2001. [Google Scholar]
  38. Rodriguez-Sevilla, J.; Alvarez, M.; Diaz, M.C.; Marrero, M.C. Absorption equilibria of dilute SO2 in seawater. J. Chem. Eng. Data 2004, 49, 1710–1716. [Google Scholar] [CrossRef]
  39. Plummer, L.N.; Busenberg, E. The solubilities of calcite, aragonite and vaterite in CO2–H2O solutions between 0 and 90oC and an evaluation of the aqueous model for the system CaCO3-CO2-H2O. Geochimica et Cosmochimica Acta 1982, 46, 1011–1040. [Google Scholar] [CrossRef]
  40. Rodriguez-Sevilla, J.; Alvarez, M.; Liminana, G.; Diaz, M.C. Dilute SO2 absorption equilibria in aqueous HCl and NaCl solutions at 298.15 K. J. Chem. Eng. Data 2002, 47, 1339–1345. [Google Scholar] [CrossRef]
  41. Schumpe, A. The estimation of gas solubilities in salt solutions. Chem. Eng. Sci. 1993, 48, 153–158. [Google Scholar] [CrossRef]
  42. Weisenberger, S.; Schumpe, A. Estimation of gas solubilities in salt solutions at temperatures from 273 K to 363 K. AIChE J. 1996, 42, 298–300. [Google Scholar] [CrossRef]
  43. Armor, J.N. Influence of pH and ionic strength upon solubility of NO in aqueous solution. J. Chem. Eng. Data 1974, 19, 82–89. [Google Scholar] [CrossRef]
  44. Weekman, V.W.; Myers, J.E. Heat transfer characteristics of concurrent gas-liquid flow in packed beds. AIChE J. 1965, 11, 13–17. [Google Scholar] [CrossRef]
  45. Onda, K.; Takeuchi, H.; Okumoto, Y. Mass transfer coefficients between gas and liquid phases in packed columns. J. Chem. Eng. Jpn. 1968, 1, 56–63. [Google Scholar] [CrossRef]
  46. Sater, V.E.; Levenspiel, O. Two-phase flow in packed beds. Evaluation of axial dispersion and holdup by moment analysis. Ind. Eng. Chem. Fundam. 1966, 5, 86–92. [Google Scholar] [CrossRef]
  47. Otake, T.; Kunugita, E. Axial dispersion of the gas phase in countercurrent packed bed columns. Kagaku Kogaku 1958, 22, 144–152. [Google Scholar] [CrossRef]
  48. Ziolkowski, D.; Szustek, S. Effect of fluid velocity radial profile on the radial mass dispersion in a fluid stream in a packed bed tubular apparatus. Chem. Eng. Sci. 1989, 44, 1195–1204. [Google Scholar] [CrossRef]
  49. Tontiwachwuthikul, P.; Meisenz, A.; Lim, C.J. CO2 absorption by NaOH, monoethanolamine and 2-amino-2-methyl-1-propanol solutions in a packed column. Chem. Eng. Sci. 1992, 47, 381–390. [Google Scholar] [CrossRef]
  50. Rambo, B.M.; Bucholz, T.L.; Powell, D.C.; Weber, L.E.; Linder, A.J.; Duesing, C.M.H.; Zaks, A. Polysilicate-Polysilicone Enzyme Immobilization Materials. U.S. Patent 8,895,280, 25 November 2014. [Google Scholar]
  51. Chen, W.Z.; Yu, L.; Hao, J.L. Thermal Hydraulics of Nuclear Power Plants; Chinese Atomic Energy Press: Bejing, China, 2013.
  52. Iliuta, I.; Larachi, F. Fischer-Tropsch synthesis in vertical, inclined and oscillating trickle-bed reactors for offshore floating applications. Chem. Eng. Sci. 2018, 177, 509–522. [Google Scholar] [CrossRef]
Figure 1. Configuration of seawater scrubber: (i) Vertical scrubber, (ii) inclined scrubber, (iii) scrubber under heaving motion, (iv) oscillating scrubber between two symmetrical inclined positions, (v) oscillating scrubber between the vertical and an inclined position, (vi) oscillating scrubber between two asymmetrical inclined positions.
Catalysts 09 00489 g001
Figure 2. Experimental and theoretical SO2 removal efficiency in a seawater structured packed-bed column packed with Sulzer Mellapak 250X (D = 0.1 m; H = 0.892 m). Experimental data were taken from Flagiello et al. [9].
Catalysts 09 00489 g002
Figure 3. Experimental and theoretical axial CO2 mole fraction (a) and temperature (b) profiles for CO2-MEA absorption in a countercurrent packed-bed column (D = 0.1 m; H = 6.55 m; CO2-2mol/L MEA system; Liquid flow rate = 13.5 m3/m2 h; Gas flow rate = 14.8 mol/m2s; Tin = 19 °C). Experimental data were taken from Tontiwachwuthikul et al. [49].
Catalysts 09 00489 g003
Figure 4. Experimental and theoretical axial CO2 mole fraction profiles for CO2-MEA absorption in a countercurrent random packed-bed column (D = 0.1 m; H = 6.55 m; 19.5% CO2-MEA system; Gas flow rate = 14.8 mol/m2s; Inlet CO2 mole fraction = 0.195; Tin = 19 °C). Experimental data were taken from Tontiwachwuthikul et al. [49].
Catalysts 09 00489 g004
Figure 5. SO2 and NO removal efficiency vs. scrubber pressure (H = 5 m): (a) Packed-bed column with Raschig super-Rings; (b) Packed-bed column with I-Rings; (c) Packed-bed column with Pall-Rings.
Catalysts 09 00489 g005aCatalysts 09 00489 g005b
Figure 6. Steady-state axial profiles of liquid phase CO2 concentration at different values of scrubber pressure (H = 5 m): (a) Packed-bed column with Raschig super-Rings; (b) Packed-bed column with I-Rings; (c) Packed-bed column with Pall-Rings.
Catalysts 09 00489 g006aCatalysts 09 00489 g006b
Figure 7. Steady-state axial profiles of gas-phase dimensionless pressure in random packed-bed columns (Base case operating conditions—Table 2; P = 2.5 MPa; H = 5 m).
Catalysts 09 00489 g007
Figure 8. NO and SO2 removal efficiency vs. seawater scrubber inclination angle (Packed-bed column with Raschig super-Rings).
Catalysts 09 00489 g008
Figure 9. Steady-state axial profiles of NO2 partial pressure at different values of seawater scrubber inclination angle (Packed-bed column with Raschig super-Rings): (a) H = 5 m; P = 1.5 MPa; (b) H = 8 m; P = 2.5 MPa.
Catalysts 09 00489 g009
Figure 10. CO2 removal efficiency vs. seawater scrubber inclination angle (packed-bed column with Raschig super-Rings): (a) H = 5 m; (b) H = 8 m.
Catalysts 09 00489 g010
Figure 11. Steady-state axial profiles of SO2 partial pressure at different values of scrubber pressure (Packed-bed column with Raschig super-Rings, Packed-bed column inclination angle = 15 deg): (a) H = 5 m; (b) H = 8 m.
Catalysts 09 00489 g011
Figure 12. Steady-state radial profiles of axial liquid velocity in x-axis (see Figure 1)—vertical and inclined seawater scrubbers (Packed-bed column with Raschig super-Rings; H = 5 m; z/H = 0.8): (a) Pressure = 1.5 MPa; (b) Pressure = 2.5 MPa.
Catalysts 09 00489 g012aCatalysts 09 00489 g012b
Figure 13. Steady-state radial profiles of gas-liquid interfacial area in x-axis (see Figure 1)—vertical and inclined seawater scrubbers (Packed-bed column with Raschig super-Rings; H = 5 m; z/H = 0.8): (a) Pressure = 1.5 MPa; (b) Pressure = 2.5 MPa.
Catalysts 09 00489 g013aCatalysts 09 00489 g013b
Figure 14. Steady-state radial profiles of liquid temperature (a) and NO partial pressure (b) in x-axis (see Figure 1)—vertical and inclined seawater scrubbers (Packed-bed column with Raschig super-Rings; H = 5 m; z/H = 0.8; Pressure = 2.5 MPa).
Catalysts 09 00489 g014aCatalysts 09 00489 g014b
Figure 15. NO (a) and CO2 (b) removal efficiency vs. seawater scrubber inclination angle at different values of liquid velocity (Packed-bed column with Raschig super-Rings; H = 5 m; Pressure = 2.5 MPa).
Catalysts 09 00489 g015
Figure 16. Steady-state radial profiles of cross-sectionally averaged liquid axial velocity (a,b) and liquid holdup (c,d) in x-axis (see Figure 1)—vertical and inclined seawater scrubbers (Packed-bed column with Raschig super-Rings; H = 5 m; z/H = 0.8; Pressure = 2.5 MPa): (a,c) Liquid superficial velocity = 0.035 m/s; (b,d) Liquid superficial velocity = 0.015 m/s.
Catalysts 09 00489 g016aCatalysts 09 00489 g016b
Figure 17. Time-dependent cross-sectionally averaged axial liquid velocity (a) and two-phase pressure drop (b) in a seawater scrubber under heaving motion conditions at different heaving acceleration amplitudes (Packed-bed column with Raschig super-Rings; H = 5 m; Pressure = 1.5 MPa).
Catalysts 09 00489 g017
Figure 18. Time-dependent exit NO (a) and CO2 (b) partial pressure in a seawater scrubber under heaving motion conditions at different heaving acceleration amplitudes (Packed-bed column with Raschig super-Rings; H = 5 m; Pressure = 1.5 MPa).
Catalysts 09 00489 g018
Figure 19. Time-dependent cross-sectionally averaged axial liquid velocity (a) and two-phase pressure drop (b) in a seawater scrubber under heaving motion conditions at different heaving motion periods (Packed-bed column with Raschig super-Rings; H = 5 m; Pressure = 1.5 MPa).
Catalysts 09 00489 g019
Figure 20. Time-dependent exit NO (a) and CO2 (b) partial pressure in a seawater scrubber under heaving motion conditions at different heaving motion periods (Packed-bed column with Raschig super-Rings; H = 5 m; Pressure = 1.5 MPa).
Catalysts 09 00489 g020
Figure 21. Time-dependent exit NO (a) and CO2 (b) partial pressure in a seawater scrubber under angular sinusoidal oscillatory motion between the vertical and an inclined (15°) position (Packed-bed column with Raschig super-Rings; H = 5 m; Pressure = 1.5 MPa; Travel time between the vertical/inclined and inclined/vertical positions = 10 s).
Catalysts 09 00489 g021aCatalysts 09 00489 g021b
Figure 22. Time-dependent cross-sectionally averaged liquid holdup (a) and liquid axial velocity (b) in a seawater scrubber under angular sinusoidal oscillatory motion between the vertical and an inclined (15°) position (Packed-bed column with Raschig super-Rings; H = 5 m; z/H = 0.5; Pressure = 1.5 MPa; Travel time between the vertical/inclined and inclined/vertical positions = 10 s).
Catalysts 09 00489 g022aCatalysts 09 00489 g022b
Table 1. Simulated and experimental data for enzymatic CO2 removal obtained in a structured packed-bed column with immobilized hCA II enzyme on Sulzer Mellapak 500X (experimental data of Rambo et al. [50]).
Enzyme Loading g / L reactor CO2 Conversion ExperimentalCO2 ConversionModel
1.8980.740.752
2.3010.730.7525
4.9310.730.753
5.0030.720.7533
5.6990.680.753
6.1470.720.753
Table 2. Parameters used in simulations.
Operating ConditionsData
Scrubber height5.0 and 8 m
Scrubber diameter0.43 m
Packing specific area (Raschig super-Rings No. 0.3)/Bed porosity315 m2/m3/0.96
Packing specific area (I-Rings)/Bed porosity305 m2/m3/0.97
Packing specific area (Pall-Rings)/Bed porosity360 m2/m3/0.92
Scrubber pressure0.1–3 MPa
Scrubber inlet temperature298 K
Superficial gas velocity0.4 m/s
Superficial liquid velocity0.015 m/s
Inlet gas composition (mole fraction):-
SO20.002
NO0.0015
NO20.00015
CO20.05
O20.15
Ionic composition of seawater, mol/L-
Cl0.56
Na+0.5
SO42−0.03
HCO30.003
Seawater salinity36.87 g/kg
Seawater ionic strength0.775 mol/kg
Spreading factor0.0074

