Communication

Ultra-Small Pd Nanoparticles on Ceria as an Advanced Catalyst for CO Oxidation

1
The Smart Materials Research Institute, Southern Federal University, 344090 Rostov-on-Don, Russia
2
Federal Research Centre the Southern Scientific Center of the Russian Academy of Sciences, 344006 Rostov-on-Don, Russia
3
Zelinsky Institute of Organic Chemistry, Russian Academy of Sciences, 119991 Moscow, Russia
4
National University of Science and Technology MISiS, 4 Leninsky prosp., 119991 Moscow, Russia
5
National Research Centre ‘Kurchatov Institute’, 1 Akademika Kurchatova pl., 123182 Moscow, Russia
*
Author to whom correspondence should be addressed.
Catalysts 2019, 9(4), 385; https://doi.org/10.3390/catal9040385
Submission received: 7 March 2019 / Revised: 16 April 2019 / Accepted: 21 April 2019 / Published: 24 April 2019

Abstract

:
In this study, we demonstrate the preparation and characterization of small palladium nanoparticles (Pd NPs) on modified ceria support (Pd/CeO2) using wet impregnation and further reduction in an H2/Ar flow. The obtained particles had a good dispersion, but their small size made it difficult to analyze them by conventional techniques such as transmission electron microscopy (TEM) and X-ray powder diffraction (XRPD). The material demonstrated a high catalytic activity in the CO oxidation reaction: the 100% of CO conversion was achieved at ~50 °C, whereas for most of the cited literature, such a high conversion usually was observed near 100 °C or higher for Pd NPs. Diffuse reflectance infrared Fourier-transform (DRIFT) spectroscopy in combination with CO probe molecules was used to investigate the size and morphology of NPs and the ceria support. On the basis of the area ratio under the peaks attributed to bridged (B) and linear (L) carbonyls, high-dispersion Pd NPs was corroborated. Obtained results were in good agreement with data of X-ray absorption near edge structure analysis (XANES) and CO chemisorption measurements.

1. Introduction

Supported noble-metal nanoclusters are well-known catalysts for diverse hydrogenation and oxidation reactions, particularly in CO oxidation. A number of attempts [1,2,3,4,5,6,7,8] were made to synthesize a catalyst on the basis of supported NPs with a high activity at low temperatures. The catalytic activity of NPs depends on the size and shape of the NPs [9], the material of the support [10] and the functionalization [11] and composition [12]. One of the most crucial factors for an advanced catalytic activity is a high dispersion and uniform distribution over the support surface [13]. One of the ways to meet this requirement is the use of modified matrix surfaces to support NPs.
Guo et al. [14] described the method of deposition of Pd on a SiO2 substrate. Silica gel was synthesized in situ with simultaneous surface modification by introducing 3-aminopropyltriethoxysilane into the system. The reduction of precursor salts was carried out using sodium borohydride. When using modified silica gel, Pd NPs with a size of 1.5–2 nm were obtained, while for the unmodified surface, the particle size was larger (4–5 nm). The authors attributed this fact to stronger interactions of Pd with the modified surface.
The authors of [15] used mesoporous carbon FDU-15 as a matrix, the surface of which was modified by two different methods: heating in a flow of gaseous ammonia (ammonolysis) and treatment of the substrate with melamine during heating. The reduction of precursor salts was carried out using sodium borohydride. The smallest Pd NPs were obtained by the method of ammonolysis, and their size varied from 1 to 3 nm. In the melamine method, Pd NPs with a size of 3–4 nm were formed.
The method of strong electrostatic adsorption, where charged metal precursors are strongly adsorbed onto oppositely charged surfaces by controlling the pH relative to the surface point of zero charge, was also utilized [16] to synthesize ultra-small bimetallic NPs of different compositions (Pt-Pd, Pd-Co, Pd-Cu, etc.). Silica gel was impregnated with ammonia complexes of precursor salts (hexaaminenickel(II) chloride, tetraaminecopper(II) nitrate, hexaaminocobalt(III) chloride, tetraamineplatinum(II) hydroxide, tetraaminepalladium(II) chloride). Then, the obtained materials were treated in a flow of hydrogen at 400 °C. As a result, bimetallic clusters with a size of 1–1.5 nm were formed.
Wei et al. [17] described a reverse method in which Pd NPs coated with polyvinylpyrrolidone or hydroxypolyamidoamine were introduced into the reaction for in situ silica gel formation from triethoxysilane and 1,2-bis(triethoxysilyl)ethane. The reduction of precursor salts was carried out using sodium borohydride. This method was used to produce Pd NPs with a size of 1–4 nm.
Several methods have also been mentioned for modifying the surface of ceria, which could be divided into in situ and postsynthetic modifications. In particular, the first type includes the technique described in [18], where modifier molecules (hexadecyltrimethylammonium bromide, cetylpyridinium bromide hydrate, etc.) were introduced at the stage of formation of cerium dioxide. In this case, cationic modifiers were chosen because of the anionic function of the cerium hydroxide intermediate. Postsynthetic modifications were described in [19] and [20]. Xu et al. [19] treated previously synthesized cerium dioxide with a nitric acid solution. As a result, the surface of the nanoparticles containing nitrate groups was obtained. Article [20] describes the method of ammonolysis of CeO2 film, in which ammonolysis is carried out in a stream of ammonia gas at different temperatures. As a result, the surface oxygen atoms of the nanoparticles are replaced by nitrogen atoms.
In our study, we present the synthesis of supported Pd NPs using a modified surface of cerium dioxide. Ceria is an active support that can provide lattice oxygen to facilitate oxidation reactions [21]. Cerium dioxide NPs were treated with an organic solution of secondary and primary amino groups—tetraethylenepentamine (TEPA). The resulting surface has electron-donating properties and adsorbs better positively charged ions of noble metals. Tetraaminepalladium(II) chloride was chosen as a palladium precursor. This choice was made for two reasons: first, the amine complex salts of noble metals are highly soluble in water and do not undergo hydrolysis, in contrast to non-complex chlorides; secondly, the amine complexes have a high affinity to the TEPA amino groups. These factors promote the noble metal ions to adsorb on the surface, while a large number of nucleation centers decreases the size of the resulting NPs.
The main techniques that are routinely applied for the characterization of noble metals, such as X-ray powder diffraction (XRPD) and transmission electron microscopy (TEM) face some limitations for high-Z supports, such as ceria. In this work, we show that laboratory-based Fourier-transform Infrared spectroscopy (FTIR) with CO as a probe molecule [22,23,24] is an attractive tool to characterize the synthesized samples. An Au/CeO2 reference sample with larger NPs was used as a reference and is shown in the Supplementary Materials.

2. Results and Discussion

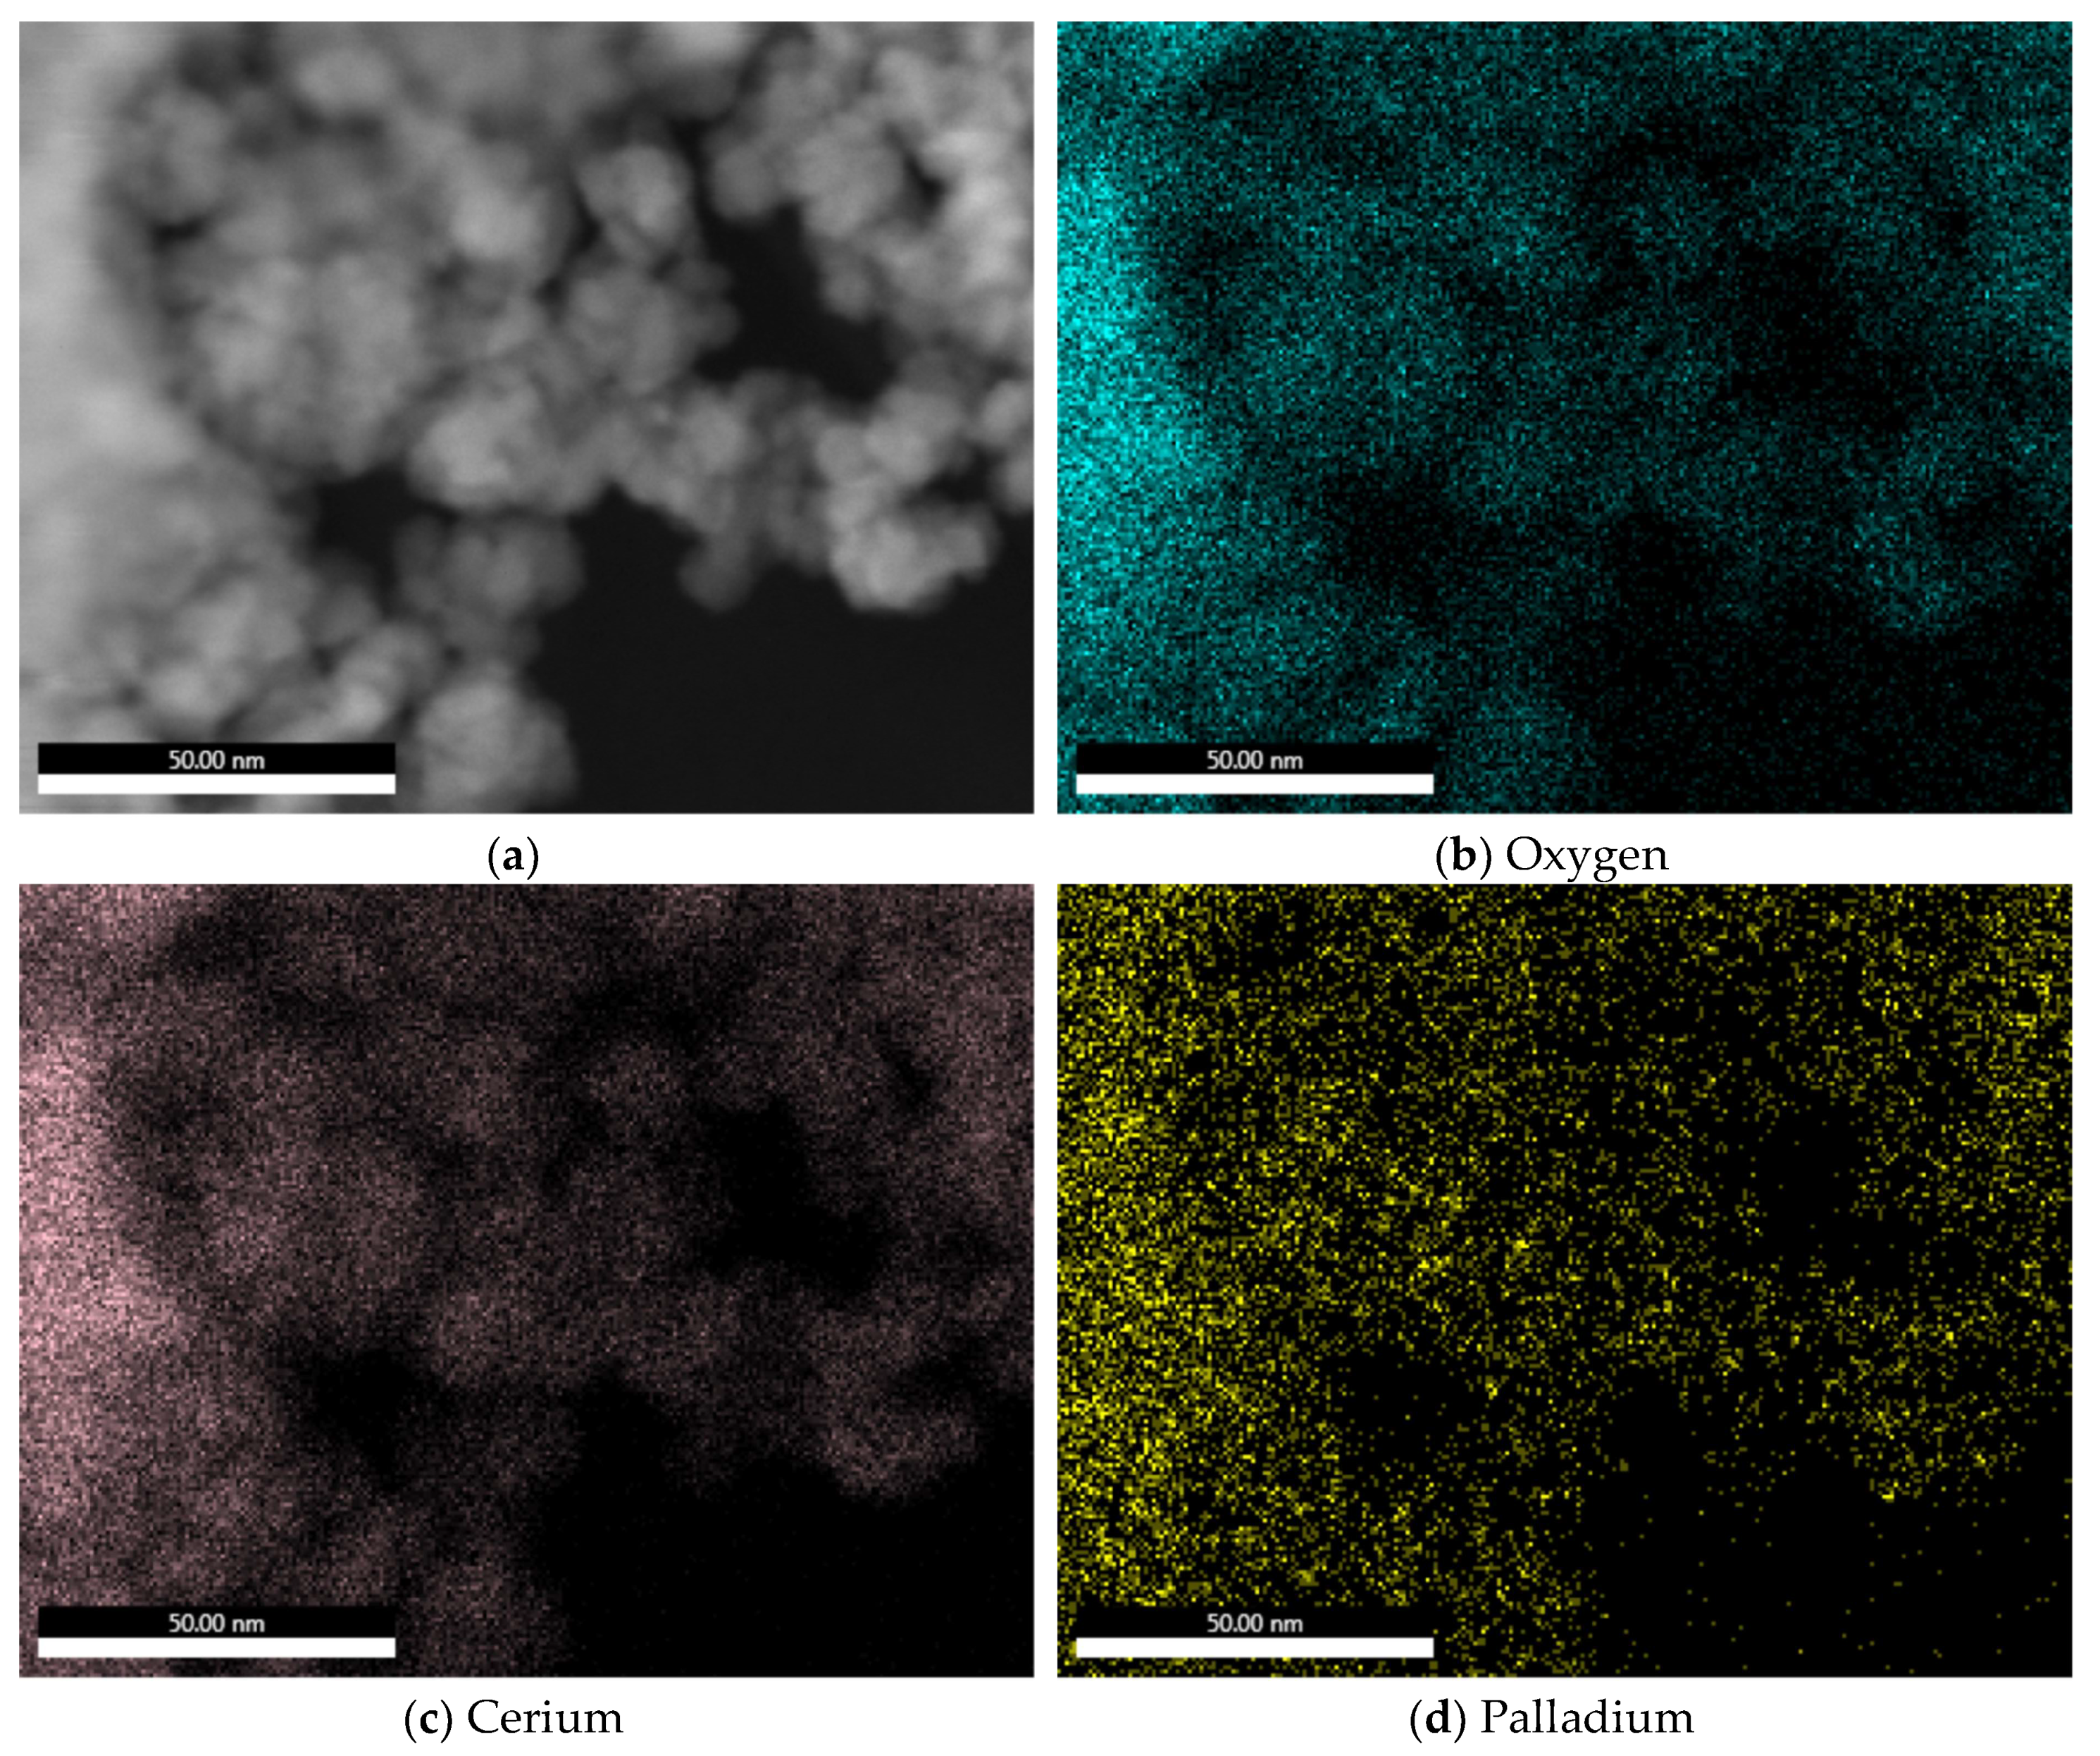
2.1. Elemental Composition

X-ray fluorescence spectroscopy (XRF) elemental analysis confirmed 3 wt% of Pd loading in the synthesized sample, which was slightly less than the theoretical value of 4 wt%. Figure 1d shows a homogeneous distribution of palladium on a ceria support obtained by means of SEM/EDS. For comparison, the distributions of gold and other elements in an Au/CeO2 reference sample with larger NPs is shown in Figure S1.

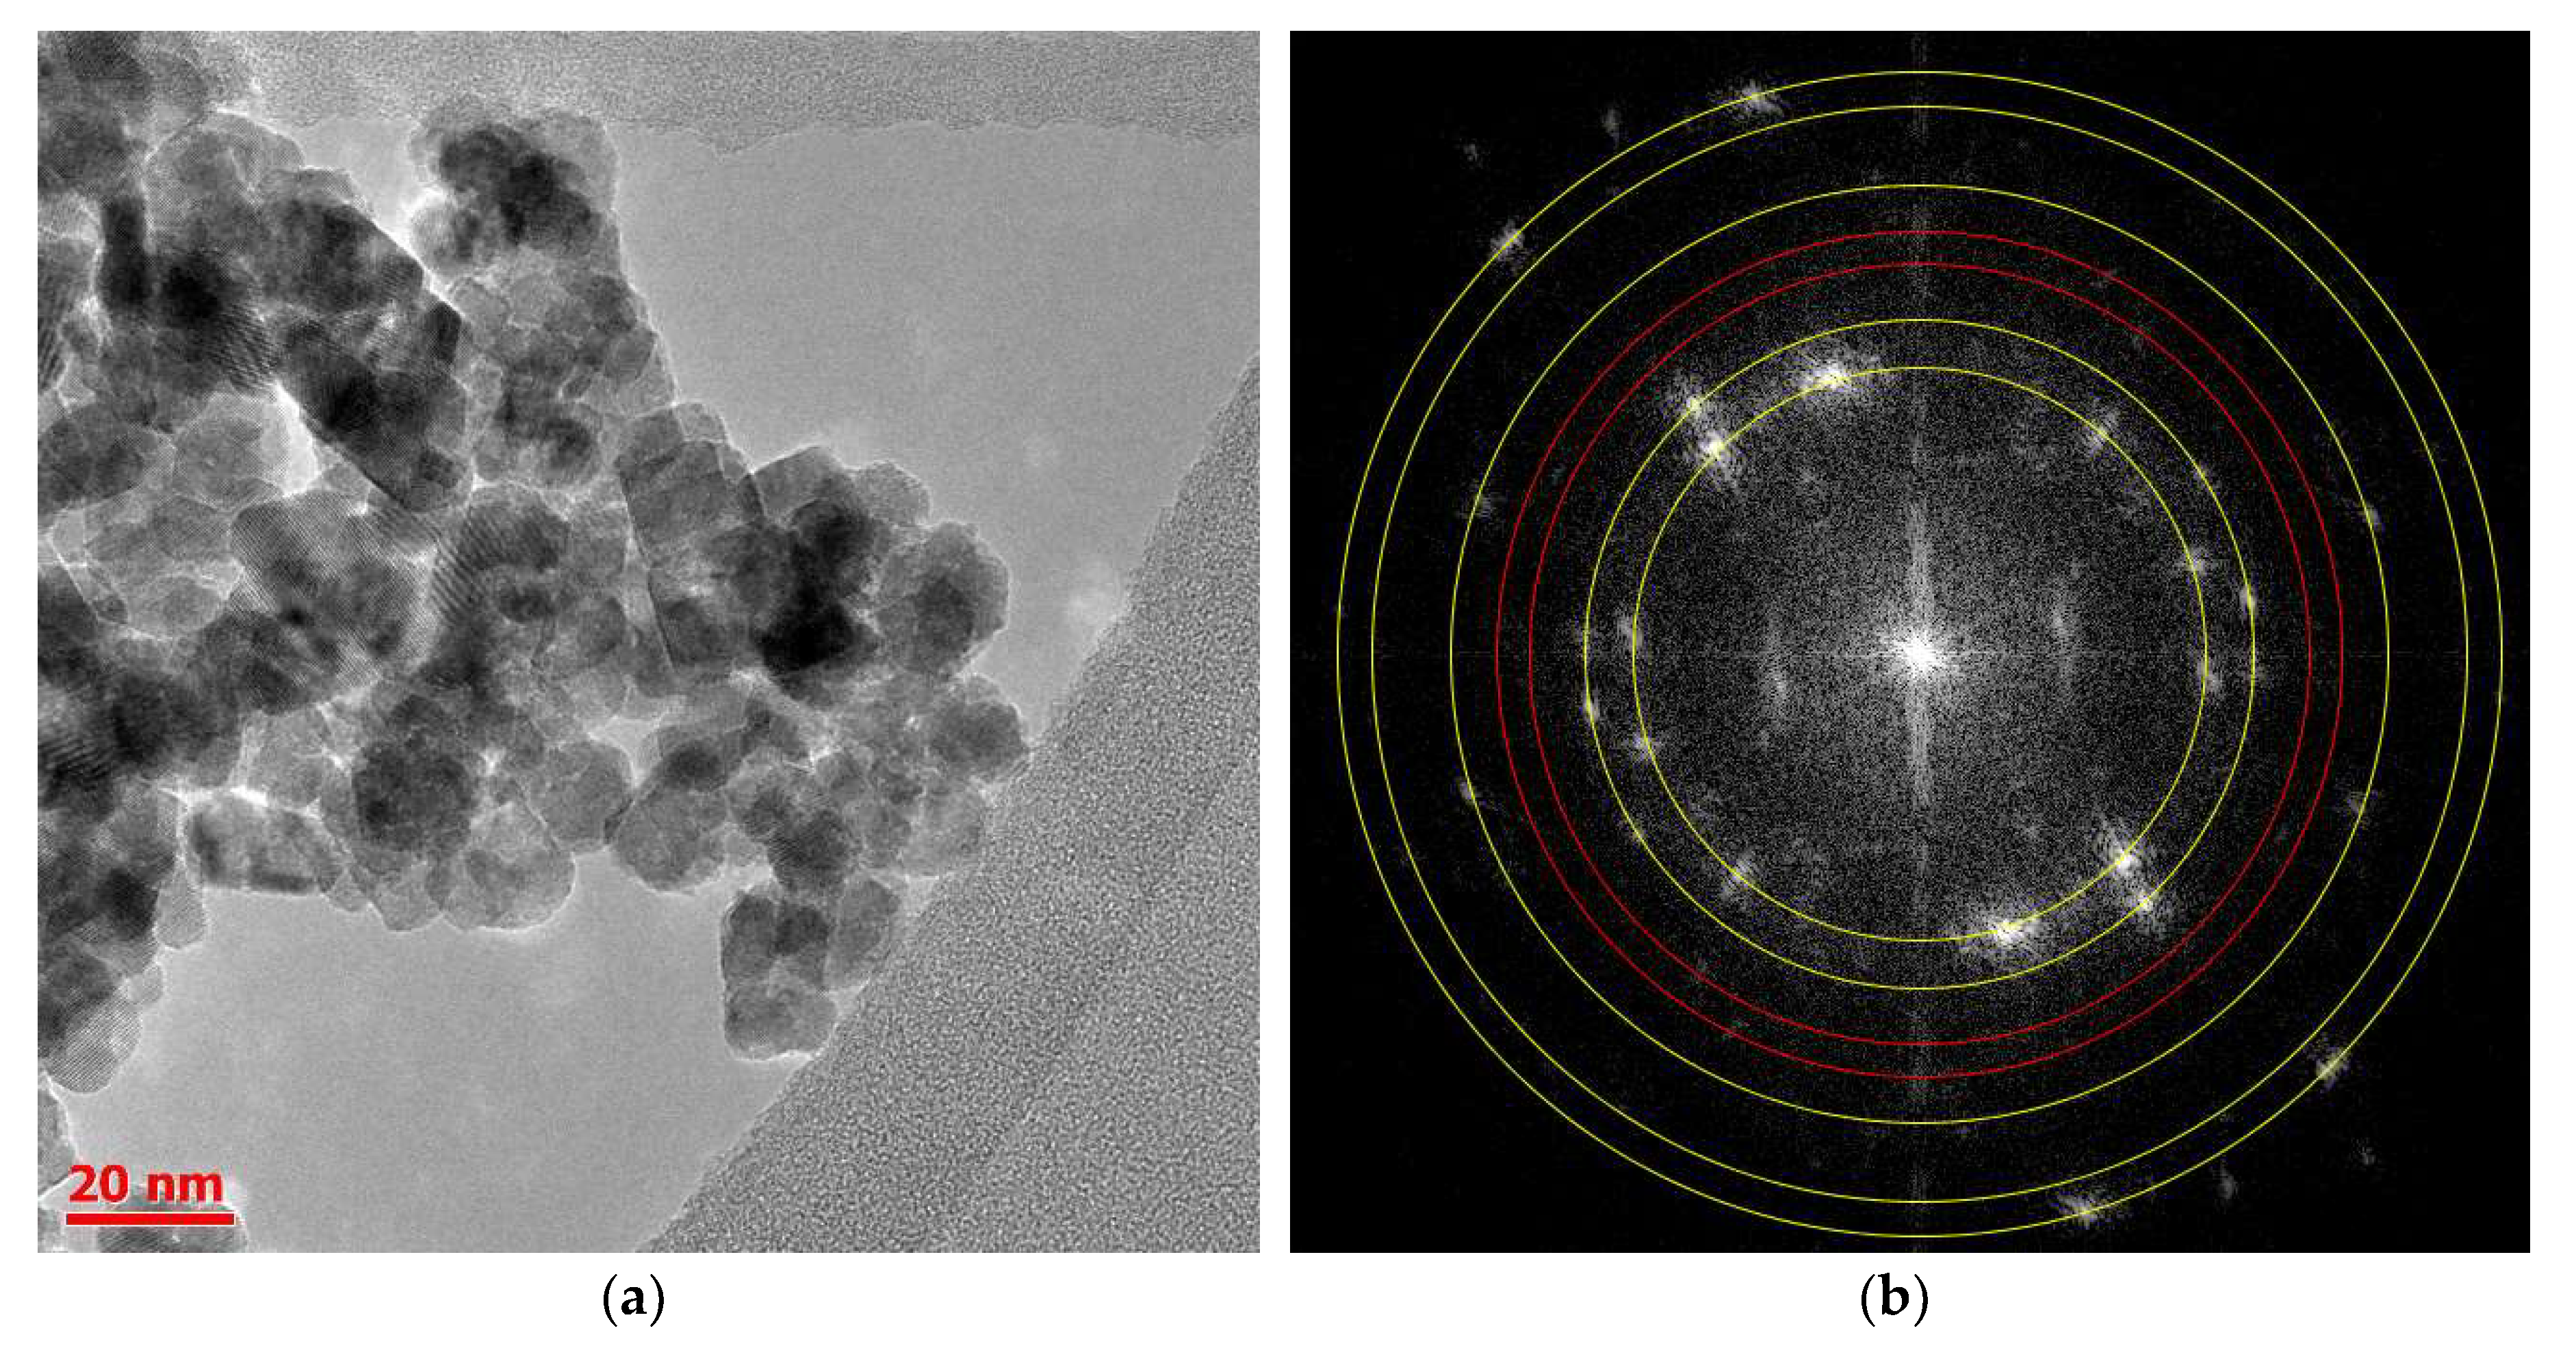
2.2. Structure and Size

The presence of the crystalline CeO2 support was confirmed by intense peaks in both diffraction patterns for pure CeO2 and Pd/CeO2 (Figure S2). For the pure CeO2 NPs, all the diffraction peaks could be attributed to the face-centered cubic fluorite structure with the Fm 3 ¯ m space group (JCPDS 34-0394) with the average particle size, estimated by the Debye–Scherrer equation, 10.8 ± 2.3 nm. However, neither the XRPD profiles nor direct high-resolution transmission electron microscopy (HRTEM) images were able to identify Pd NPs. There was no evidence of Pd or PdO phases on diffraction patterns of Pd/CeO2 even after very long acquisition time (more than 3 h for the narrow 2θ region from 35 to 45° near the expected position of Pd (111)). In contrast, larger Au nanoparticles on ceria were clearly visible from XRPD patterns (see Figure S2). This phenomenon can be explained by a small particle size of Pd, which significantly broadened the reflections observed for Pd NPs smaller than 4–5 nm [25,26] or by the high dispersion of Pd species [27].
TEM micro-images of Pd/CeO2 are shown in Figure 2a (see at Figure S3 TEM micro-images for the pure ceria support). HRTEM images showed the nanocrystalline structure of CeO2; however, they did not allow us to distinguish Pd NPs from the ceria support straightforwardly due to a low Z-contrast (Z(Pd) = 46 and Z(Ce) = 58), [28]. Using the ImageJ code [29], we performed a Fourier transformation (FT) for all images. The best transform with visible interplanar spacing for Pd and PdO is presented in Figure 2b.
Figure 2b contains weak diffraction spots related to the diffraction on Pd (111) planes (a red circle with a smaller radius, d = 0.22(8) nm) and on PdO (110) (weak spots on the bigger red circle, d = 0.21(1) nm). All other much brighter spots originated from CeO2 (JCPDS 46-1043 for palladium and JCPDS 41-1107 for palladium oxide). The same approach was utilized for larger Au nanoparticles on the Au/CeO2 reference sample (Figure S5), which resulted in more intensive spots related to the diffraction on Au (111).
Figure 3a shows the XANES region of the spectra. Our sample was compared with the commercial catalyst Pd/C with 5 wt% of metal loading from Chimet S.p.A. [30]. In air, both catalysts were oxidized as follows from the shape of XANES in comparison to metallic foil. The amplitude of peaks in the Pd/CeO2 sample was smaller than for Pd/C, which indicates a smaller particle size compared to the 2.8 nm in the commercial catalyst. To support further this idea, we performed FT of the k2·chi(k) data, which is shown in Figure 3b. The large peak at 1.5 Å (without phase correction) corresponds to the Pd-O bonds. The presence of Pd-O bonds correlates with results of HRTEM analysis where weak but distinguishable diffraction spots of PdO phase were observed.
The two maxima at 2.5 and 3.0 Å correspond to the Pd-Pd bonds, which were present both in the non-oxidized core of catalyst nanoparticles and the oxidized surface. Qualitatively, we observed a reduction in the intensity of Pd-Pd contribution in the FT data of Pd/CeO2 compared to the Pd/C, which can be explained by a smaller second coordination number. Another effect is related to the observed shift of Pd-Pd maxima in Pd/CeO2 to the lower distances. Both observations indicate a smaller particle size of our sample compared to the commercial 2.8 nm Pd/C. Indeed, theoretical simulations [31] predict that Pd-Pd distances decrease along with the size of nanoparticles due to surface relaxation, while a reduction of coordination numbers originates from larger surface contribution with unsaturated Pd-Pd bonds.

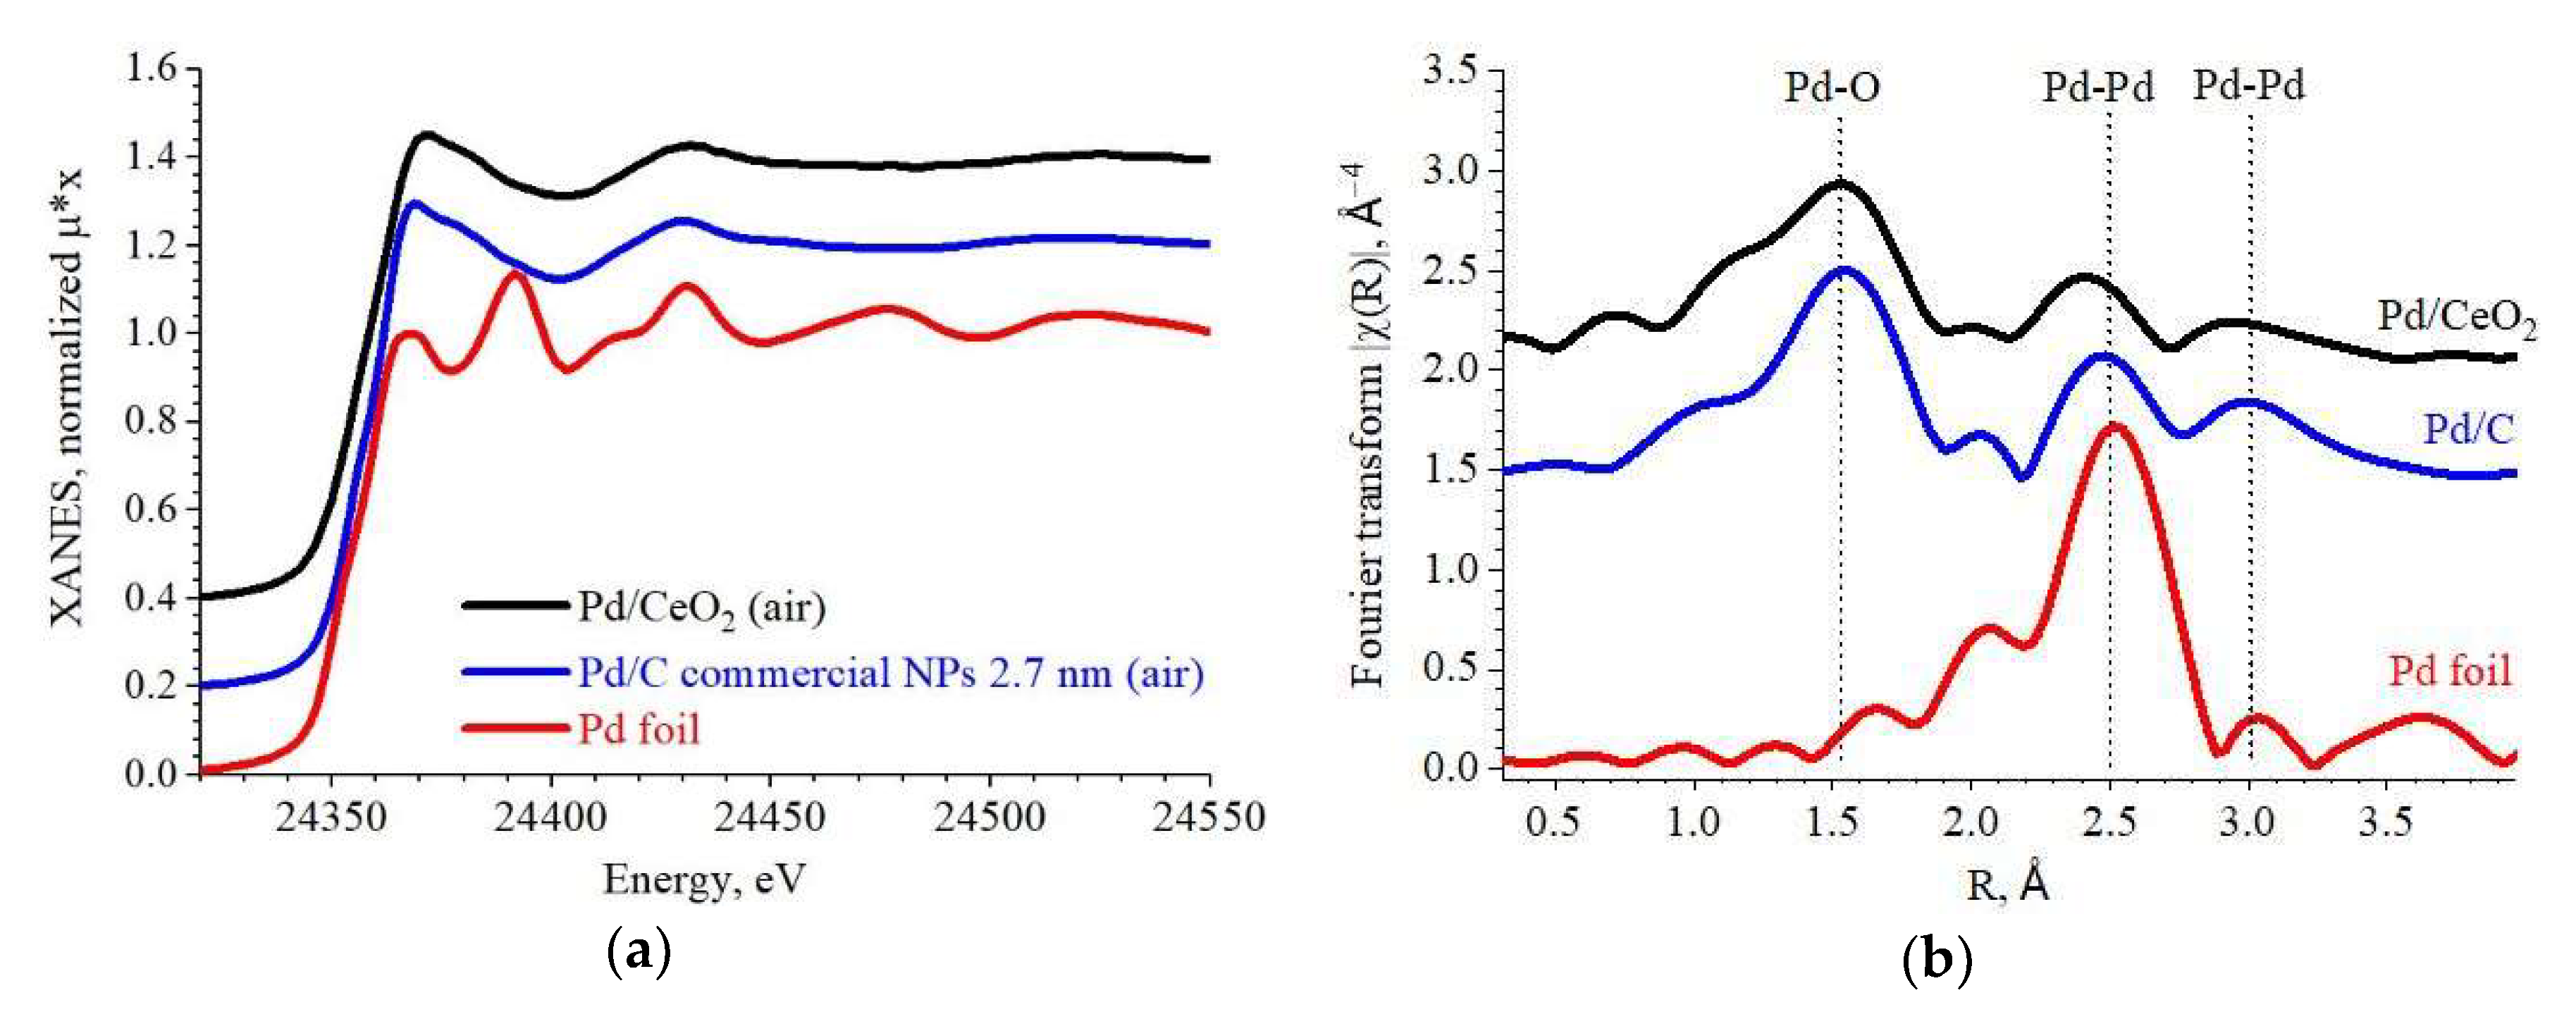
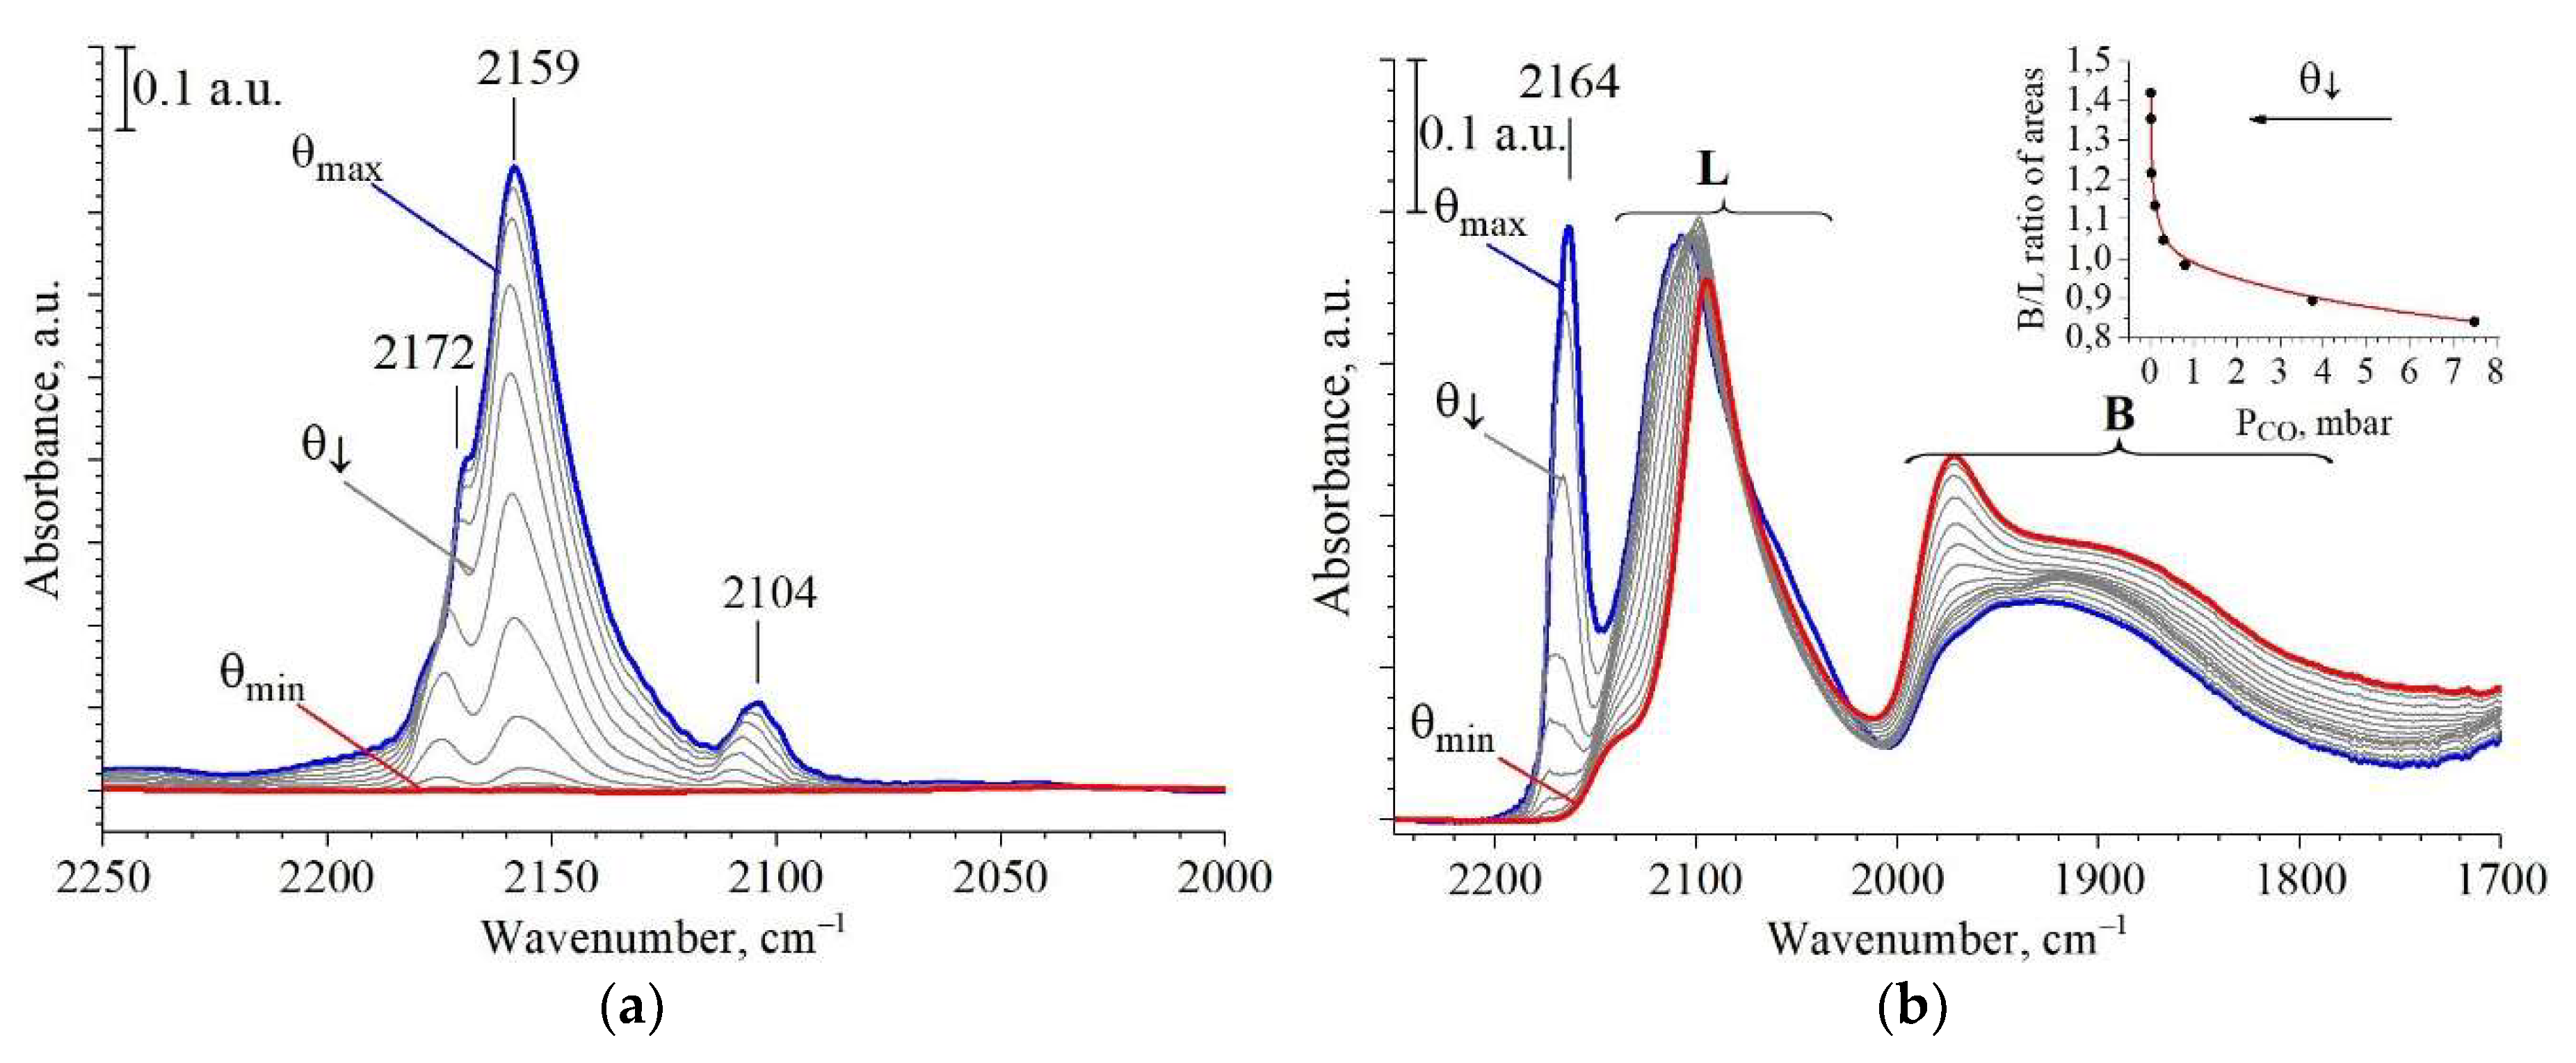
2.3. Active Sites Characterization

Adsorption of CO as a probe molecule and diffuse reflectance infrared Fourier-transform (DRIFT) spectroscopy was used to eliminate a lack of information about the available sites on Pd particles and their size in Pd/CeO2; adsorption on pure CeO2 was also used as a reference. To avoid surface carbonation that could induce some electronic effects at the cationic adsorption sites [32], CO was introduced at −140 °C on H2/Ar reduced samples (see Section 3.2 for details). The region of linear (L) and bridged (B) carbonyls (2250–1800 cm−1) was used for analysis in this study.
Prior to adsorption, the sample was treated in an H2 atmosphere for 30 min at 120 °C. This procedure reduced Pd nanoparticles and partially the ceria support. For reduced CeO2, three peaks were observed in the region of carbonyls (Figure 4a) at 2172, 2159 and 2104 cm−1 (at the highest CO coverage). All these peaks demonstrated blue shifts during evacuation due to decreasing lateral-lateral interaction between CO molecules, and totally disappeared after outgassing down to 5 × 10⁻³ mbar at −140 °C.
The peak at 2172 cm−1 was attributed to «on-top» CO adsorption on Ce4+ with coordinative unsaturation, which is in good agreement with the values from literature on reduced ceria: 2169 [33], 2170 [34] and 2165 cm−1 [35]. The peak near 2159 cm−1 could be ascribed to adsorption on Ce4+ with different coordinative unsaturation (Ce4+ cus), which was observed by many authors for unreduced ceria at 2150 [35], 2156 [36] and 2151 cm−1 [32]. However, absorption at a similar wavelength on Ce3+ sites was also observed for H2-reduced ceria at 2161 [34], 2162 [37] and at 2156 cm−1 [38].
The last peak at 2104 cm−1 behaved differently during CO outgassing. It shifted downward, unlike the previously mentioned peaks, and the value of the shift was larger. This peak is not usually mentioned in literature, and remained unassigned in this study; however, because it totally disappeared during outgassing, consequently it will not make a contribution to coincident peaks in case of Pd/CeO2 after outgassing.
For Pd/CeO2, only one distinct band related to adsorption on the ceria support was seen (Figure 4b); it was located at 2164 cm−1 at the maximum coverage, and totally disappeared during outgassing. This band was assigned to CO adsorption on Ce3+, which is in a good agreement with the fact that Pd favors the reduction of ceria by hydrogen [39]. This band also had a shoulder at the high-frequency side, which could be explained by the presence of Ce4+ cus in small amounts.
The adsorption on Pd NPs exhibited a more complex pattern. Two groups of bands could be attributed to the CO molecules linearly bonded with Pd sites (marked «L») and to bridged carbonyls (marked «B»).
The first group consisted of an intensive peak with a maximum approximately at 2108 cm−1 red-shifted to 2096 cm−1 upon evacuating, which had a shoulder in the lower frequencies. According to the deconvolution (Figure S6), this shoulder was related to a low-frequency peak at 2056 cm−1. The high-frequency peak could be attributed to linear adsorption of CO on well-dispersed but not crystalline Pd [40,41]. Herein, the decrease in the intensity for the low-frequency peak was much slower than for the high-frequency band, which allowed us to assign the peak at 2056 cm−1 to linear adsorption of CO on low-coordinated Pd atoms, also mentioned as defects (corners, steps, edges, etc.) of crystalline Pd (111) facets. Such behavior upon outgassing is in a good agreement with the fact that CO bonded stronger with Pd defects [42].
CO adsorption on ionic Pd2+ and Pd+ sites could have contributed to the absorbance at 2170 and 2120 cm−1, respectively [43,44], but these peaks were not observed during our experiment. However, while decreasing the coverage, we observed a low-intensity peak at 2140 cm−1, which was hidden by an intensive peak at 2108 cm−1. We can presume that this peak was related to single Pd atoms coordinated by oxygen atoms, which is corroborated by the results of DFT modeling performed by Spezzati et al. [45] for PdO2/CeO2 (111) models, which resulted in the 2137 cm−1 frequency. Other possible configurations of oxygen-coordinated single atoms on ceria facets such as PdO/CeO2 (111) or Pd/CeO2 (111) should have been located at 2098 and 2047 cm−1, according to their results, in which case they overlapped with other peaks.
The second group of absorption peaks were formed by two main broad features: one of them was located at ~1960 cm−1, while the other one was much broader and extended from 1950 to 1850 cm−1. They can be attributed to CO 2-fold and 3-fold bridged carbonyls, respectively. The intensity of these peaks increased during outgassing at a low temperature (which is more noticeable for the peak attributed to 2-fold bridged carbonyls) due to the transition of CO molecules from less energetically favorable positions of linear carbonyls to the bridged coordination [22].
On the basis of deconvoluted peaks (Figure S6), the estimation of the particle size could be performed for Pd/CeO2 according to the technique described by Shey et al. [46]. For this purpose, the ratio of the total area under the peaks of CO adsorbed on bridged sites of Pd (B) and linearly adsorbed CO on Pd (L) was calculated for different coverages (the CO pressure varied from 7.5 to 5 × 10⁻³ mbar) at the fixed temperature −140 °C. According to the obtained dependencies (inset in Figure 4b), this ratio increased along with the coverage decrease, and this fact is in a good agreement with the literature [22]. The number of molecules adsorbed on bridged sites was proportional to the available surface area, which corresponds to higher B/L ratios for bigger NPs. Therefore, it is possible to estimate the particle size and compare this ratio for different instruments. In comparison with [47] for TiO2-supported Pd NPs, our B/L ratio corresponds to a size smaller of 1.5–2 nm (i.e., it is evidence of a high dispersion of Pd NPs for the studied sample). This result is also confirmed by CO chemisorption measurements, where particle size was estimated as 2.1 nm, the surface area was 238.9 m2/(g of metal) and Pd dispersion was 53.6% according to stoichiometry factor 1 and Pd loading 3.0 wt%. At that time, cyclic voltammetry (CV) was not sensitive to a such small Pd NPs. Any peaks related to hydrogen desorption (adsorption) in the region of low potentials were absent whereas surface reduction of ceria was detected (see Table S2 and Figure S9 for detailed information).
After catalytic tests, the ratio between areas under peaks (bridged/linear) remained the same within 2.8% accuracy (spectra are not shown for brevity), while small changes were observed in relative intensities of 2-fold and 3-fold bridged sites. The latter indicates reorganization of the surface of nanoparticles, while the mean size, determined by means of B/L ratio, remained almost unchanged.

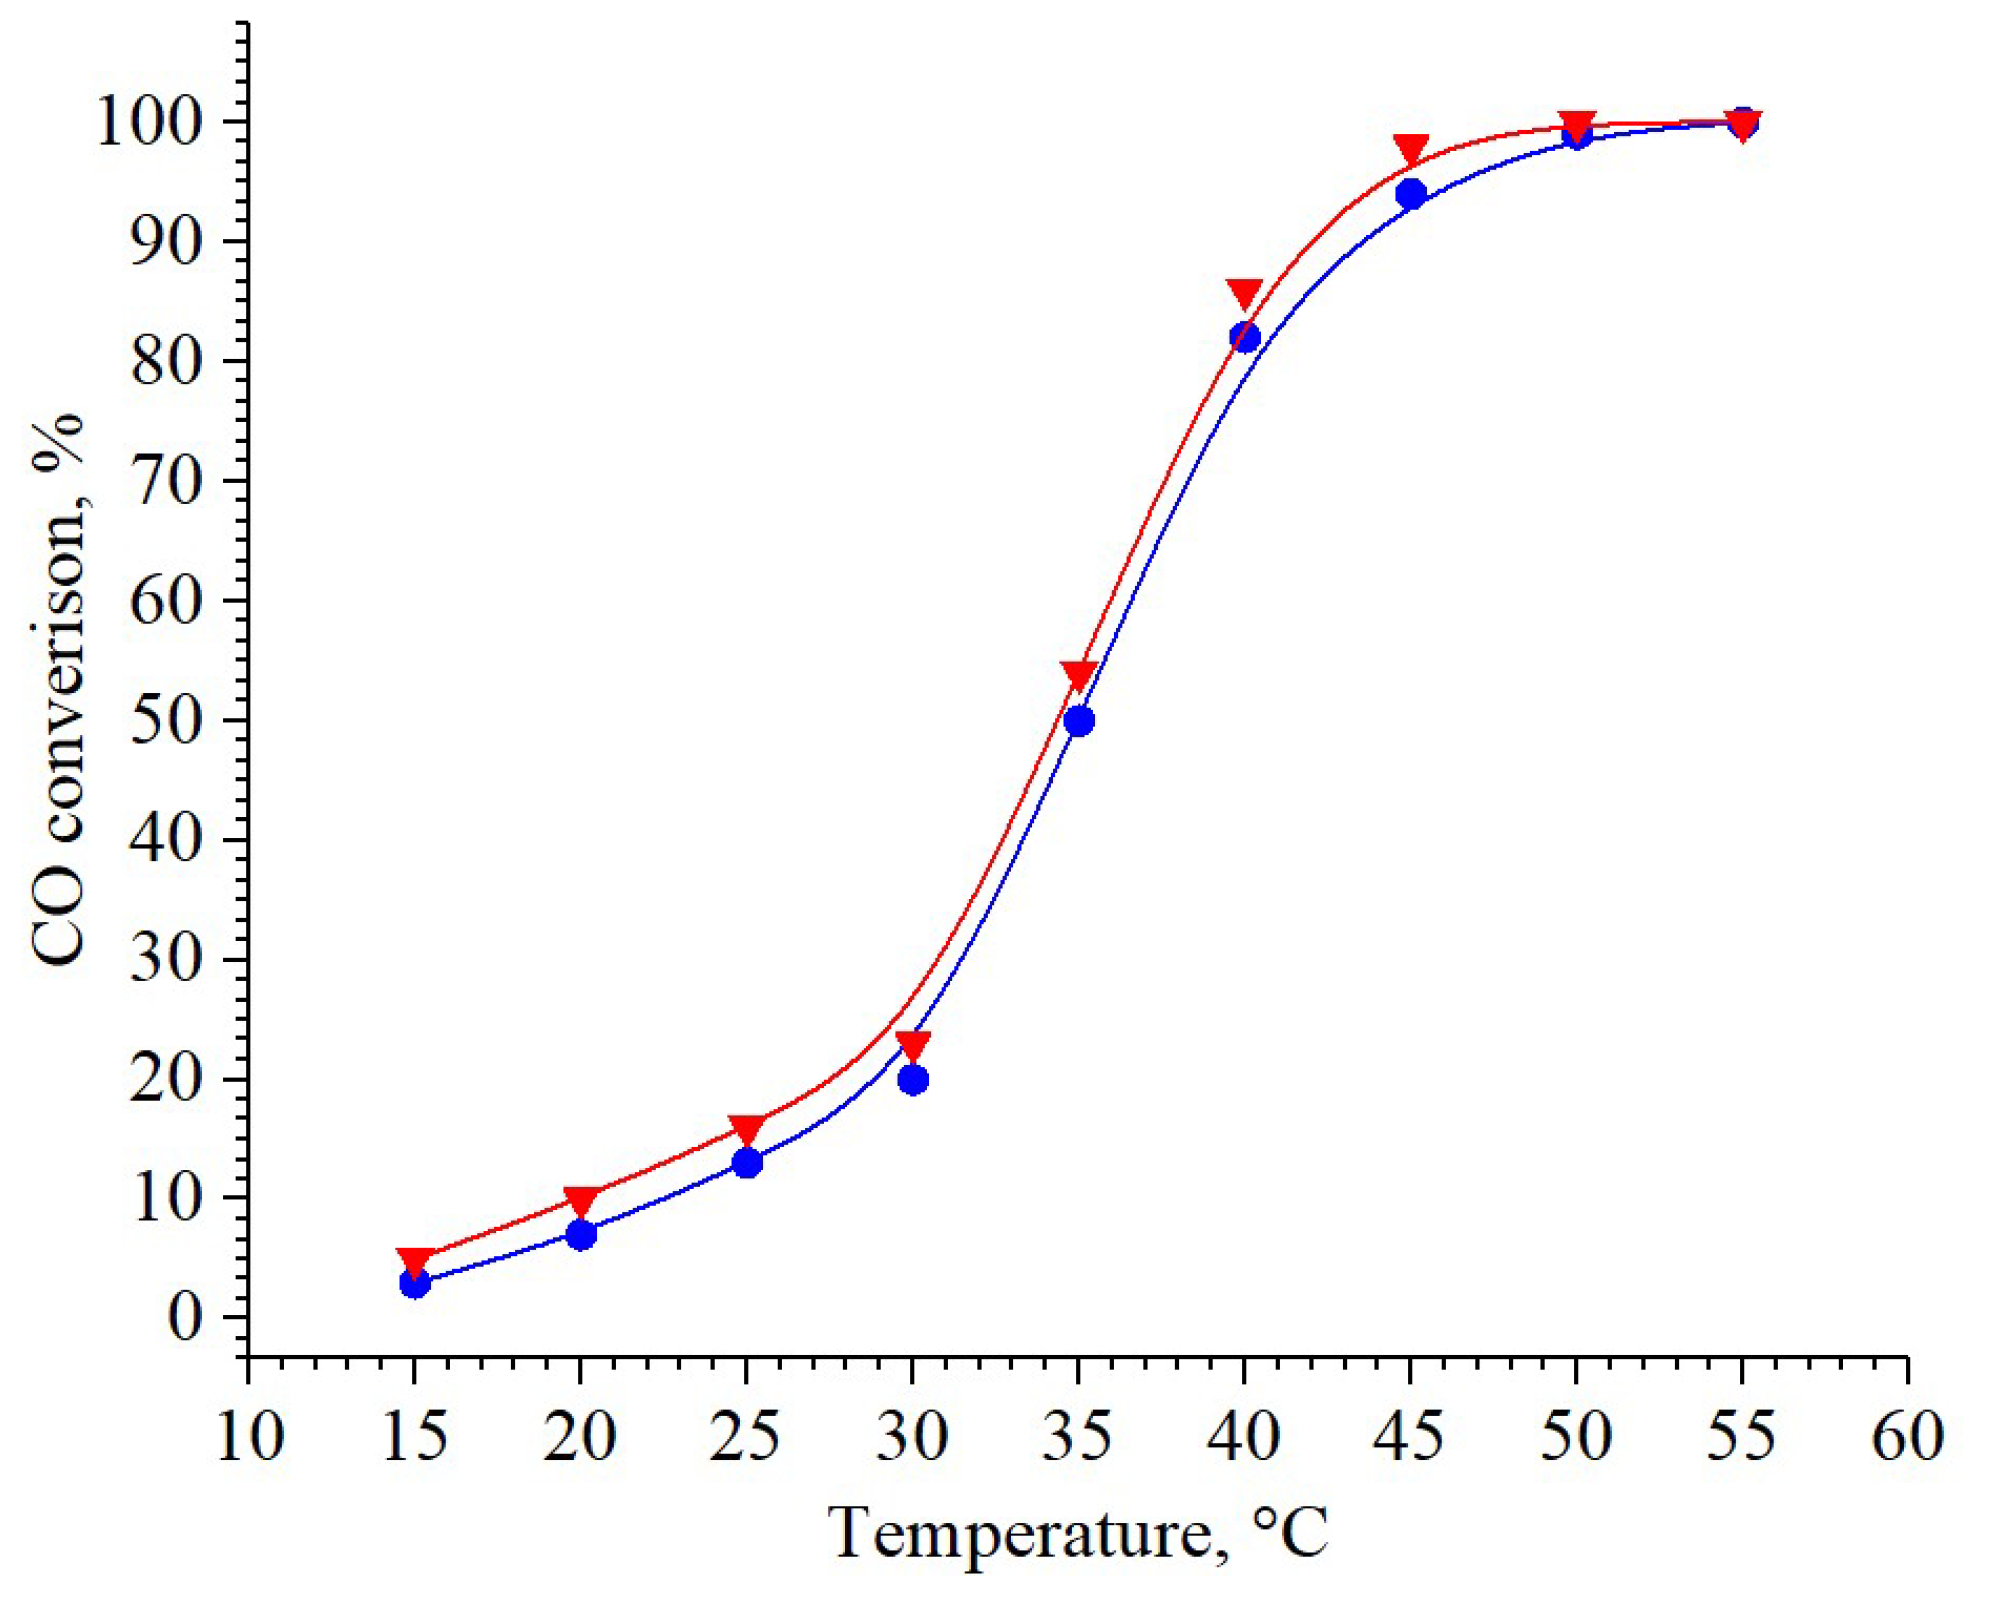
2.4. Catalytic Activity

The Pd/CeO2 sample demonstrated high catalytic activity already at a low temperature. The CO conversion was 10% even at room temperature, and reached 100% conversion at ~50 °C (Figure 5). In comparison, the Au/CeO2 reference sample reached the 82% conversion only at 70 °C (Figure S7).
Such high catalytic activity of the synthesized material can be explained by the strong interaction between Pd and the CeO2 surface, as well as by the high oxygen-storage capacity due to the formation of the Ce4+/Ce3+ redox pair. This redox pair can generate non-stoichiometric oxide compounds that allow CeO2 to release catalytically active oxygen atoms efficiently [48,49]. As can be seen from Section 2.1, Section 2.2 and Section 2.3, Pd NPs had a high dispersion. The small size of Pd clusters maximizes the contact area between metal particles and a transition metal oxide substrate while minimizing the area of “naked” Pd NPs— it is so-called perimeter interface effects [50,51]. A decrease in the size of Pd NPs also led to an increase in the number of active centers on their surfaces.
At the same time, analysis of the literature data showed that some previously described similar compounds had a markedly lower catalytic activity (Table 1). The materials described in [1,2,3,4] allowed complete oxidization of carbon monoxide only at temperatures over 100 °C. However, materials with low-temperature catalytic activity are also mentioned (e.g., the data mentioned in [5,6,8] for ceria supported Pd NPs are close to those obtained in this study). Such a difference in the temperatures of complete conversions can be associated with the location of metal NPs on various surfaces of CeO2—(100) or (111). Spezzati et al. [7] showed that conversion at low temperatures requires metal NPs to be on the (111) surface of a support, whereas on the (100) surface the conversion occurs at higher temperatures. These authors found that Pd on the (111) surface was more active due to the bimolecular Langmuir–Hinshelwood mechanism. DFT calculations show that for the (100) surface, CO oxidation occurs according to the Mars–van Krevelen mechanism. This is possible due to the lower Ce-O bond energy compared to the (111) surface. In general, the catalytic cycle of CO oxidation on Pd/CeO2 (100) includes a higher free-energy barrier than on Pd/CeO2 (111), in accordance with the experimentally observed difference in activity. Thus, the high catalytic activity of our materials can be explained by the large number of Pd NPs located on the (111) surface of CeO2, and indirectly points to the Langmuir–Hinshelwood catalytic mechanism

3. Materials and Methods

3.1. Materials

Cerium (III) nitrate hexahydrate Alfa Aesar 99.5%; palladium (II) chloride Alfa Aesar 99.999%; ammonium hydroxide Alfa Aesar 28–30% NH3; tetraethylenepentamine pentahydrochloride (TEPAPHC) Aldrich 98%; sodium chloride Alfa Aesar 99%; sodium carbonate anhydrous Alfa Aesar 99.5%; silver nitrate Alfa Aesar 99.9995%; methanol J.T.Baker Ultra Pure were used without additional purification, 5 wt% Pd/C Chimet S.p.A. with average size of NPs 2.8 nm.

3.1.1. Synthesis of a Modified Support

Synthesis of ceria NPs was carried out according to the method in [52]. To modify the surface of the as-synthesized NPs of ceria, a 10% solution of TEPAPHC was prepared by dissolving 1.11 g TEPAPHC in 10 mL distilled water. A concentrated ammonia solution was added dropwise to the resulting solution up to pH = 7–8. Next, 1 g of synthesized cerium dioxide was suspended in a resulting TEPA solution. The suspension was vigorously stirred for 2 h and then washed four times with distilled water using a centrifuge at 15,000 rpm. The resulting material was dried in air at room temperature. We will refer further to this modified ceria support as CeO2/TEPA.

3.1.2. Synthesis of Supported Pd NPs

Tetraaminepalladium (II) chloride was synthesized from PdCl2 (see Appendix A for details). Next, 12.4 mg of this metal precursor was dissolved in 12.5 mL of distilled water. The solution was heated to 60 °C with stirring, then 129 mg of CeO2/TEPA was added. The resulting suspension was stirred for 30 min, then a 0.2-M sodium carbonate solution was added until pH = 8. The mixture was stirred for 1 h, then centrifuged three times and washed with distilled water. The washed material was dried overnight at 60 °C.
The material was placed in a tubular oven in porcelain boats and heated to 350 °C in a flow of pure argon (50 mL/min), replaced further by a mixture of 5% H2 and 95% Ar at the same total flow rate. Under these conditions, the material was kept for 1 h, then the system was cooled to room temperature in a flow of pure argon. The theoretical content of metal was 4 wt%. The resulting material used for further studying was labeled as Pd/CeO2, which is how we refer it in this manuscript.
The same procedures were performed for Au/CeO2 reference sample. Used amounts of reagents are shown in Table S1.

3.2. Methods

XRF measurements were performed on a M4 Tornado spectrometer (Bruker, Billerica, MA, USA) equipped by a XFlash 430 detector in the range from 0 to 24 keV.
XRPD patterns were acquired on a D2 PHASER (Bruker, Billerica, MA, USA) diffractometer with Bragg–Brentano geometry using a CuKα wavelength (1.5406 Å). Data were collected in the 2θ range from 5 to 90° with 0.02° step and 0.1 s acquisition time. Obtained peaks were approximated by the Lorentz function using the Jana2006 code [53].
Materials were characterized by means of TEM and HRTEM using an FEI Tecnai G2 F20 transmission electron microscope (FEI Company, Hillsboro, OR, USA) with an accelerating voltage of 80–200 kV. Particle size distributions were measured using the ImageJ code [29]. Statistics was collected on 500 particles.
The X-ray absorption spectra at the K-edge of Pd were collected at the beamline “Structural Materials Science” [54] using the equipment of Kurchatov Synchrotron Radiation Source (Moscow, Russia). The storage ring with an electron beam energy of 2.5 GeV and a current of 80−100 mA was used as the source of radiation. The measurements were performed for the synthesized Pd/CeO2 and commercial catalyst Pd/C with 5 wt% of metal loading from Chimet S.p.A. [30], then 40 mg of catalyst powder was placed in a 3-mm thick cuvette with X-ray transparent Kapton windows. The measurements were performed for the samples under atmospheric conditions and without activation in hydrogen. Spectra were collected in the fluorescence mode using a Si (111) channel-cut monochromator and solid state detector, while Pd foil was measured in transmission mode. Obtained experimental spectra were analyzed using the Athena code in the Demeter software package [55].
Palladium dispersion and Pd particle size were also determined by CO chemisorption with an automatic adsorption system (ASAP 2020C, Micromeritics, Norcross, GA, USA). Prior to measurement the sample was evacuated for 30 min at 110 °C, then it was heated in hydrogen flow for 10 min at 150 °C, and for 30 min at 200 °C; after that, the sample was evacuated 10 min at 200 °C and 100 min at 35 °C. CO chemisorption was carried out at 35 °C in the pressure range of 0.8–118.0 kPa.
Infrared spectra were collected using a Vertex 70 (Bruker, Billerica, MA, USA) spectrometer equipped with a liquid-N2-cooled high-sensitive mercury cadmium telluride (MCT) detector. A Praying Mantis Low Temperature Reaction Chamber (Harrick Scientific Products Inc, New York, USA) installed in the spectrometer was used to perform measurements using the DRIFT technique. All spectra were recorded with a 1 cm−1 resolution for 64 scans and transformed into absorption spectra using the Kubelka–Munk function.
An external gas system equipped by mass flow controllers (EL-FLOW, Bronkhorst High-Tech B.V, Ruurlo, the Netherlands) was used to control gas flows (Ar, H2 and CO passing through the cell and mix gases). The experimental setup allowed one to control the temperature of the sample and the gas flow, and it also contained a vacuum pump allowing outgassing of the volume of the reaction chamber (with the powdered sample inside) down to 5 × 10⁻³ mbar.
The experimental procedure consisted of two stages—the sample activation, and further CO adsorption/desorption. In the first stage, the samples were heated during outgassing up to 200 °C to remove water and other guest molecules, then a flow of hydrogen (5 mL/min) mixed with Ar (45 mL/min) was passed through the sample for 30 min to get rid of oxygen and chlorine. Finally, the samples were slowly cooled down to −140 °C (using liquid nitrogen as a refrigerant) during continuous vacuuming (3 h).
Then at this temperature, a CO flow (5 mL/min) was purged through the sample for 10 min. After this procedure, the samples were outgassed to smoothly decrease the CO coverage. In the last part of the desorption stage, the sample was heated to room temperature. FTIR spectra were collected during the whole process of desorption. The last spectrum measured right before CO adsorption at the low temperature was recorded as a background to be subtracted from further spectra, to exclude any background features not related to the CO adsorption process.
To obtain information about the stability of the samples after reaction conditions, the samples were placed for 2 h at the reaction conditions. The activated sample was placed in the reaction chamber mentioned above at 50 °C (temperature above the maximum observed conversion), and the mixture of 16.9% O2, 62.4% Ar and 20.7% CO was fluxed through it at a flow rate of 50 mL/min. After this, the activation was performed again with further adsorption of CO probe molecules.

Catalytic Activity Tests

A flow-through microreactor (thick-walled glass tube with an internal diameter of 0.8 mm) was supplied with a mixture of air and CO of 16.9% O2 + 62.4% N2 + 20.7% CO with a pressure of 1 atm and a flow rate of 20 mL/min. The volumetric feed rate was 120,000 h−1. The molar ratio of O2/CO was 0.82. The catalyst loading was 10 mg.
The reactor was heated using an electric furnace, while the temperature was set and controlled using a thermostat Thermodat-17 and a thermocouple installed on the outer wall of the microreactor (Figure S8).
The catalyst was activated by heating in a flow of the mixture mentioned above to 300 °C (30 min), then cooled to room temperature, interrupting the flow of gases. Next, the catalyst was heated with a ramp rate of 10 °C/min, and gaseous products were analyzed at fixed temperatures. The measurement was repeated three times to analyze the stability of the sample.
The starting gas composition and the gas mixture at the outlet of the trap were analyzed on a chromatograph model 3700 manufactured by the Scientific Production Association «Granat» (Saint Petersburg , Russia) on two columns packed with NaX molecular sieves (O2, N2, CO) and HayeSep-Q (air + CO and CO2). The gas sample filled two loops of a fixed volume and, using six-way valves, was fed on-line for analysis. A thermal conductivity detector was used at a column temperature of 60 °C. Helium was used as a gas carrier.

4. Conclusions

Finally, we report on the synthesis of ultra-small Pd nanoparticles on the ceria support. The samples revealed a high catalytic activity in the reaction of CO oxidation already at 50 °C and demonstrated thermal stability. Due to the low Z-contrast and small size of noble metal particles, we adopted DRIFT spectroscopy with CO probe molecules for characterization. Owing to the presence of vibrational frequencies characteristic for bridged sites between several Pd atoms, we proved the presence of nanoparticles, but not single Pd atoms on the surface. Using the ratio between linear and bridged sites, the average size of Pd nanoparticles could be estimated to be smaller than 1.5–2 nm, which is in an agreement with chemisorption and XANES measurements. The possible prevalence of Ce (111) surface facets could also contribute to the higher catalytic activity.

Supplementary Materials

The following are available online at https://www.mdpi.com/2073-4344/9/4/385/s1: Table S1. Amounts of used reagents; Table S2. Sample preparation for the electrochemical tests; Figure S1. SEM/EDS micro-image of Au/CeO2 and element distribution maps; Figure S2. X-ray diffraction patterns of CeO2 (black), Pd/CeO2 (red) and Au/CeO2 (green). λ(CuKα) = 0.15406 nm. Peaks related to diffraction on Pd are not visible; the Au phase is clearly observed for Au/CeO2 with bigger NPs (average size 13 nm according to Debye–Scherer analysis); Figure S3. (a) TEM micro-image of the CeO2; (b) Particle size distribution (total number of measured particles was 500); Figure S4. HRTEM micro-image of Pd/CeO2 used for FT; Figure S5. (a) HRTEM micro-image of the Au/CeO2 reference sample; (b) FT image with circles marking the spacing between atomic planes of CeO2 (yellow) and Au (green); Figure S6. Deconvolution of Pd/CeO2 FTIR spectrum at PCO = 7.5 mbar (max. coverage); Figure S7. CO conversion vs oxidation reaction temperature for Pd/CeO2 (blue and red lines for first and third cycles) and Au/CeO2 reference sample (black line) in a mixture of 16.9% O2, 62.4% N2 and 20.7% CO at a flow rate of 120,000 h−1; Figure S8. Microreactor for tests of catalytic activity with a catalyst; Figure S9. The resulting CV curves (averaged over 10 cycles) of Pd/CeO2 (red) and CeO2/TEPA (black).

Author Contributions

Conceptualization, A.Tereshchenko, V.P., A.G. and A.S.; Methodology, A.Tereshchenko and A.G.; Validation, T.L., L.K. and A.Tarasov; Formal Analysis, A.Tereshchenko, V.P., A.G., V.B. and A.Trigub; Resources, A.G. and A.S.; Investigation, A.Tereshchenko, V.P., A.G., L.K. and T.L.; Data Curation, Y.P. and A.B.; Writing—Original Draft Preparation, A.Tereshchenko, L.K. and V.P.; Writing—Review & Editing, A.Tereshchenko, A.G., T.L. and Y.P.; Visualization, A.Tereshchenko and A.B.; Supervision, A.Tereshchenko and A.G.; Project Administration, A.G.; Funding Acquisition, A.G., L.K. and A.S.

Acknowledgments

This research was funded by the Russian Science Foundation (grant No. 17-72-10245). A.Tarasov and L.K. acknowledge the support of the catalytic tests from the Ministry of Education and Science of the Russian Federation in the framework of Increase Competitiveness Program of NUST «MISiS» (grant No. К2-2019-005).

Conflicts of Interest

The authors declare no conflict of interest.

Appendix A

Palladium (II) chloride was dissolved in a saturated water solution of sodium chloride; 5% ammonia was added to the resulting red-brown solution to obtain pH = 10–11. Yellow crystals of diaminepalladium (II) chloride were formed:
N a 2 [ P d C l 4 ] + 2 N H 3 H 2 O d i l u t e d = [ P d ( N H 3 ) 2 C l 2 ] + 2 H 2 O + 2 N a C l
The precipitate was washed with distilled water until the chloride ions were completely removed (AgNO3 test) and dried at 60 °C. The resulting substance was dissolved in a minimum volume of a concentrated ammonia solution to form a colorless solution:
[ P d ( N H 3 ) 2 C l 2 ] + 2 N H 3 H 2 O c o n c . = [ P d ( N H 3 ) 4 ] C l 2 + 2 H 2 O
The solution was evaporated at room temperature. Colorless crystals of tetraaminepalladium (II) chloride was formed.

References

  1. Tang, Z.; Edwards, J.; Bartley, J.; Taylor, S.; Carley, A.; Herzing, A.; Kiely, C.; Hutchings, G. Nanocrystalline cerium oxide produced by supercritical antisolvent precipitation as a support for high-activity gold catalysts. J. Catal. 2007, 249, 208–219. [Google Scholar] [CrossRef]
  2. Yang, Y.; Saoud, K.M.; Abdelsayed, V.; Glaspell, G.; Deevi, S.; El-Shall, M.S. Vapor phase synthesis of supported Pd, Au, and unsupported bimetallic nanoparticle catalysts for CO oxidation. Catal. Commun. 2006, 7, 281–284. [Google Scholar] [CrossRef]
  3. Glaspell, G.; Fuoco, L.; El-Shall, M.S. Microwave synthesis of supported Au and Pd nanoparticle catalysts for CO oxidation. J. Phys. Chem. B 2005, 109, 17350–17355. [Google Scholar] [CrossRef] [PubMed]
  4. Zou, J.; Si, Z.; Cao, Y.; Ran, R.; Wu, X.; Weng, D. Localized surface plasmon resonance assisted photothermal catalysis of CO and toluene oxidation over Pd–CeO2 catalyst under visible light irradiation. J. Phys. Chem. C 2016, 120, 29116–29125. [Google Scholar] [CrossRef]
  5. Jeong, H.; Bae, J.; Han, J.W.; Lee, H. Promoting effects of hydrothermal treatment on the activity and durability of Pd/CeO2 catalysts for CO oxidation. ACS Catal. 2017, 7, 7097–7105. [Google Scholar] [CrossRef]
  6. Slavinskaya, E.M.; Gulyaev, R.V.; Zadesenets, A.V.; Stonkus, O.A.; Zaikovskii, V.I.; Shubin, Y.V.; Korenev, S.V.; Boronin, A.I. Low-temperature CO oxidation by Pd/CeO2 catalysts synthesized using the coprecipitation method. Appl. Catal. B Environ. 2015, 166, 91–103. [Google Scholar] [CrossRef]
  7. Spezzati, G.; Benavidez, A.D.; DeLaRiva, A.T.; Su, Y.; Hofmann, J.P.; Asahina, S.; Olivier, E.J.; Neethling, J.H.; Miller, J.T.; Datye, A.K.; et al. CO oxidation by Pd supported on CeO2(100) and CeO2(111) facets. Appl. Catal. B Environ. 2019, 243, 36–46. [Google Scholar] [CrossRef]
  8. Zhu, H.; Qin, Z.; Shan, W.; Shen, W.; Wang, J. Low-temperature oxidation of CO over Pd/CeO2–TiO2 catalysts with different pretreatments. J. Catal. 2005, 233, 41–50. [Google Scholar] [CrossRef]
  9. Kinoshita, K.J. Particle size effects for oxygen reduction on highly dispersed platinum in acid electrolytes. J. Electrochem. Soc. 1990, 137, 845–848. [Google Scholar] [CrossRef]
  10. Rojluechai, S.; Chavadej, S.; Schwank, J.W.; Meeyoo, V. Catalytic activity of ethylene oxidation over Au, Ag and Au–Ag catalysts: Support effect. Catal. Commun. 2007, 8, 57–64. [Google Scholar] [CrossRef]
  11. Buil, M.L.; Esteruelas, M.A.; Niembro, S.; Oliván, M.; Orzechowski, L.; Pelayo, C.; Vallribera, A. Dehalogenation and hydrogenation of aromatic compounds catalyzed by nanoparticles generated from rhodium bis(imino)pyridine complexes. Organometallics 2010, 29, 4375–4383. [Google Scholar] [CrossRef]
  12. Shim, J.; Yoo, D.-Y.; Lee, J.-S. Characteristics for electrocatalytic properties and hydrogen–oxygen adsorption of platinum ternary alloy catalysts in polymer electrolyte fuel cell. Electrochim. Acta 2000, 45, 1943–1951. [Google Scholar] [CrossRef]
  13. Nie, L.; Mei, D.; Xiong, H.; Peng, B.; Ren, Z.; Hernandez, X.I.P.; DeLaRiva, A.; Wang, M.; Engelhard, M.H.; Kovarik, L.; et al. Activation of surface lattice oxygen in single-atom Pt/CeO2 for low-temperature CO oxidation. Science 2017, 358, 1419–1423. [Google Scholar] [CrossRef] [PubMed]
  14. Guo, M.; Li, C.; Yang, Q. Accelerated catalytic activity of Pd NPs supported on amine-rich silica hollow nanospheres for quinoline hydrogenation. Catal. Sci. Technol. 2017, 7, 2221–2227. [Google Scholar] [CrossRef]
  15. Li, Z.; Liu, J.; Xia, C.; Li, F. Nitrogen-functionalized ordered mesoporous carbons as multifunctional supports of ultrasmall Pd nanoparticles for hydrogenation of phenol. ACS Catal. 2013, 3, 2440–2448. [Google Scholar] [CrossRef]
  16. Wong, A.; Liu, Q.; Griffin, S.; Nicholls, A.; Regalbuto, J.R. Synthesis of ultrasmall, homogeneously alloyed, bimetallic nanoparticles on silica supports. Science 2017, 358, 1427–1430. [Google Scholar] [CrossRef] [PubMed]
  17. Wei, J.; Zou, L.; Li, Y. Facile synthesis of hollow structured mesoporous silica nanoreactors with confined ultra-small Pd NPs for efficient hydrogenation reactions. J. Porous Mater. 2018, 2018, 1–6. [Google Scholar] [CrossRef]
  18. Chaudhary, S.; Sharma, P.; Singh, D.; Umar, A.; Kumar, R. Chemical and pathogenic cleanup of wastewater using surface-functionalized CeO2 nanoparticles. ACS Sustain. Chem. Eng. 2017, 5, 6803–6816. [Google Scholar] [CrossRef]
  19. Xu, J.; Li, L.; Li, G. A facile approach to well-dispersible CeO2 nanoparticles. J. Dispers. Sci. Technol. 2008, 29, 1072–1076. [Google Scholar] [CrossRef]
  20. Jorge, A.B.; Sakatani, Y.; Boissière, C.; Laberty-Roberts, C.; Sauthier, G.; Fraxedas, J.; Sanchez, C.; Fuertes, A. Nanocrystalline N-doped ceria porous thin films as efficient visible-active photocatalysts. J. Mater. Chem. 2012, 22, 3220. [Google Scholar] [CrossRef] [Green Version]
  21. Safonova, O.V.; Guda, A.A.; Paun, C.; Smolentsev, N.; Abdala, P.M.; Smolentsev, G.; Nachtegaal, M.; Szlachetko, J.; Soldatov, M.A.; Soldatov, A.V.; et al. Electronic and geometric structure of Ce3+ forming under reducing conditions in shaped ceria nanoparticles promoted by platinum. J. Phys. Chem. C 2014, 118, 1974–1982. [Google Scholar] [CrossRef]
  22. Groppo, E.; Bertarione, S.; Rotunno, F.; Agostini, G.; Scarano, D.; Pellegrini, R.; Leofanti, G.; Zecchina, A.; Lamberti, C. Role of the support in determining the vibrational properties of carbonyls formed on Pd supported on SiO2−Al2O3, Al2O3, and MgO. J. Phys. Chem. C 2007, 111, 7021–7028. [Google Scholar] [CrossRef]
  23. Lamberti, C.; Zecchina, A.; Groppo, E.; Bordiga, S. Probing the surfaces of heterogeneous catalysts by in situ ir spectroscopy. Chem. Soc. Rev. 2010, 39, 4951–5001. [Google Scholar] [CrossRef] [PubMed]
  24. Abbott, H.L.; Aumer, A.; Lei, Y.; Asokan, C.; Meyer, R.J.; Sterrer, M.; Shaikhutdinov, S.; Freund, H.J. CO adsorption on monometallic and bimetallic Au−Pd nanoparticles supported on oxide thin films. J. Phys. Chem. C 2010, 114, 17099–17104. [Google Scholar] [CrossRef]
  25. Baylet, A.; Marécot, P.; Duprez, D.; Castellazzi, P.; Groppi, G.; Forzatti, P. In situ raman and in situ XRD analysis of Pdo reduction and Pd° oxidation supported on γ-Al2O3 catalyst under different atmospheres. Phys. Chem. Chem. Phys. 2011, 13, 4607–4613. [Google Scholar] [CrossRef] [PubMed]
  26. Zhou, W.; Lee, J.Y. Particle size effects in Pd-catalyzed electrooxidation of formic acid. J. Phys. Chem. C 2008, 112, 3789–3793. [Google Scholar] [CrossRef]
  27. Xia, Y.; Ye, J.; Cheng, D.-G.; Chen, F.; Zhan, X. Identification of a flattened pd–ce oxide cluster as a highly efficient catalyst for low-temperature Co oxidation. Catal. Sci. Technol. 2018, 8, 5137–5147. [Google Scholar] [CrossRef]
  28. Cargnello, M.; Montini, T.; Polizzi, S.; Wieder, N.L.; Gorte, R.J.; Graziani, M.; Fornasiero, P. Novel embedded Pd@CeO2 catalysts: A way to active and stable catalysts. Dalton Trans. 2010, 39, 2122–2127. [Google Scholar] [CrossRef]
  29. Schneider, C.A.; Rasband, W.S.; Eliceiri, K.W. Nih image to imagej: 25 years of image analysis. Nat. Methods 2012, 9, 671. [Google Scholar] [CrossRef] [PubMed]
  30. Agostini, G.; Lamberti, C.; Pellegrini, R.; Leofanti, G.; Giannici, F.; Longo, A.; Groppo, E. Effect of pre-reduction on the properties and the catalytic activity of Pd/carbon catalysts: A comparison with Pd/Al2O3. ACS Catal. 2014, 4, 187–194. [Google Scholar] [CrossRef]
  31. Qi, W.; Huang, B.; Wang, M. Structure of unsupported small palladium nanoparticles. Nanoscale Res. Lett. 2009, 4, 269. [Google Scholar] [CrossRef] [PubMed]
  32. Binet, C.; Daturi, M.; Lavalley, J.-C. Ir study of polycrystalline ceria properties in oxidised and reduced states. Catal. Today 1999, 50, 207–225. [Google Scholar] [CrossRef]
  33. Zaki, M.I.; Knözlngem, H. Characterization of oxide surfaces by adsorption of carbon monoxide—a low temperature infrared spectroscopy study. Spectrochim. Acta Part A Mol. Spectrosc. 1987, 43, 1455–1459. [Google Scholar] [CrossRef]
  34. Badri, A.; Binet, C.; Lavalley, J.-C. Metal–support interaction in Pd/CeO2 catalysts. Part 2.—ceria textural effects. J. Chem. Soc. Faraday Trans. 1996, 92, 1603–1608. [Google Scholar] [CrossRef]
  35. Bozon-Verduraz, F.; Bensalem, A. Ir studies of cerium dioxide: Influence of impurities and defects. J. Chem. Soc. Faraday Trans. 1994, 90, 653–657. [Google Scholar] [CrossRef]
  36. Li, C.; Sakata, Y.; Arai, T.; Domen, K.; Maruya, K.-I.; Onishi, T. Carbon monoxide and carbon dioxide adsorption on cerium oxide studied by fourier-transform infrared spectroscopy. Part 1.—formation of carbonate species on dehydroxylated CeO2, at room temperature. J. Chem. Soc. Faraday Trans. 1 Phys. Chem. Condens. Phases 1989, 85, 929–943. [Google Scholar] [CrossRef]
  37. Mudiyanselage, K.; Kim, H.Y.; Senanayake, S.D.; Baber, A.E.; Liu, P.; Stacchiola, D. Probing adsorption sites for CO on ceria. Phys. Chem. Chem. Phys. 2013, 15, 15856–15862. [Google Scholar] [CrossRef]
  38. Chen, S.; Cao, T.; Gao, Y.; Li, D.; Xiong, F.; Huang, W. Probing surface structures of CeO2, TiO2, and Cu2O nanocrystals with CO and CO2 chemisorption. J. Phys. Chem. C 2016, 120, 21472–21485. [Google Scholar] [CrossRef]
  39. Bensalem, A.; Bozon-Verduraz, F.; Perrichon, V. Palladium–ceria catalysts: Reversibility of hydrogen chemisorption and redox phenomena. J. Chem. Soc. Faraday Trans. 1995, 91, 2185–2189. [Google Scholar] [CrossRef]
  40. Padilla, J.M.; Del Angel, G.; Navarrete, J. Improved Pd/γ-Al2O3–Ce catalysts for benzene combustion. Catal. Today 2008, 133, 541–547. [Google Scholar] [CrossRef]
  41. Di Gregorio, F.; Bisson, L.; Armaroli, T.; Verdon, C.; Lemaitre, L.; Thomazeau, C. Characterization of well faceted palladium nanoparticles supported on alumina by transmission electron microscopy and ft-ir spectroscopy of CO adsorption. Appl. Catal. A Gen. 2009, 352, 50–60. [Google Scholar] [CrossRef]
  42. Yudanov, I.V.; Sahnoun, R.; Neyman, K.M.; Rösch, N.; Hoffmann, J.; Schauermann, S.; Johánek, V.; Unterhalt, H.; Rupprechter, G.; Libuda, J.; et al. CO adsorption on Pd nanoparticles:  Density functional and vibrational spectroscopy studies. J. Phys. Chem. B 2003, 107, 255–264. [Google Scholar] [CrossRef]
  43. Wang, X.; Wu, G.; Guan, N.; Li, L. Supported Pd catalysts for solvent-free benzyl alcohol selective oxidation: Effects of calcination pretreatments and reconstruction of Pd sites. Appl. Catal. B Environ. 2012, 115, 7–15. [Google Scholar] [CrossRef]
  44. Baidya, T.; Bera, P.; Mukri, B.; Kumar Parida, S.; Kröcher, O.; Elsener, M.; Hegde, M.S. Drifts studies on CO and NO adsorption and NO plus CO reaction over Pd2+-substituted CeOSS and Ce0.75Sn0.25O2 catalysts. J. Catal. 2013, 303, 117–129. [Google Scholar] [CrossRef]
  45. Spezzati, G.; Su, Y.; Hofmann, J.P.; Benavidez, A.D.; DeLaRiva, A.T.; McCabe, J.; Datye, A.K.; Hensen, E.J.M. Atomically dispersed Pd–O species on CeO2(111) as highly active sites for low-temperature CO oxidation. ACS Catal. 2017, 7, 6887–6891. [Google Scholar] [CrossRef] [PubMed]
  46. Sheu, L.; Karpinski, Z.; Sachtler, W.M.H. Effects of palladium particle size and palladium silicide formation on fourier transform infrared spectra of CO adsorbed on Pd/SiO2 catalysts. J. Phys. Chem. (USA) 1989, 93, 4890–4894. [Google Scholar] [CrossRef]
  47. Fan, Q.; He, S.; Hao, L.; Liu, X.; Zhu, Y.; Xu, S.; Zhang, F. Photodeposited Pd nanoparticles with disordered structure for phenylacetylene semihydrogenation. Sci. Rep. 2017, 7, 42172. [Google Scholar] [CrossRef]
  48. Fu, Q.; Weber, A.; Flytzani-Stephanopoulos, M. Nanostructured Au–CeO2 catalysts for low-temperature water–gas shift. Catal. Lett. 2001, 77, 87–95. [Google Scholar] [CrossRef]
  49. Iglesias-Juez, A.; Hungría, A.B.; Martínez-Arias, A.; Anderson, J.A.; Fernández-García, M. Pd-based (Ce,Zr)ox-supported catalysts: Promoting effect of base metals (Cr, Cu, Ni) in CO and NO elimination. Catal. Today 2009, 143, 195–202. [Google Scholar] [CrossRef]
  50. Qi, J.; Chen, J.; Li, G.; Li, S.; Gao, Y.; Tang, Z. Facile synthesis of core–shell Au@CeO2 nanocomposites with remarkably enhanced catalytic activity for CO Oxidation. Energy Environ. Sci. 2012, 5, 8937. [Google Scholar] [CrossRef]
  51. Cargnello, M.; Doan-Nguyen, V.V.; Gordon, T.R.; Diaz, R.E.; Stach, E.A.; Gorte, R.J.; Fornasiero, P.; Murray, C.B. Control of metal nanocrystal size reveals metal-support interface role for ceria catalysts. Science 2013, 341, 771–773. [Google Scholar] [CrossRef] [PubMed]
  52. Benmouhoub, C.; Kadri, A.; Benbrahim, N.; Hadji, S. Synthesis and characterization of cerium Oxide (CeO2) nanoparticles. Mater. Sci. Forum 2009, 609, 189–194. [Google Scholar] [CrossRef]
  53. Petříček, V.; Dušek, M.; Palatinus, L. Crystallographic computing system jana2006: General features. Zeitschrift für Kristallographie-Crystalline Materials 2014, 229, 345. [Google Scholar] [CrossRef]
  54. Chernyshov, A.A.; Veligzhanin, A.; Zubavichus, Y. Structural materials science end-station at the kurchatov synchrotron radiation source: Recent instrumentation upgrades and experimental results. Nucl. Instrum. Methods Phys. Res. Sect. A Accel. Spectrom. Detect. Assoc. Equip. 2009, 603, 95–98. [Google Scholar] [CrossRef]
  55. Ravel, B.; Newville, M. Data analysis for X-ray absorption spectroscopy using ifeffit. J. Synchrotron Radiat. 2005, 12, 537–541. [Google Scholar] [CrossRef]
Figure 1. (a) SEM/EDS micro-image of Pd/CeO2; element distribution maps of (b) oxygen (blue); (c) cerium (beige); and (d) palladium. Micro-images demonstrate homogeneously distributed Pd on the whole surface of CeO2 for Pd/CeO2.
Catalysts 09 00385 g001
Figure 2. (a) HRTEM micro-image of Pd/CeO2; (b) FT image with circles related to the diffraction from CeO2 (yellow), Pd and PdO (red). The original direct HRTEM image of (b) is shown in Figure S4.
Catalysts 09 00385 g002
Figure 3. (a) Pd K-edge X-ray absorption near edge structure analysis (XANES) spectra; (b) Fourier transform (FT) performed for the k2·chi(k). Dotted lines indicate Pd-O and Pd-Pd coordination shell contributions. Spectra of Pd/CeO2, commercial Pd/C and Pd foil are shown in black (), blue () and red () color, respectively.
Catalysts 09 00385 g003
Figure 4. (a) CeO2 and (b) Pd/CeO2 DRIFT spectra during CO desorption at −140 °C, previously reduced at 200 °C in a 5% H2/Ar mixture. The spectrum measured at the highest CO coverage (θmax, PCO = 4 mbar for CeO2 and PCO = 7.5 mbar for Pd/CeO2) is highlighted in blue (); the series of spectra obtained during decreasing coverage θ are shown in grey (); the spectrum after continuous desorption (θmin, PCO = 5×10⁻³ mbar) is marked with red (). The dependency of the area ratio under the peaks related to linearly (L) adsorbed CO and bridged (B) carbonyls from the CO pressure is shown on the inset.
Catalysts 09 00385 g004
Figure 5. CO conversion vs oxidation reaction temperature in a mixture of 16.9% O2, 62.4% N2 and 20.7% CO at a flow rate of 120,000 h−1; first run (blue curve) and third run (red curve). The molar ratio of O2/CO = 0.82.
Catalysts 09 00385 g005
Table 1. Comparison of the catalytic activity of samples reported in the literature and in this study.
CatalystMax. Achieved CO Conversion, %Temperature of max. CO Conversion, °CReference
5 wt% Pd/CeO2100108[2]
5 wt% Pd/ZrO298150
5 wt% Pd/SiO292240
5 wt% Pd/CeO2100151[3]
10 wt% Pd/CeO2100173
5 wt% Pd/ZnO98200
10 wt% Pd/ZnO99194
5 wt% Pd/CuO98186
10 wt% Pd/CuO97192
0.7% Pd-CeO2/Al2O3 (PCA-R)100180[4]
2 wt% Pd/CeO2100125[5]
2 wt% Pd/CeO2 (T)143
2 wt% Pd/CeO2 (HT)75
2 wt% Pd/CeO2 (H2O)105
0.74 wt% Pd/CeO2 (450 °C)100190[6]
0.74 wt% Pd/CeO2 (600 °C)190
0.74 wt% Pd/CeO2 (800 °C)190
3.8 wt% Pd/CeO2 (450 °C)145
3.8 wt% Pd/CeO2 (600 °C)90
3.8 wt% Pd/CeO2 (800 °C)175
7.7 wt% Pd/CeO2 (450 °C)115
7.7 wt% Pd/CeO2 (600 °C)70
7.7 wt% Pd/CeO2 (800 °C)170
1 wt% Pd/CeO2-rod100150[7]
1 wt% Pd/CeO2-cube200
5 wt% Pd/SiO260300
1 wt% Pd/CeO2100204[8]
1 wt% Pd/TiO2120
1 wt% Pd/CeO2–TiO297
1 wt% Pd/CeO2 (LTR)97
1 wt% Pd/TiO2 (LTR)70
1 wt% Pd/CeO2–TiO2 (LTR)54
3 wt% Pd/CeO210050This study

