1. Introduction
The future’s society will require new technologies and processes for a sustainable production of chemicals and fuels. In this sense, biomass, and specifically lignocellulosic biomass, appears as a promising alternative to fossil fuels. On the other hand, a challenge for the development of the biorefinery, based on the use of biomass as feedstock, is the implementation of technologies to enhance the catalytic performance of existing processes. Thus, in the last years, these have improved the dehydration of pentoses and hexoses to produce furfural (FUR) and 5-hydroxymethylfurfural (HMF), respectively, increasing their potential as platform chemicals in biorefineries [
1]. FUR has recently been considered as one of the key chemicals produced from lignocellulose, being a promising platform molecule for the synthesis of a wide variety of chemicals and biofuels [
2,
3,
4].
Currently, there are several possible pathways to obtain valuable chemicals from FUR, and, among them, its selective hydrogenation to furfuryl alcohol (FOL) is the most important, since this is a relevant building block molecule for biofuels production and the manufacture of chemicals for resins, rubbers, and fibers [
2,
3,
4]. FUR hydrogenation has been reported in vapor-phase using transition metals [
2,
4], liquid-phase using transition metals [
5,
6,
7], and the catalytic transfer hydrogenation in liquid-phase in the presence of acid-base or metal sites [
8,
9,
10,
11,
12].
Focusing on the FUR hydrogenation in vapor-phase, many efforts have been made in the search of more environmentally friendly catalysts for the hydrogenation of FUR to FOL than the copper chromite industrially used [
13]. This process was patented by DuPont in 1932 and then was employed by the Quaker Oats Company, attaining a FOL yield of 99% (170 °C) [
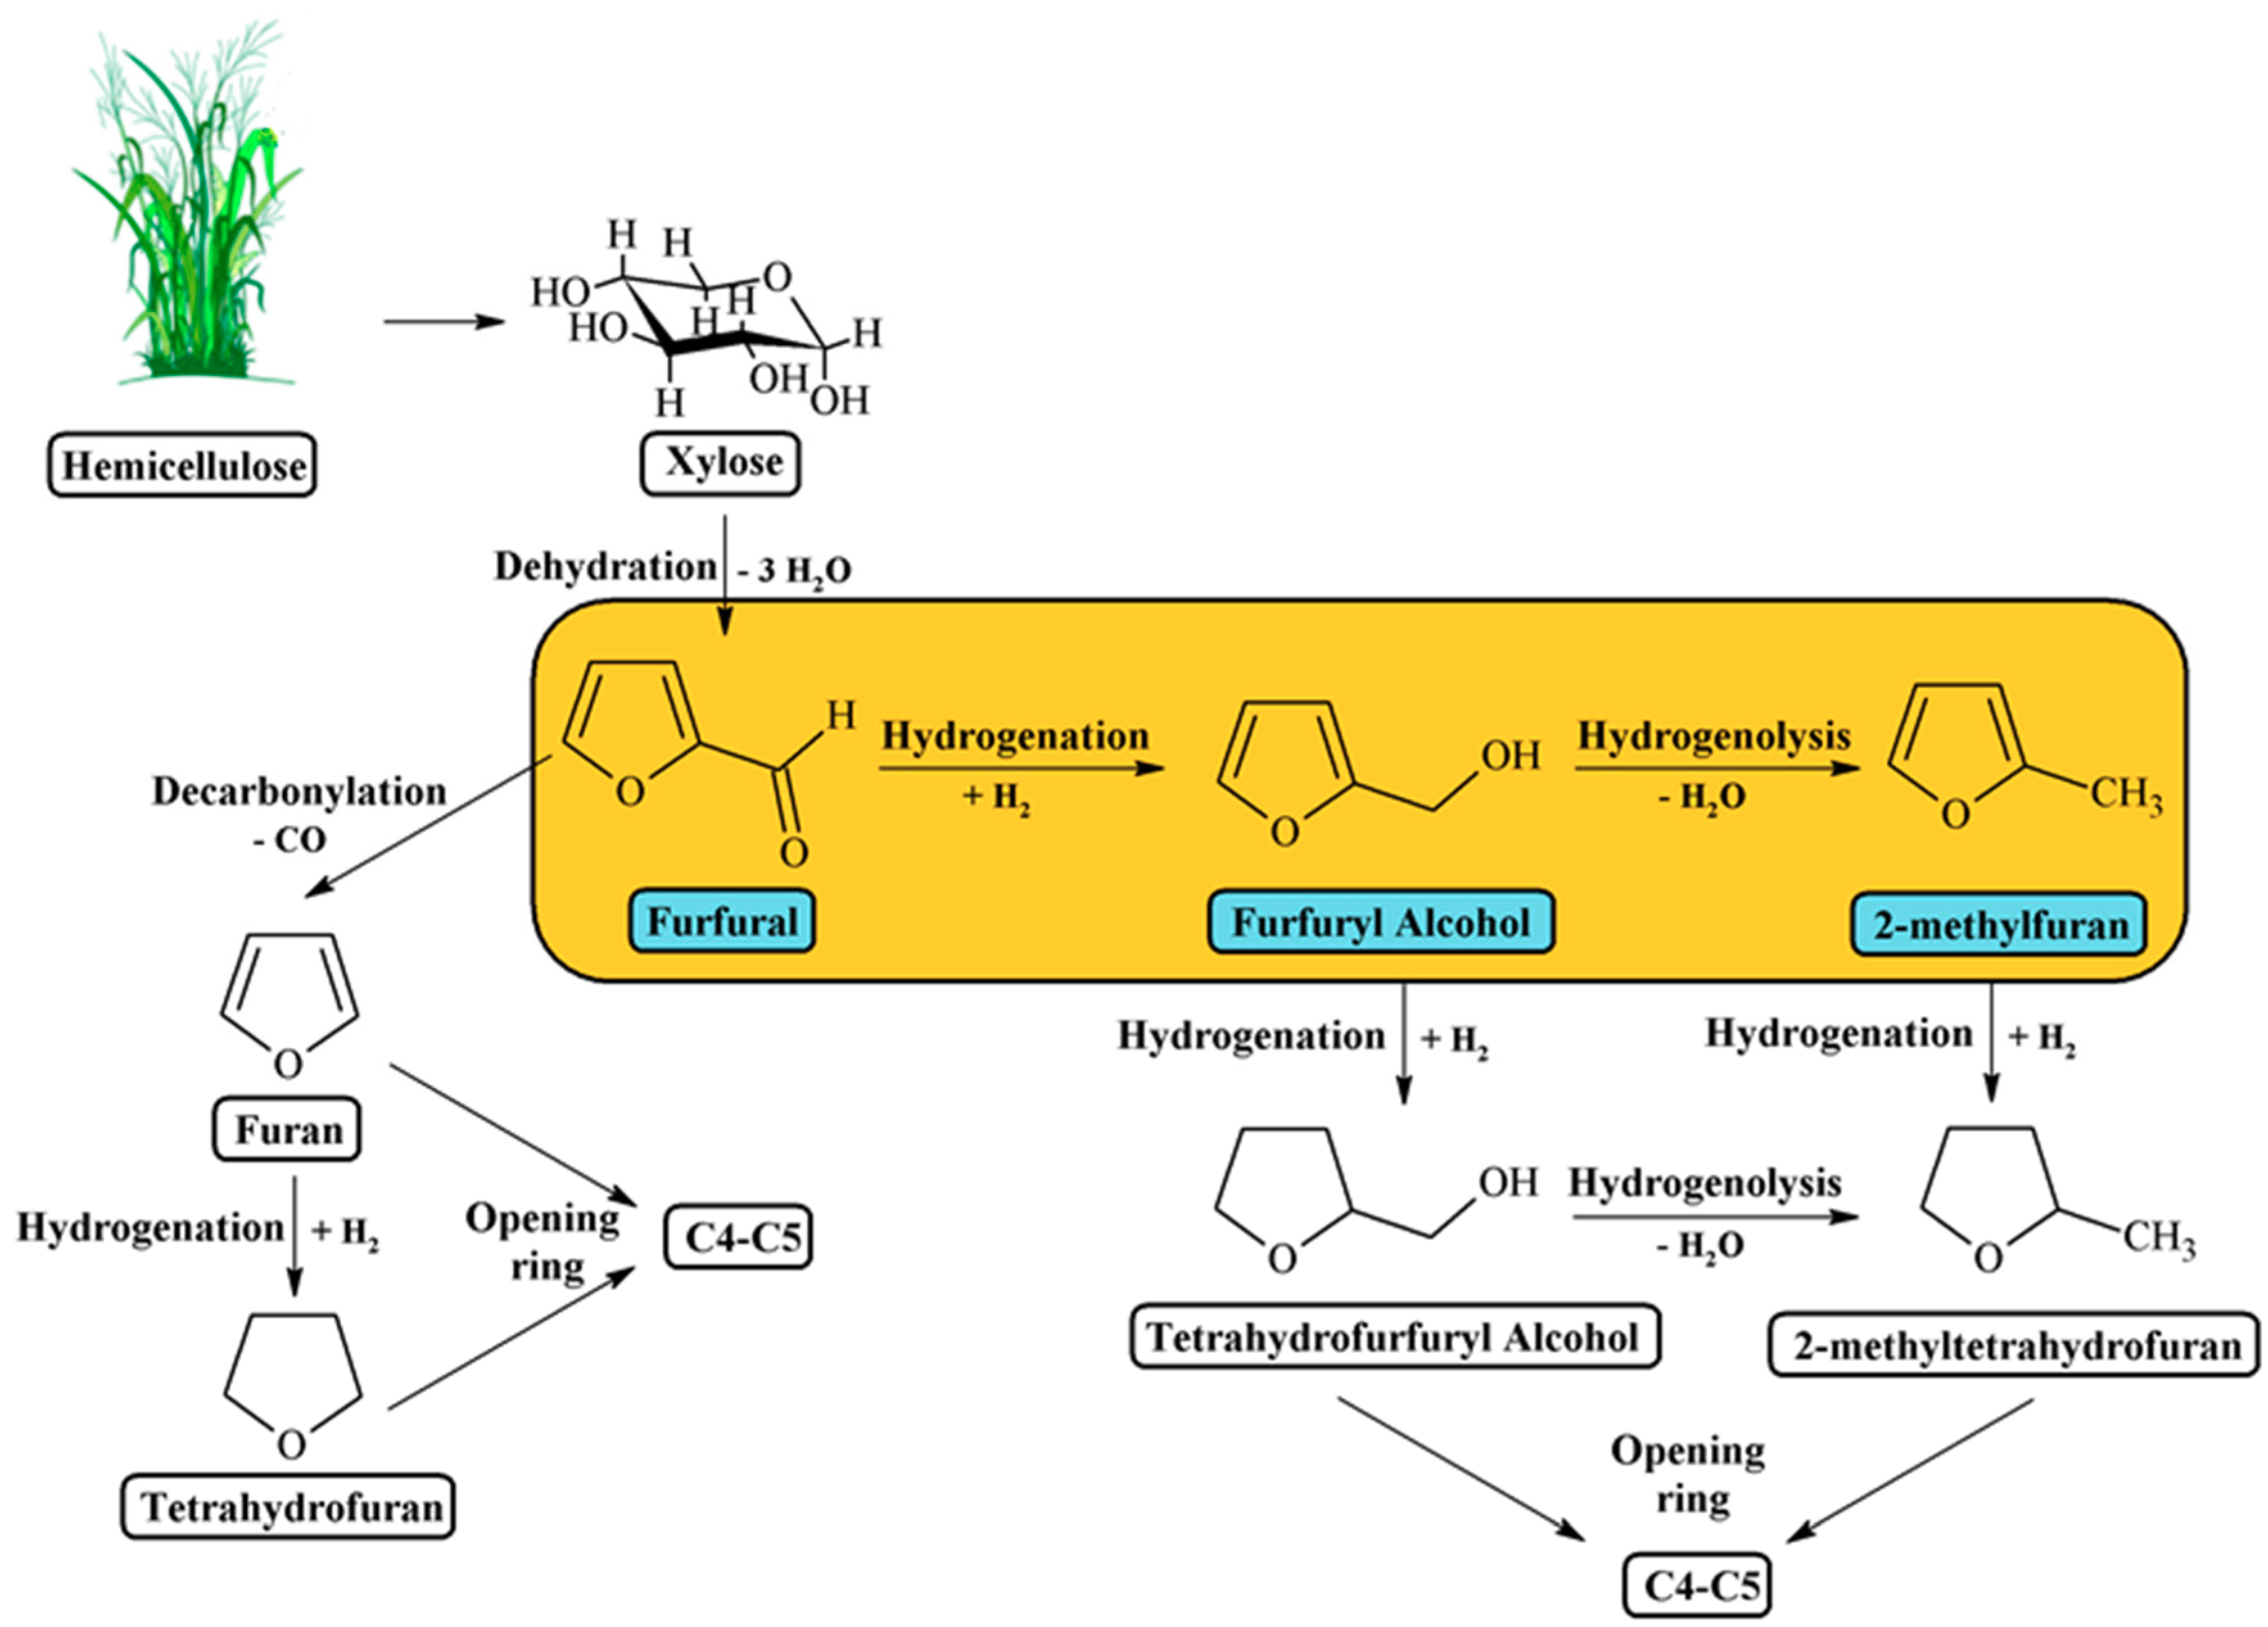
2]. The furfural hydrogenation reaction is very attractive since, besides FOL, other valuable compounds can be obtained, such as 2-methylfuran (2-MF), tetrahydrofuran (THF), and 2-methyltetrahydrofuran (2-MTHF) (
Scheme 1). For this purpose, different materials have been reported as efficient catalysts for the FUR hydrogenation. In particular, transition metal-based catalysts, e.g., Co, Ni, Cu, Pd, and Pt [
14,
15,
16,
17,
18,
19,
20], have been postulated as potential alternatives to replace the traditional copper chromite.
A key parameter in determining the selectivity of catalysts towards FOL is the hydrogenating capacity of the transition metal used as active phase. Thus, catalysts based on Group VIII transition metals, such as Pd, Pt, or Ni, due to their high hydrogenating capacity, tend to open the furan ring, or to favor the decarbonylation process. However, Cu-based ones, with a poorer hydrogenating capacity, only attack the carbonyl group of FUR, leading to FOL and 2-MF as main products. In previous studies, Sitthisa et al. carried out the hydrogenation of FUR over Cu, Pd, and Ni catalysts supported on SiO
2, at 230 °C and atmospheric pressure, reaching a FUR conversion about 75% for all catalysts [
21]. Cu-based catalysts did not cause hydrogenation of the furan ring and thus led mostly to FOL (98%), with a small amount of MF (2%). However, Pd-based catalysts provided mainly furan (60%) with some THF (20%) and FOL (14%), whereas Ni-based catalysts yield products resulting from the hydrogenation and furan ring opening, with a wider range of products. On the other hand, Nagaraja et al. reported the use of Cu/MgO and Cu-MgO-Cr
2O
3 catalysts to attain maximum yield of FOL (>98%) [
22,
23]. Similar yields of FOL were obtained by several authors using the commercial copper chromite catalyst, under high reaction temperature and hydrogen pressure [
14,
24]. Unfortunately, the commercial catalyst presents numerous disadvantages, since it is not environmentally friendly due to the presence of chromium, undergoes a strong deactivation, and works under more drastic catalytic conditions.
The influence of synthesis method of catalysts is also known to be an important factor influencing the catalytic behavior. Thus, Nagaraja et al. studied Cu/MgO catalysts prepared by several synthetic methods: coprecipitation, solid-solid wetting, and impregnation [
22]. The highest yield of FOL was obtained for the Cu/MgO catalyst synthesized by coprecipitation, due to its larger amount of available surface Cu
0 sites, attaining a FUR conversion of 98%, with a FOL selectivity of 98%, without any deactivation after 5 h TOS. These authors concluded that the interaction of Cu particles and the oxygen vacancies of MgO must have a beneficial effect on the catalytic performance. This highlights the importance of the support, so it is necessary to study and optimize parameters, such as the metal-support interaction and morphology of metal particles, because it is well known that partially reducible supports can modify the electronic density of the catalyst surface.
Another challenge in this field is to prevent the catalyst deactivation, due to the sintering of Cu particles, as well as the deposition of carbonaceous species on active sites as a consequence of the strong interaction between FUR and FOL molecules with metal copper sites [
2,
7]. In this sense, the selection of the support is also a key parameter in determining the catalytic behavior because, in addition to dispersing the metallic particles to increase the number of accessible active centers, the modification of the electronic density of metal can affect the selectivity and catalyst deactivation. It is clearly described that the acid-base behavior of the support influences the dispersion of metal particles. Thus, acidic supports, such as silica, highly disperse the metallic phase, although the acidity must be modulated, since the presence of a large proportion of acid sites can favor polymerization processes. The use of amphoteric or basic supports, such as ZnO and MgO, favors metal-support interaction, which can increase the number of available active centers and so the catalytic activity, as well as the resistance to deactivation due to a weaker interaction with FUR molecules. Thus, different supports have been used for the preparation of Cu-based catalysts: SiO
2 [
16,
25,
26,
27], Al
2O
3 [
25,
28], MgO [
22,
23,
29,
30], ZnO [
25,
31,
32,
33], and CeO
2 [
34], and their catalytic activity in FUR hydrogenation has been evaluated. In this sense, our research group has recently showed that the strong interaction of Cu
0 sites with the amphoteric ZnO avoids the deactivation of the Cu species by a sintering process, especially for the Cu/ZnO catalyst with the lowest metal content, which still shows a FOL yield of 60 mol% after 24 h of TOS [
31]. The deactivation by sintering has also been ruled out for the Cu
0 species dispersed on CeO
2. These Cu/CeO
2 catalysts showed high metal surface area, even for catalysts with high copper content, which reached a FUR conversion of 83%, after 5 h TOS at 190 °C [
34]. Moreover, we have also studied the use of clays (bentonite and sepiolite), which are abundant, versatile, and inexpensive natural materials, as supports for copper catalysts [
35]. Although these catalysts showed high yields of FOL (72%) after 5 h of TOS at 210 °C, they suffer a progressive deactivation along the TOS. However, a deeper study is required since the use of copper as active phase and clay minerals as support is a competitive and sustainable catalytic system for larger scale application, in such a way that it is environmentally benign due to the absence of chromium in its composition.
Thus, inspired by the above results obtained by our research group in FUR hydrogenation using clay minerals as support [
35], the present work deals with the analysis of the influence of the incorporation of several metal oxides, such as MgO, ZnO, and CeO
2, on the catalytic behavior of Cu
0 catalysts, supported on an inexpensive fibrous phyllosilicate, like sepiolite, in the vapor-phase hydrogenation of FUR to FOL. In all cases, catalytic precursors were obtained by simultaneous coprecipitation of Cu
2+ species and Mg
2+, Zn
2+, or Ce
4+ species in the presence of the sepiolite mineral, a quick and economical method of synthesis in a single step.
3. Characterization of Catalysts
From the catalytic study, it is feasible to infer a positive effect of the incorporation of metal oxides to copper supported on sepiolite catalysts in the vapor-phase hydrogenation of FUR, and the Cu/M molar ratios have been optimized for each family of catalysts. Therefore, it is necessary to characterize these catalysts to explain this beneficial effect.
Firstly, the reduction profiles of precursors have been determined by H
2-TPR (
Figure 5). It is well known that the reducibility of CuO species directly depends on the synthesis method, the interaction with the support and the reducibility of the support [
37,
39]. Several authors have indicated that the reduction of copper takes place in a sequential process (Cu
2+ → Cu
+ → Cu
0). However, in most cases, it is difficult to differentiate between these two different reduction peaks due to morphological/structural differences in CuO entities involved in the reduction process [
40].
For the bulk CuO, two different reduction peaks can be observed: the reduction of smaller CuO particles starts at about 164 °C, whereas the maximum H
2 consumption at 285 °C is assigned to bigger CuO particles. This value is higher than those observed for catalysts supported on sepiolite, pointing out the formation of smaller dispersed Cu nanoparticles, which are easily reduced [
35]. Thus, the maximum reduction temperature is slightly displaced at lower temperature (237 °C) for the CuSep material.
In the case of catalysts containing ZnO, i.e., 1CuZnO and 1CuZnOSep, both display a similar profile. Thus, the 1CuZnO material showed a H
2 consumption signal centered about 200 °C, as previously reported [
31], similar to the profile corresponding to 1CuZnOSep, as can be observed in
Figure 5. This peak is only associated with the reduction of CuO species since the reduction of ZnO occurs at much higher temperature. The presence of ZnO and sepiolite in the catalyst might facilitate the reduction of the Cu
2+ species due to the formation of dispersed CuO nanostructures, which should be reduced more easily.
With regard to the MgO-based catalysts, previous studies carried out for CuO supported on MgO, obtained by a coprecipitation method, have revealed that H
2 consumption for reduction of copper species took place in a wide range of temperatures (200–400 °C), as was observed for the 1CuMgOSep catalyst (
Figure 5). This fact suggests the presence of both highly dispersed small CuO particles with different interaction with the support (200–230 °C) and larger particles (275 °C).
In the case of the catalysts based on CeO
2, the reducibility of Ce(IV) must be considered, as has been previously reported [
34]. The formation of a CuO/CeO
2 system in the 1CuCeO
2 material ameliorates the reducibility of CuO species as a consequence of the oxygen mobility promoted by the ceria, which favors the spillover process in interfacial surfaces. The H
2-TPR profile reveals that there is a first H
2 consumption signal centered about 150 °C attributed to the reduction of highly dispersed CuO species in contact with CeO
2, and a more intense second signal about 200 °C associated to the reduction of bulk CuO species. The profile corresponding to the catalyst containing sepiolite (1CuCeO
2Sep) is very similar to that of 1CuCeO
2, but the signals are displaced at higher temperatures, about 200 °C for the first H
2 consumption and 225 °C for the second one.
The analysis of the H
2-TPR profiles revealed a H
2 consumption of 2364 μmol g
−1 for 15CuSep, while 1CuMgOSep, 1CuZnOSep, and 1CuCeO
2Sep consumed 1775 μmol g
−1, 1624 μmol g
−1, and 1378 μmol g
−1. These data suggest that the incorporation of MO
x species causes a decrease in the amount of Cu
0 sites available for the reaction. This fact is more pronounced as the atomic weight of the M species (M = Mg, Zn, Ce) increases. However, the values are relatively close to the theoretical ones, so the total reduction of Cu species can be confirmed (
Table 4).
According to this reducibility study, the temperature selected to reduce the catalytic precursors of this series of catalysts was 300 °C. This temperature was maintained during 1 h to favor the total reduction of precursors.
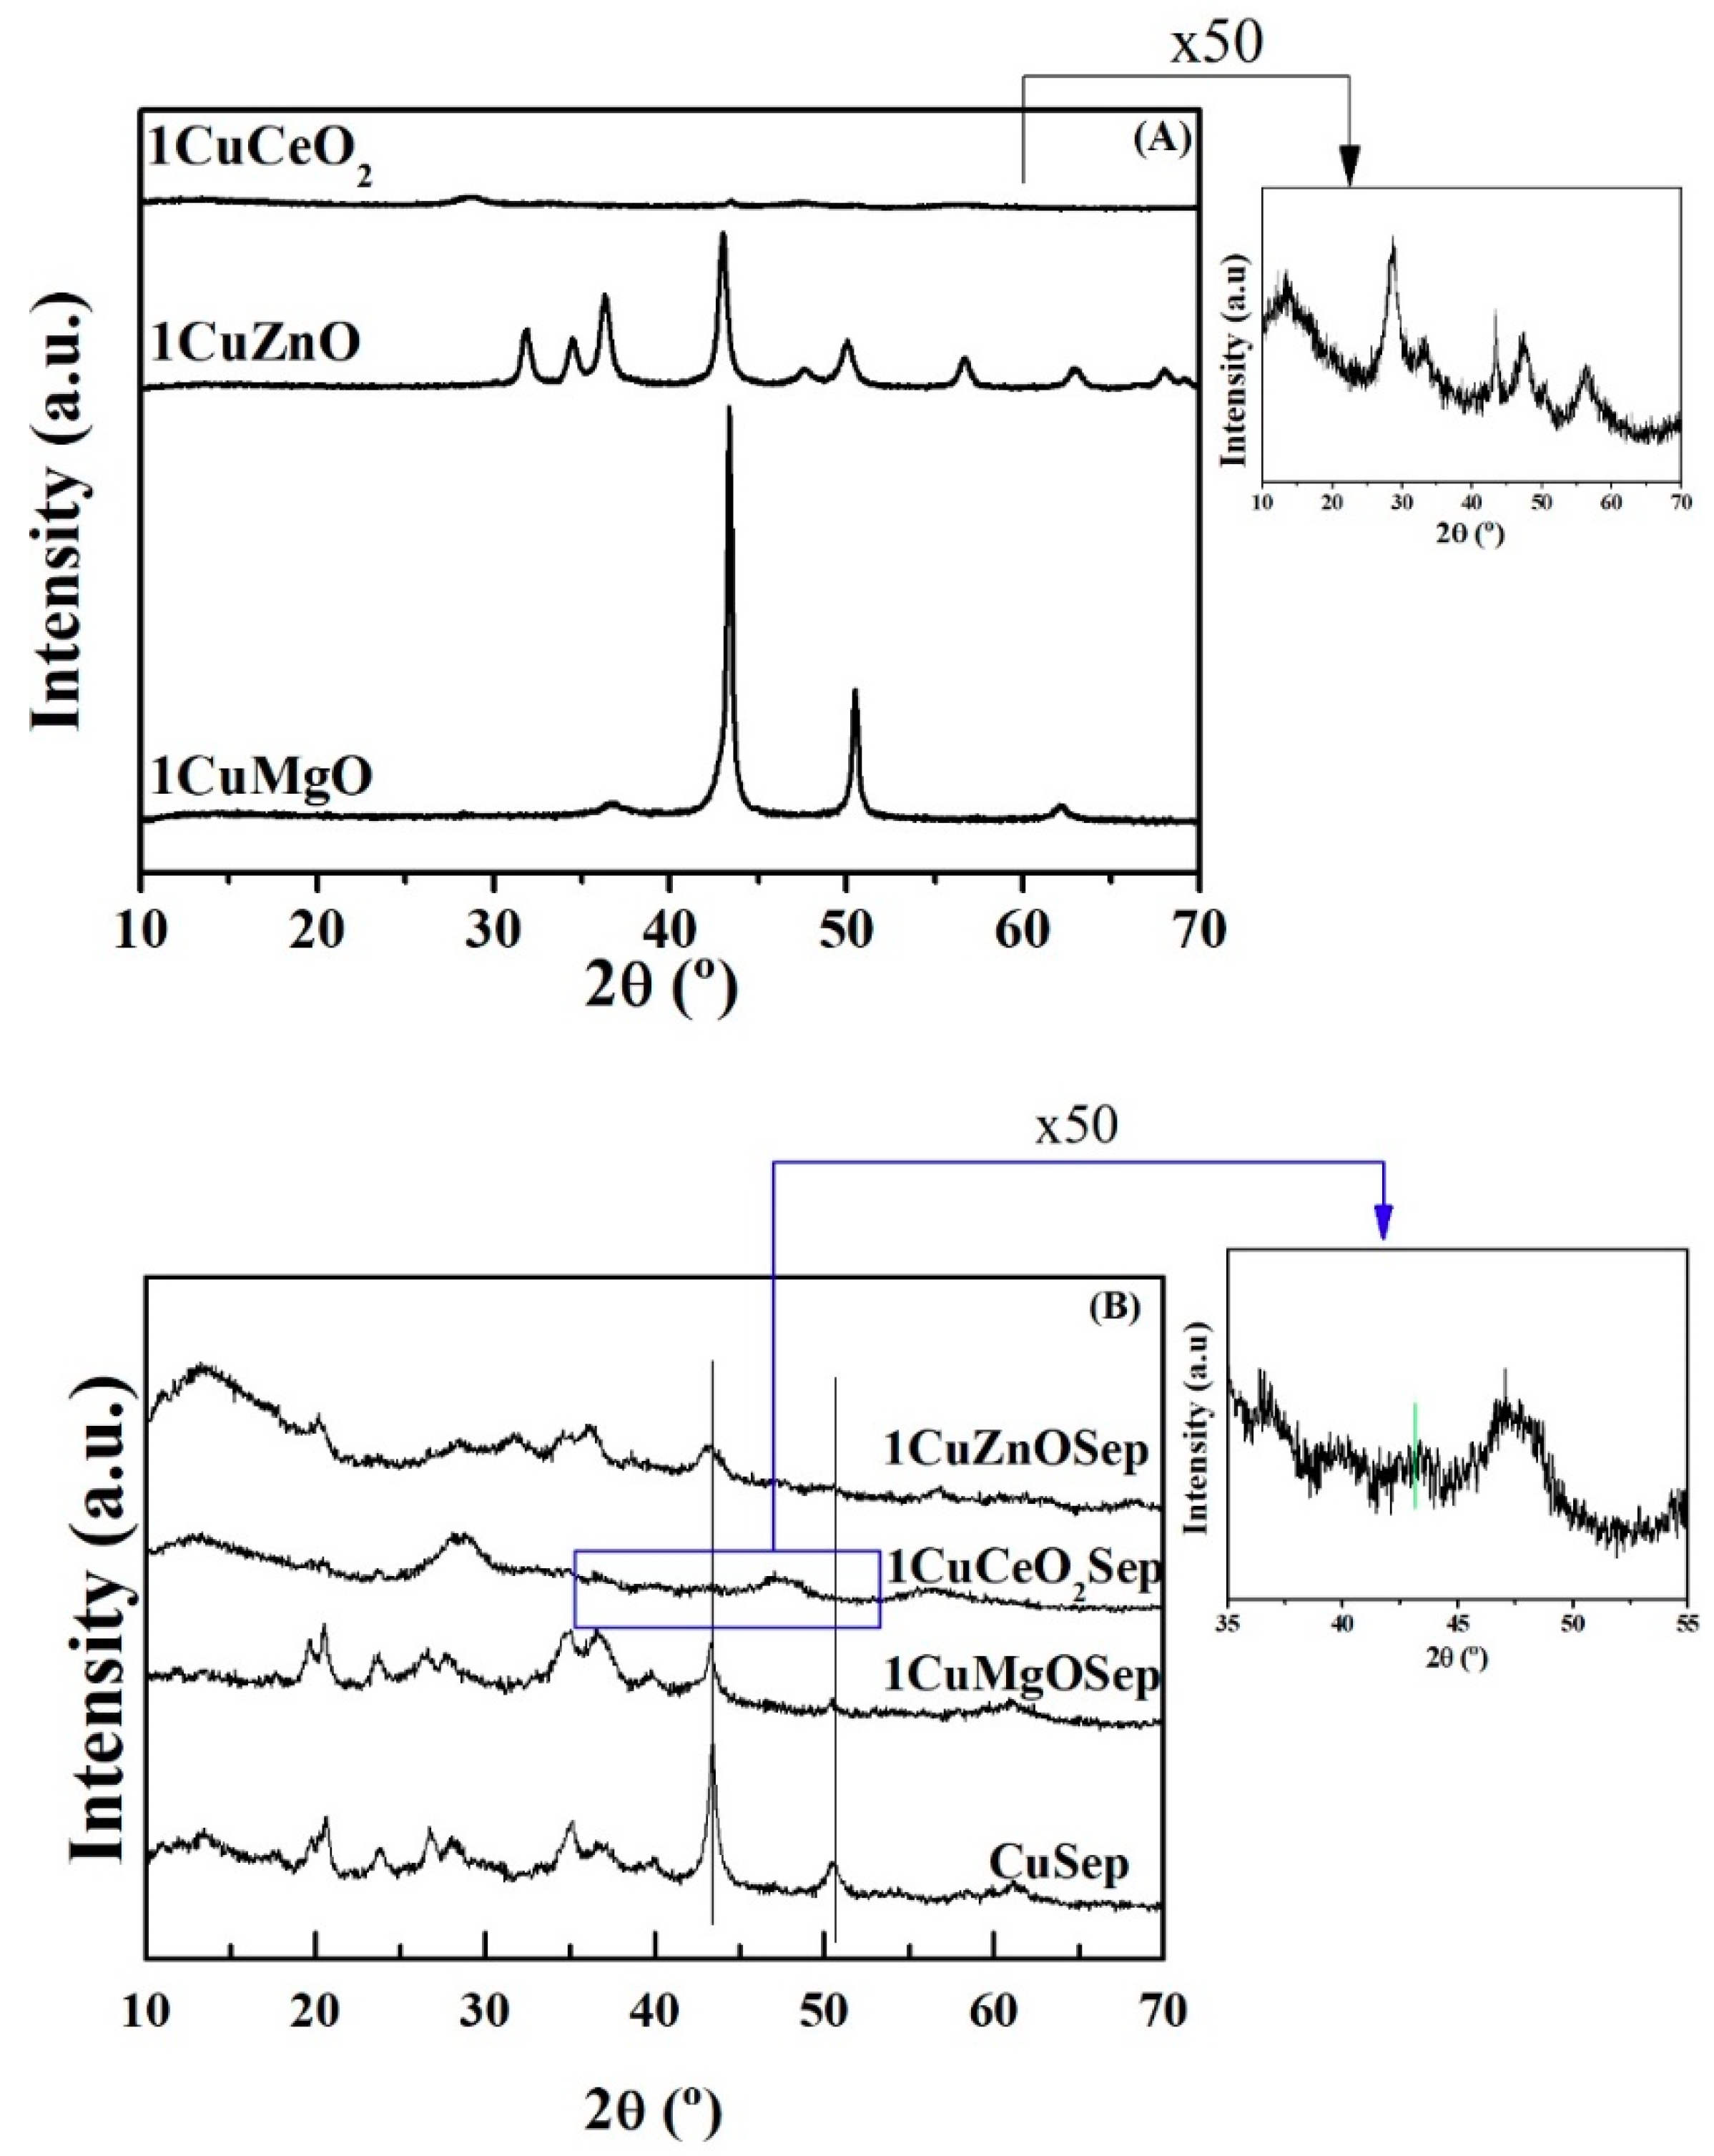
X-ray diffraction patterns of the Cu-based catalysts after its reduction at 300 °C are shown in
Figure 6. The diffraction peaks located about 2θ = 43.6 and 50.6° can be attributed to Cu
0 (PDF 00-004-0836), while the absence of diffraction peaks associated to CuO (2θ = 32.5, 35.5, 38.7, 48.8, 53.5, 58.3, 61.6, 66.2, and 68.1°, PDF 00-048-1548) corroborates the complete reduction of precursors under the selected reduction conditions. Considering that sepiolite is a natural clay mineral, XRD shows a set of bands located at 2θ = 20 and 40°, indicating that sepiolite displays high crystallinity [
41,
42]. In addition, the diffraction peak located at 60.8° (1.52 Å) confirms the presence of a trioctahedral phyllosilicate, which implies high proportion of MgO species in the octahedral sheet of the sepiolite.
Moreover, the 1CuZnO catalyst exhibits peaks at 2θ = 31.8, 34.4, 36.2, 47.6, 56.7, and 63.0°, which correspond to the hexagonal ZnO phase (PDF 00-036-1451) together with signals assigned to Cu
0 crystallites. These diffraction peaks are also present in the corresponding catalyst with sepiolite, 1CuZnOSep, but their intensity is much lower, which indicates a higher dispersion of metal copper and ZnO particles when the sepiolite is employed as support. For the 1CuCeO
2 and 1CuCeO
2Sep catalysts, peaks at 2θ = 28.5, 33.4, 47.5, 56.5, 59.2, and 61.6° are assigned to the cubic fluorite-type structure of the CeO
2 crystallites (PDF 00-034-0394), whereas those of metal Cu
0 are barely distinguished. In the enlarged figure, it can be observed that these signals are almost not observed for the catalyst containing sepiolite, which is reflected in the smallest metal particle size (3.3 nm) for this catalyst (
Table 5). The intensity of Cu
0 peaks is very high for the 1CuMgO catalyst, whilst these are much less intense for the material containing sepiolite (1CuMgOSep). In general, Cu
0 diffraction peaks are less intense for the catalysts containing both metal oxide and sepiolite. This would point out their lower crystallinity, due to smaller particle sizes, as corroborated by using the Williamson–Hall method (
Table 5) [
43]. These smaller particle sizes of the Cu-based catalysts with oxide species and dispersed on sepiolite, compared to those supported on metal oxides, can explain the beneficial effect for copper catalysts in the furfural hydrogenation, because the most suitable dispersion of metal Cu
0 sites is achieved. The 1CuCeO
2Sep catalyst has a much smaller copper particle size (3.3 nm) than CuZnOSep (10.1 nm) and 1CuMgOSep (13.0 nm) catalysts. The N
2O titration (
Table 5) shows how all catalysts display similar metallic surface (92.1–98.8), so the catalytic data could be compared.
The morphology of the catalysts was determined by TEM (
Figure 7). The TEM micrographs show how the sepiolite displays a fibrous structure. On its surface, the presence of deposited Cu particles is noteworthy (
Figure 7A). These Cu particles display a spherical morphology with a variable diameter between 5 and 25 nm. The incorporation of MgO, ZnO, or CeO
2 species also leads to the deposition of these species together with the Cu
0 particles (
Figure 7B–D). In all cases, both the particles of Cu
0 and the particles of MO
x are in intimate contact with each other, as indicated in
Figure 8.
Cu
0 and MO
x particles present a variable size (
Figure 8), although the bigger Cu particles observed in the Cu-based catalyst supported on sepiolite, have not been detected in these catalysts with MO
x species. On the other hand, the incorporation of the MO
x species favors an increase of the dispersion of the Cu species. This fact also implies a decrease of the Cu content (in wt.%), which is related to a decrease of the crystallinity in the catalytic system, as was previously detected in the XRD data (
Figure 6). It is noteworthy that the 1CuMgOSep catalyst displays Cu particles more agglomerated than those observed for 1CuZnOSep and 1CuCeO
2Sep catalysts. However, their presence could not be inferred from XRD and N
2O titration. This fact would suggest the existence of Cu particles with variable sizes, which is in agreement with the broad reduction curves obtained in the H
2-TPR study.
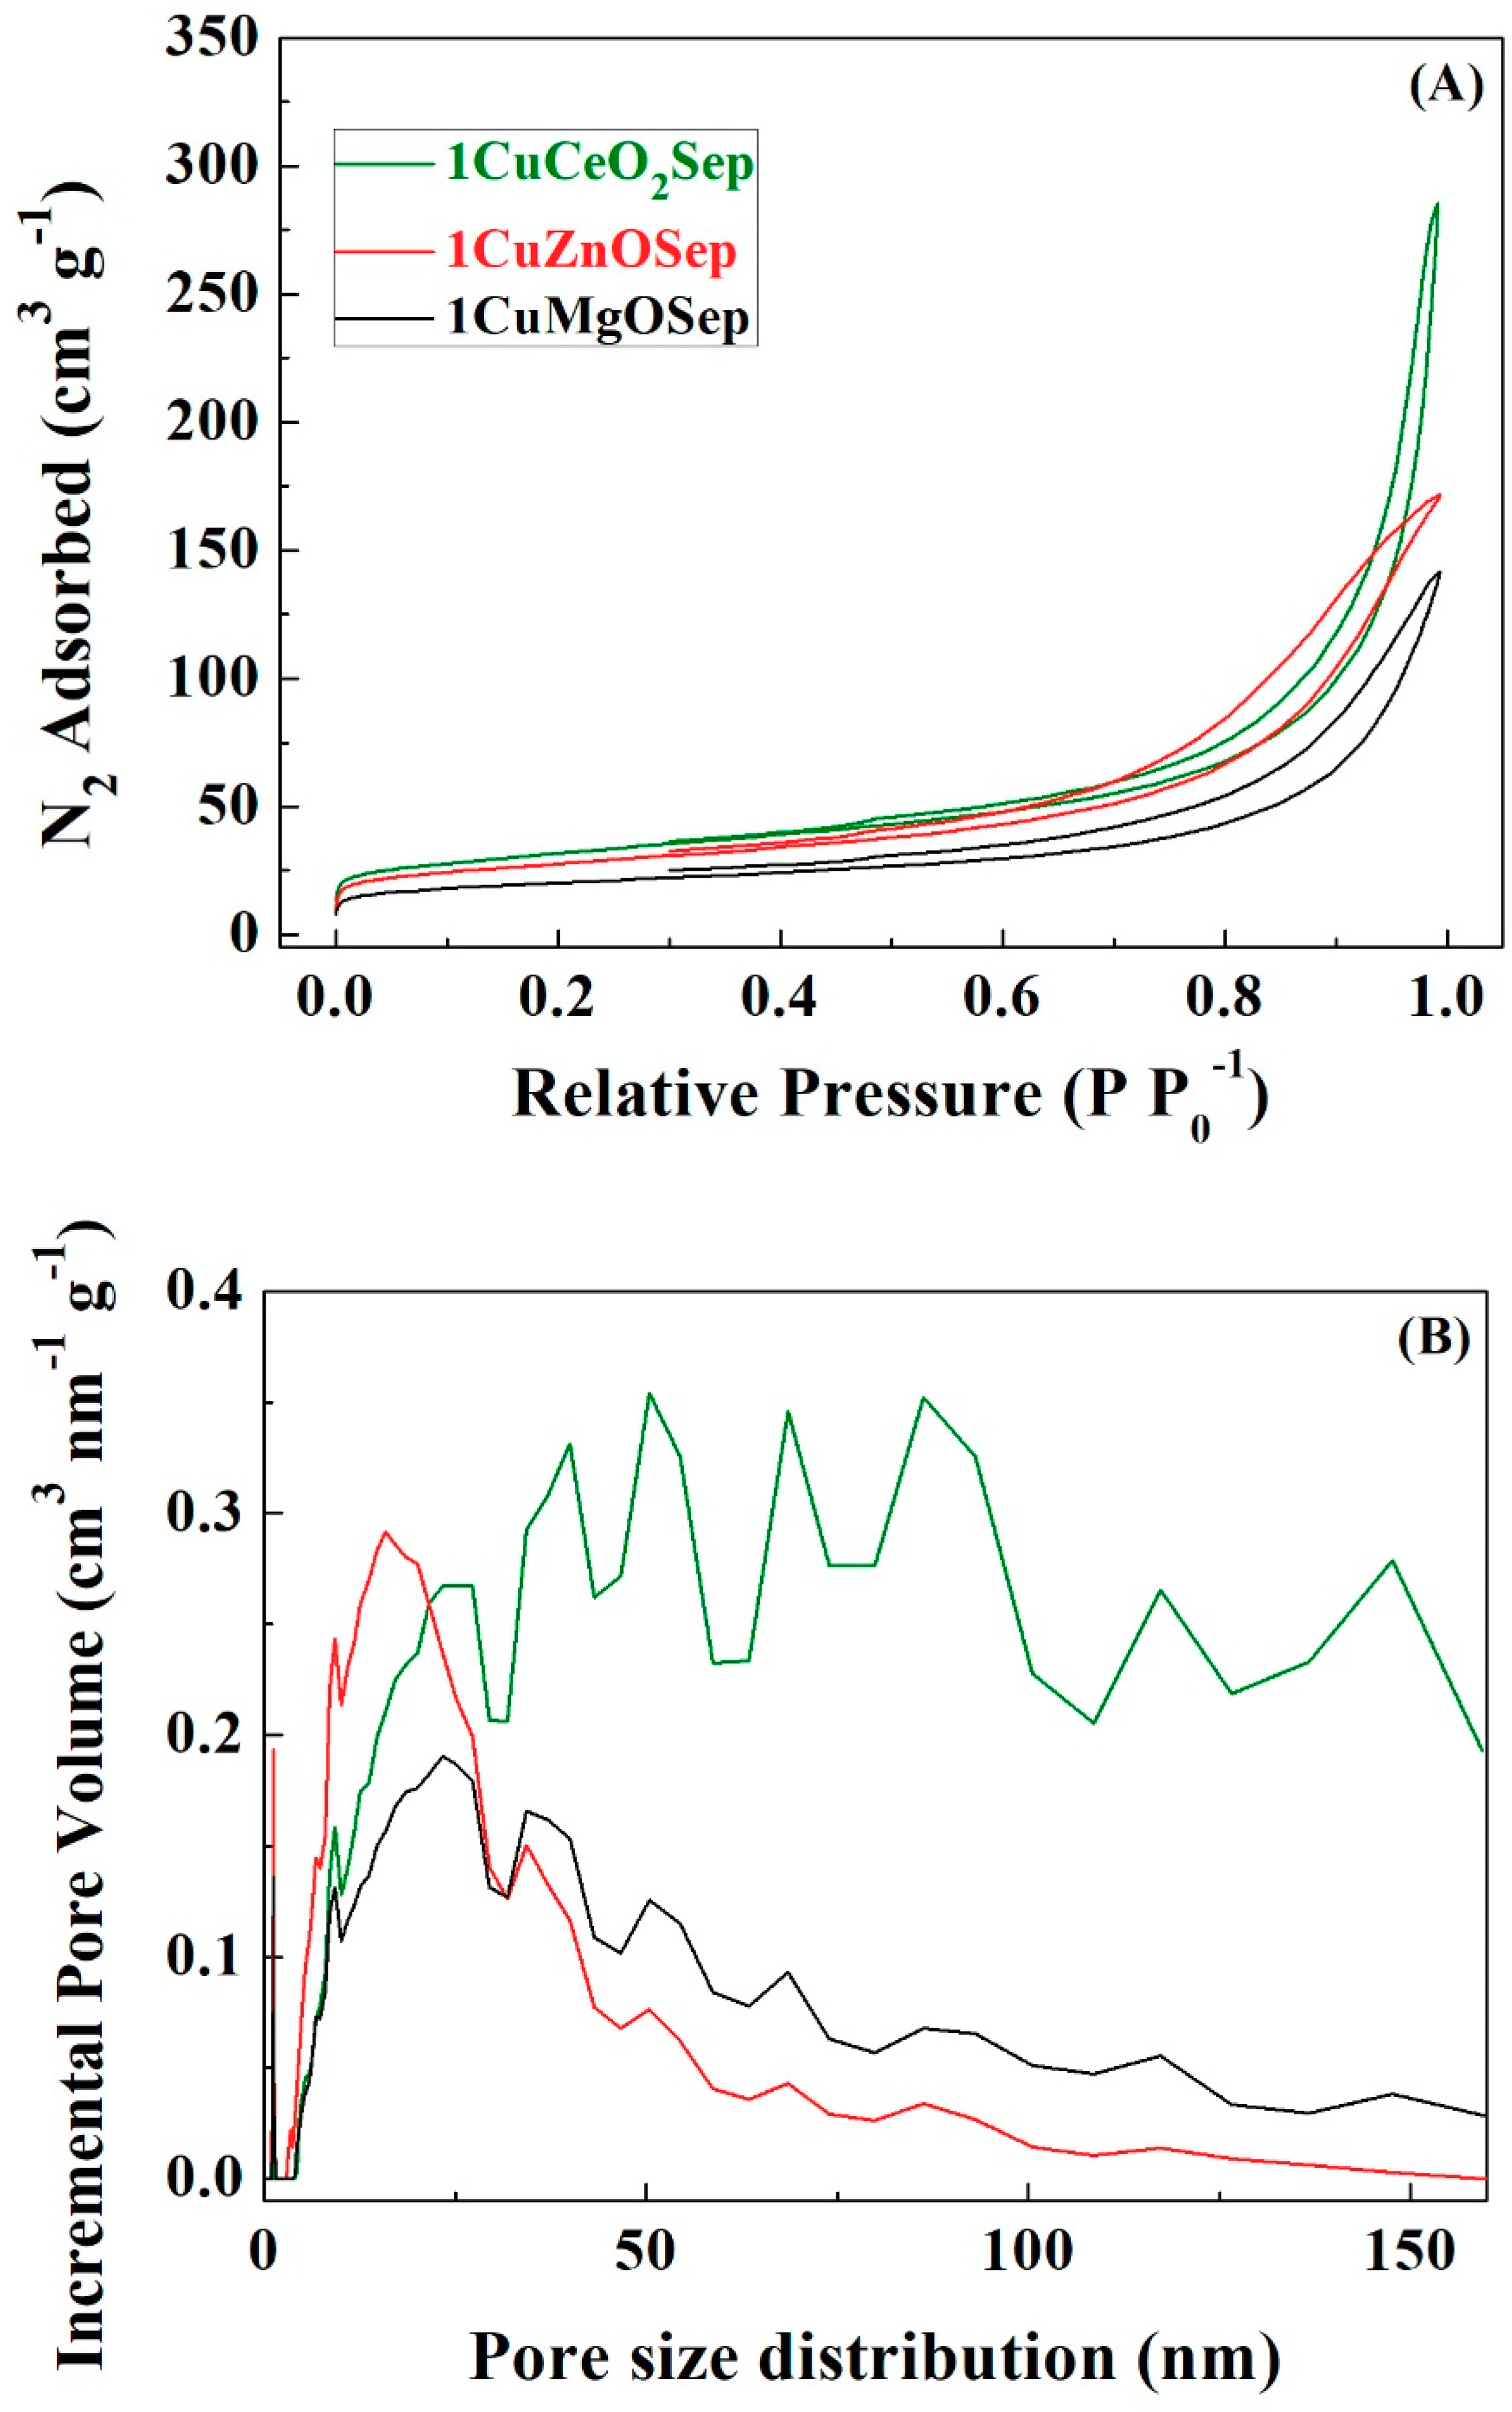
The textural parameters of the Cu-based catalysts were determined from their N
2 isotherms (
Figure 9A). The catalysts display Type II isotherms, which are ascribed to macroporous solids, which indicates the N
2 adsorbed at high relative pressure [
44]. All the catalysts display similar profiles, except in the case of the 1CuCeO
2Sep catalyst, which shows a strong increase in N
2 adsorption at higher relative pressure.
Table 5 summarizes the textural properties of catalysts with metal oxide species and supported on sepiolite, estimated from their N
2 adsorption-desorption isotherms. The formation of smaller particles, as inferred from XRD data, could imply an increase in interparticle voids, in such a way that macropores are generated between adjacent particles. This fact leads to the increase in the specific surface area (S
BET) as well as its pore volume (V
P). Thereby, the 1CuCeO
2Sep catalyst, which displays the smallest copper particle size (3.3 nm), shows the highest S
BET value (113 m
2 g
−1) and pore volume (0.223 cm
3 g
−1). Therefore, textural characteristics seem to depend on the copper particle size in catalysts.
The pore size distribution profiles, as determined from DFT calculation (
Figure 9B) [
45], show the existence of microporosity associated with the clay mineral structure. The periodic inversion of tetrahedral positions in sepiolite generates cavities with dimensions of 0.37 nm × 1.06 nm has been reported [
46]. These dimensions are appropriate to favor the diffusion of FUR molecules through the channels; however, metal Cu
0 particles are bigger than these cavities, so it is expected that the FUR hydrogenation takes place on the surface of the sepiolite. On the other hand, the presence of high macroporosity for 1CuCeO
2Sep is also noteworthy, which may be ascribed to voids between adjacent fibers, metal oxide species, and Cu
0 particles, being higher when the particle size is smaller, as was previously indicated.
FUR hydrogenation takes place following the sequence: FUR → FOL → MF. The first reaction (FUR → FOL) requires hydrogenating sites, while the second one (FOL → MF) is a hydrogenolysis process, which requires acid sites. Considering this premise, the quantification of acid sites is an important parameter to explain the selectivity pattern. The NH
3-TPD analysis of the natural sepiolite does not show any acidity. It is well known that the substitution of Si
4+ by Al
3+ in tetrahedral positions of silicates creates acid sites in the resulting aluminosilicate; however, the sepiolite hardly presents Al
3+ species, since it is a trioctahedral clay mineral, i.e., it possesses a high proportion of Mg
2+ [
41]. This fact implies that the support must exhibit a negligible acidity. The incorporation of metal copper species does not provide any acidity to the catalytic system. When MgO or CeO
2 were incorporated, similar acidity values were obtained, with 62 μmol g
−1 for 1CuMgOSep and 44 μmol g
−1 for 1CuCeO
2Sep catalyst (
Table 5). In the case of the 1CuZnOSep, the acidity is slightly higher 89 μmol g
−1. The obtained data seem to be in agreement with the catalytic activity, since the catalyst with the highest acidity (1CuZnOSep) is also the most selective towards MF. In this way, previous researches have established that the use of low-acidity supports, such as SiO
2, together with small Cu particles favors the hydrogenolysis reaction to MF [
25,
40,
47]. In this sense, Scotti et al. pointed out that the presence of very small Cu0 particles, as takes place in the present work, gives rise to catalytically relevant Lewis acidity [
47]. However, the support acidity must be modulated, since supports with a high acidity can cause the polymerization of FUR in the vapor phase.
The titration of reduced catalysts with N
2O allows the determination of Cu
0-dispersion (%D), the metallic surface (S
Cu0), as well as the diameter of Cu
0 particles (d
Cu0) (
Table 5). 1CuZnOSep and 1CuCeO
2Sep catalysts display a copper dispersion of 10%, while 1CuMgOSep presents a lower dispersion (7%). With regard to the metallic surface area, 1CuCeO
2Sep exhibits the lowest value, probably due to having the highest molecular weight of the cerium in comparison to magnesium or zinc. Finally, the estimation of the diameter for the Cu
0 crystals reveals that all catalysts display similar values, between 7.2–9.8 nm. These are not exactly the same as those obtained from XRD data, although they are within the same order of magnitude.
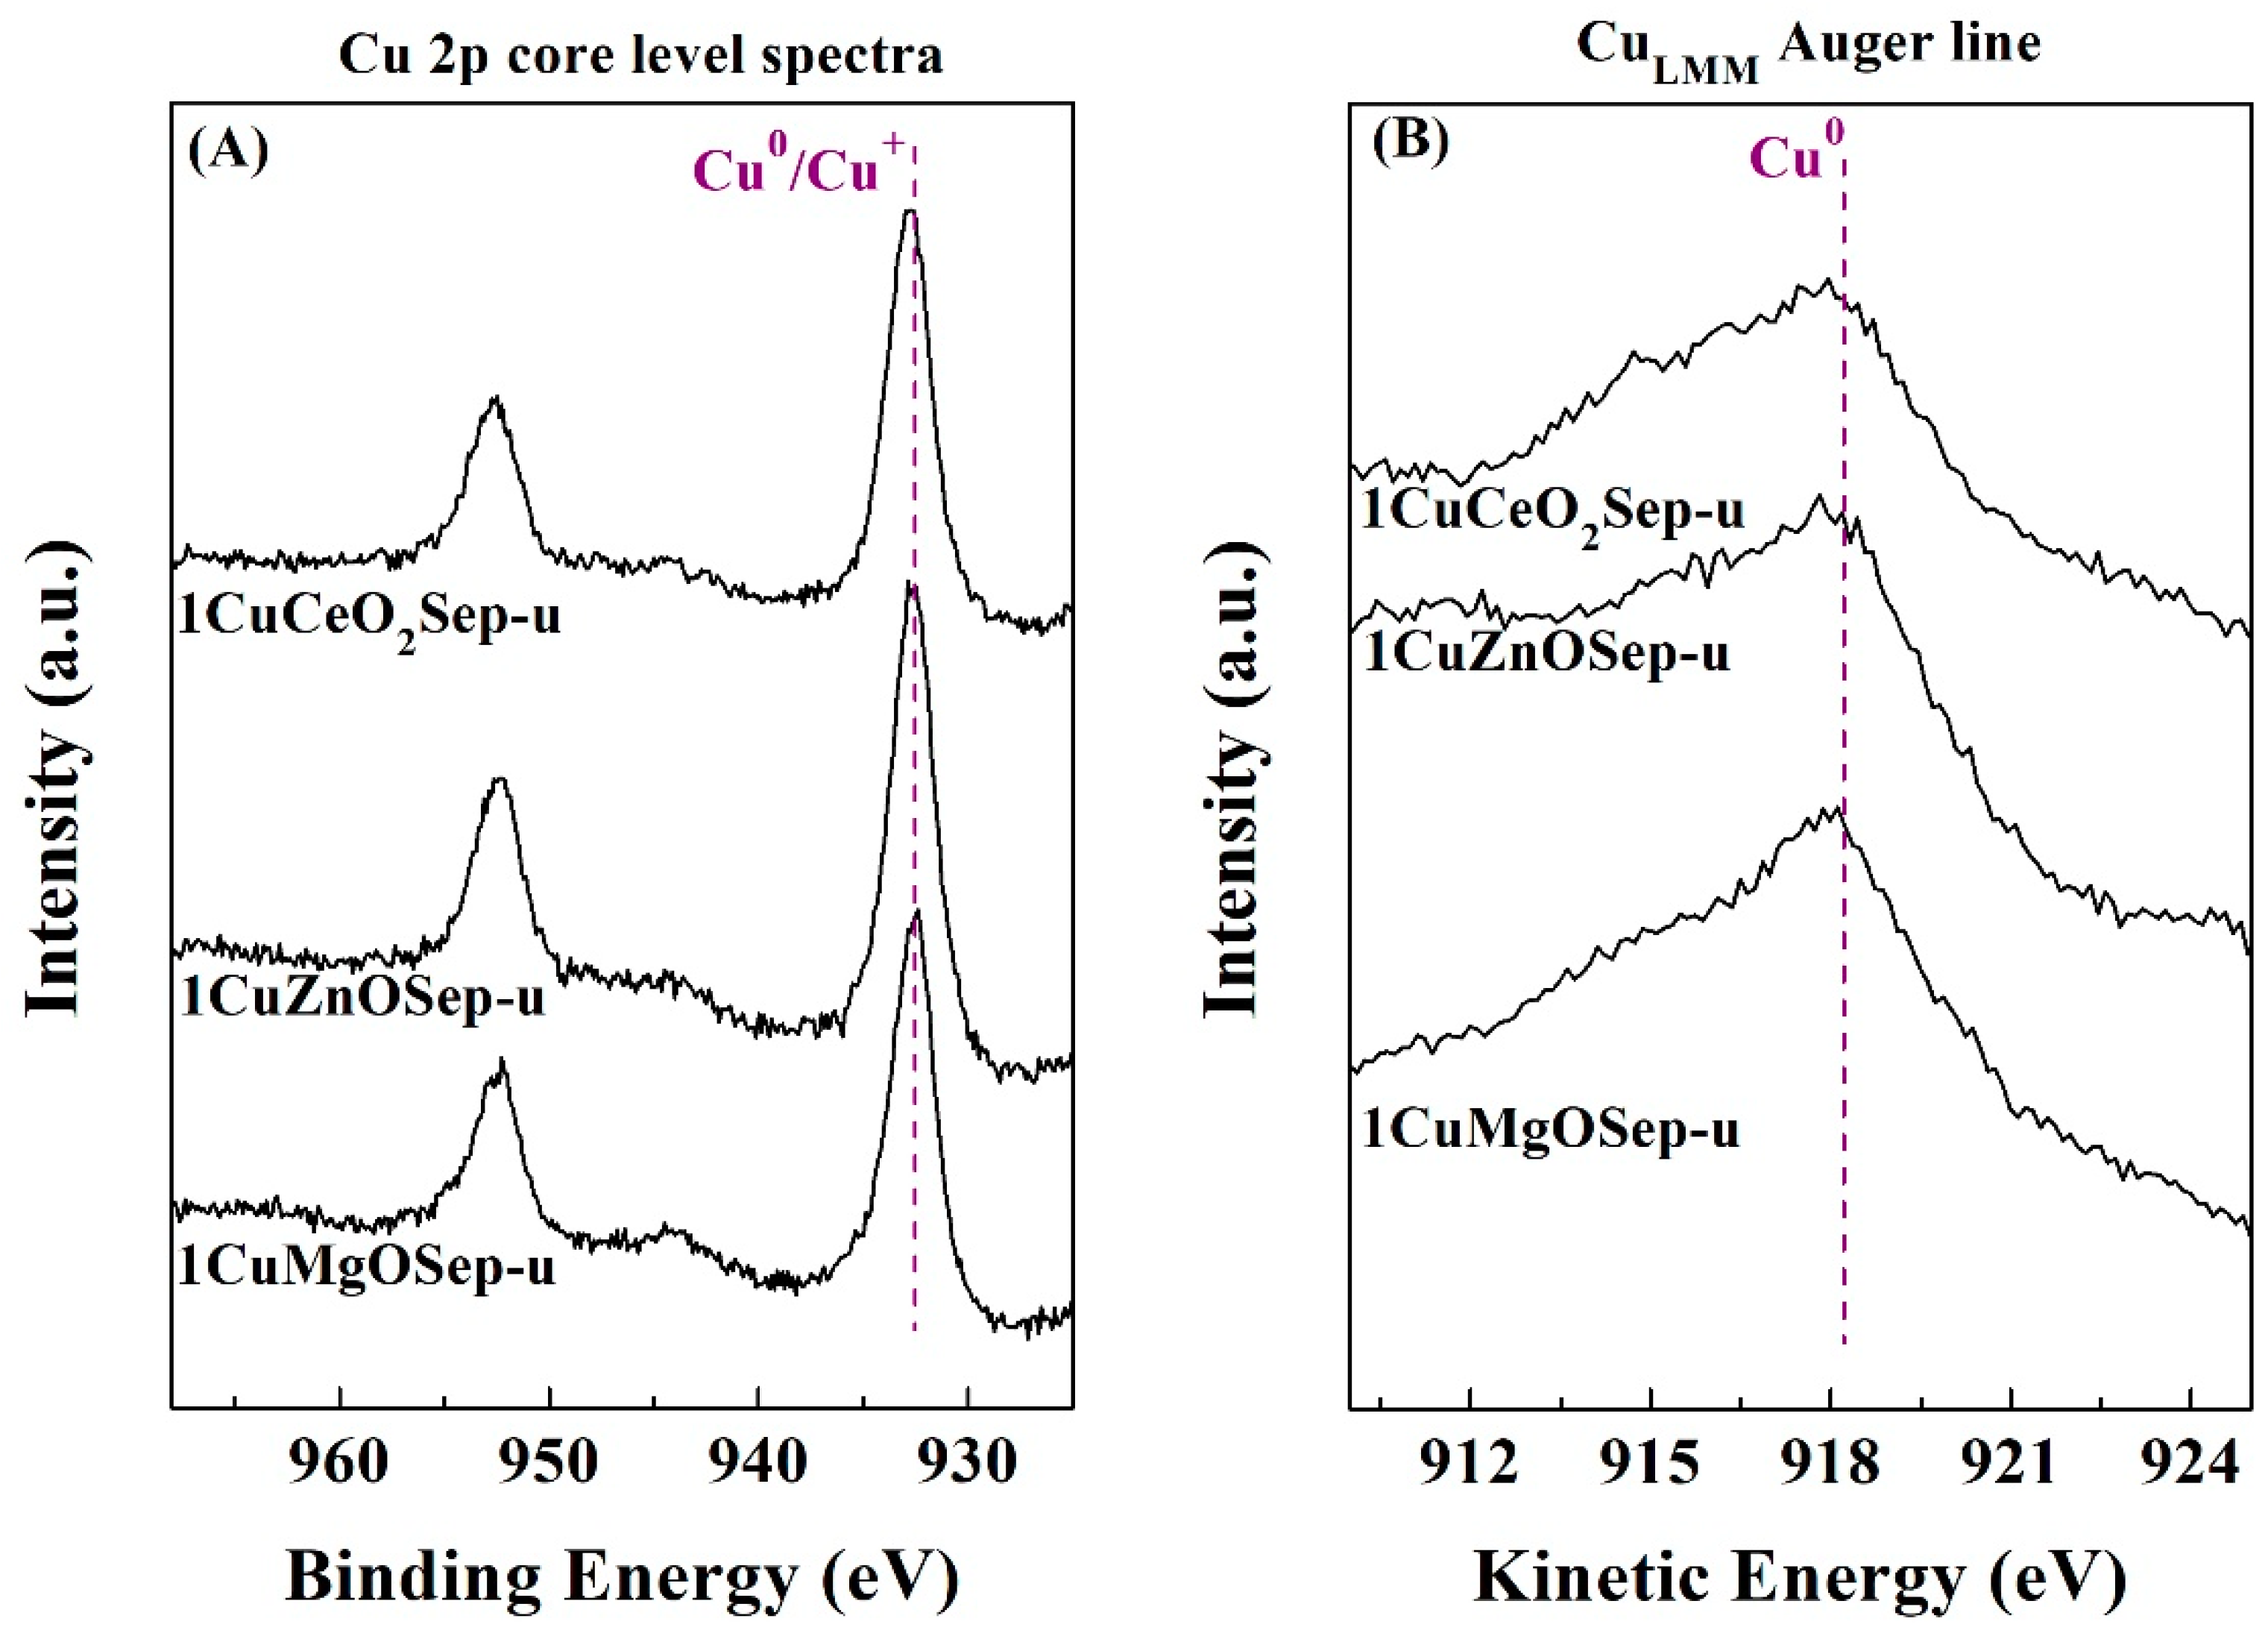
To determinate the chemical composition of the catalyst surface, XPS analysis was carried out (
Table 6). In all cases, it is observed the typical binding energies of elements present in trioctahedral phyllosilicates in the Si 2p, Al 2p, Mg 2p, and O 1s core level spectra [
48]. In the Cu 2p region, a contribution of about 932.4–932.1 eV is noteworthy, which is attributed to reduced Cu species. The presence of Cu
2+ species must be discarded since in no case is a broad band observed, about 934.0–935.0 eV, which is ascribed to the shake-up satellite, typical of bivalent species. To distinguish between Cu
0 and Cu
+, a Cu
LMM Auger line was also evaluated. In all cases, mostly Cu
0 species (918.0. eV) are detected, confirming the total reduction of Cu(II) species, as shown in the XRD data (
Figure 5). From the atomic concentrations reported in
Table 2, it can be inferred that the 1CuZnOSep catalyst presents the highest concentration of surface Cu species. These data are in agreement with those obtained from the N
2O titration, where this catalyst showed the highest metallic surface (
Table 5). The Cu-based catalysts with oxide species and supported on sepiolite were recovered after the reaction to elucidate the cause of deactivation. The analysis of the Cu 2p core level spectra (
Figure 10A) does not reveal any changes in the oxidation state of copper species, since Cu
0 species remain after the catalytic test (
Figure 10B), so the active phase is hardly modified along the TOS. Considering the atomic concentration of the used catalysts (
Table 6), the high carbon content on the catalyst surface is striking, mainly for 1CuZnOSep. This fact can be attributed to two possible factors. On one hand, the 1CuZnOSep catalyst presents the highest Cu surface area, so this catalyst also displays the highest proportion of available Cu sites to interact with FUR molecules and generate carbonaceous products. In this sense, some researchers have established that FOL and FUR molecules interact strongly with metal copper sites [
36]. On the other hand, 1CuZnOSep displays the highest amount of acid sites, which are necessary for the hydrogenolysis reaction [
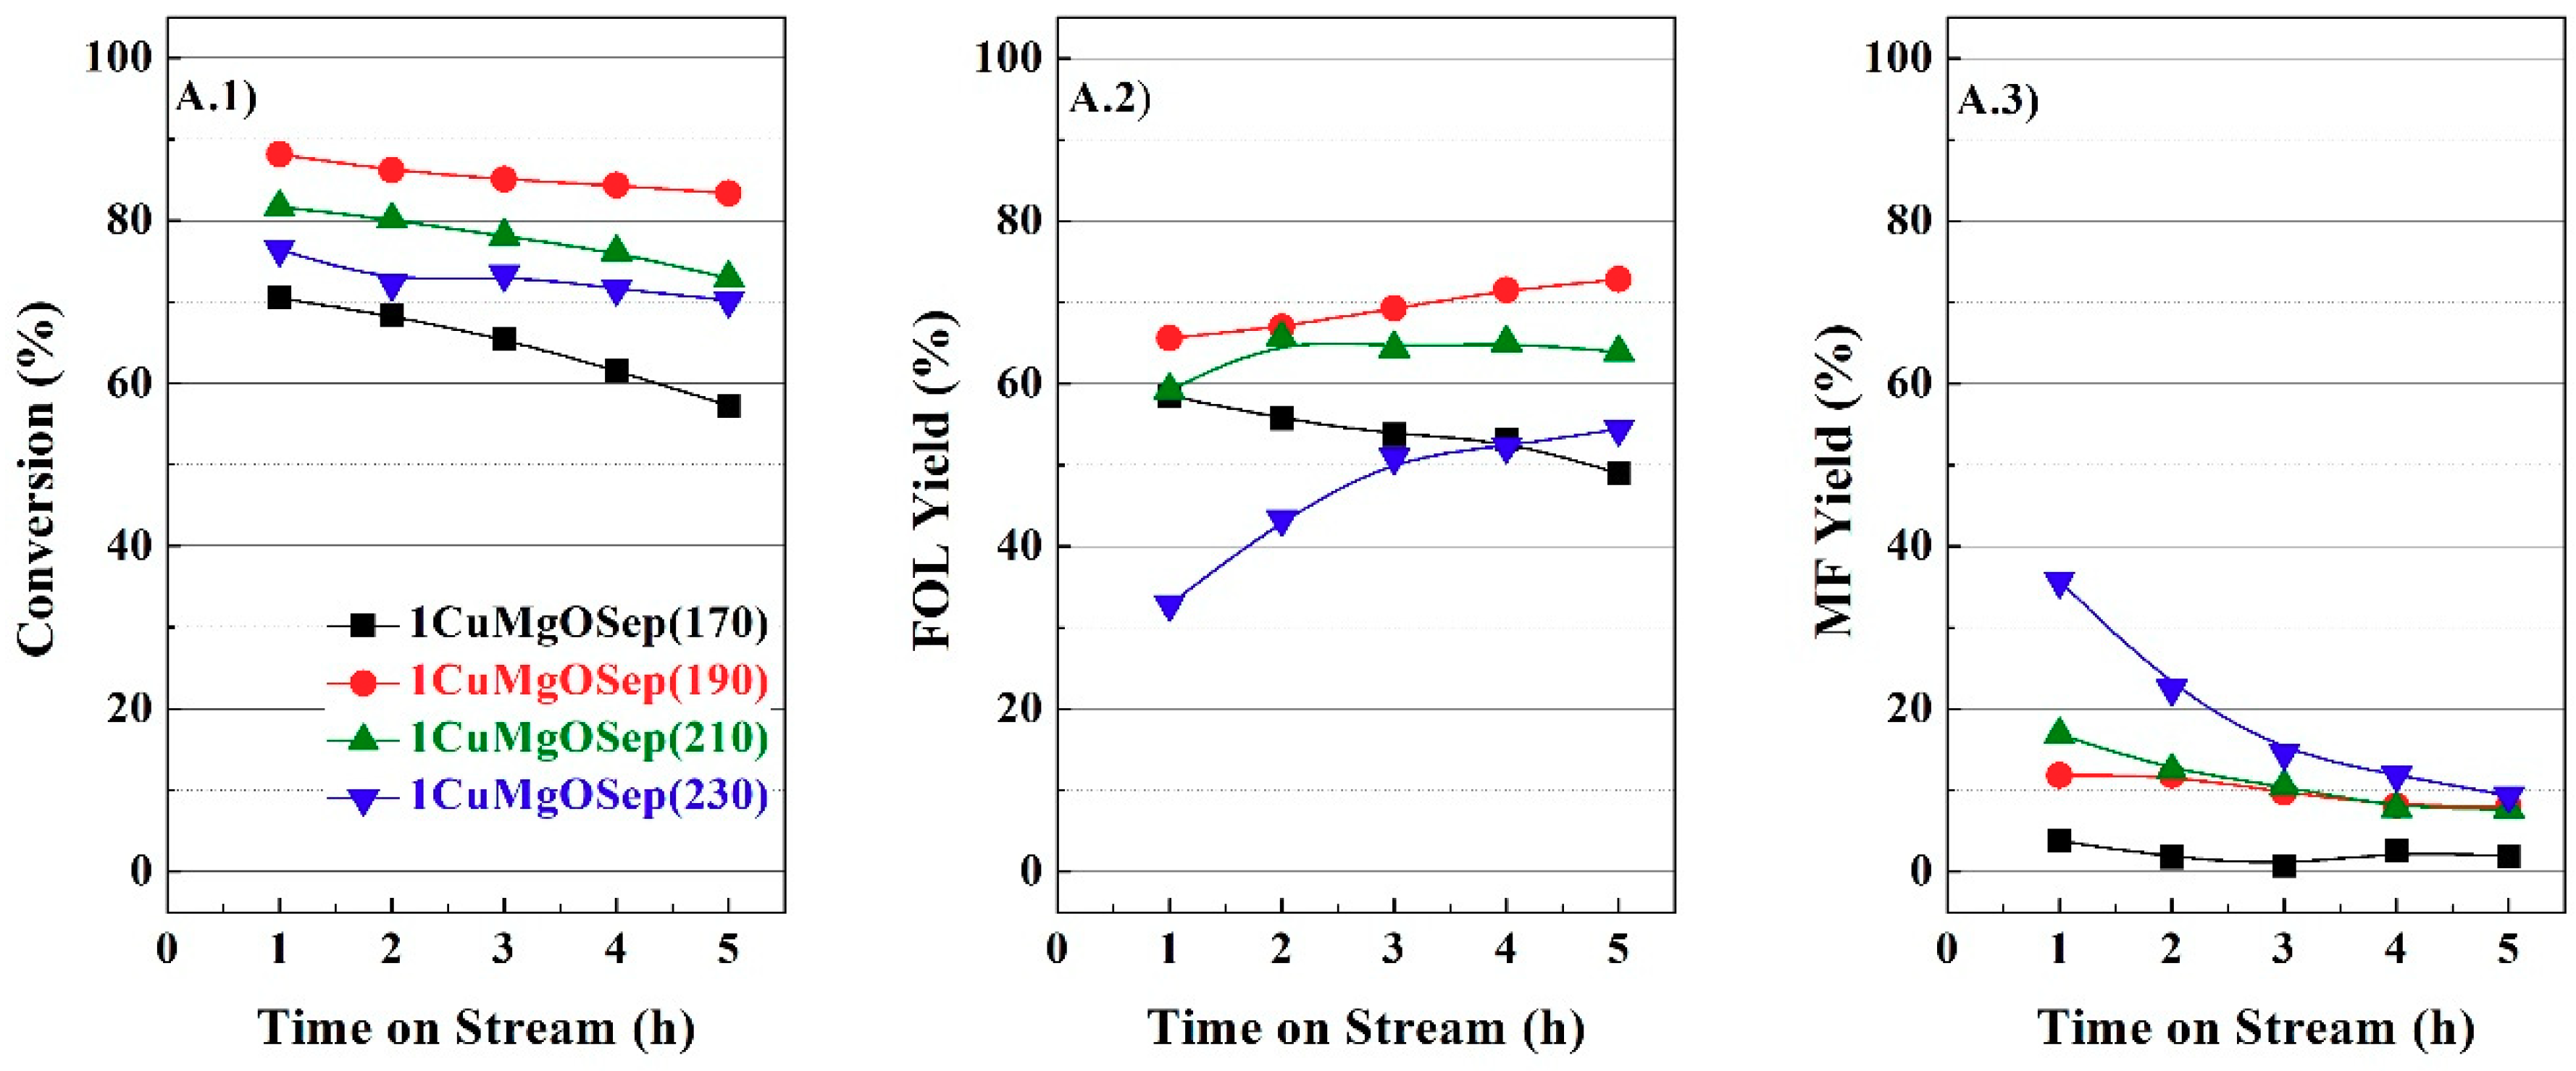
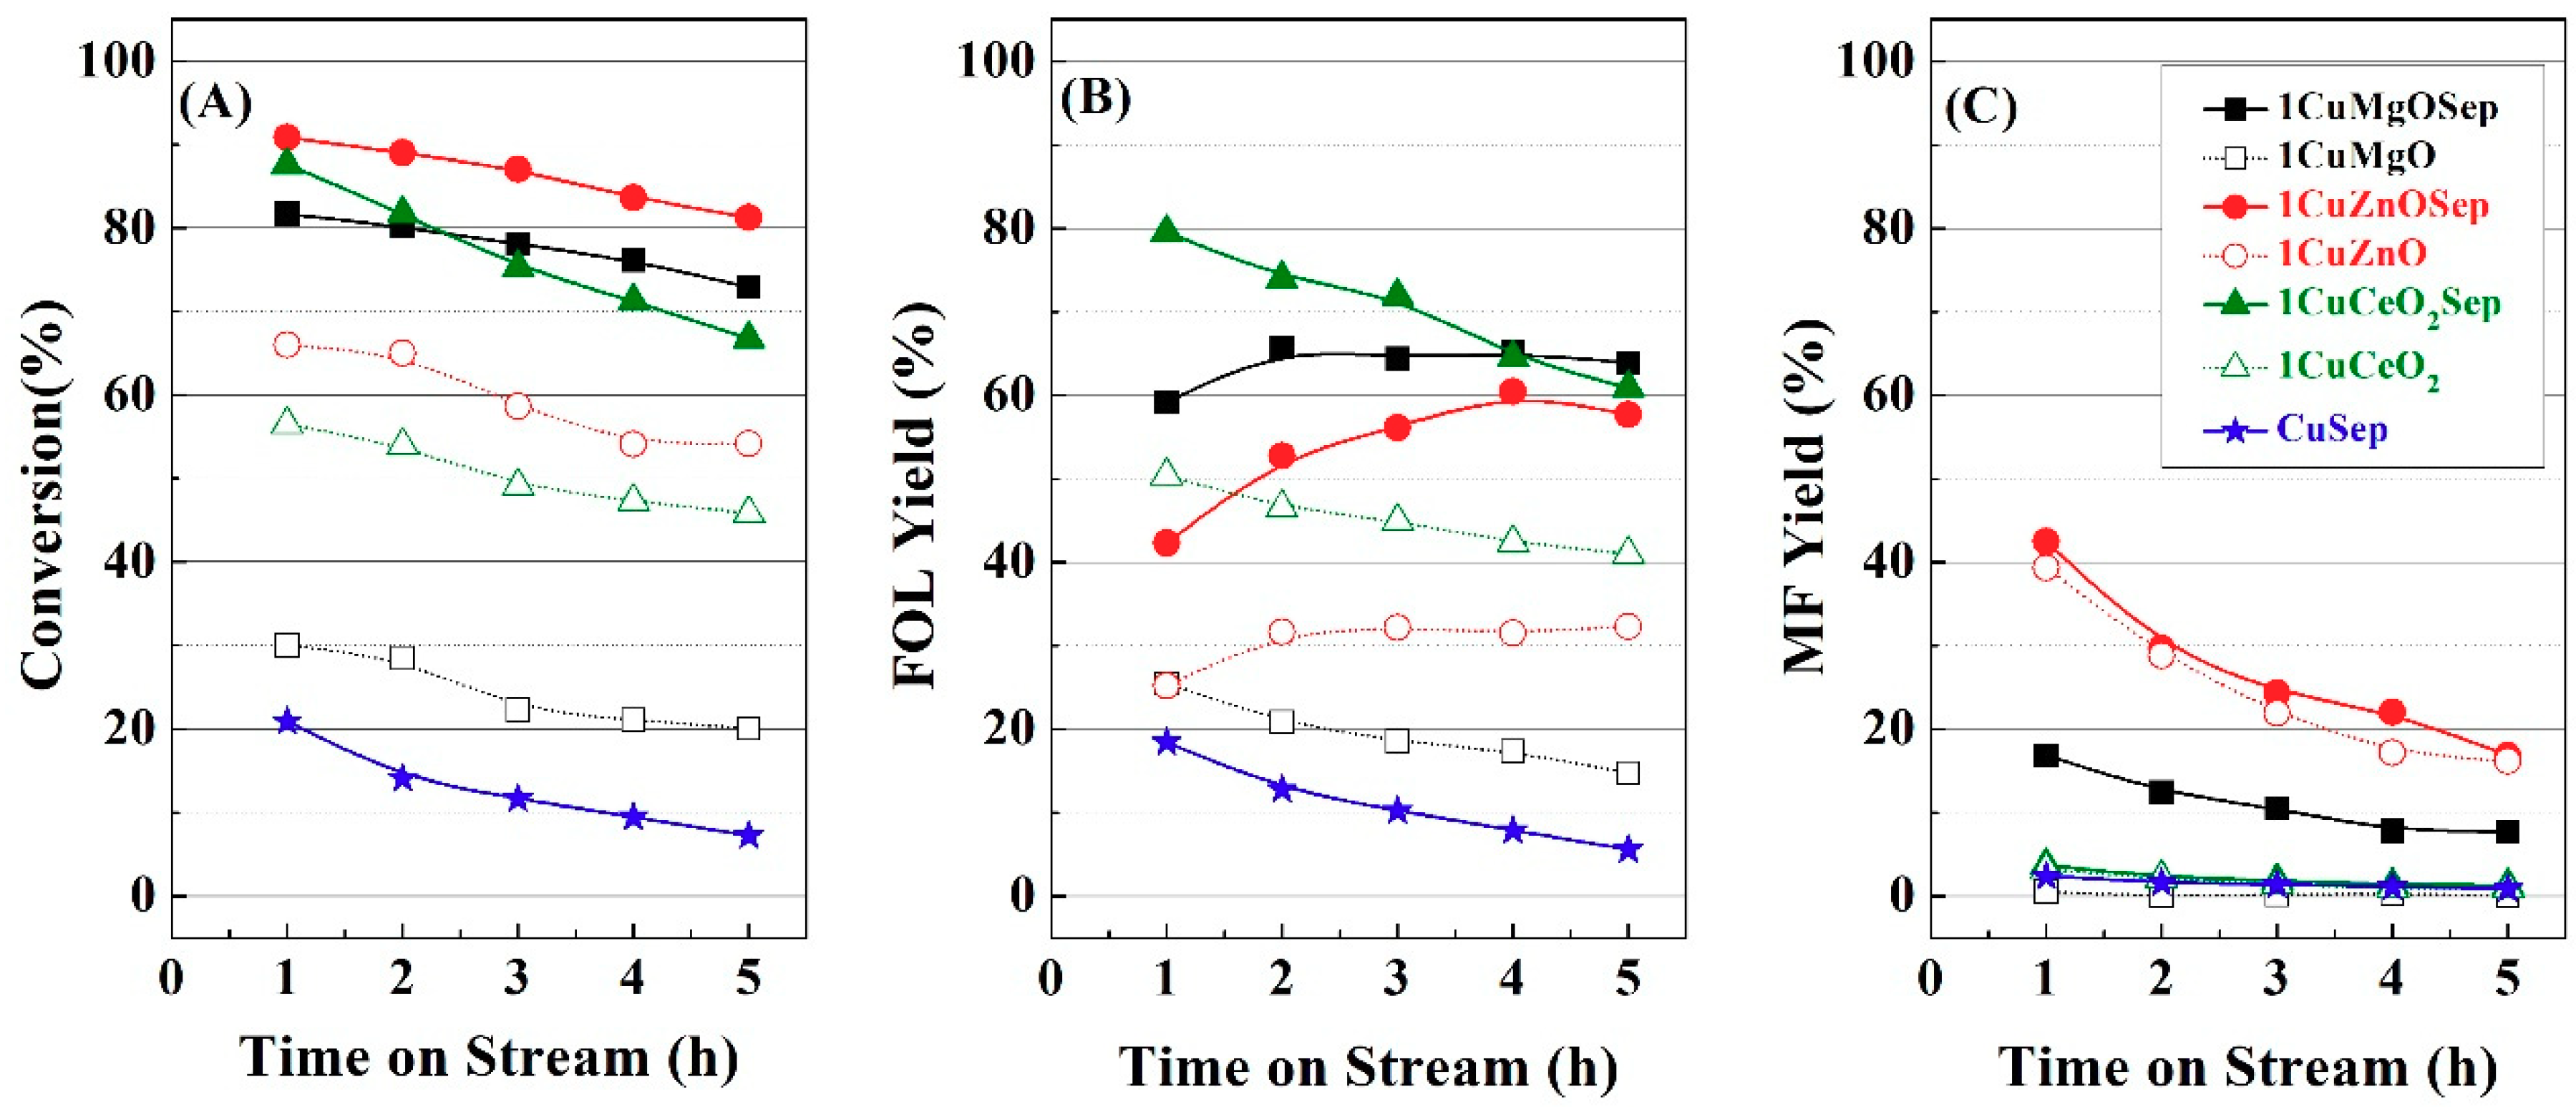
25]. This reaction causes the cleavage of the C–O bond, and it can also generate a higher proportion of carbonaceous deposits. Focusing on the Cu content after the reaction, it is noteworthy that the amount of surface copper species follows the trend 1CuZnOSep > 1CuMgOSep > 1CuCeO
2Sep. These data follow the same trend to that shown in
Figure 1 from 3 h of TOS. From these data, it can be inferred that the catalytic activity is related to the electronic density after the first hours of TOS; however, the amount of available Cu species plays a more important role for longer reaction times.
4. Materials and Methods
4.1. Materials
The clay mineral chosen to be used as support was a Mg-rich fibrous phyllosilicate as sepiolite, which was collected from Vicálvaro-Vallecas deposits (Spain), being commercialized by Tolsa S.A. as Pangel® S9. This product contains a purity greater than 95% with a small proportion of another Mg-rich smectites as stevensite. Sepiolite is a fibrous material, which contains ribbons with 2:1 type layer structure, where each ribbon is linked to the next inverted SiO4 tetrahedral sheet by Si–O bonds, leading to a fibrous framework with microcavities.
The copper precursor was copper nitrate trihydrate, Cu(NO3)2·3H2O (99%, Sigma-Aldrich, St. Louis, MO, USA). The oxide species were incorporated from their respective nitrates, i.e., zinc nitrate tetrahydrate, Zn(NO3)2 4H2O (99%, Merck, Darmstadt, Germany), magnesium nitrate hexahydrate, Mg(NO3)2 6H2O (99.9%, Aldrich, St. Louis, MO, USA) and cerium nitrate trihydrate, Ce(NO3)4 3H2O (99%, Aldrich, St. Louis, MO, USA). These salts were dissolved using several solvents as H2O Milli-Q® (Merck, Darmstadt, Germany), ethanol, CH3CH2OH (95% vol., Prolabo, Radnor, PA, USA), ethylene glycol, C2H6O2, (99%, Sigma-Aldrich, St. Louis, MO, USA), while sodium carbonate, Na2CO3 (99%, Sigma-Aldrich, St. Louis, MO, USA) was employed as precipitating agent.
Other chemicals employed in the catalytic study were: furfural (99%, Sigma-Aldrich, St. Louis, MO, USA), cyclopentyl methyl ether (CPME) (99.9%, Sigma-Aldrich, St. Louis, MO, USA) as solvent, and o-xylene (99.9%, Sigma-Aldrich, St. Louis, MO, USA) as internal standard, while the gases used were He (99.99%, Air Liquide, Paris, France), H2 (99.999%, Air Liquide, Paris, France), N2 (99.9999%, Air Liquide, Paris, France), H2/Ar (99.99%, 10 vol.% in H2, Air Liquide, Paris, France), and N2O/He (99.99%, 5 vol.% in N2O, Air Liquide, Paris, France).
4.2. Catalysts Preparation
Cu-based catalysts were synthesized by a precipitation–deposition method. In the case of the Cu-based catalyst supported on sepiolite, 1 g of sepiolite was dispersed in 75 mL of distilled water for 30 min, under stirring. Later, it was added a solution formed by 10 mL H2O, 20 mL ethyleneglycol, 50 mL ethanol and the appropriate proportion of Cu(NO3)2·3H2O to achieve a Cu content of 15 wt.%, a metallic loading with which a suitable catalytic performance was attained in previous studies. The suspension was heated at 80 °C and then, Cu species were precipitated by adding an aqueous solution of Na2CO3 (0.5 M) until reaching a pH of 11. After precipitation, the suspension was cooled at room temperature and aged for 24 h. Finally, the solid was filtered and dried at 90 °C for 12 h, and subsequently calcined at 400 °C for 2 h. The obtained catalyst was denoted as (CuSep).
For the catalysts where ZnO, MgO, or CeO
2 were also incorporated into the catalytic system, the corresponding nitrates were added to the sepiolite dispersion at the same time as copper nitrate. The synthetic procedure was similar to that previously described for CuSep. Three different Cu/M molar ratios were employed in the initial solution (x = 0.4, 1, and 2.5) for each basic or amphoteric oxide (M = Mg, Zn, and Ce), and samples were labeled as xCuMgOSep, xCuZnOSep, and xCuCeO
2Sep, while the Cu content (in wt.%) are compiled in
Table 7. These catalysts were compared with the corresponding copper catalysts supported on these metal oxides (MgO, ZnO, and CeO
2) (Cu/M molar ratio of 1) without sepiolite, studied in previous research [
22,
31,
34].
The obtained samples were labeled as 1CuMgO, 1CuZnO, and 1CuCeO2. In all cases, the obtained precursors were reduced under H2-flow (60 mL min−1) from rt to 300 °C, maintaining this temperature during 1 h, according to their respective H2-TPR profile.
4.3. Catalysts’ Characterization
The H2-TPR study was performed by using 0.08 g of catalyst precursor, which was previously treated at 100 °C during 45 min using a He-flow (35 mL min−1). After the precursor was cooled at 50 °C, the H2 consumption associated to reduction processes was registered in situ from 50 to 500 °C in an Ar/H2-flow (10 vol.% of H2), using a flow of 48 mL min−1 and a ramp of 10 °C min−1. The H2O generated along the reduction step was retained in a cold finger immersed in a i-propyl alcohol/liquid N2 bath at about −80 °C. The H2-consumption was registered on-line with a thermal conductivity detector (TCD).
X-ray diffraction patterns were registered in a diffractometer (PANanalytical X’Pert Pro, Royston, UK). The powder samples were obtained in a Bragg-Brentano reflection configuration, using a Ge (111) monochromator, with a Cu Kα
1 radiation, and an X’Celerator detector (step size of 2θ: 0.017°). The size of the crystallites (D) was estimated from the Williamson–Hall equation, B cos (θ) = (Kλ/D) + (2 ε sin(θ)), where θ is the Bragg angle, B is the full width at half-maximum (FWHM) of the XRD peak, K is the Scherrer constant, λ is the X-ray wavelength, and ε is the lattice strain [
43].
The morphology of the catalysts was determined by Transmission Electron Microscopy (TEM). The micrographs were performed using FEI Talos F200X equipment (Thermo Fisher Scientific, Waltham, MA, USA). This TEM equipment combines outstanding high-resolution TEM and S/TEM imaging with industry-leading energy dispersive X-ray spectroscopy (EDS) signal detection. The catalysts were suspended in 2-propanol and dropped onto a perforated carbon film grid.
The textural parameters of the samples were assessed from their N
2 adsorption-desorption isotherms at −196 °C using Micromeritics equipment (ASAP 2020, Norcross, GA, U.S.A). In a preliminary step, the samples were outgassed under vacuum (10
−4 mbar) using a temperature of 200 °C during 12 h. The specific surface area was calculated from the BET equation, considering that the cross-section of the N
2 molecule is 16.2 Å
2 [
49]. The pore volume was determined from the adsorption branch at P/P
0 = 0.996, while the pore width was estimated by the Density Functional Theory (DFT) method [
45].
The quantification of the acid sites was performed by ammonia thermoprogrammed desorption (NH3-TPD). In each analysis, 0.08 g of catalyst was treated under a He-flow (40 mL min−1) from rt to 550 °C, using a heating ramp of 10 °C min−1, and then was cooled to the reduction temperature. Later, the sample was treated with a H2-flow of 60 mL min−1 for 1 h and cooled under a He-flow (40 mL min−1) until 100 °C. After that, the catalyst was saturated with NH3-flow for 5 min at this temperature. In the next step, a He-flow (40 mL min−1) was passed to remove the NH3-physisorbed. Finally, thermoprogrammed desorption was carried out by heating the samples from 100 to 550 °C, using a ramp of 10 °C min−1. The NH3-desorbed was quantified by a thermal conductivity detector (TCD).
The metallic surface and the dispersion of Cu
0 species were determined by N
2O titration following the procedure described in previous research [
31,
34]. This methodology is based on the superficial oxidation of the Cu
0 under a N
2O-flow, according to the reaction:
Prior the analysis, the catalytic precursor was reduced under a 10 vol.% H2/Ar-flow (48 mL min−1) at 300 °C for 1 h, with a heating rate of 5 °C min−1. Later, catalysts (reduced samples) were cooled until 60 °C under a He flow. The Cu0-oxidation to Cu+ was performed by titration with N2O (5 vol.% N2O/He), at 60 °C for 1 h. Then, the sample was cleaned under an Ar-flow and cooled to room temperature. Finally, the Cu2O-reduction to Cu0 was carried out by heating from room temperature to 300 °C with a heating rate of 5 °C min−1, being monitored its H2-consumption by TCD.
The dispersion was determined from the H
2-TPR profiles as follows:
The metallic surface area was determined according to the methodology proposed by Pakharukova et al., by using the following equation [
50]:
where M
H2 is the amount of H
2 consumed per mass unit (μmol g
−1), SF is a stoichiometric factor (2), N
A is the Avogadro number, C
M is the number of copper atoms per surface area unit (1.46 × 10
19 atoms m
−2), and W
Cu is the Cu content (wt.%).
Considering a spherical morphology of the Cu
0 particles, the average size (nm) of the metallic particles was determined from:
where
is the density of copper (8.92 g cm
−3).
The chemical composition of samples on its surface was determined by X-ray photoelectron spectroscopy (XPS), using a spectrometer (Physical Electronics PHI 5700) with nonmonochromatic Mg Kα radiation (1253.6 eV, 300 W, 15 kV), and multichannel detector. Each spectrum was registered in the constant-pass energy mode at 29.35 eV with a diameter analysis area of 0.72 μm. The binding energy shift was corrected using the adventitious carbon (C 1s at binding energy = 284.8 eV) as reference. The acquisition and data analysis were performed using a software package (PHI ACCESS ESCA-V6.0F). In all cases, the signals were subtracted using a Shirley-type background and fitted with Gaussian–Lorentzian curves to determine more accurately the binding energies of the different element core levels. To avoid the oxidation of the catalysts, the samples were reduced ex-situ and then they were stored in sealed vials, to avoid its oxidation, with an inert solvent (cyclohexane). Samples were transferred to the XPS equipment in a dry box under a N2-flow. Then, the solvent was removed by evaporation in a pre-chamber and the samples were introduced directly without previous treatment in the analytical chamber.
4.4. Catalytic Tests
The hydrogenation of FUR in the vapor phase was performed in a fixed-bed in a quartz tubular reactor with an internal diameter of a quarter of an inch (1/4’’) The pelletized sample (0.325–0.400 mm) was placed in the middle of the glass reactor between two layers of quartz wool. The temperature was controlled with a thermocouple, which is located at the same height of the catalytic bed. Prior of each test, the precursor was reduced in-situ using a H2-flow of 60 mL min−1 at 300 °C for 1 h. Then, the catalyst was cooled until the selected reaction temperature was reached using the same H2 flow (60 mL min−1). The catalytic tests were performed using a flow (3.87 mL h−1) of a FUR solution dissolved in CPME (5 vol.%) to reach a WHSV of 1.5 h−1. This fed was pumped using a Gilson 307SC piston pump (model 10SC).
The reaction products were collected on an ice-finger. An aliquot of 1 mL was mixed with o-xylene, as internal standard and chloroform, to minimize problems associated to the solvent expansion in the injector of the GC. Then, this mixture was sealed in vials, being analyzed and quantified by gas chromatography, using a Shimadzu (GC-14A) apparatus, which is equipped with a flame ionization detector (FID) and a capillary column (CP-Wax 52CB). The furfural conversion and selectivity were calculated and defined as follows:


 ,
, 


