Review

Review on the Macro-Transport Processes Theory for Irregular Pores able to Perform Catalytic Reactions

by
Iván Santamaría-Holek
1,*,†,
Saúl I. Hernández
1,†,
Consuelo García-Alcántara
1,† and
Aldo Ledesma-Durán
2,*,†
1
Unidad Multidiscliplinaria de Docencia e Investigación-Juriquilla, Facultad de Ciencias, Universidad Nacional Autónoma de México, Juriquilla, Querétaro CP 76230, Mexico
2
Centro de Física Aplicada y Tecnología Avanzada CFATA, Universidad Nacional Autónoma de México (UNAM), Juriquilla, Querétaro CP 76230, Mexico
*
Authors to whom correspondence should be addressed.
These authors contributed equally to this work.
Catalysts 2019, 9(3), 281; https://doi.org/10.3390/catal9030281
Submission received: 22 February 2019 / Revised: 13 March 2019 / Accepted: 15 March 2019 / Published: 19 March 2019

Abstract

:
We review and generalize a recent theoretical framework that provides a sound physicochemical basis to describe how volume and surface diffusion are affected by adsorption and desorption processes, as well as by catalytic conversion within the space defined by the irregular geometry of the pores in a material. The theory is based on two single-dimensional mass conservation equations for irregular domains deduced for the volumetric (bulk) and surface mass concentrations. It offers a powerful tool for analyzing and modeling mass transport across porous media like zeolites or artificially build materials, since it establishes how the microscopic quantities that refer to the internal details of the geometry, the flow and the interactions within the irregular pore can be translated into macroscopic variables that are currently measured in experiments. The use of the theory in mass uptake experiments is explained in terms of breakthrough curves and effective mass diffusion coefficients which are explicitly related to the internal geometry of the pores.

Graphical Abstract

1. Introduction

The Shaphiro–Brenners’s theory for macrotransport processes was an outstanding contribution to the understanding of macrotransport processes in applied chemistry. The theory offered simplified equations with effective transport coefficients suitable to reduce the time and computational necessities for predicting the optimal conditions of different experimental or technological situations. The theory was inspired on the classical Taylor–Aris dispersion problem, in which the three-dimensional diffusion of a particle in the presence of a flow in a pipe is reduced to a single dimensional problem along the longitudinal coordinate of the pipe [1,2]. The main consequence of this contraction or projection of the mathematical description implies that the microscopic structure of the system is incorporated in the value or possible dependence of the corresponding transport coefficients, like the diffusivity, on the essential parameters of the problem. That is, after the microscopic structure is suitably abstracted, the local “microscopic” transport coefficients become “macrotransport” coefficients. In this way, the theory emphasizes the fact that the macroscopic character of well known three-dimensional transport equations, for instance, the diffusion equation with its boundary conditions, implies an inherently complex and heterogeneous system that cannot be ignored. The enormous merit of the theory is that it offers a rigorous mathematical formulation for doing this contraction of the description along with the incorporation of chemical aspects related with chemical kinetics [3].
The Shaphiro–Brenners’s macrotransport processes theory focuses on the effect of flow in regular domains, as the Taylor–Aris problem set. Nonetheless, in real life regular geometries are scarce. Most practical situations involving mass or charge transport across membranes or porous media involve irregular domains and, therefore, require a more general treatment than the one offered by the original macrotransport processes theory. For instance, the mass transport inside confined geometries addressed interesting problems that should be studied in order to improve our understanding of several processes occurring on Biology, Chemistry and many industrial applications ranging from metallurgy to food processing [4,5,6]. Some of the most important examples of this type of transport occurs in biological membranes, zeolites, carbon nanotubes, transformation of hydrocarbons, soil filtration, chemical reactors and artificial thin films. A few examples are mentioned in Refs. [7,8,9,10].
Most experimental techniques related with porous materials pertain to the macro-scale, defined in terms of the global characteristic length of the system like, for instance, a reaction cell [11,12,13,14]. In those techniques, the quantities of flowing reagents and products are measured at the ends of the material. These properties have to reflect several processes taking place at the micro-scale, defined in terms of the transversal characteristic length of the pores, the real length and other internal properties [15,16,17,18,19,20]. The relation between the microscopic details of the shape of the pores and the longitudinal effective mass transport across porous materials can be established accurately when the pores are long enough compared with their average width [21]. When this assumption holds, the microscopic scale description based on the three-dimensional diffusion equation can be simplified onto a coarse grained description along the main transport direction, that is, onto a one dimensional diffusion equation having effective transport coefficients [22,23,24,25].
Some of the advantages that follow from this coarse graining of the description are technical, like the reduction of computing time when solving the time evolution equations with their corresponding (non-equilibrium) boundary conditions. However, also interesting physical chemistry concepts emerge from this contraction of the description. Concepts like entropic forces as a result of entropic restrictions, or effective reaction velocity constants and their influence on the overall behavior of the system allow to have simplified interpretations of the processes involved that are consistent with the microscopic details, in similar form as other branches of physics, like in the case of statistical mechanics and thermodynamics [26,27,28,29].
The present article generalizes to three dimensionsa novel approach to this problem that was recently formulated for the case of non-regular domains in two dimensions [16,18,21,30,31]. In this alternative or generalized macrotransport process theory, the non-regularity of the geometry of the pores is explicitly taken into account when the description is contracted. It leads to contributions correcting the transport coefficients and the effective chemical rates that may be very useful in practical applications, especially when the perspective on 3D printing is emerging as a very promising membrane fabrication technique [32].
This new approach enriches the view offered by the Shaphiro–Brenners’s theory for macrotransport processes, and can lead to an improvement of the theoretical description and understanding of several processes taking place in constrained transport problems. It makes accessible the connection between the microscopic details of the geometrical and chemical structure of the pore with the result of macroscopic experiments. This will be illustrated by considering a series of examples that show the main features and richness of the theoretical description and its capacities to design technological devices able to perform, optimally, specific functions.
This work is organized as follows. In Section 2 we will present the main features of the generalized macrotransport process theory for irregular geometries and then, in Section 3 and Section 4 we will extend it to the case when adsorption–desorption kinetics takes place at the pores surface and to the case when the adsorbed phase can diffuse on the surface, respectively. The case of heterogeneous catalysis is considered in Section 5, and the effective diffusion coefficient of adsorbent and non- adsorbent membranes is studied in the Section 6. In Section 7 we discuss how our theory can be used together with experiments, in order to infer some general characteristics of pores from uptake experiments. Finally, the Summary and Conclusions are presented in Section 8.

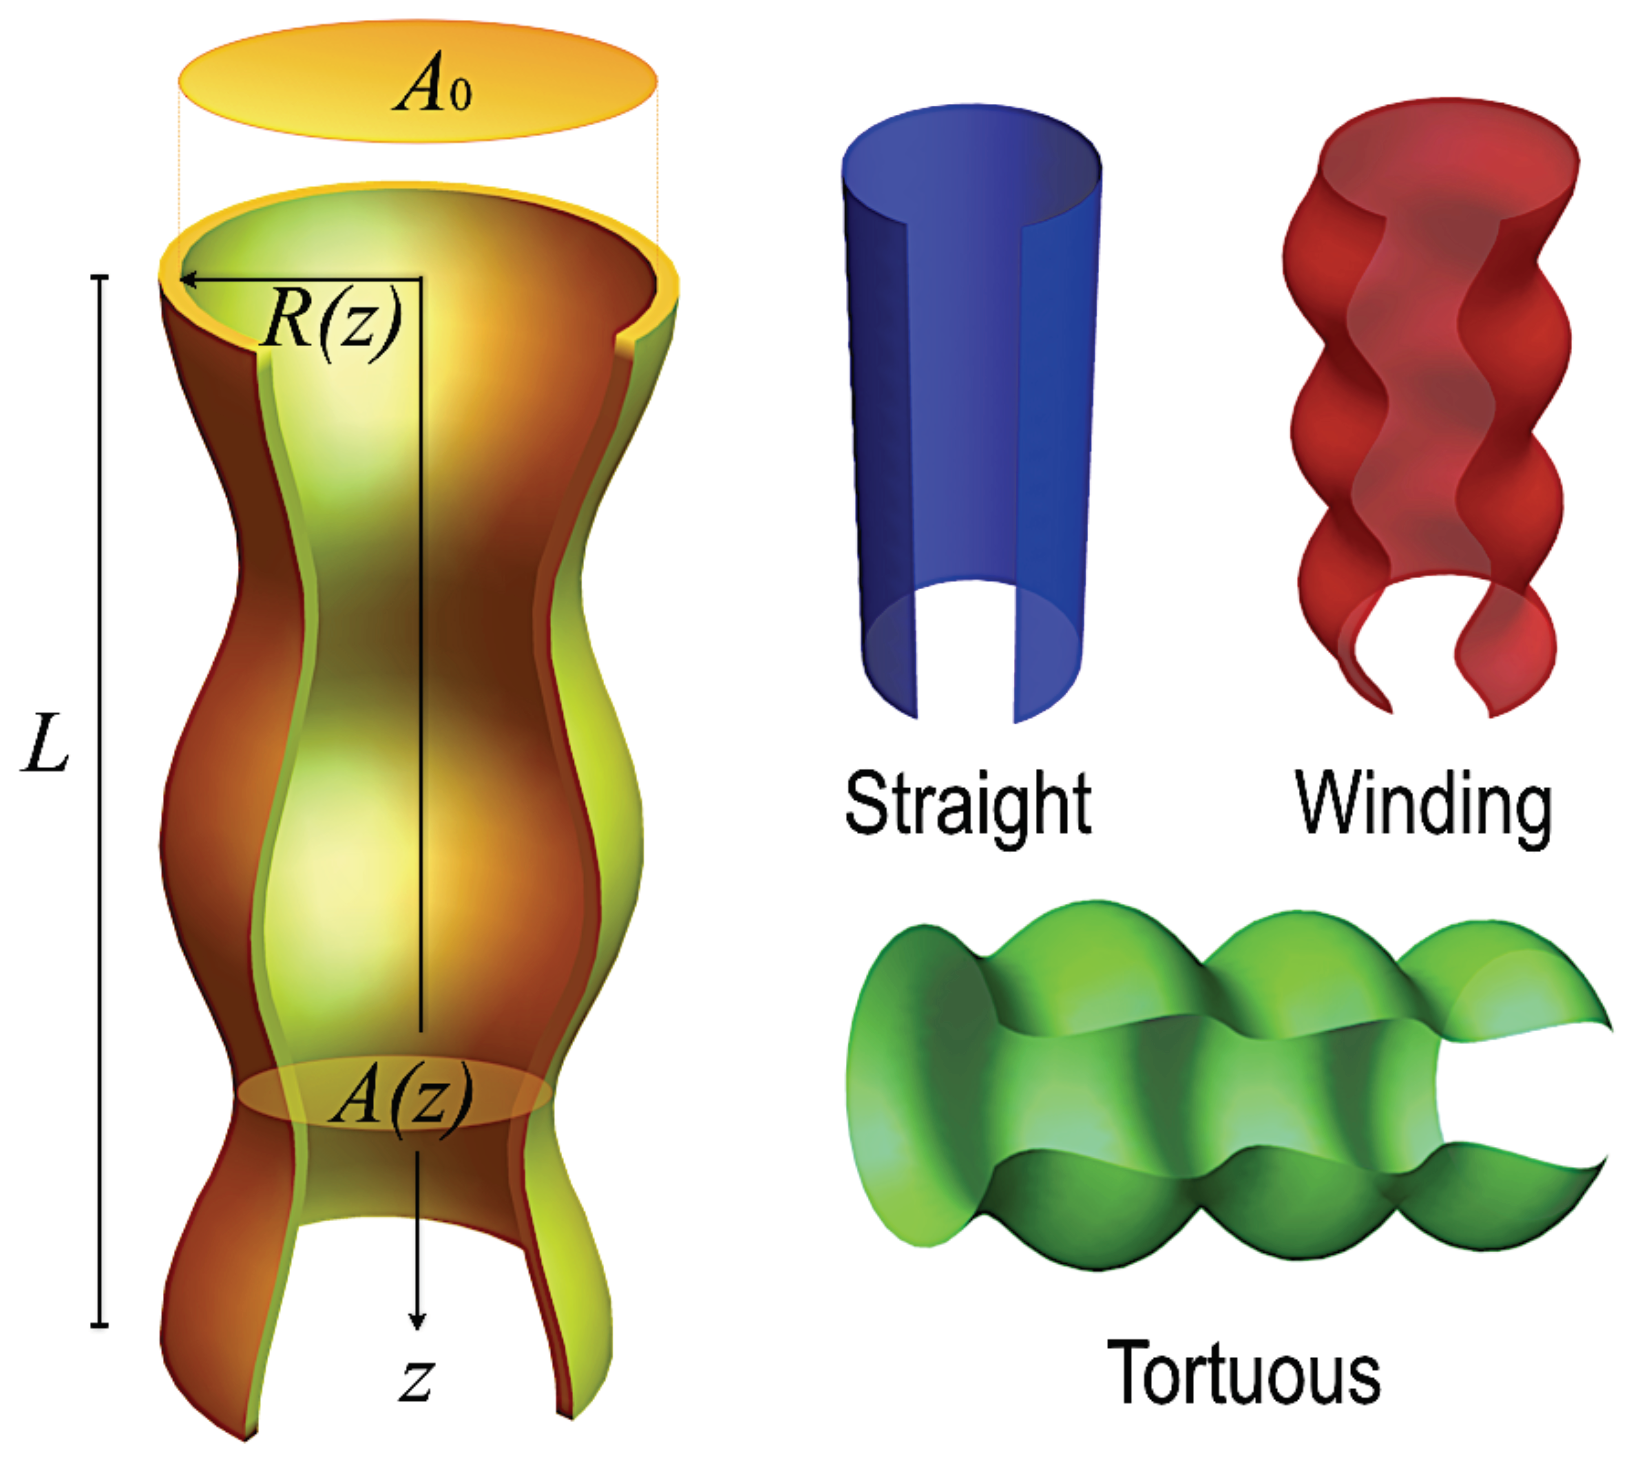
2. A Generalized Macrotransport Process Theory for Irregular Domains

Consider the transport of a gas of a pure substance across a pore like the one illustrated in Figure 1. The molecules of the gas may interact among them and with the walls of the pore and, in general, they may be adsorbed and desorbed. At the local level and with isothermal conditions the spatial and temporal evolution of the state of the gas of a pure substance can be characterized by the following general mass balance equation inside the pore [33]
C t + · j = G ( r , ϕ , z , t ) ,
where C ( r , ϕ , z , t ) represents the concentration of molecules in mol·cm−3 (or ·cm−2 in the 2D case) and G ( r , ϕ , z , t ) is the chemical production or consumption inside the bulk of the fluid, having dimensions of mol·cm−2·s−1. In addition ∇ represents the gradient operator in cylindrical coordinates.
When one considers that the molecules can be adsorbed and desorbed at the pore walls, the total diffusion current j ( r , ϕ , z , t ) , having dimensions of mol·cm−2·s−1, can be written as the sum of two contributions
j ( r , ϕ , z , t ) = j d i f f + j s u r f ,
where j d i f f is the diffusive current in the bulk and j s u r f is the surface current of material due the existence of adsorption and desorption processes implying the transport of molecules through the pore’s surface. The bulk diffusion follows the Fick law
j d i f f ( r , ϕ , z , t ) = D C ( r , ϕ , z , t ) ,
where D is the Fickean-diffusion coefficient [34]. The explicit form of the surface contribution, j s u r f ( r , ϕ , z , t ) , will depend on the particular chemical kinetics associated with the heterogeneous chemistry. However, in general this quantity should vanish in every internal point of the bulk domain
j s u r f ( r , ϕ , z , t ) = 0 r < R ( z ) ,
whereas, when evaluated at the boundaries, it takes the form
j s u r f ( r = R , ϕ , z , t ) = ρ ˙ ( z , t ) n ^ ( R , z ) , i = 1 , 2 ,
where ρ ˙ is proportional to the velocity of the corresponding heterogeneous chemical reaction, that is, the input or output of material at the pore’s surface. Here, the unit vector normal to the pore surface at position z is n ^ ( R , z ) , see Figure 1. The units of ρ ˙ are mol·cm−2·s−1. The detailed analysis on the properties of the bulk and surface contributions of the total diffusion current at the boundaries, is provided in Ref. [21].

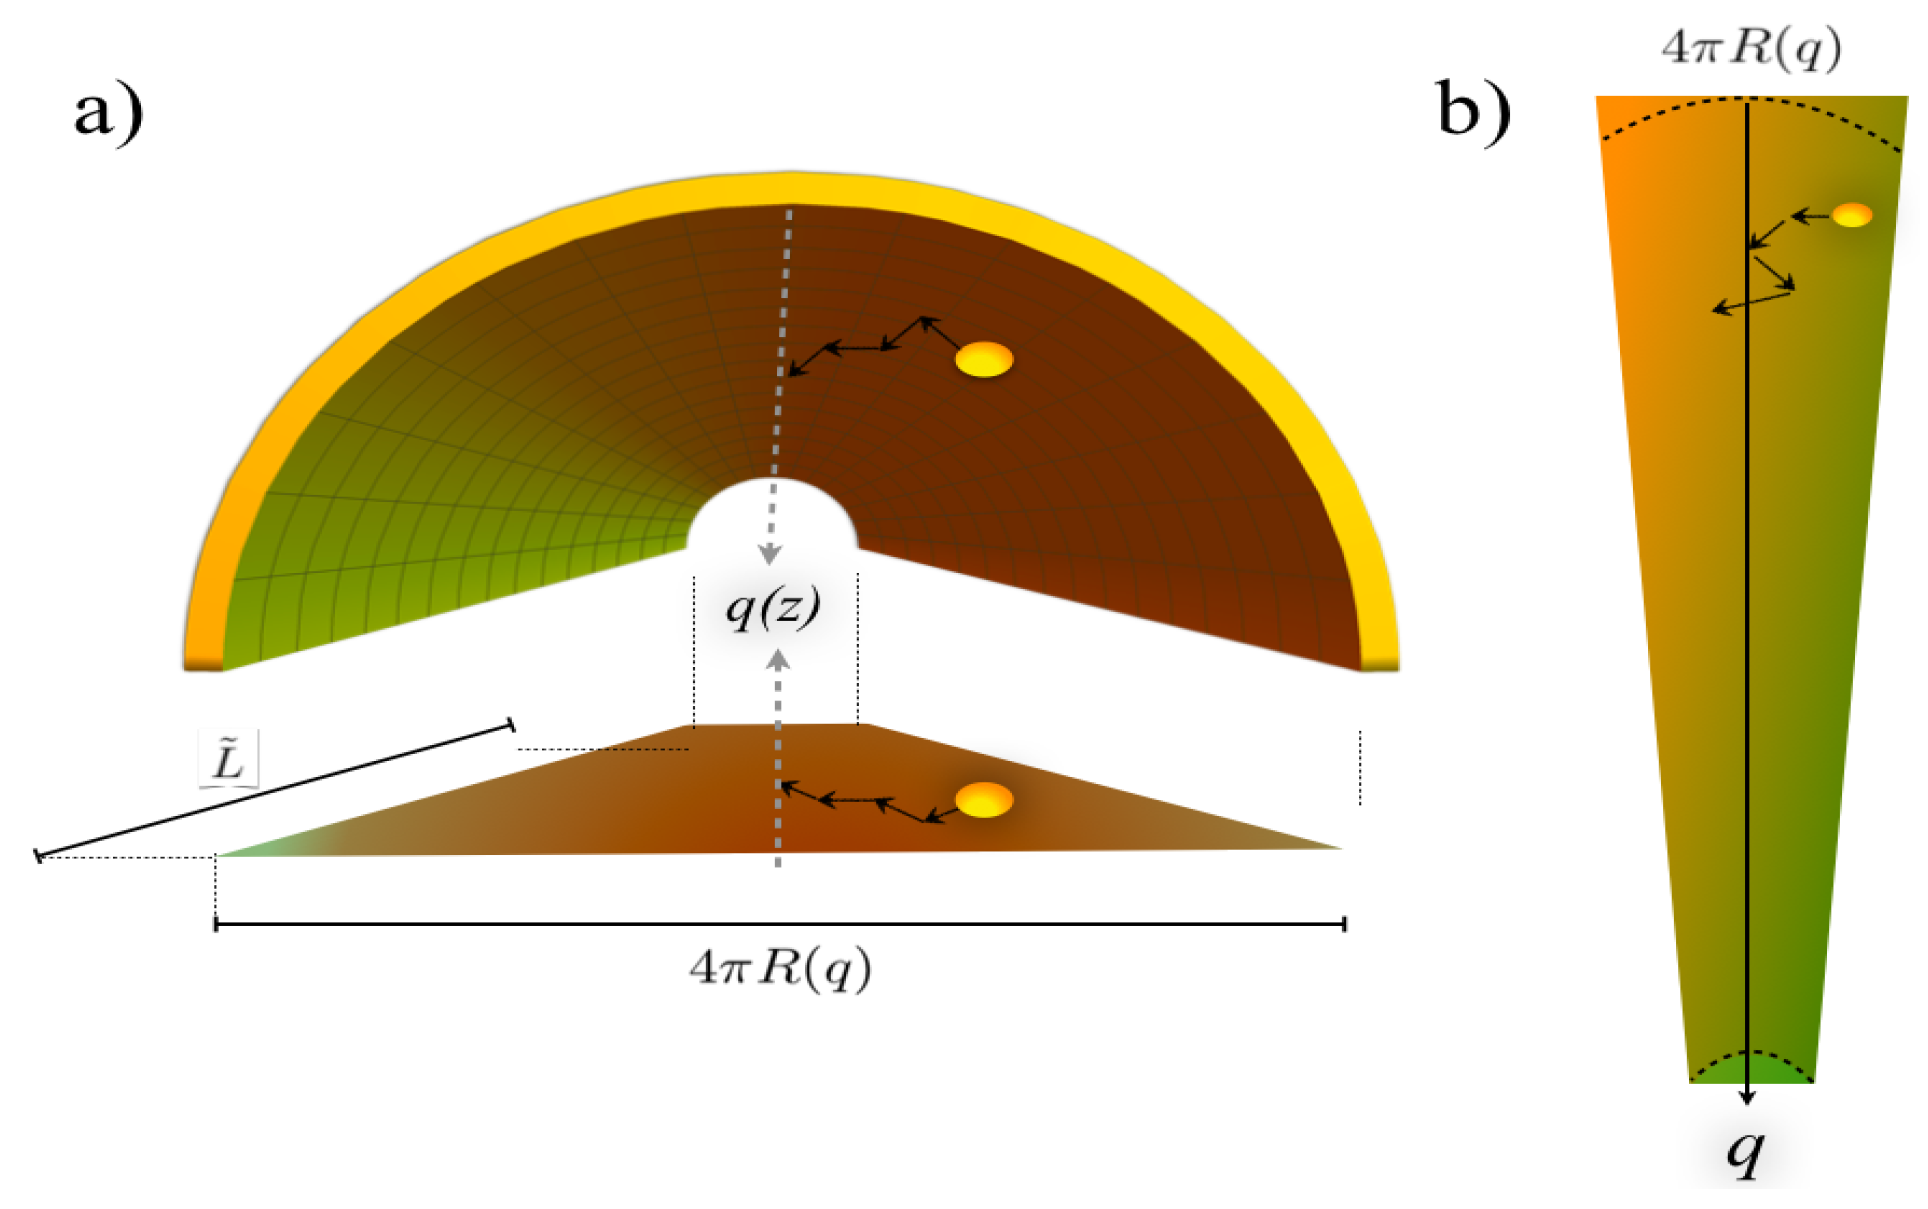
2.1. Contraction of the Description for Diffusion Processes

The formulation of a theory for macro-transport processes in irregular domains starts by the contraction of the 3D description offered by Equation (1) along the coordinates which are transversal to the main transport direction. Here, for simplicity in the presentation we will assume that this direction coincides with the z-axis, see Figure 1, and that no adsorption and desorption processes or chemical reactions are present ( j s u r f = 0 and G = 0 ).
In this form, the average diffusion flow along the main transport direction can be obtained by using the well known relation: J d i f f = ( j d i f f · e ^ z ) d A , with d A = r d r d ϕ the element of cross section area with normal vector along the direction of main transport z. Using Equation (3) in the last expression we have
J d i f f = D 0 2 π 0 R ( z ) C z r d r d ϕ ,
where we have assumed that D does not depend on r and ϕ . Integration over r can be done using the Leibniz rule due to the irregular boundaries. One obtains
J d i f f = 2 π D z 0 R ( z ) C ( R , z , t ) r d r R ( z ) C ( R , z , t ) R z .
Now, it is worth to define the averaged bulk concentration C b ( x , t )
C b ( z , t ) = 1 A ( z ) 0 R ( z ) C ( r , ϕ , z , t ) r d r d ϕ ,
having the same units as C ( r , ϕ , z , t ) , that is mol·cm−3. Here, we have introduced the transversal area of the pore A ( z ) π R 2 ( z ) . For non-twisted and large enough ( L > > R ) pores we can assume C ( R , z , t ) C b ( z , t ) , meaning that homogeneity along the radial direction is rapidly reached [21]. Thus, after integrating and performing some algebraic manipulations at the right hand side of Equation (7), we obtain
J d i f f = D A ( z ) C b z .
In similar form, the integration of the mass conservation equation (Equation (1)) over the transversal coordinates r and ϕ yields
t A ( z ) C b + z J d i f f = 0 ,
where we have used Equation (8), the Leibniz rule: 0 2 π 0 R ( z ) z j d i f f · e ^ z r d r d ϕ = z J d i f f J d i f f | r = R d R d z , and assumed non-adsorbing boundary conditions for the diffusion flow at the walls of the pore: J d i f f | r = R = 0 . In the following section we will indicate how the projected description has to be modified when adsorbing boundary conditions are considered.
In this way, by substituting Equation (7) into Equation (10) we finally obtain the evolution equation of the averaged bulk concentration C b ( z , t ) along the main transport coordinate,
C b t = 1 A ( z ) z D ( z ) A ( z ) C b z .
This equation is the appropriate one-dimensional mass conservation relation for a diffusion process that originally takes place in a three-dimensional irregular domain with fixed and reflective boundaries. It should be noticed that the presence of the position dependent transversal area A ( z ) , introduces important modifications to the differential operator associated with the diffusion process. Furthermore, it is convenient to stress that, in general, the diffusion coefficient entering into Equation (11) is a position dependent quantity, see Equation (15) below. The justification of this fact and an explicit form of this dependence in terms of the geometry of the pore are given in the next subsection.
These differences with respect to the usual diffusion equation imply that, when one approximates the description of a three-dimensional diffusion process with a simple diffusion equation of the form:
C 1 D t = D m 2 C 1 D z 2 ,
then careful should be put on what the constant effective diffusivity D m implies. An equation like Equation (12) was rigorously derived from Equation (11) in Ref. [30], where the connection between the molecular diffusion coefficient D and the effective membrane diffusivity D m was given in terms of the geometry of the pores. The final expression is consistent with the experimental inference
D m = D 0 φ τ δ ,
where D 0 is the molecular diffusion coefficient of the particles in the bulk phase in absence of confinement, and φ and τ are the porosity and tortuosity of the membrane, respectively. The symbol δ is called the constriction factor since it quantifies, in an averaged form, the effect of the internal corrugation of the pores on the mass flux. In particular, the inverse 1 / δ is a measure of the intrinsic resistance of a pore to the flow. The theoretical deduction of Equation (13) in Ref. [30] establishes rigorous mathematical relations for the experimental macroscopic parameters φ , τ and δ , in terms of the geometrical parameters of the pores, in such a way that they can be useful for pore design.
The mass balance equation Equation (11) has many advantages since it is written in terms of the volumetric concentration. The first one is that it is easy to connect it with the boundary conditions which are of practical importance in the chemical reaction engineering. For example, the cases when an external gradient is imposed on the porous material: C b ( 0 ) C b ( L ) , with z = 0 and z = L the extremes of the pore, see Figure 1. Another example is when saturation conditions are imposed on an initially empty material: C b ( 0 ) = C b ( L ) = C 0 with C 0 a constant. This quality of Equation (11) is very important because in an experimental setup these conditions are usually the measurable or controllable parameters. Therefore, the Equation (11) allows one to establish in a detailed way the concentration profile (usually not measured) in terms only of the external condition, as long as the internal shape of the pore is known.

2.2. The Diffusion Coefficient in the Contracted Description

The contracted description we have already presented, can be related with the Fick–Jacobs–Zwanzig description of Brownian motion at irregular domains [22]. In this case, valid for equilibrium situations, one should assume a very diluted gas in such a way that the probability density is proportional to the concentration of molecules: P C . When this assumption is valid, the Equation (11) can be rewritten in terms of the reduced probability p: P p / A ( z ) , which is a linear density. The result is the Fick–Jacobs–Zwanzig equation
p t = z D ( z ) A z p A .
The interesting point here is that the diffusion coefficient entering in Equation (14) is position dependent, i.e., D = D ( z ) . Several expressions for the functional form of this coefficient have been obtained for the two-dimensional problem [22,23,29,35]. However, in three dimensions, and only for illustrative purposes, it is convenient to write down the form reported in Ref. [36] for a three-dimensional cylindrical tube:
D ( z ) = D 0 1 + h z 2 ( z ) + R z 2 ( z ) 2 .
Here h ( z ) is the middle line of the pore, R ( z ) its local width and the subscript z denotes derivation respect to this coordinate. Therefore, in the contracted description, the diffusion coefficient is reduced by the constriction (proportional to R z 2 ) and by the sinuosity (proportional to h z 2 ) of the pore. These parameters are involved in the definitions of φ , τ and δ . For more details, see Refs. [18,30,31].

3. Adsorption–Desorption Kinetics in Macrotransport Process Theory for Irregular Domains

When the internal surface of a pore is chemically active there is a probability per unit time that a particle which approaches to the wall becomes adsorbed or desorbed. This probability is measured by the contribution j s u r f given in Equation (5) and therefore the adsorption–desorption rate por unit area of the pore’s surface, j s u r f · n ^ = ρ ˙ , is proportional to the velocity of reaction ρ ˙ which measures how rapidly the particles are leaving the bulk and stay attached at the wall, and vice versa.
Assuming that the adsorbed layer does not modify in an noticeable extent the available volume of particles diffusing in the bulk, one can proceed along the same lines of the last section in order to obtain (see Ref. [21] for details)
C b t = 1 A ( z ) z D ( z ) A ( z ) C b z + Γ A ρ ˙
where Γ ( z ) is an area density, that is, a purely geometric factor which measures the local surface area of the pore since 0 L Γ ( z ) d z = A s u r f ; for surfaces of revolution, it has the explicit form Γ ( z ) = 2 π R ( z ) γ ( z ) , where the length density is γ ( z ) = 1 + R z 2 ( z ) . The factor Γ ρ ˙ / A has therefore the dimensions of mol·cm−3·s−1.
The Equation (16) accounts for the spatial and temporal evolution of the bulk concentration of a gas inside a pore having an adsorbing irregular surface. The adsorption–desorption process is therefore weighted by the control parameter Γ ( z ) / A ( z ) , see the left panel of Figure 2. This means that an increase in the amount of active sites over the wall of the pore [or equivalently, increasing Γ ( z ) ] produces in turn an increased efficiency of the adsorption–desorption process as it is expected, this is shown in the right panel of Figure 2.
The Equation (16) is the generalization of the macro-transport processes theory to the case when diffusion and adsorption–desorption chemical kinetics may occur. It gives a clue of how to relate the detailed process occurring at the wall with the measurements that only consider the internal volume of the pore. For example, if in a given system the adsorption–desorption process is the slower step of the dynamics, then one can ignore the diffusion process and therefore Equation (16) reduces to
C b t = 2 γ ( z ) R b ( z , t ) ,
where we have identified the reaction velocity R b (in mol·cm−3·s−1) of the respective chemical kinetics through the expression
π R ( z ) A ( z ) ρ ˙ ( z ) = ρ ˙ ( z ) R ( z ) = R b ( z , t ) ,
in which we made use of the explicit form of the cross area A ( z ) . This relation quantifies how fast the material is adsorbed-desorbed at position z at time t over the pore surface and therefore, is crucial for understanding the role of the geometric irregularity of the pore when quantifying the adsorption–desorption macroscopic reaction rates. Integration over the length L of the pore yields the macrotransport relation
d C b ¯ d t = R b ¯ ( t ) .
where we have defined C b ¯ = L 1 0 L C b ( z , t ) d z and R b ¯ = 2 L 1 0 L R b ( z ) γ ( z ) d z . This last expression for the chemical rate is exclusively a time dependent function, but implicitly contains the details of the internal geometry of the pores.

3.1. The Thiele Modulus

The Equation (16) shows that a porous material of irregular shape increases the efficiency of an adsorption–desorption process by the combination of two factors. In first place, the corrugation and sinuosity of the pore make slower the effective diffusion process along the longitudinal direction, since the diffusion is reduced by a factor of D / D 0 compared with a cylindrical pore. In second place, the corrugation of the pore makes that the surface of the walls is increased by a factor Γ , augmenting in principle the amount of active sites.
Traditionally, both factors can be taken into account in a single characteristic parameter of a chemical reactor called the Thiele modulus, which is defined as the square root of the ratio between the characteristic time of diffusion and the characteristic time of the adsorption–desorption kinetics [16]
Φ 2 = characteristic time of diffusion characteristic time of adsorption .
From this definition it is possible to show how the irregularity of the pores locally increases the Thiele modulus Φ with respect to Thiele modulus Φ 0 of a cylindrical pore of radius R 0 with the same length and no irregularities. Let us assume a first order adsorption process with velocity constant κ ( 1 / s ), that is,
R b ( z , t ) = κ C b .
Then, from Equation (16) in the stationary state the expression of the Thiele modulus for a cylindrical pore is ( γ = 1 ): Φ 0 = 2 κ L 2 D 0 . The corresponding expression of the position dependent Thiele modulus for an irregular pore can also be obtained from Equation (16). Introducing the scaled variable ζ = z / L , in the stationary state Equation (16) becomes
2 C b ζ 2 = 2 γ κ · L 2 D C b C b ζ · ζ ln | D A | ,
where we have used Equation (21) and made some rearrangements. Noticing that the characteristic time of diffusion can be defined by τ d i f f = L 2 / D and the characteristic time of adsorption by τ a d s = ( 2 γ κ ) 1 , then the local Thiele modulus Φ ( z ) can be defined in complete analogy with Φ 0 by
Φ ( z ) = 2 κ γ · L 2 D ,
implying that
Φ ( z ) Φ 0 = γ D 0 D = γ ( z ) 1 + h z 2 ( z ) + R z 2 ( z ) 2 1 ,
where in the second equality we have used Equation (15). The inequality follows from the fact that D 0 / D ( z ) 1 and γ = 1 + R z 2 ( z ) 1 . Additionally, one may introduce an averaged Thiele modulus which can be defined in the usual form
Φ ¯ = Φ 0 L 0 L γ ( z ) 1 + h z 2 ( z ) + R z 2 ( z ) 2 d z .
The results of the present theory seem to go deeper in the modeling and comprehension of the processes taking place in the system than previous theories. The corrected expressions depending on the corrugations and sinuosity of the pores, show how the internal geometry of the pore affects the amount of material adsorbed or transferred across a membrane. This could be a very relevant knowledge in the cases when one looks for programmed performance properties of a membrane.
Equation (22) predicts that the mass distribution inside the pore will only depend on the Thiele modulus, which becomes corrected by the local values of the length density γ ( z ) and of the diffusion coefficient D ( z ) . From this information and taking into account the definitions of the mass transfer coefficient and effectiveness factor a very complete description can be achieved. Very detailed examples in two dimensions were previously analyzed in Ref. [16,21]. We will show this in the following section for the case of conical pores.

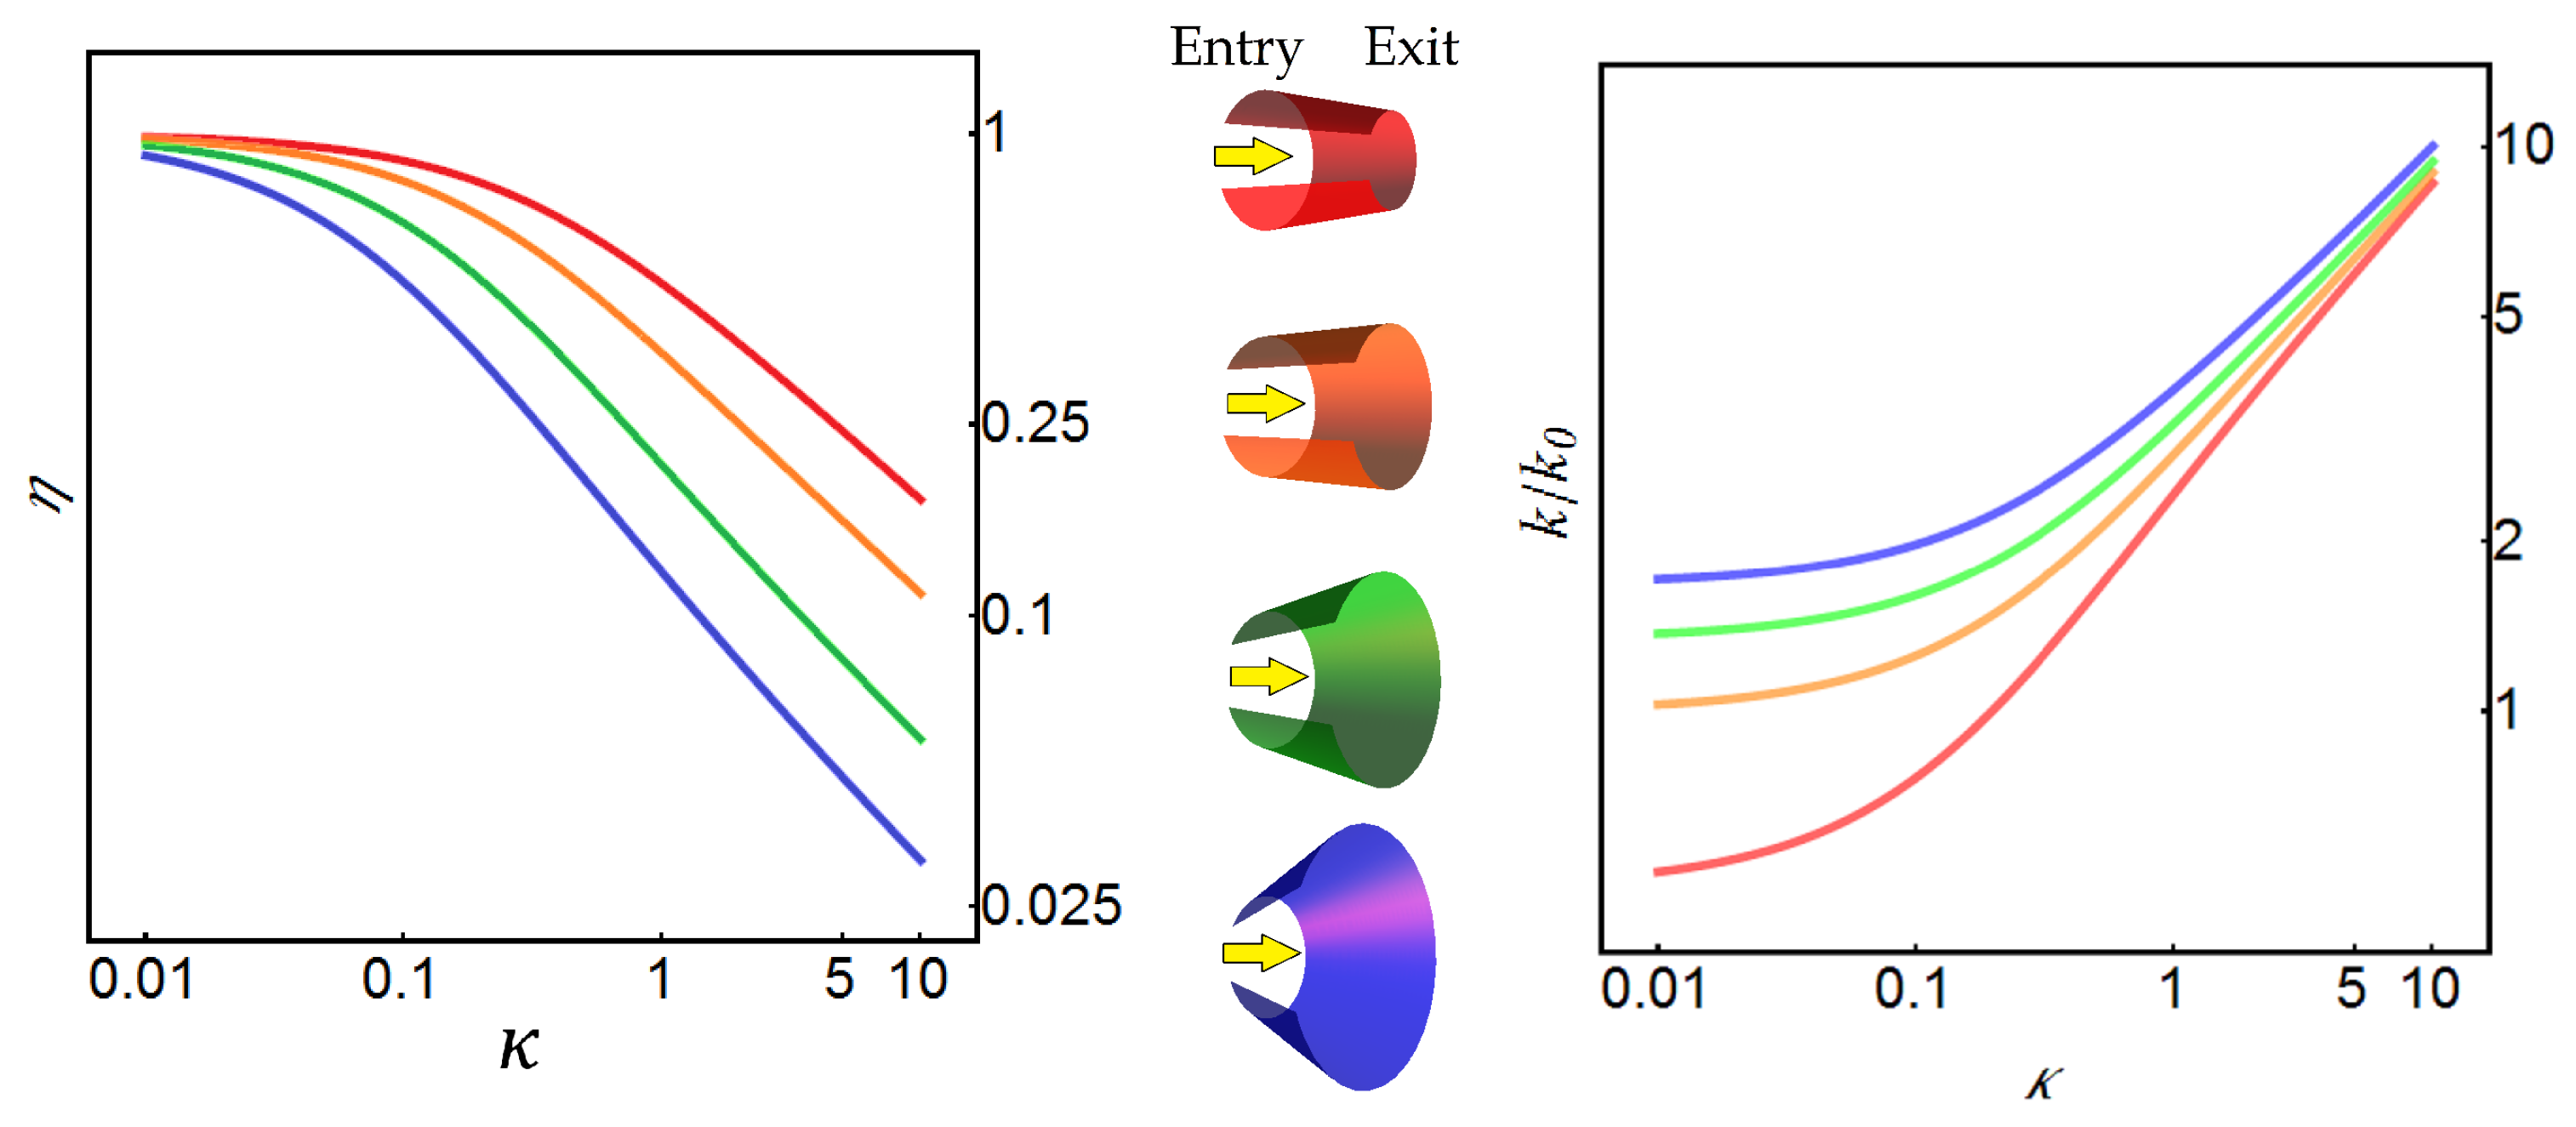
3.2. An Application: Conic Pores

The utility of the previous results may be illustrated by considering some interesting situations of practical interest, like nano-filtration, among others [37,38,39,40,41]. As an example, consider first that the porous material is a membrane subject to a concentration difference between both ends. In this case, the proportionality k between the net flux and the net concentration difference is called the coefficient of mass transference and usually augments with the Thiele modulus. The Equation (22) allows to predict that the presence of throats of specific slopes can increase the transferred material across the membranes and, therefore, increase k in a very appreciable way. At the other hand if we are interested in an equilibrium process where the fluid can enter at both sides of the membrane saturating the membrane, then the internal effectiveness factor η is usually measured [16]. This parameter measures the ratio between the amount of gas actually adsorbed and that which would be adsorbed if all the internal surface of the pore were exposed to the external concentration. It is known that this parameter η usually decreases with the Thiele modulus. Once more time, the use of Equation (22) allows to predict that the existence of bottlenecks can increase the effectiveness factor in two ways, since the reduction of the volume caused by the funnel causes in turn accumulation of material making the adsorption more efficient, see Figure 3.

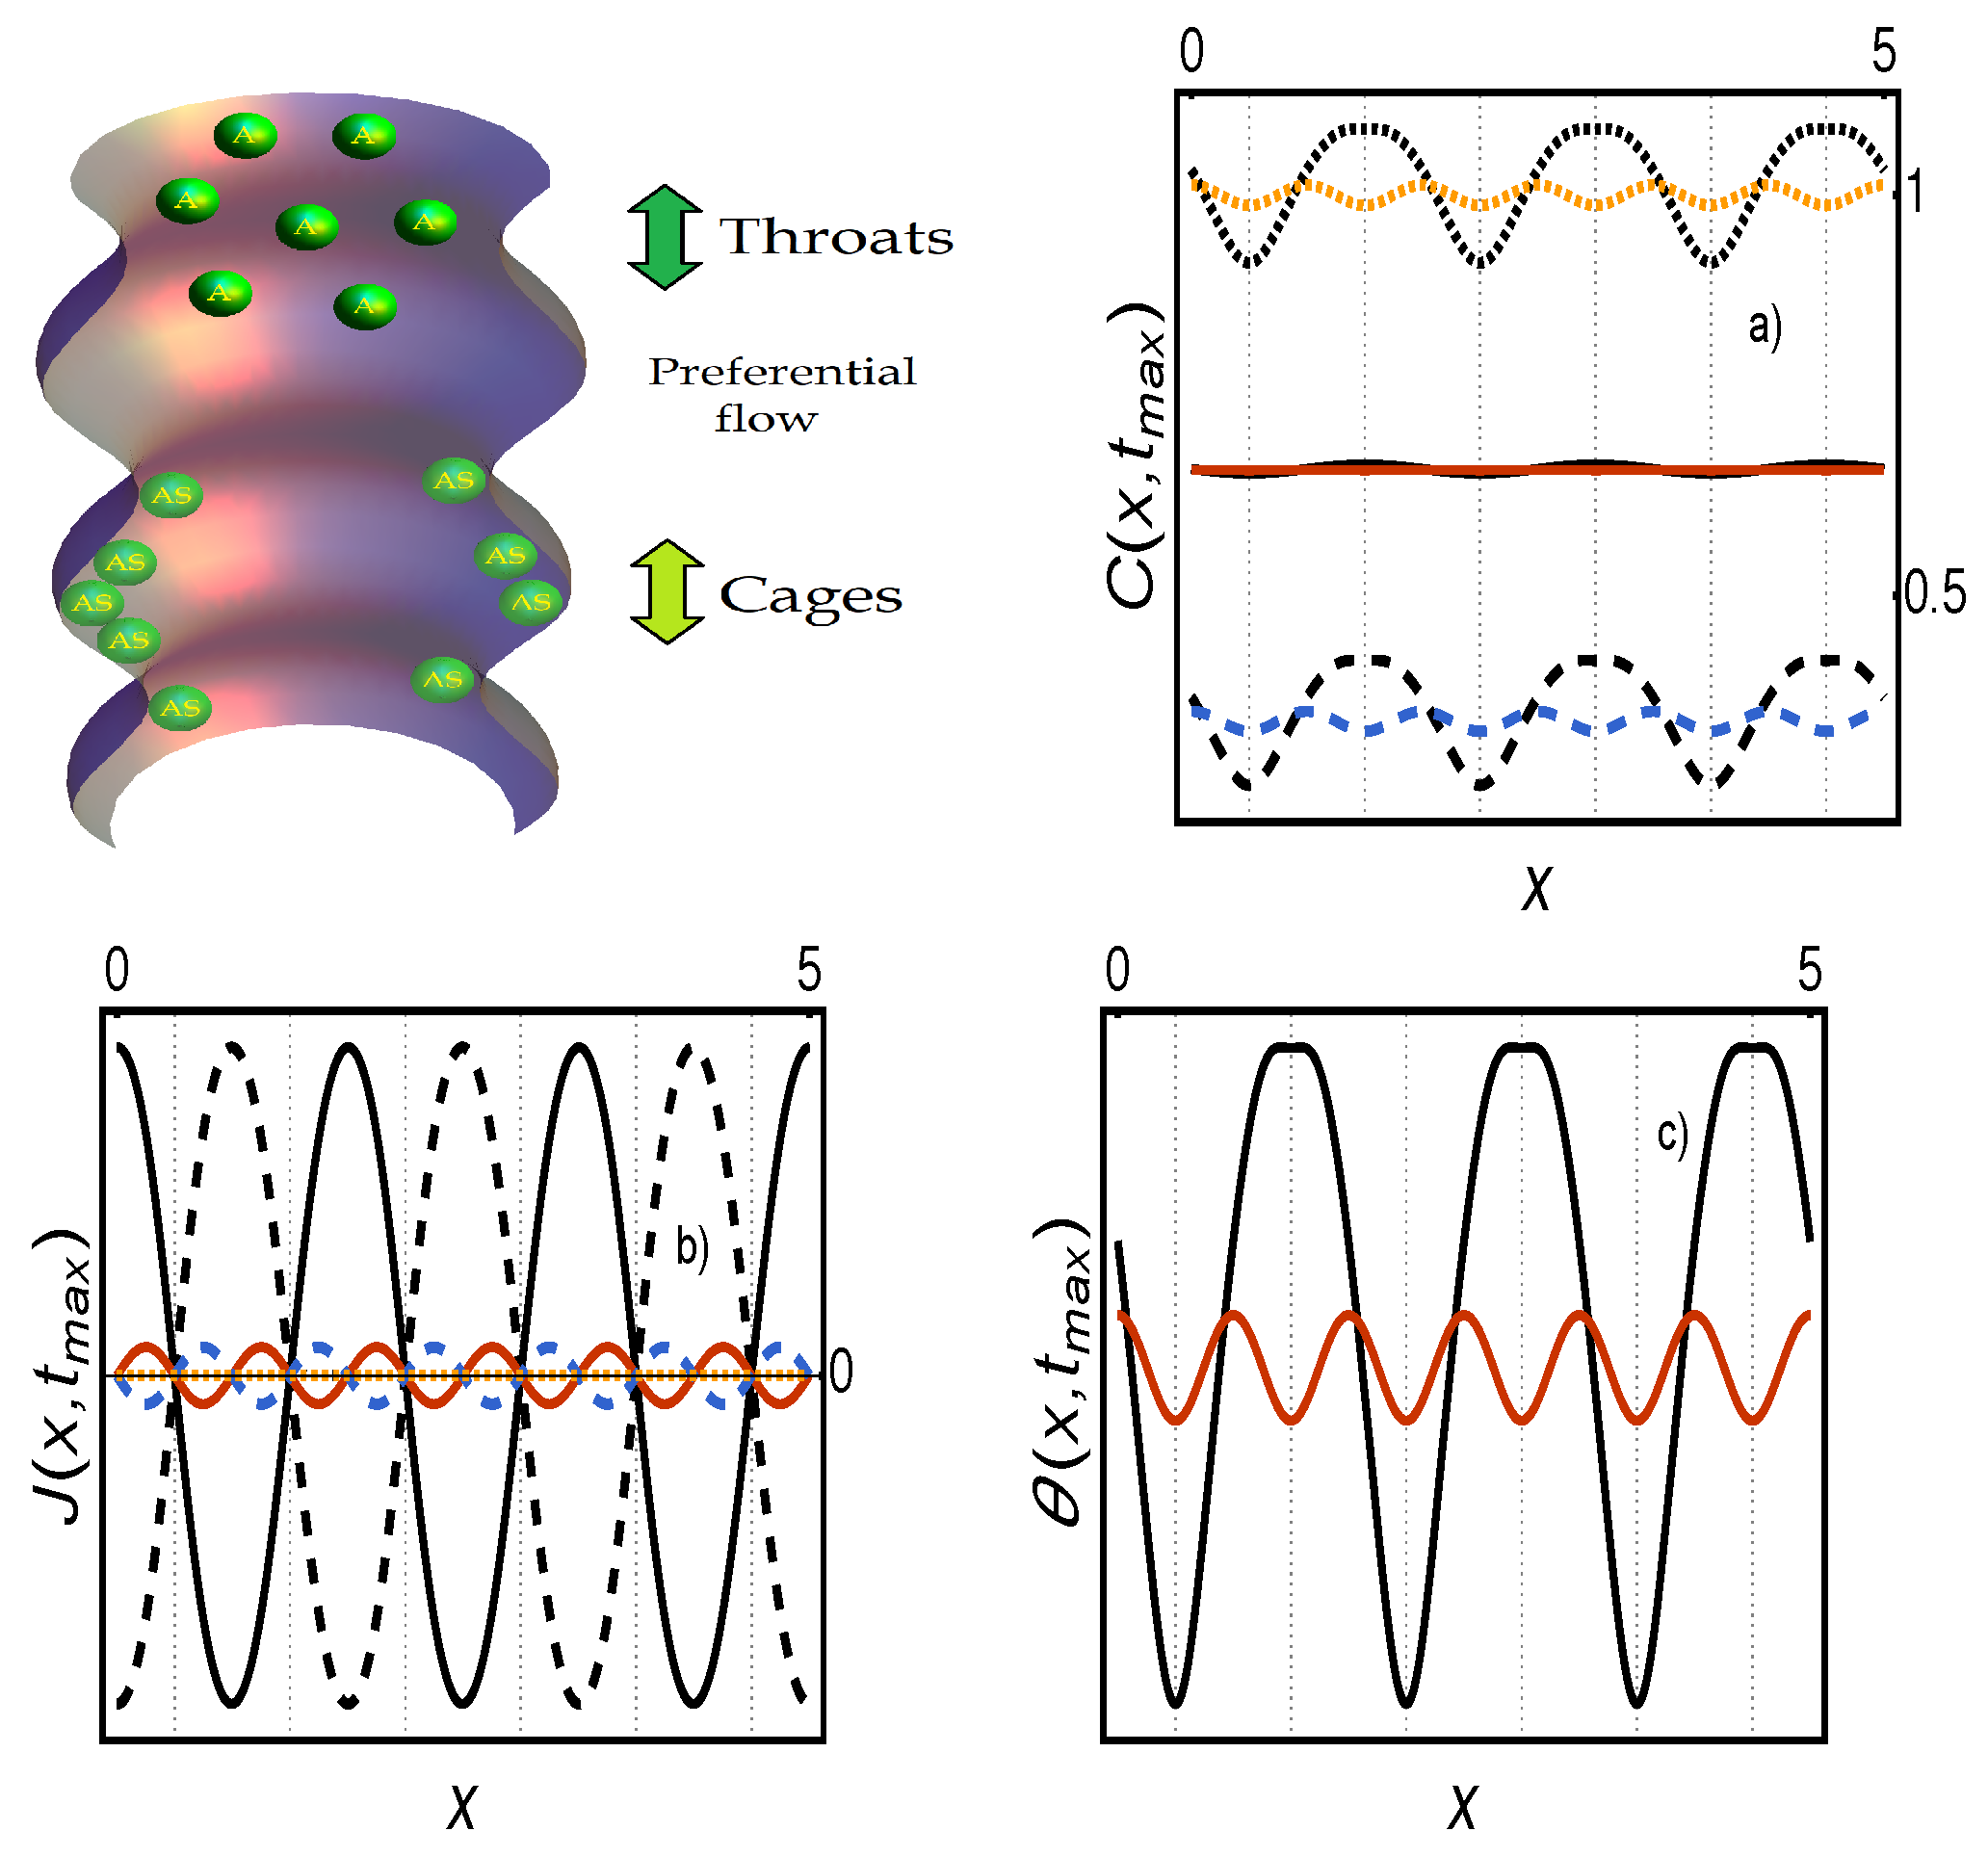
4. Effect of Diffusion of the Adsorbed Phase over the Internal Pore Surface

When a particle is physically adsorbed at the internal surface of the pore it enters in a very narrow region that is called the adsorption field. The length and deepness of the adsorption field is dictated by the type of interaction between host and guest molecules of the solid porous material [42]. In this situation, and adsorbed particle can change its position by two ways. One of them is a simple desorption process which can be described with the same models than adsorption as before, or by other way, it can move along the surface of the pore. This second mechanism is called surface diffusion and is caused by short-length interactions among the molecules and the surface. From the practical point of view, it has been suggested that the surface diffusion coefficient is larger than the bulk diffusion, and that can be responsible for most of the effective transport inside porous materials [43,44,45]. However, as the traditional models for quantifying surface diffusion usually depend of the reactor used, it is hard to deduce general conclusions of this process [46].
In order to establish a one-dimensional description of the concentration of the adsorbed phase along the main transport coordinate, we will assume that the pore surface is non-twisted, i.e., it is independent of the azimuthal coordinate and therefore describable by a single parametric coordinate. This assumption allows us to write, in the limit of zero loading, the parametric coordinate [31]
q ( z ) = 0 z 1 + R z 2 ( z ) d z .
The coordinate q ( z ) can be understood as a measure of the real length traveled by the molecules in the main transport direction. The significance is clear when analyzing the case of a conic pore, see Figure 4a. The diffusion over the surface of the cone is approximately equal to the diffusion over the two dimensional domain indicated in Figure 4b, where the effective length of this domain is defined by L ˜ = 0 L 1 + R z 2 ( z ) d z .
Hence, the projected concentration of adsorbed molecules along the coordinate q is s ( q , t ) , having dimensions of mol·cm−1 along the surface. This concentration satisfies a one-dimensional mass balance equation which comes from the projection of the corresponding two dimensional diffusion equation along the coordinate q ( z ) . This equation is similar to the so-called generalized Fick-Jacobs equation, see Ref. [18,31]
s t = q D s w q s w + g s ,
where w = 2 π R ( q ) is the width of the two dimensional domain, and g s (in mol·cm−1·s−1) quantifies the interchange of molecules between the adsorbed phase and the bulk by means of the adsorption–desorption process. Equation (27) is relevant because it provides a clear physical meaning to the surface diffusion coefficient D s as the proportionality constant between the current density of molecules and the concentration of adsorbed molecules when measured only along the surface. Therefore, this diffusion coefficient can be directly deduced, independently of the type of reactor, from the measurements of the mean square displacement in the limit of zero loading.
From the experimental point of view, the details about the spatial and temporal distribution of the adsorption process are usually ignored. Thus, the theoretical description is done by assuming a general mechanism for the adsorption–desorption kinetics from which one adjusts the chemical rates in terms of the internal concentrations measured. However, these bulk and surface concentrations are known in terms of the internal volume of the pore and, therefore, are measured in mol by unit of internal volume. In this way, for practical purposes, it is necessary to express Equation (27) in terms of volumetric concentrations and of the bare coordinate z, instead of the effective coordinate q. Let us define the concentration of the adsorbed phase C s (in mol by unit of volume) through the relation
C s = γ A s ,
where the length density γ takes into account the re-scaling due to the projection over the effective defined coordinate q. Substituting the last relation into Equation (27) and using the geometric relation Equation (26), we obtain the single dimensional diffusion equation for the concentration of the adsorbed phase C s
C s t = 1 A z 4 π D s A γ w z A γ w C s + γ R s ,
where R s = r s / A , and we used the expression for the transversal area A = π R 2 . The Equation (29) quantifies the concentration distribution of the adsorbed phase as the result of the surface diffusion and the interchange of particles with the bulk phase. In the case when the projection of the dynamics is performed from a two dimensional channel [31], the corresponding mathematical form of the one-dimensional diffusion equation is very similar to the generalization of the Fick-Jacobs equation given in Equation (16). The difference is the form of quantifying the effective mass flux of both diffusive processes.
A striking effect predicted by the above equation is that a macroscopic stationary state can be reached in such a way that the surface and bulk dynamics compensate each other. This effect is shown in Figure 5, where we show this coupling in a sinusoidal pore in the presence of Langmuir adsorption [47]. The presence of inhomogeneities on the surface concentration slaved to the form of the pore induce non-vanishing gradients, that is, induce bulk and diffusion currents developing in opposite directions along z. The result is the apparent formation of condensation-diffusion cells inside the pore [31].

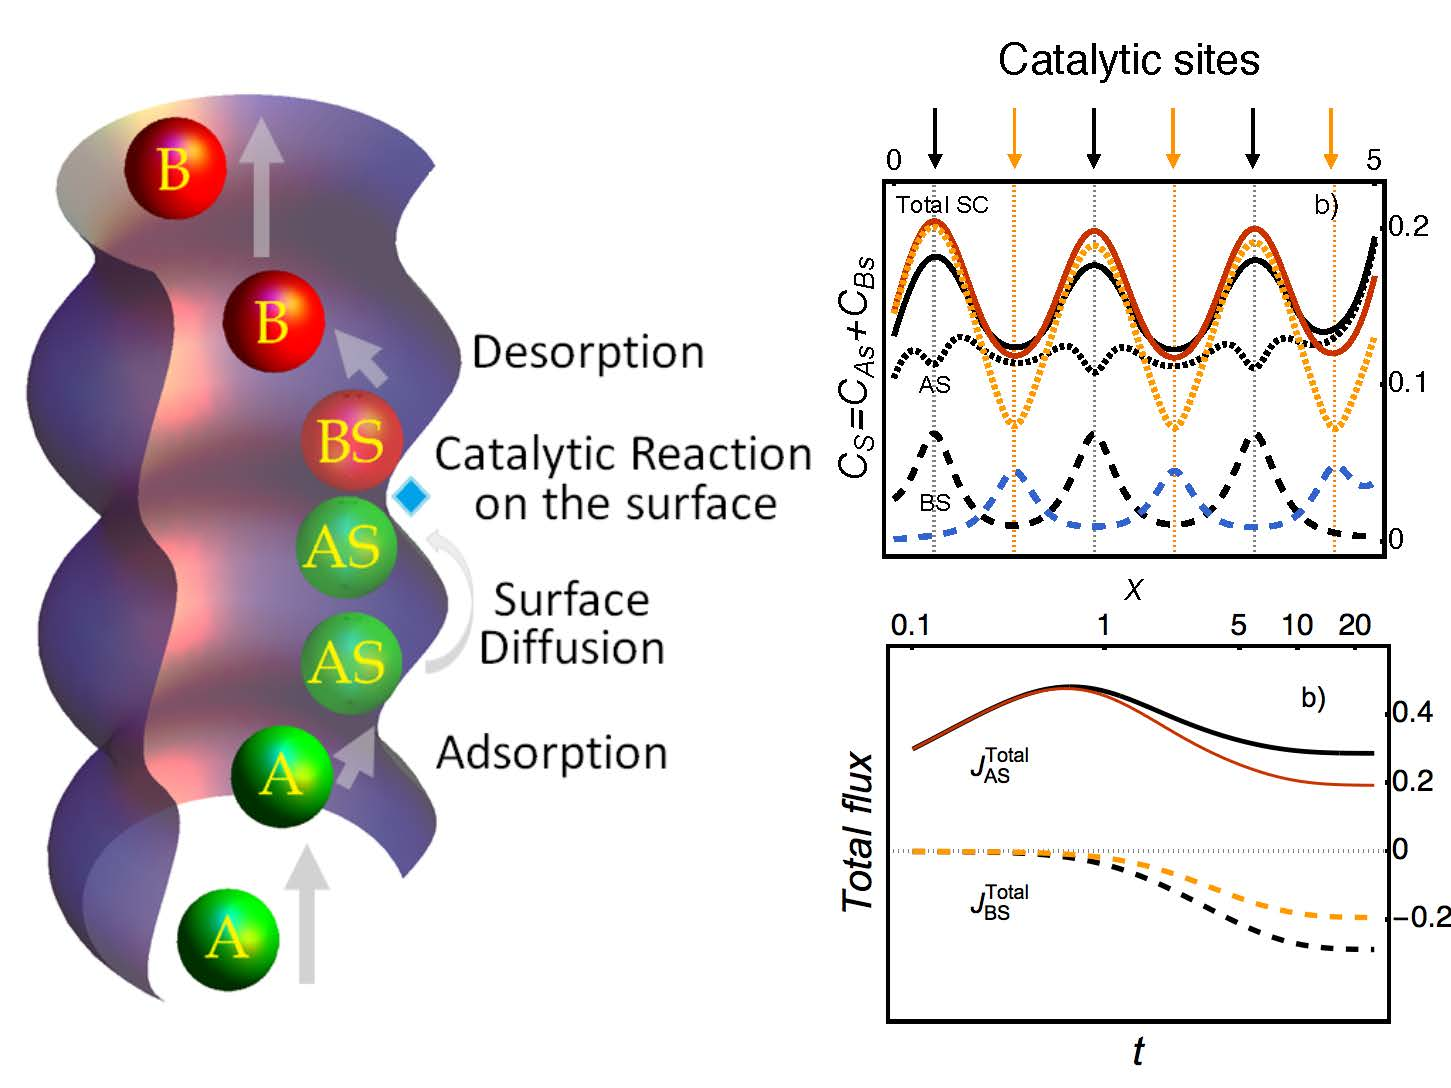
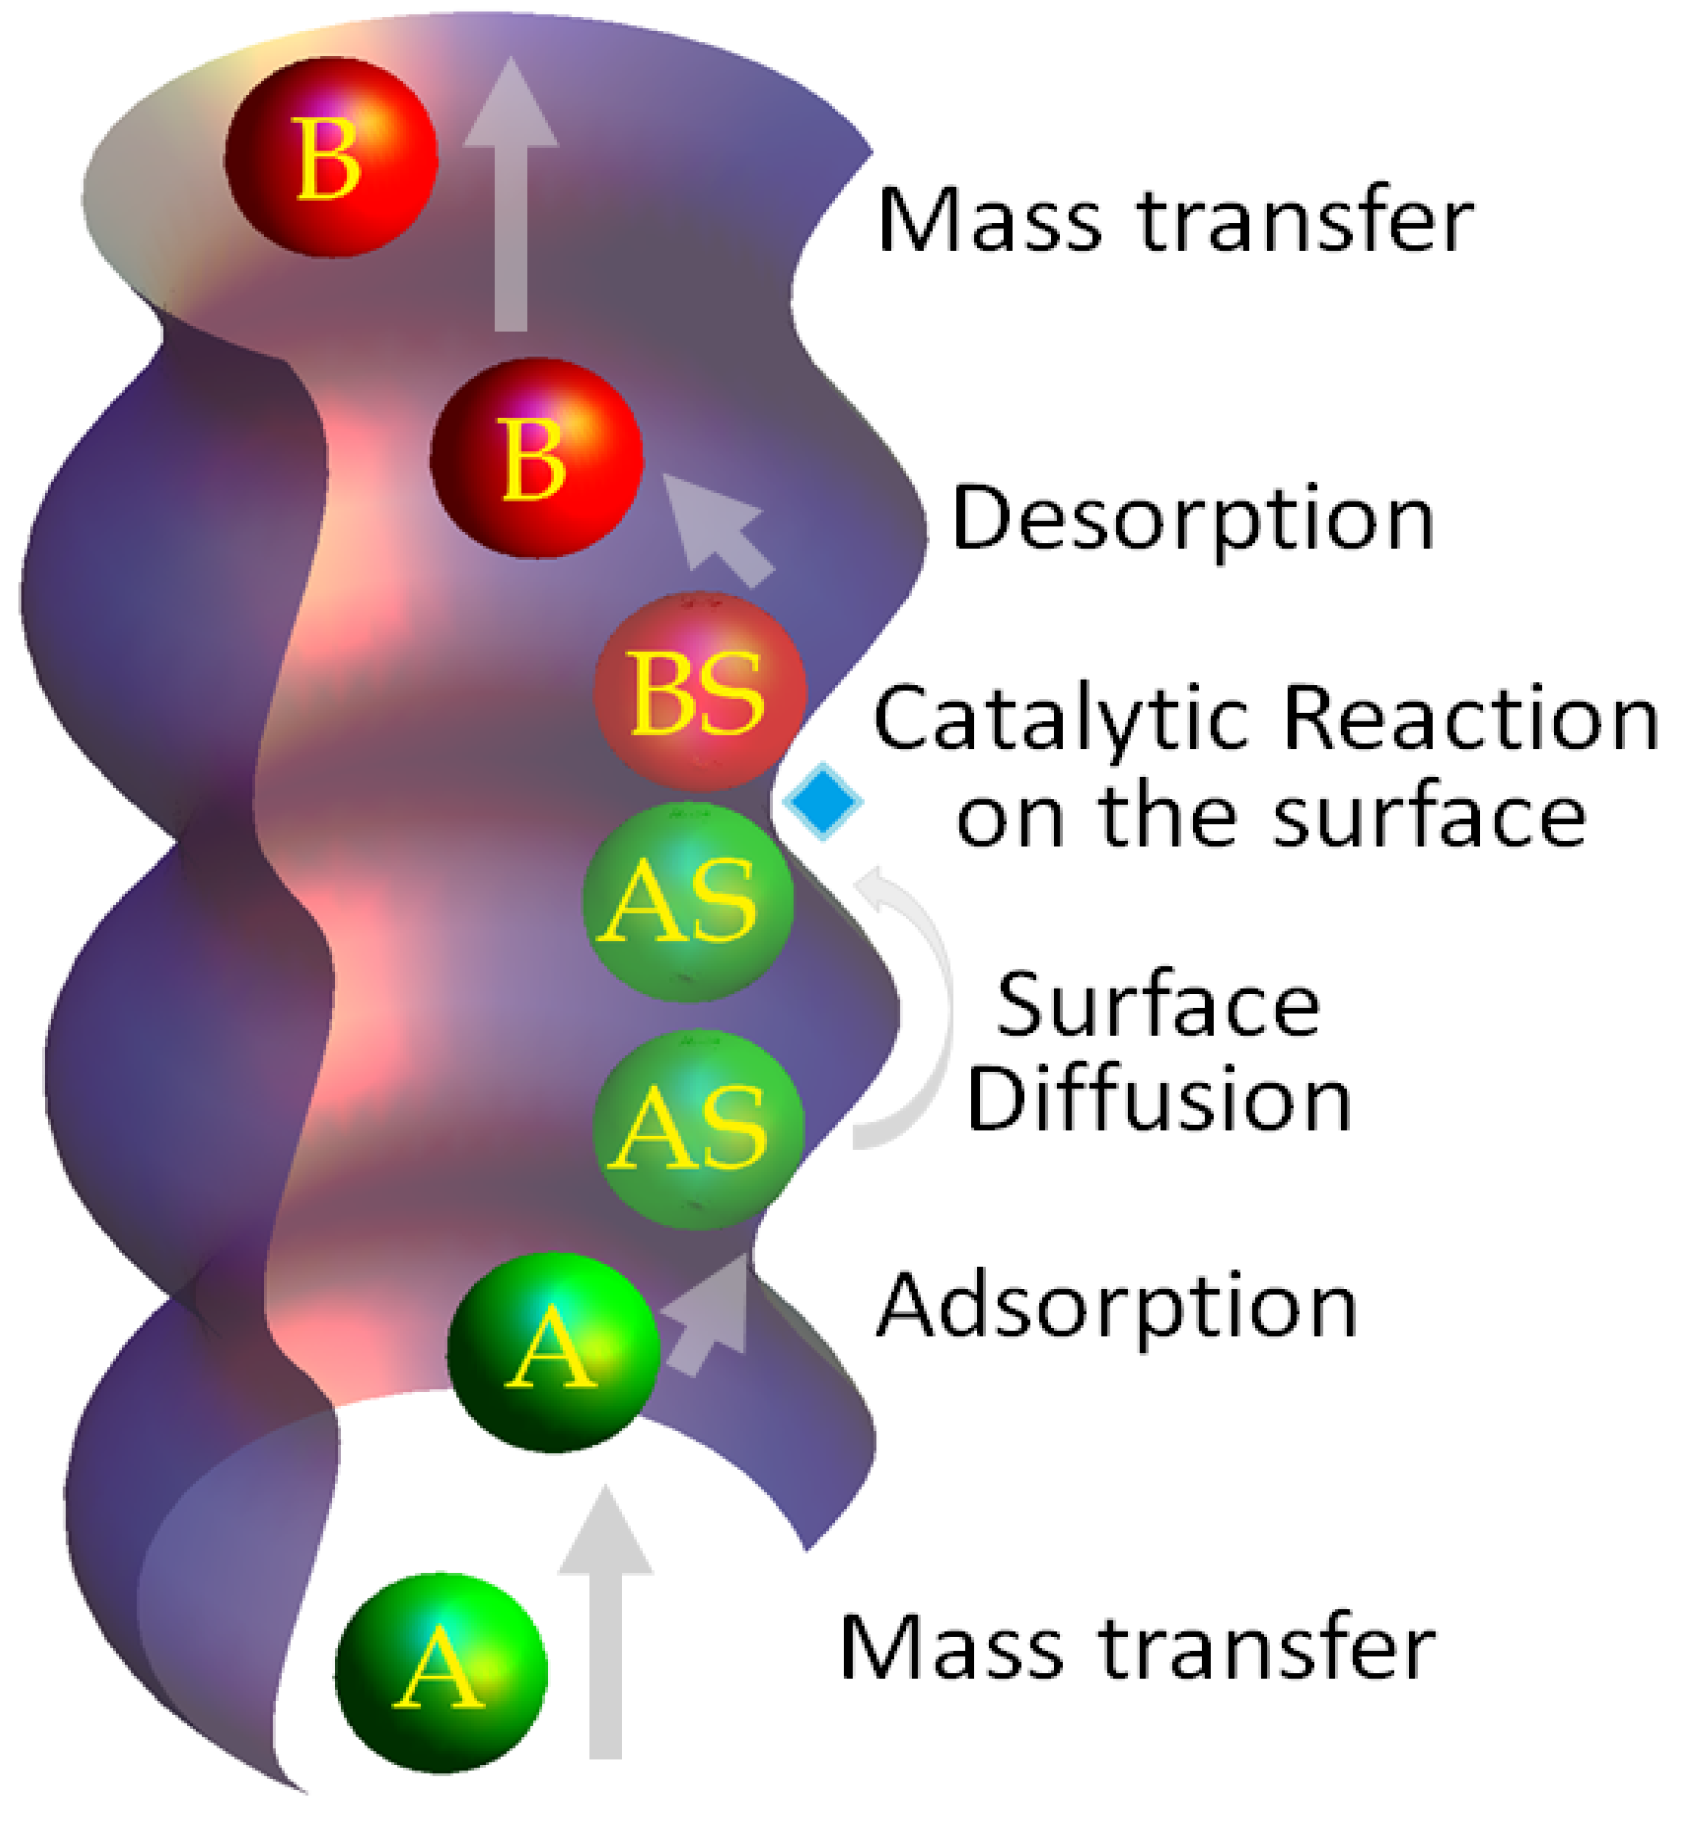
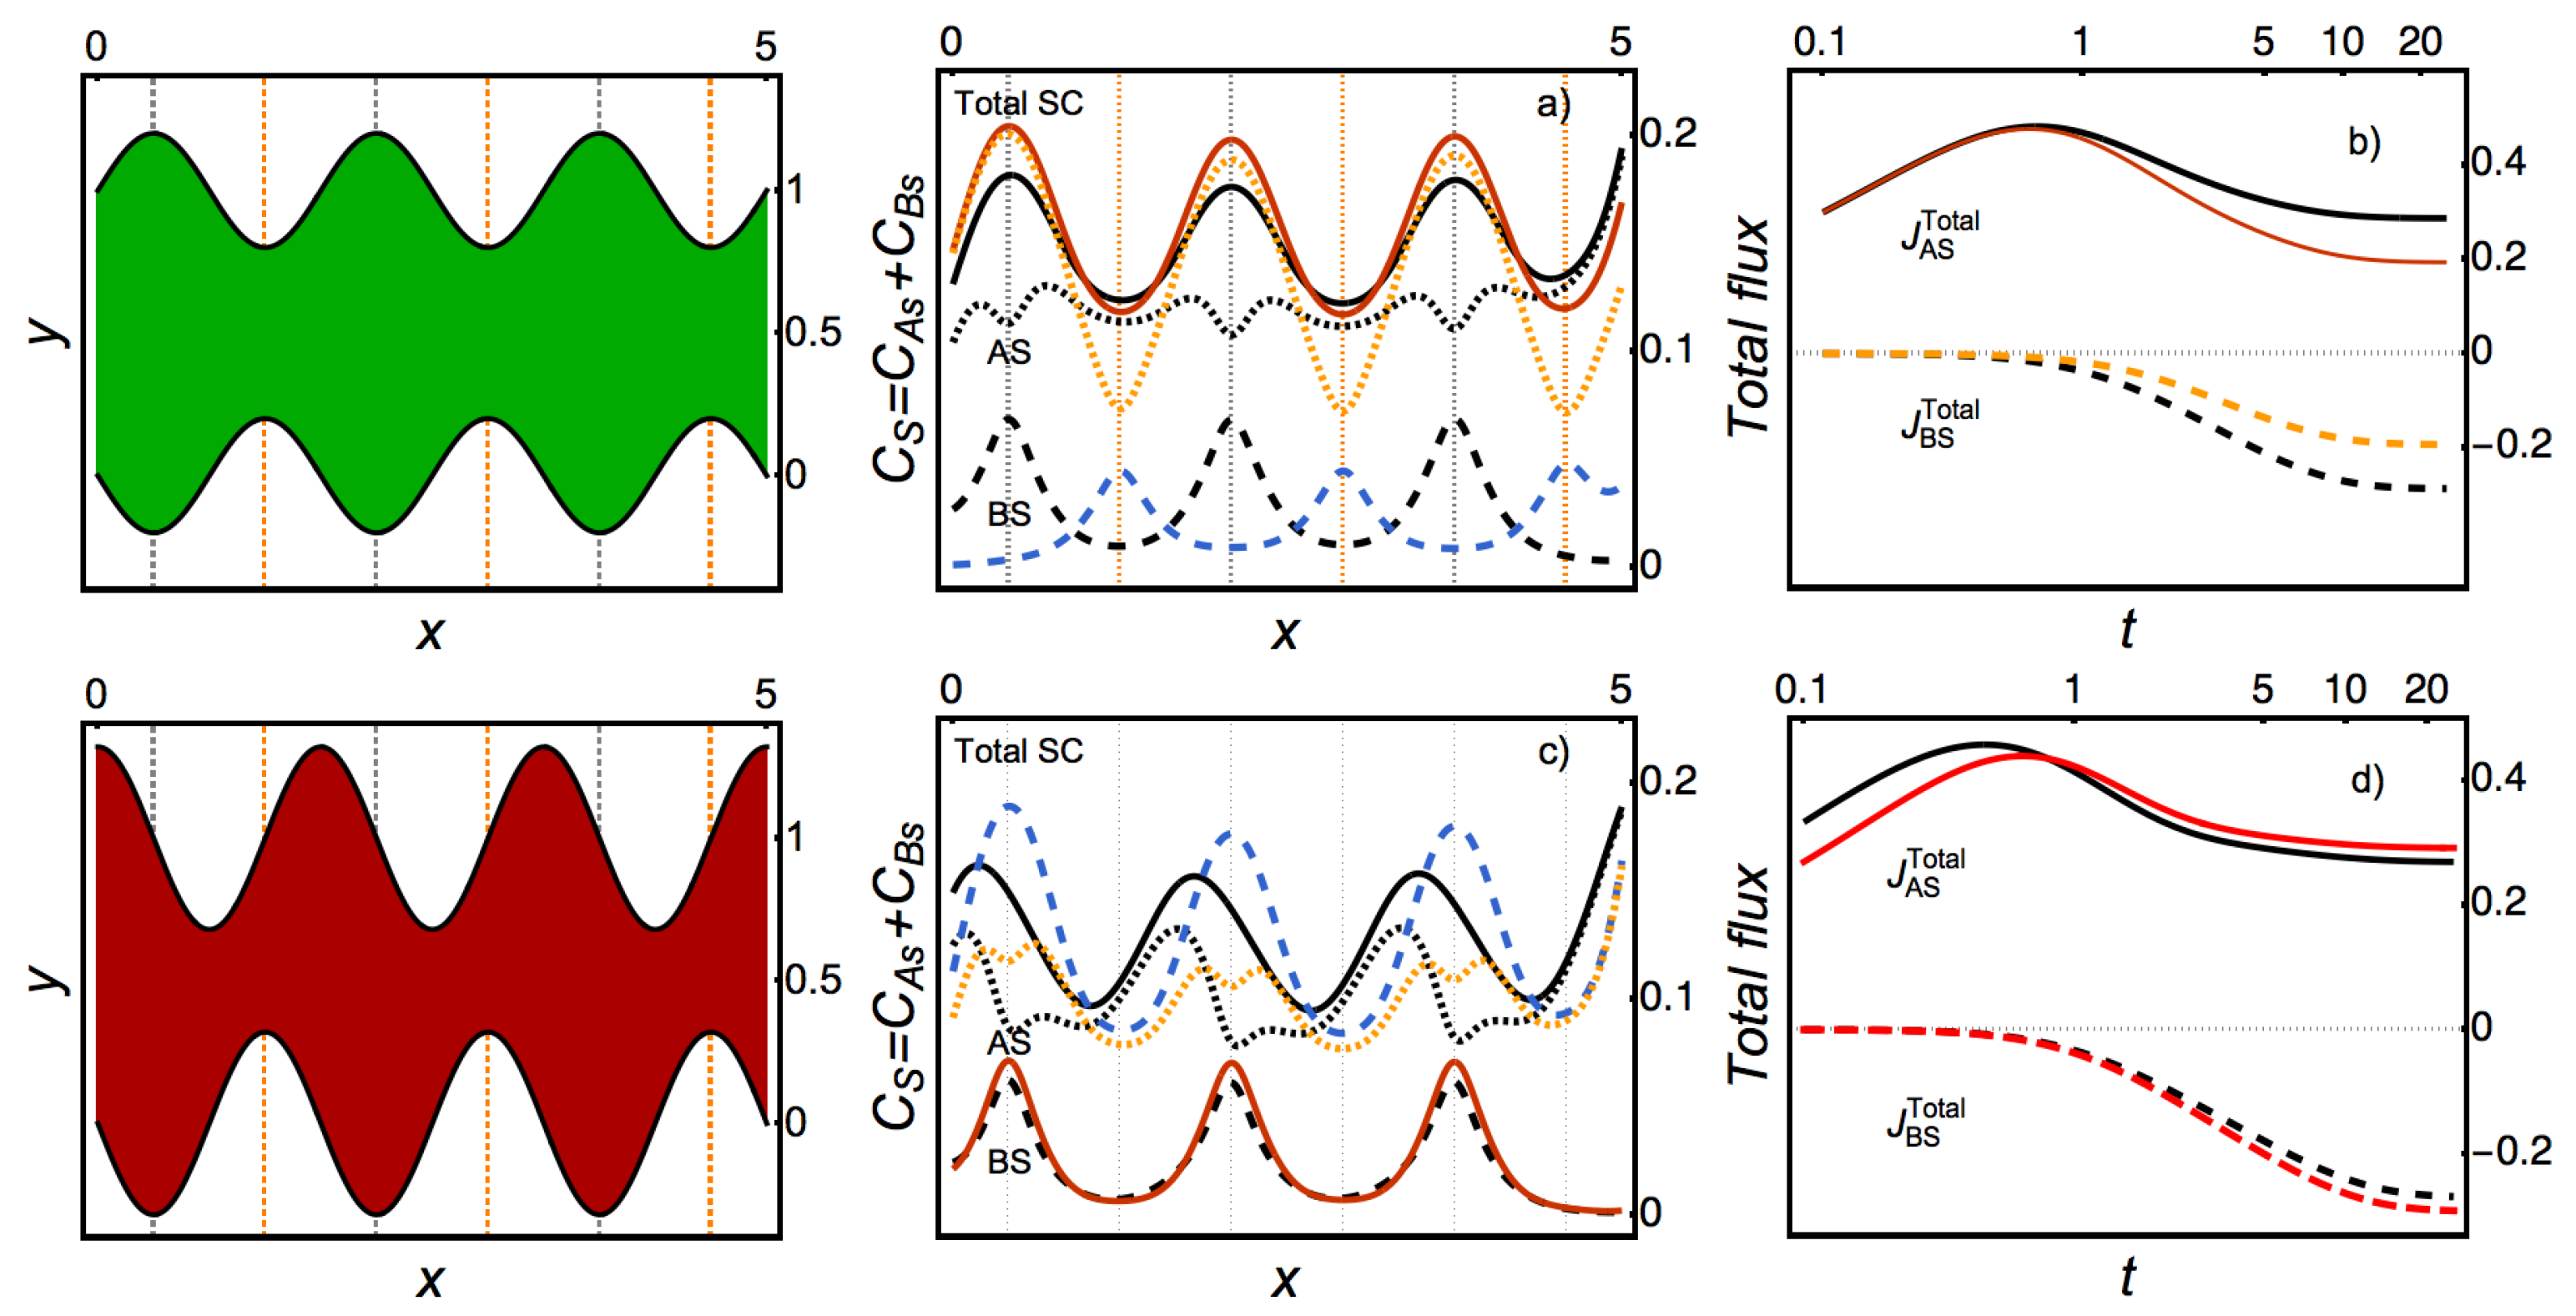
5. Heterogeneous Catalysis

In previous sections we have presented a theoretical framework that describes the spatial and temporal evolution of the concentration of molecules along axisymmetrical irregular pore whose shape is known, and in which heterogenous reactions and surface diffusion take place. The theoretical framework is summarized by Equations (16) and (29), which separate the processes occurring in the bulk from those in the adsorbed phase because the diffusion in each case has different origins and magnitudes.
In both equations, the irregularity of the pore geometry enters through the geometric parameters A and γ , which represent the cross area and the length-density of the walls, respectively. Therefore, if the reaction of adsorption and desorption is known, as well as the bulk and surface diffusion coefficients in the limit of zero concentration, then Equations (16) and (29) allow, in principle, to describe in detail the concentration of any fluid inside the pore.
However, in practice the parameter γ ( z ) is frequently unknown, and therefore the effect of the adsorption–desorption kinetics on the overall transport across the pore or the membrane is only assessed in average form. Thus, in this situation it is convenient to approximate the parameter γ ( z ) in terms of an average enhancement factor: γ ¯ = L 1 0 L γ ( z ) d z , and introduce an operational definition for γ ¯ . For a previous discussion on this subject, see Ref. [18,31]
An operational definition γ ¯ can be introduced in terms of the ratio between the reaction velocity constant inside the pore with respect to that of a flat surface. Thus, γ ¯ can be expressed in terms of the net bulk reaction velocity R ˜ = γ ¯ R , where R was defined through Equations (17) to (19). Assuming that the chemical kinetics has an overall characteristic velocity constant κ , like for instance in Equation (21), then we have: R ˜ = γ ¯ κ C b . Thus, as an approximated average measure of the enhancement factor of the reaction due to the fact that the reactions take place into a pore, we may propose the relation
γ ¯ κ ˜ / κ ,
where κ ˜ is the effective velocity constant inside the pore, and κ is the velocity constant in a flat surface.

5.1. An Example: The Isomerization Reaction

In this subsection we will illustrate the capabilities of the theory by considering a simple isomerization reaction at the internal surface of the pore [14]. In this example, schematically represented in Figure 6, the particles of A enter the pore with concentration C b A . Some are adsorbed at the wall forming the reactive AS with concentration C s A :
A + S k A k A A · S ,
and therefore with reaction velocity
R ˜ A d s = κ ˜ a d s C b A C S K a d s C s A ,
where C S = C s 0 C s A C s B denotes the concentration of vacant sites in the Langmuir-Hinshelwood approximation, and K a d s is the equilibrium constant associated with the adsorption–desorption process of species A. Afterwards, the catalytic reaction transforms the reactive AS into the isomer B attached to the wall, BS, with concentration C s B :
A · S k S k S B · S ,
with the corresponding reaction velocity
R ˜ C a t = κ ˜ c a t C s A K c a t C s B ,
where K c a t is the equilibrium constant associated with the catalytic reaction at the surface of the pore.
Finally, the isomer B is desorbed and transported out of the pore, with concentration C b B , that is:
B · S k S k S B + S ,
for which the reaction velocity is given by
R ˜ d e s = κ ˜ d e s C s B K d e s C b B C S ,
where K d e s is the equilibrium constant associated with the desorption-adsorption process of the isomer B.
The dynamics of the catalytic process can therefore be described by the following two sets of evolution equations for the bulk and surface concentrations. For the reactive A we have
C b A t = 1 A x D b A C b A x R ˜ A d s ,
C s A t = 1 A x 4 π D s A γ w x A γ w C s A + R ˜ A d s R ˜ c a t .
The equations for the isomer B are in turn
C b B t = 1 A x D b A C b B x + R ˜ D e s ,
C s B t = 1 A x 4 π D s A γ w x A γ w C s B R ˜ D e s + R ˜ c a t .
Different predictions on the behavior of the reactive and product concentrations can be obtained depending on the slower step in the chain of processes of the heterogeneous catalysis. In Figure 7 we show the results of the catalytic model in which the distribution of active sites over the pore surface is inhomogeneous. In fact only three portions of active sites were considered with the aim to show that the concentration of molecules at the surface is inhomogeneous. Two cases were considered, with and without surface diffusion of A and B. As expected, surface diffusion helps to homogenize the distribution and enhances the total mass transport across the pore, see Ref. [31] for more details.

6. The Effective Diffusion Coefficient of Adsorbent and Non-Adsorbent Membranes

When a fluid crosses a porous medium, the flow is reduced due to the presence of the solid material. The causes of this reduction have been traditionally split in three factors. First, the reduction of effective volume available for the fluid; second, the increase of the path-length that the molecules have to travel due to the sinuosity of the pores and finally, the third factor which is related with the decrease of the effective flux due to the corrugation of the pores.
These factors are represented by three parameters which can be measured experimentally in uptake experiments. They are, respectively, the porosity ϕ defined as the ratio between the internal and total volume of the membrane; the tortuosity τ which is the average of the square ratio of the real path-length that the molecules have to travel and the longitudinal length of the membrane; and the constriction factor δ of a membrane which quantifies the reduction of the flow due to the presence of the walls. It is an experimentally well known fact that these parameters modify the effective diffusion coefficient D m of a membrane make up with non-adsorbent pore’s surface in the form
D m D 0 = ϕ τ δ 1 ,
where the inequality comes from the fact that the geometric parameters obey the corresponding inequalities ϕ , δ 1 and τ 1 .
The present theory allows one to calculate with detail the form in which the irregularity of the pore affects the effective flux inside the porous material and, therefore, it also allows to connect it with information that can be obtained from macroscopic measurements, see Figure 8. By means of simple conservation arguments provided in Ref. [30], it can be proved that the constriction factor of a porous material of non-adsorbent walls is given by
1 δ N A = D 0 D b ( z ) A ( z ) A ( z ) .
In this expression, the brackets represent the spatial average in the longitudinal coordinate z. We have added the subscript N A to emphasize that Equation (40) is valid for non-adsorbent membranes. Therefore, the constriction factor in Equation (40) together with the porosity and tortuosity, having their corresponding expressions in Ref. [30], help to predict the diminution of the flow in a non-adsorbent porous material. This expression is a general form of a previous expression intuitively obtained for the diffusivity in Ref. [48].

Adsorbent Membranes

In most of the practical cases, however, one is interested on membranes able to carry out adsorption–desorption processes. The interesting question now is to determine in which cases the effective membrane diffusion coefficient D m increases and in which decreases. The question is not obvious to solve a priori since an enhancement of the bulk diffusion may occur by the presence of surface diffusion effects, and the fact that the adsorption along the pore can increase the local concentration gradient inside the pore, accelerating the entrance of more fluid to the pore.
In order to consider the influence that the adsorption process and the irregularity of the geometry have in the measured diffusivity, one has to consider the total change in the two flows inside the channel: The flow due to bulk diffusion and which is originated by the external concentration gradient J b = D b C b x , and the flow due to surface diffusion that is owing to the internal variations of concentration in the adsorbed layer J s = 4 D s γ w x w C s γ . In mathematical terms, the reduced scheme we have used in Equations (16) and (29) allows to show that the total flow per unit of area is
J t = D b C b x 4 D s γ w x w C s γ .
As the total flow can be written macroscopically only on terms of an effective diffusion coefficient D t , and the total concentration C t = C b + C s as J t = D t ( x ) C t x , simple comparison of this equation with Equation (41) allows to obtain D t if the isotherm of the system C s ( C b ) is known. In this case and if the adsorption/desorption process is the rate limiting step in the catalytic reaction, it is possible to calculate the rate conversion factor λ = C s C b . With this information, the local effective diffusivity of the particles inside a pore of adsorbent walls is [18]
D t ( x ) = D b ( x ) 1 1 + λ ( x ) + 4 D s ( x ) γ 2 ( x ) λ ( x ) 1 + λ ( x ) .
Since λ > 0 for most of the known isotherms, the last equation establishes that the effective diffusivity of the fluid inside the pore is proportional to the bulk and surface diffusion coefficients D b and D s , and it can be enhanced or diminished depending on the intensity of the adsorption rate λ ( C s , C b ) . There are two facts that Equation (42) confirms: first, the effective diffusivity of particles depends upon the position along the pore; secondly, the diffusivity depends upon the internal concentration of bulk and adsorbed particles. More importantly, this internal diffusivity can be predicted if D 0 and D s are known in the limit of zero loading.
In these terms, the conservation principles used for obtaining the constriction factor δ in Equation (40) for a non-adsorbent membrane, can be easily generalized for an adsorbent one, and the more general expression for this parameter is just:
1 δ = D 0 D t ( z ) A ( z ) A ( z ) .
This constriction factor in the effective diffusion coefficient of a membrane in Equation (39), depends on the concentration of the adsorbed phase and therefore, it depends on the loading. This means that if the curves D m versus loading θ are known, one can establish the relative importance of the surface diffusion and the irregularity of the pore in the efficiency of the adsorption process [18]. Since our reduced model in Equations (16) and (29) allows to obtain with detail the internal concentration, it enables to establish how these curves change in terms of the corrugation of the pore and in terms of the intensity of the surface diffusion, this will be illustrated in the following section.

7. How to Use This Theory in Uptake Experiments

In previous sections we have shown how the speed and efficiency of the mass transport process through a membrane are related to the shape of the pores which make up the membrane. If the shape of the pores is known, then by using the average transport equations Equations (16) and (29) it is possible to predict with a good degree of approximation, the amount and distribution of the material adsorbed as well as its concentration in the bulk.
Nonetheless, most practical situations impose the inverse problem, that is, the necessity of finding out some general qualitative characteristics of the pores of a material from, for instance, uptake experiments. Without pretending to be exhaustive in this issue, in the present section we will illustrate how this structural or geometrical information can be extracted from experiments by fitting the obtained data with the numerical solution of the Equations (16) and (29). In order to do this, we will consider two examples.

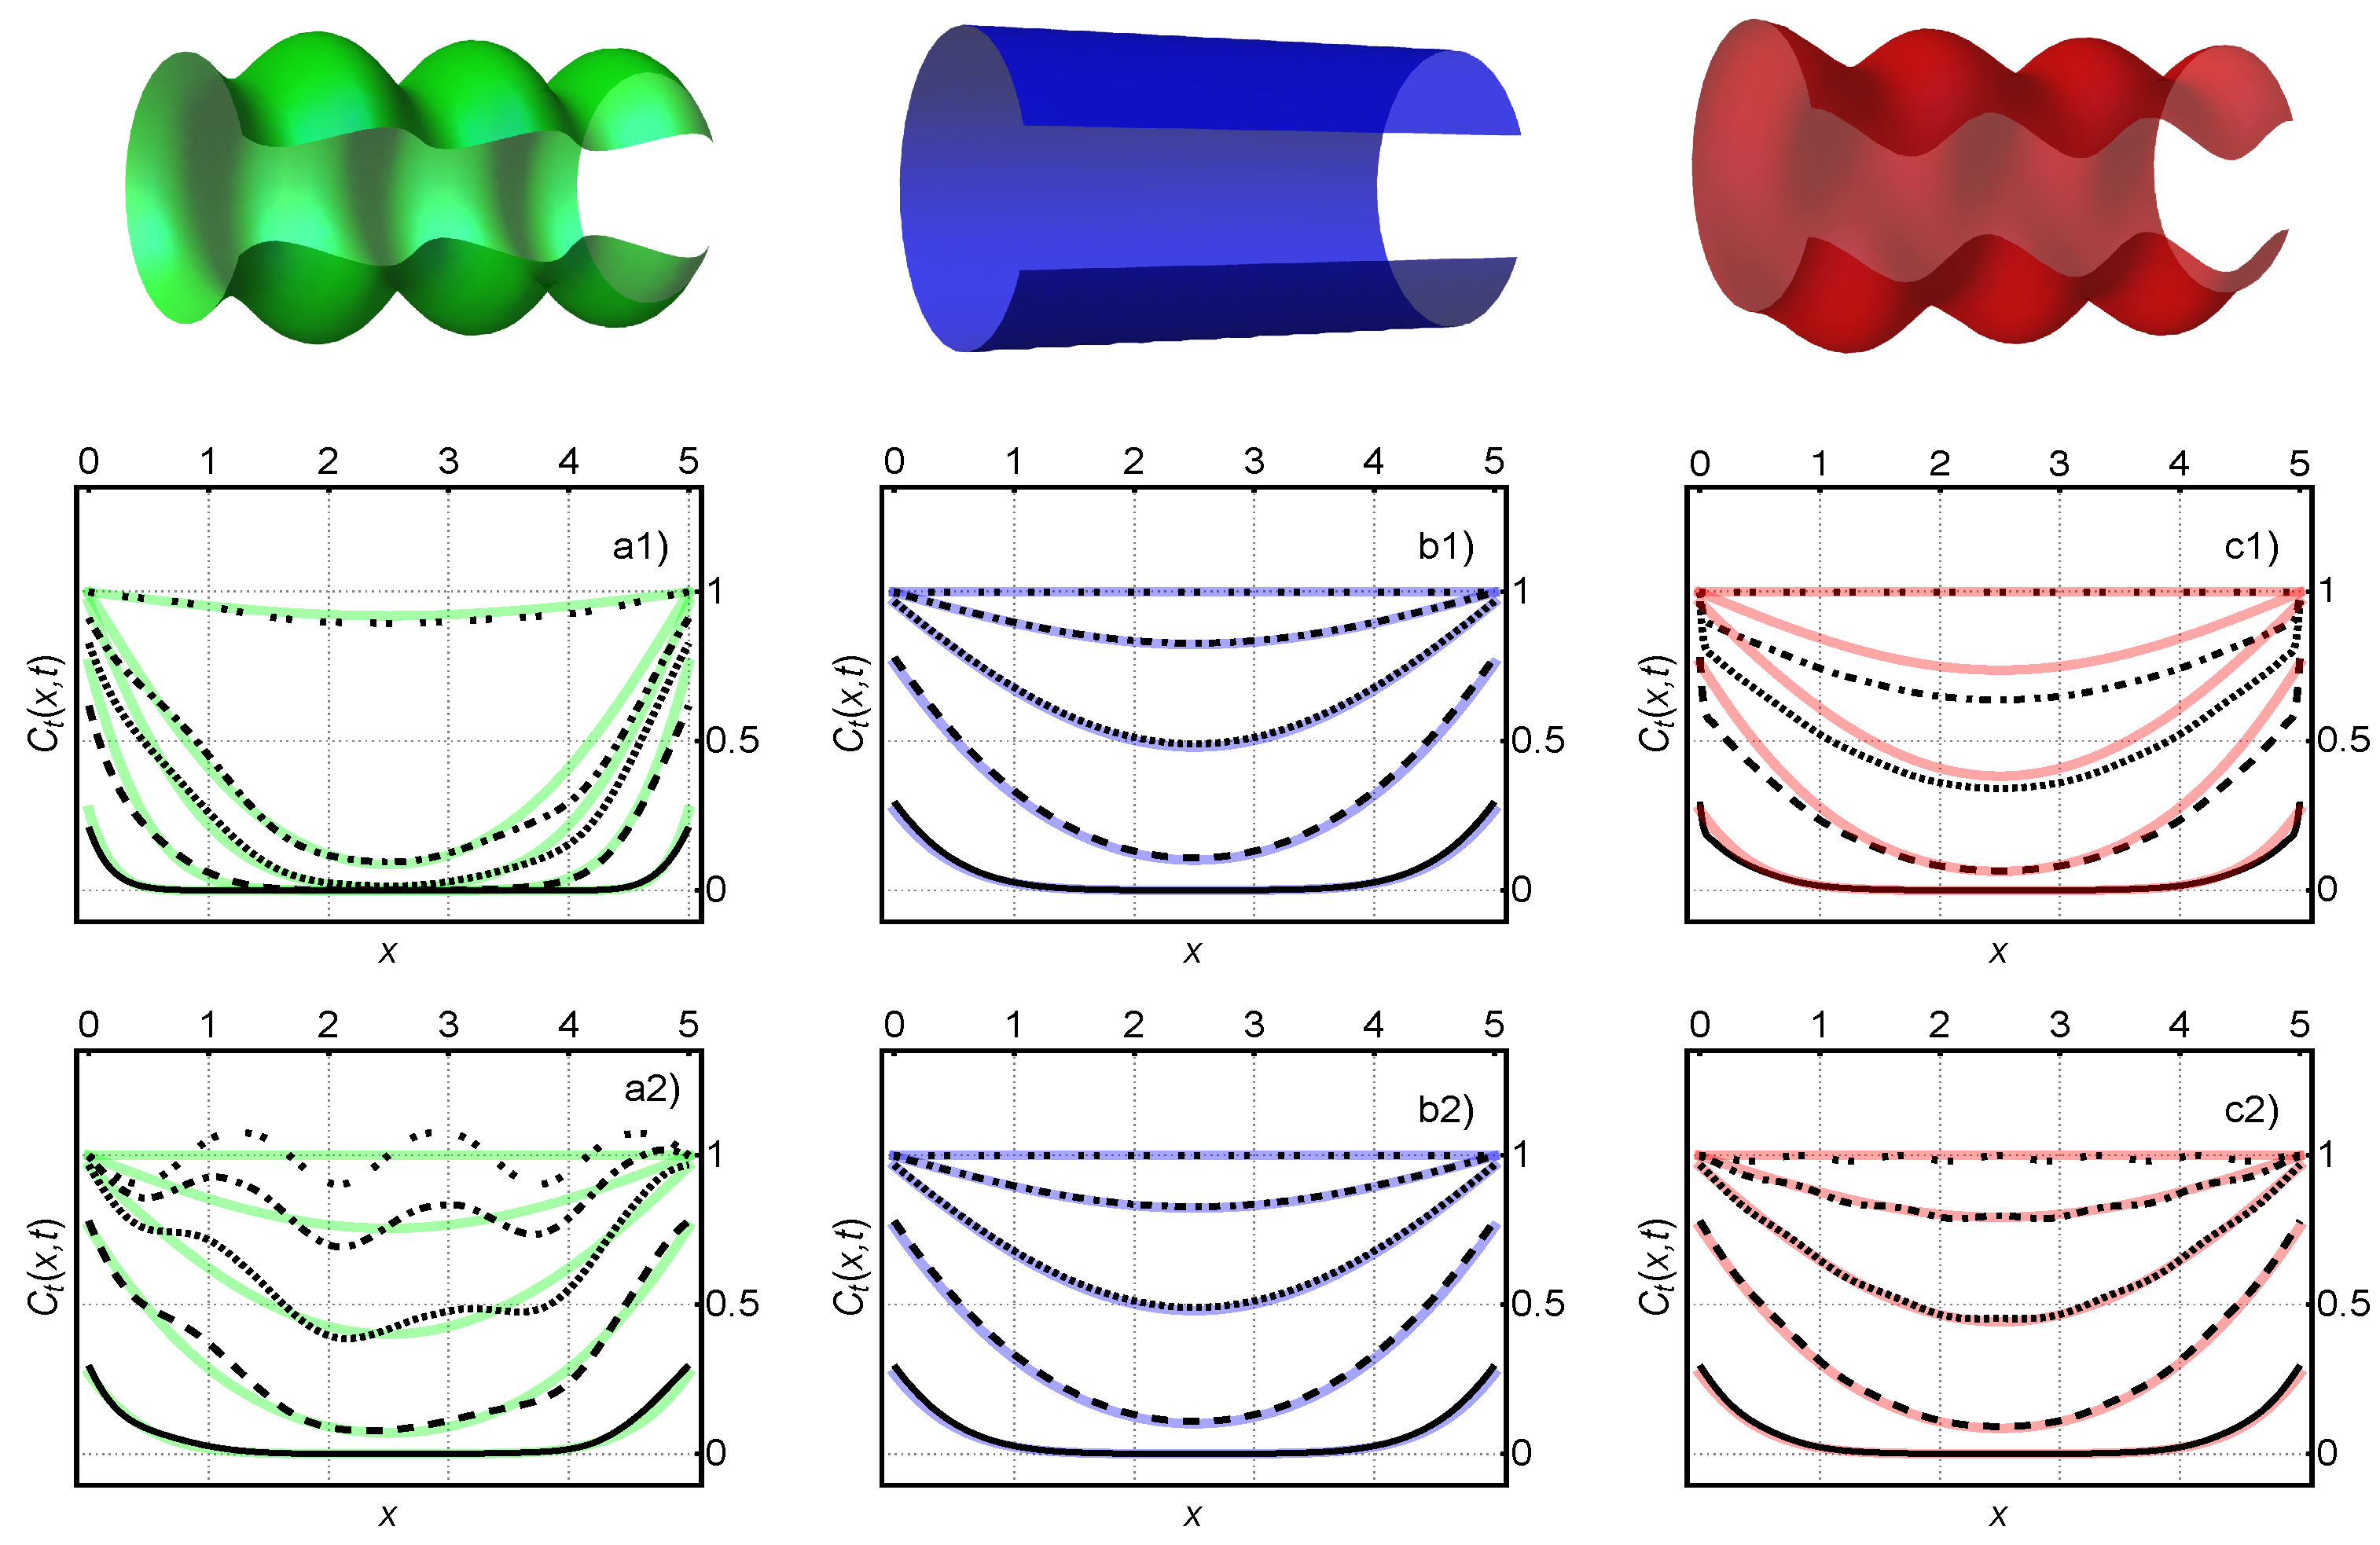
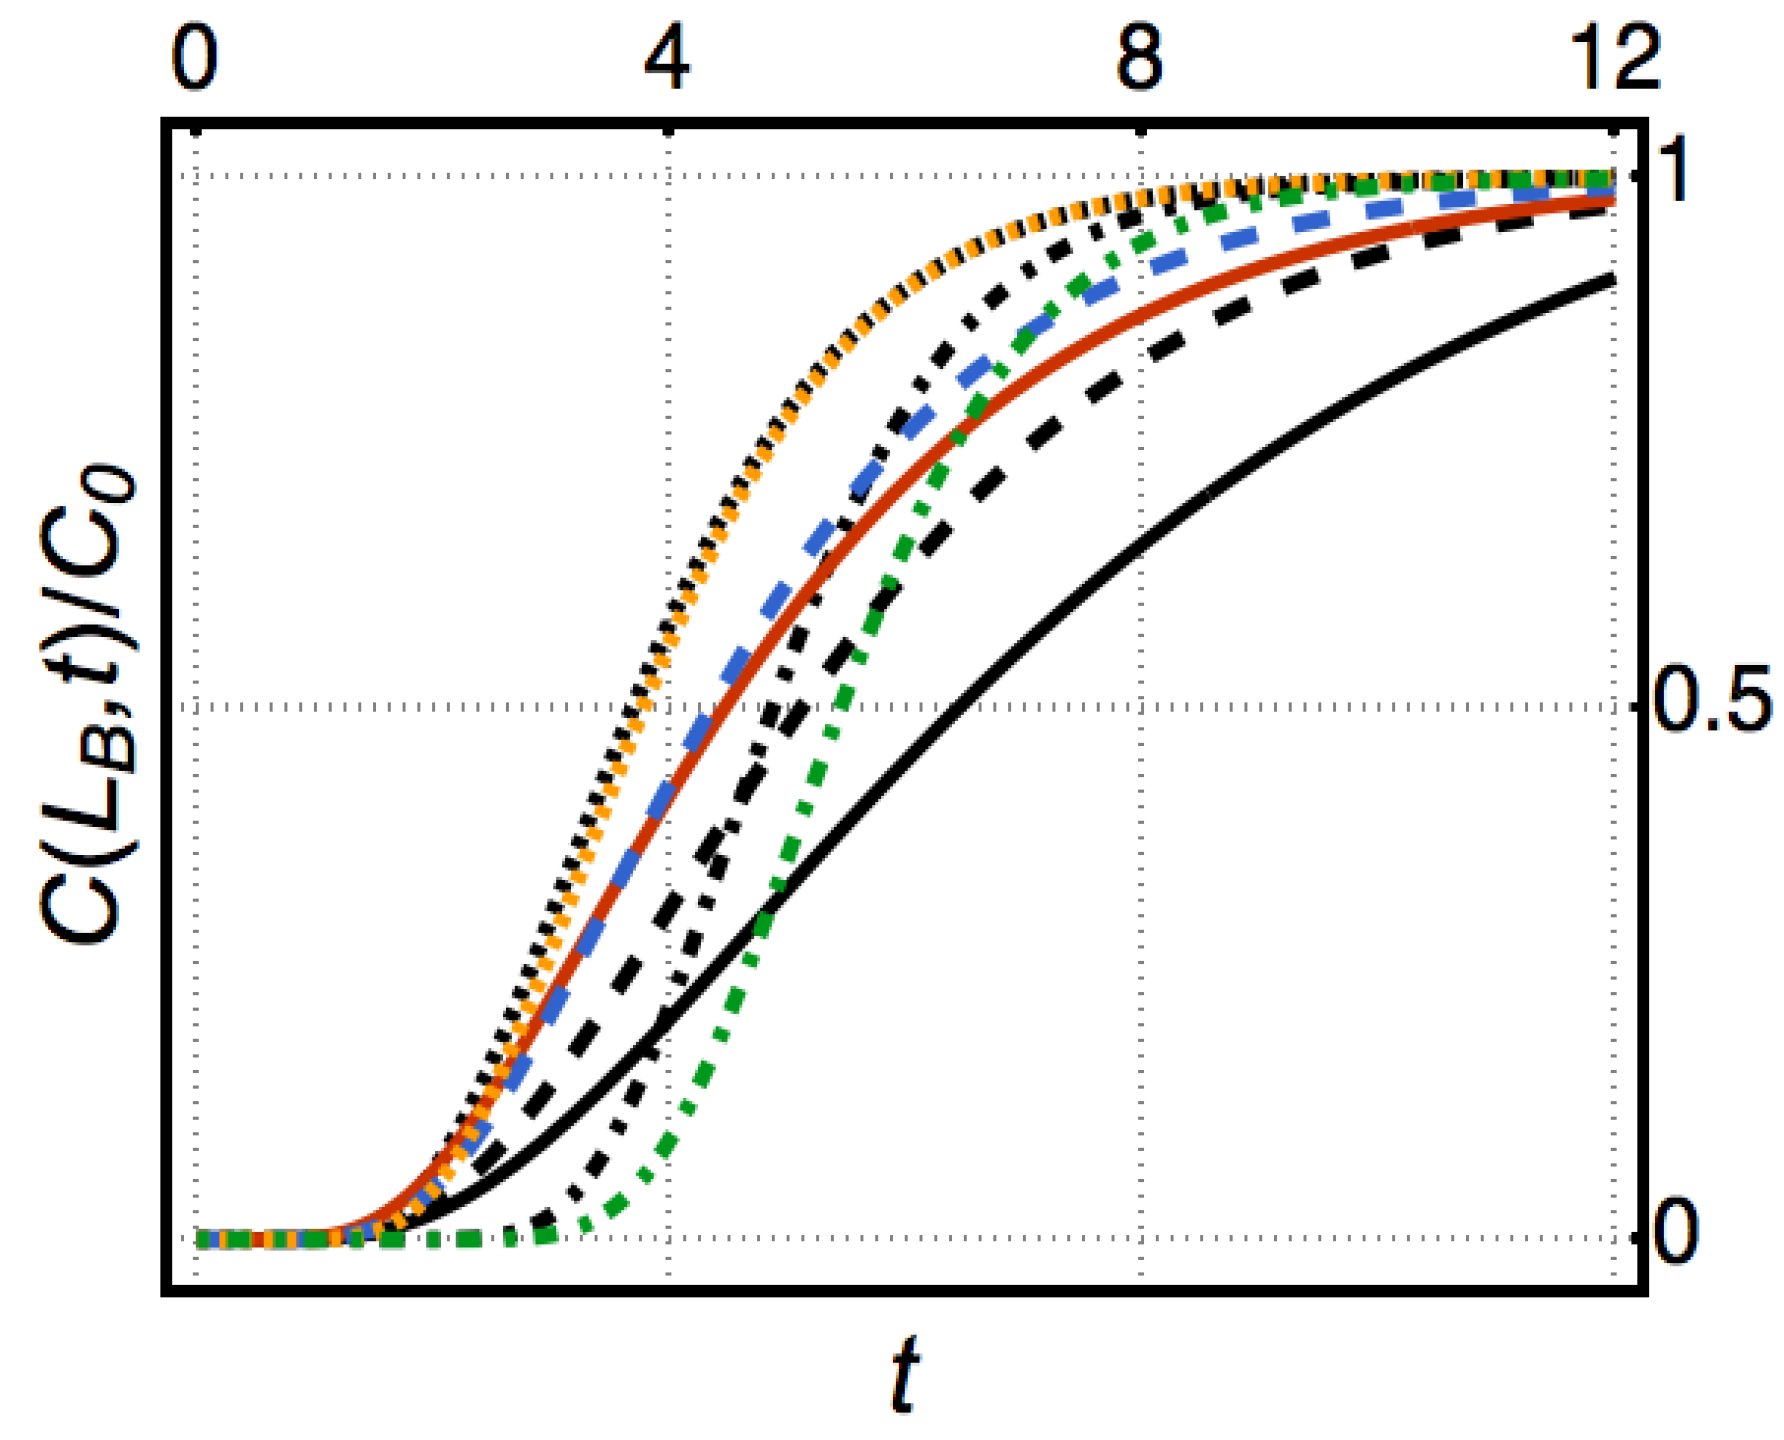
7.1. Breakthrough Curve and Internal Pore Geometry

As a first example, consider the experiment of a fluid adsorbed on a column of a porous material in which the pores have, approximately, the same geometric shape and an homogeneous distribution of adsorption sites. In this experiment a fluid penetrates the column from one side and diffuses towards the exit side. If the fluid is partially adsorbed at the surface of the pores, then the rapidity with which the bulk concentration at a certain height of the column reaches its saturation value may be different depending on the shape of the pores. This follows from the fact that the effective diffusivity of the membrane depends on the balance between the bulk and the surface concentrations. These concentrations are implicit functions of the adsorption velocity inside the column which, in turn, is partially determined by the geometry of the pores and the distribution of the active sites.
The process already described can be understood with the help of a breakthrough curve, in which the concentration at a certain point is measured as a function of time. The important data are the initial time, at which the increase in concentration begins, and the slope of the curve which is critically determined by the balance between the characteristic times associated with the volumetric diffusion and the reaction of adsorption.
Figure 9 shows the numerical solution of Equation (16) for a simple adsorption process at the surface of the pore. Each curve represents the same diffusion-adsorption dynamics for a winding (black lines) and a tortuous (color lines) pores, see details in the caption of the figure and in Appendix A. A significative difference among the breakthrough curves of materials having straight (or near straight) pores is clear, when compared with those emerging from membranes in which the pores have important constrictions or sinuosities. Therefore, small changes on the geometry can be detected in principle in these experiments.

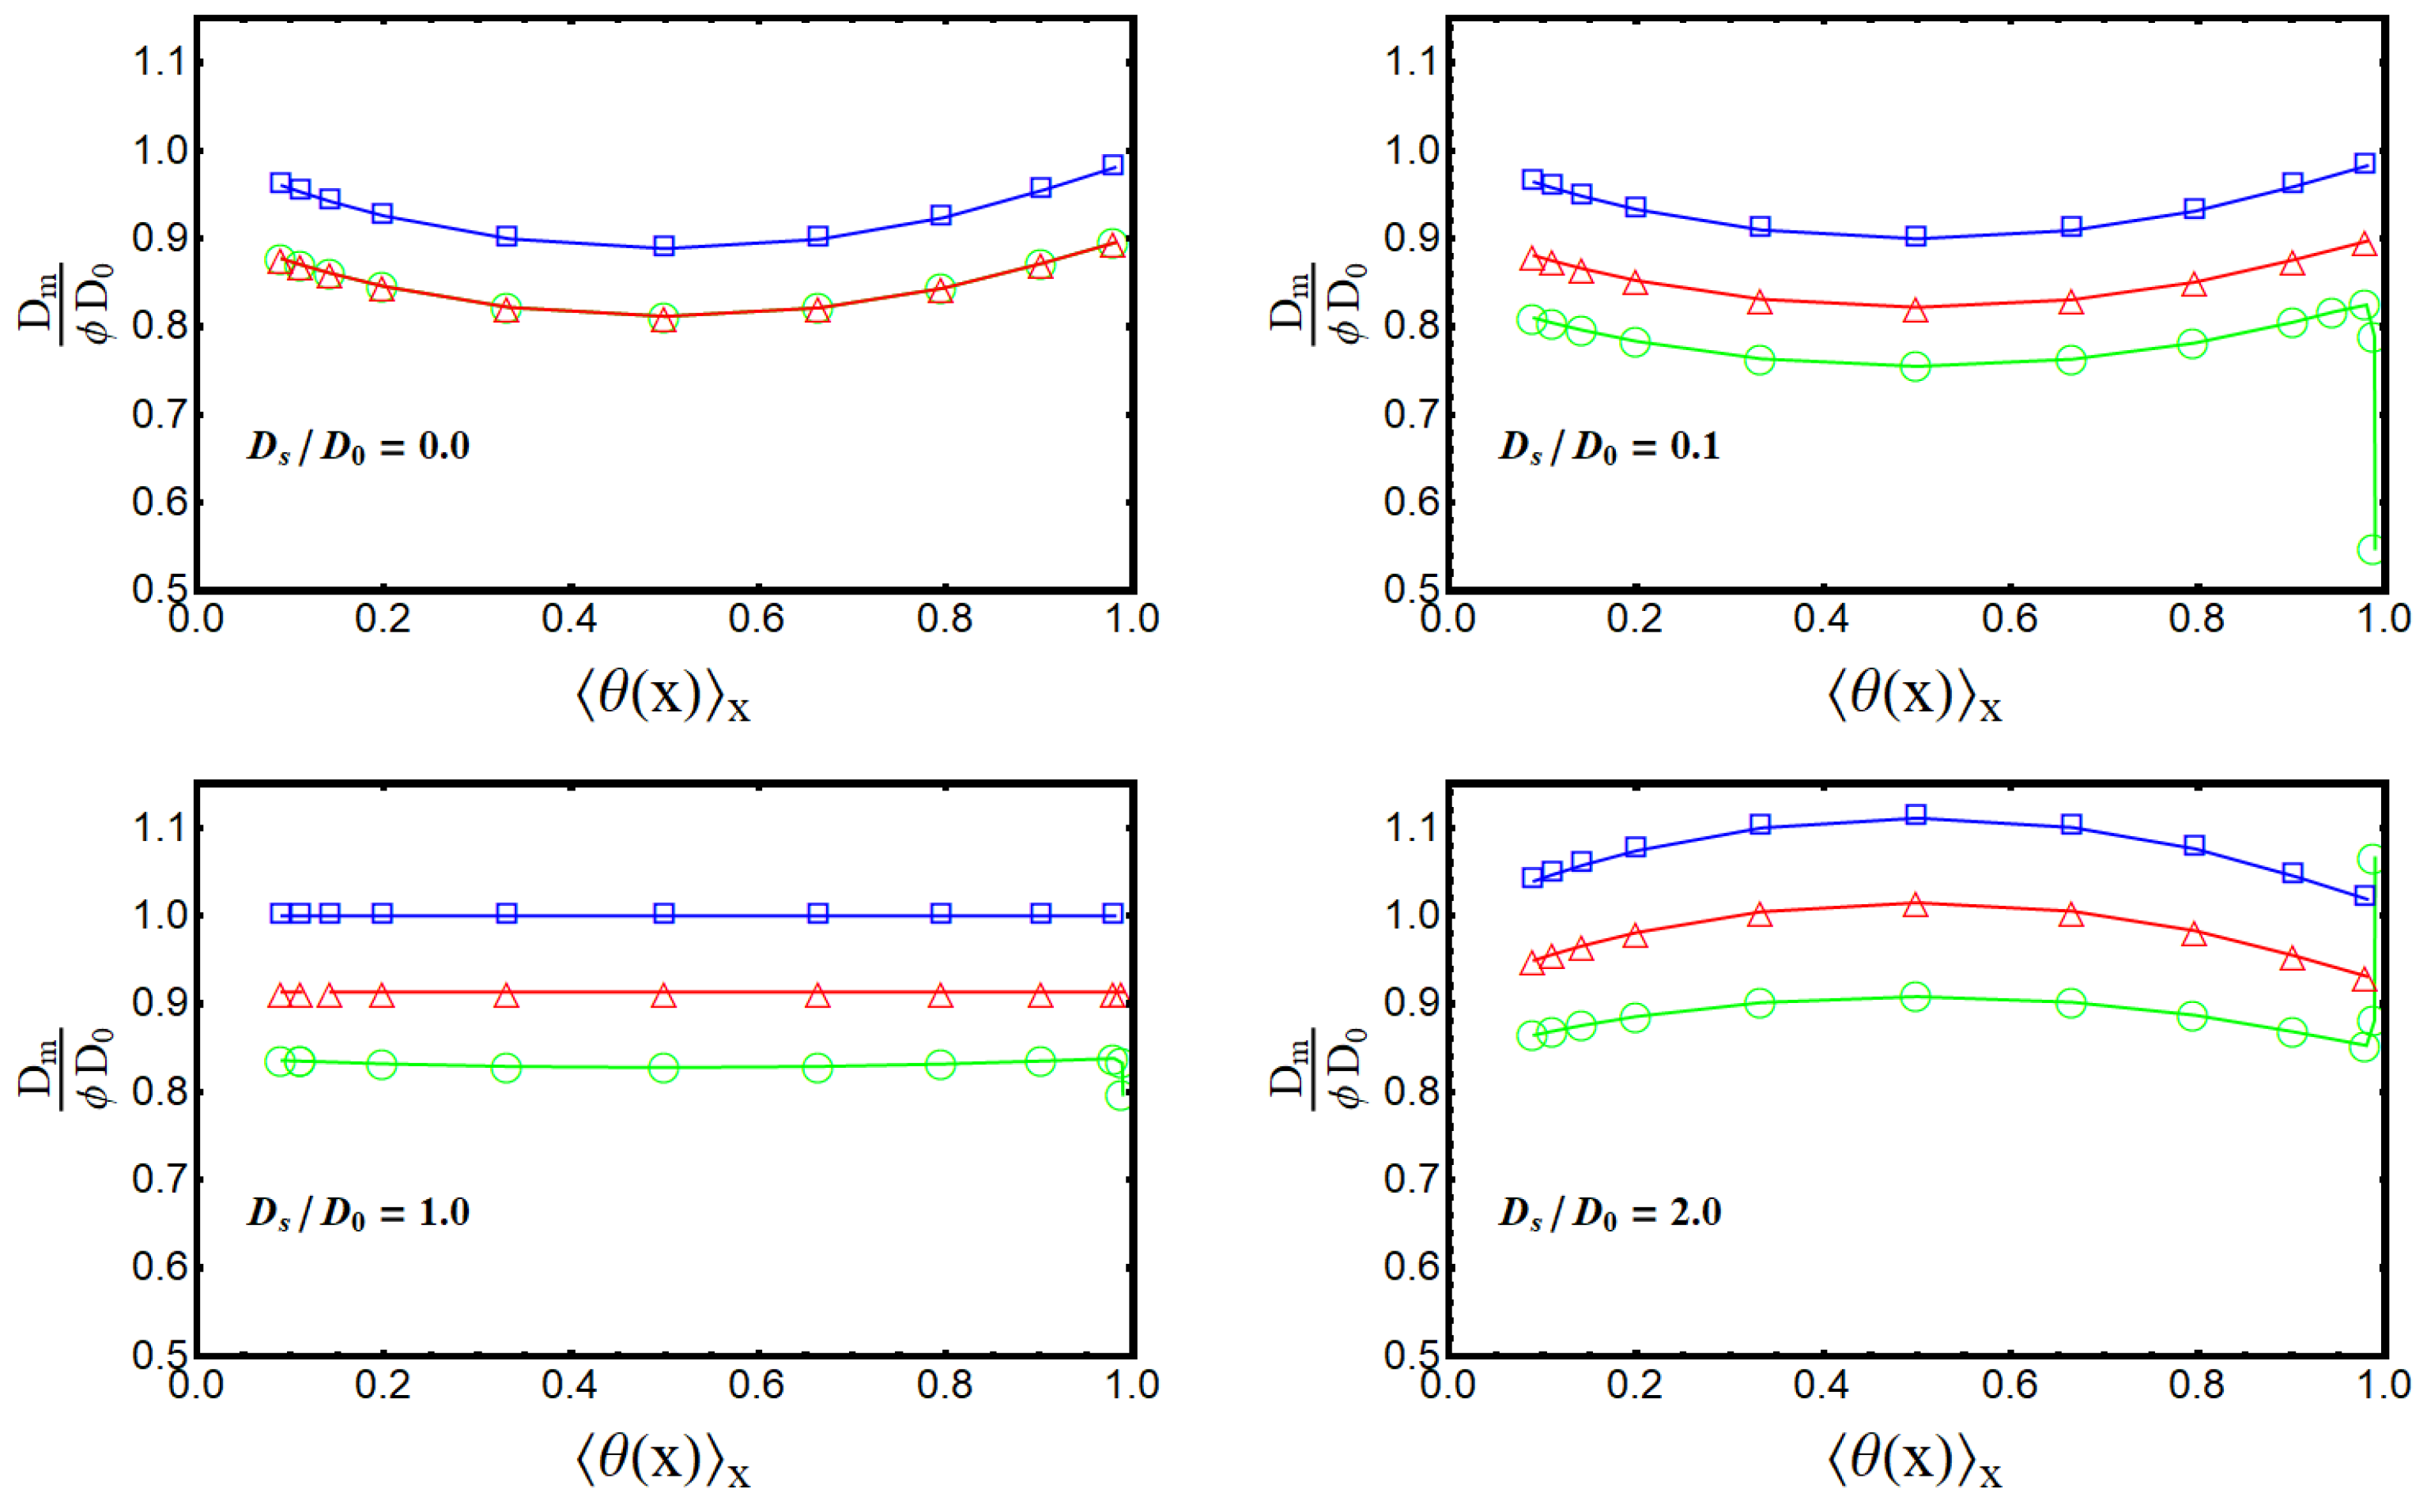
7.2. Effective Diffusivity of the Membrane as a Function of the Average Load

The second example consists on a similar experiment with a porous column. However, in this case we will consider the possibility of modifying the chemical properties of the surface of the pore by some procedure without essentially changing its internal geometry. Depending on the active materials added to the surface of the pores in the membrane, the density and distribution of active sites of adsorption will be increased or reduced, thus changing the average load that the column can adsorb.
In this experiment it should be possible to measure the time evolution of the spatial profiles of the total concentration ( C t = C b + C s ) inside the membrane, as recent experiments in pulsed field gradient NMR techniques have shown [34,49,50]. The resulting curves, such as those reported in Ref. [51] may be reproduced with our theory as it follows from Figure 8.
Furthermore, since the spatial profile of the total concentration is related with the effective diffusion coefficient of the membrane, then by changing the properties of the surface it is possible to change the relationship between the effective diffusion coefficient of the membrane and the average adsorbed load. Thus, from independent measurements it should be possible to establish the dependence of the effective diffusion of the membrane in terms of the average adsorbed load.
The same can be done by using as an starting point the Equations (16) and (29). These equations can be solved in order to find the total mass concentration within the pore as a function of position and time. Then, by using the parameter λ = C s / C b T as well as Equations (41) through (43), it is possible to find the effective diffusion coefficient associated with the total mass concentration, i.e., the effective diffusion coefficient of the membrane, D m . The Figure 10 shows the predictions for these experiments, that is, the value of the effective diffusion coefficient as a function of the spatially averaged load Θ ( x ) x . Each frame in the figure represents an experiment with three different columns, corresponding to pores having different geometries and the same fixed value of the surface diffusivity. Each point of the curve represents a different value of the adsorption rate which reflects the changes in the number of active sites within the membrane and therefore, a different load capacity.
The Figure 10 provides some qualitative consequences about the relationship between the shape of the pores and the surface diffusion. From the figure, it follows that the surface diffusion increases the net effective diffusivity of the particles relative to the state where the particles cannot move along the surface. Since this seems to happen especially for intermediate or high loads, a change in the concavity of the curve may be related to a change in the surface diffusion of the process. For high surface diffusivities and loads, adsorbed particles slow down the total diffusion due to their mutual interactions. The other mechanism associated with the change of the shape of these curves is directly related with the shape of the pore. Sinuous and tortuous pores tend to reduce the effective diffusion coefficient with respect to a straight cylindrical pore, as expected. An important consequence of this effect is that, although both irregular pores have the same effective volumetric diffusion coefficient, since one pore has less surface area than the other, it has a lower effective diffusion coefficient.
As concluding remarks of this section, we want to emphasize that from these two examples, and their multiple variants, it is possible to infer that although it is not entirely possible to predict the shape of the pores or the value of the surface diffusion coefficient solely from the results of the averaged equations, it is possible to establish some general and qualitative characteristics about the internal structure of the pores making up the membrane. It goes without saying that a systematic study on this problem will be extremely interesting, and that our theory provides with a theoretical tool to solve it.

8. Summary and Conclusions

Porous materials are of paramount importance nowadays, because the narrowness of the empty space inside them and its enormous internal surface. These two characteristics make them very attractive for a wide range of applications, ranging from drug delivery to oil refination and the elaboration of proton exchange membranes. Their effectiveness is based on having very fine pores that control the diffusion, and thereby amplify the speed of the chemical adsorption and conversion that occur within it. Due to this relevant role, it is therefore crucial to understand how all these processes depend on the geometry of the pores.
In this work, we generalized previous studies on the single dimensional description of the diffusive mass transport across two dimensional pores [16,18,21,30,31] to a three-dimensional case with axial symmetry. The key idea is that, on averaging the three-dimensional mass balance equation along the transport direction, one obtains two single-dimensional mass conservation equations, for volumetric bulk and surface concentrations, providing with a sound theoretical basis in order to describe how bulk and surface diffusion are affected by adsorption and desorption processes, as well as by catalytic conversion within the space defined by the irregular geometry of the pores of the material. In this aspect, the theory represents a powerful generalization of the Shaphiro–Brenners’s theory for macrotransport processes, which was formulated for regular domains and was restricted to low concentrations. Our theoretical framework constitutes therefore a bridge between the microscopic detail of the pore and the macroscopic measurements of the experiment, a versatility that will allow in the future to contribute to the design of porous materials such as membranes with specifically optimized physical-chemical properties.
Beside the virtues already mentioned and as far as we know, the present work constitutes the first analytical approach to the study of surface diffusion in irregular porous media. The tremendous generality of the pair of equations we have derived, Equations (16) and (29), allows to establish the analytical expression of two coefficients widely used in the industry to determine the efficiency of chemical reactors, namely, the mass transfer coefficient and the effectiveness factor, both of them depending on the constriction and tortuosity of the pore. The relationships that we have established between the geometry and these macroscopic parameters, are given through the generalized Thiele modulus of a porous medium, as well as its relation, at the pore scale, with the effective diffusion coefficient of a membrane, a quantity measurable in experiments. These parameters may be used to quantify the efficiency of artificial and structured porous media, as well as in porous materials such as some zeolites.
Additionally, we have explained for the first time how surface diffusion increases the effectiveness of catalysis. In practice, our study predicts how to design artificial nano-membranes based on conical pores that optimize sieving, transfer and catalytic conversion. This allows to adjust the design of the membrane in function of the results that the industrial applications require, which is of capital importance nowadays, especially when the perspective on membrane 3D printing is emerging as a very promising fabrication technique [32].
The theory we have postulated can be used as a tool for modeling the distribution and diffusivity of particles in the bulk and on the surface of irregular pores, when the processes involved in heterogeneous chemistry take place simultaneously. Therefore, Equations (16) and (29) constitute a very powerful theoretical framework in the description of chemical reactors formed by membranes, where all these processes occur simultaneously in the conversion of reactants into products through a catalytic reaction on the surface.
The great advantage of using our theoretical framework is that the microscopic quantities that refer to the internal detail of the flow, and the interactions within the irregular pore, can be translated into macroscopic variables that are currently measured in experiments. This makes it of huge practical importance.

Author Contributions

Conceptualization, I.S.-H. and A.L.-D.; mathematical analysis and simulations I.S.-H., S.I.H., C.G.-A. and A.L.-D.; investigation I.S.-H., S.I.H., C.G.-A. and A.L.-D.; writing—review and editing, I.S.-H., S.I.H., C.G.-A. and A.L.-D.; project administration, S.I.H.; funding acquisition, I.S.-H. and S.I.H.

Funding

This research was funded by UNAM-DGAPA grant numbers PAPIIT IN116617, IN117419, IA104319 and LANCAD-UNAM-DGTIC-276.

Conflicts of Interest

The authors declare no conflict of interest.

Appendix A

Appendix A.1. Figure 1

In order to simplify the description, in these work we have studied pores which can be reduced to the well known two-dimensional case, whose three-dimensional equivalents are plotted in Figure 1 [21]. A two dimensional pore is constructed by two walls w 1 ( z ) and w 2 ( z ) . In this case, the width and the middle line are given by w ( x ) = w 2 ( z ) w 1 ( z ) and h ( z ) = [ w 1 ( z ) + w 1 ( z ) ] / 2 , respectively. The effective bulk diffusion coefficient is then given by the generalized Bradley-Zwanzig [23] diffusion coefficient equivalent to Equation (15) in two dimensions:
D ( z ) = D 0 1 + h z 2 ( z ) + w z 2 ( z ) 12 .
The four pores of length L = 5 plotted are obtained with the data of Table A1.
Table A1. Values of the parameters used to build the four pores used in the main text.
Labelw1 (z)w2 (z)
Tortuous 0.2 sin 6 π z L 1 0.2 sin 6 π z L
Winding 0.2 sin 6 π z L 1 0.2 sin 6 π z L
Straight01
Conicalm z1 + m z
In the plotted example in Figure 1, m = 0.1 .

Appendix A.2. Figure 2

Comparison of the concentration profiles inside two different pores for pure diffusion (left) and diffusion-adsorption (right) processes. The concentration for the tortuous (black lines) and winding (color lines) pores which have the same effective diffusion coefficient D b ( z ) = D 0 1 + 0.19 cos 2 6 π z 5 , have been plotted for four different times (continuous line t = 0.0 , dotted line t = 5.0 , dot-dashed line t = 10.0 , dashed line t = 50.0 ). Left: In a first process, only bulk diffusion in the two pores is taken into account. We solved Equation (16) with D 0 = 1 and ρ ˙ = 0 . We plot the concentration as function of time considering that C b ( z = 0 ) = 1 and C b ( z = L ) = 0 . As expected, the pure bulk diffusive dynamics is essentially the same in both pores. Right: In a second process, an adsorption reaction in the surface with rate ρ ˙ = 0.05 is now included. In this case, the difference of the enhancement factor ( γ ¯ = 1.3 ) of the tortuous pore makes the adsorption process more effective than the winding one ( γ ¯ = 1.05 ). This is confirmed by the fact that less concentration of particles reaches the exit side of the pore in the winding geometry [21].

Appendix A.3. Figure 3

The mass transfer coefficient k is the proportionality constant between the flux at the entry and the difference of concentration between the two ends of the pore [14]. Therefore, we solve Equation (16) for the mentioned geometries with the boundary conditions C ( z = 0 ) = C 0 = 1 and C ( z = L ) = 0 at the ends of the pore, and J ( z = 0 ) = k ( C 0 0 ) . The reference value k 0 = D 0 / L is obtained when there is no adsorption, and the pore is straight. In contrast, the effectiveness factor η is the ratio between the amount of mass entering the pore, compared with the mass that would be adsorbed if the entire pore were exposed to the external concentration ( C 0 = 1 ).
In both cases, analytic expressions can be obtained from the reduction scheme for conical pores [16] changing the rate of the liner adsorption in Equation (16) as ρ ˙ = κ C b ( z , t ) . The four pores can be obtained with R ( z ) = 1 + m z , with m = 0.5 (red), 0.2 (orange), 0 (green) and 0.2 (blue), respectively. The length of these pores is L = 2 .

Appendix A.4. Figure 5

Langmuir adsorption dynamics inside the tortuous (black lines) and winding (color lines) pores in the presence of surface diffusion was calculated by solving Equations (37) with D 0 = 1 , D s = 0.1 and the Langmuir reaction in Equation (32) with κ ˜ a d s = 1 and K a d s = 0.3 . In this case R c a t = 0 and we use periodic boundary conditions.
The solid lines in Figure 5a,b show the long-time (equilibrium) bulk concentration C b ( x ) and diffusion current J b ( x ) , respectively. In the same figures, the dashed-lines show the long-time (equilibrium) surface concentration C s ( x ) and diffusion current J s ( x ) . The dotted-lines in Figure 5a,b represent the long-time (equilibrium) total concentration C t = C b + C s and current J t = J b + J s . Black lines correspond to the tortuous pore, color lines to the winding pore. In Figure 5c we show the coverage fraction θ = C s / C s 0 , with C s 0 = 1 for the tortuous (black lines) and the winding (red lines) pores.
The adsorbed particles tend to segregate producing an accumulation in the wider regions of the pore. As it can be seen, the different diffusivities in the bulk and in the surface particles can generate internal fluxes inside the pore, since surface and bulk particles tend to move to the narrower and wider parts of the pore, respectively. As it is expected, this effect is more visible in the tortuous pore than in the winding one, where both concentrations are nearly homogeneous [31].

Appendix A.5. Figure 7

Evaluation of the heterogeneous catalysis process described in Equations (37) and (38) for the tortuous (upper row) and sinuous (bottom row) pores with flow of A entering by the left to the pore [ C b A ( z = 0 ) = 1 , C b A ( z = L ) = 0 ], null concentration of B at the exterior [ C b B ( z = 0 ) = C b B ( z = L ) = 0 ], and no surface concentration of B or A [ C s A ( z = 0 ) = C s A ( z = L ) = C s B ( z = 0 ) = C s B ( z = L ) = 0 ]. The bulk and diffusion coefficients are D 0 = 1 and D s = 0.1 . The coefficients of the different reactions in Equations (32) , (34) and (36) are κ ˜ a d s = κ ˜ c a t = κ ˜ d e s = 1 , K a d s = K d e s = 0.3 , and K c a t = 0.3 . The position of the active sites in the reduced scheme is controlled by the function f ( z ) which is zero almost everywhere, except in the points z i indicated by the dashed lines in the Figure. The comparison is done among the active sites at the gray gridlines located at: { z i } = { 5 12 , 25 12 , 15 4 } (black lines), and those located at the orange gridlines defined by: { z i } = { 5 4 , 35 12 , 55 12 } .
The pore and the respective position of the active sites is given in the first row of this figure. Figure 7a (tortuous) and c (sinuous) show the surface steady-state concentrations of A, B [AS (dotted lines) and BS (dashed lines)] as well as the total one concentration obtained in each case [SC (solid lines)]. It is confirmed the increase of particles B near the active sites of catalysis. The Figure 7b (tortuous) and d (sinuous) show the flux of A (in bulk and surface entering the pore), and the flux of B exiting the pore. From this model study it follows that the active sites near the throats (orange grid lines) increase the conversion process in the tortuous pore, since more particles of A are being converted into B [31]. Surface flow behavior is more sensitive on the position of the active sites for the tortuous pore than for the sinuous one.

Appendix A.6. Figure 8

We simulate the diffusion and adsorption processes given by Equations (37), with a Langmuir adsorption in Equation (32) in the winding, straight and tortuous pores depicted below. In each case, the different lines correspond to different times, showing the filling process with boundary conditions C t ( z = 0 ) = C t ( z = L ) = 1 . The dashed lines depict the internal concentration by using the microscopic approach, provided by the reduced model we present in Equations (16) and (29). The parameters used were D 0 = 1 , κ ˜ a d s = 0.1 , K a d s = 1 . In the upper row D s = 0 , and in the bottom one D s = 1 . The solid lines represent the macroscopic approach as the result of using the most elemental one dimensional diffusion Equation (12) with the same boundary conditions, and using the effective diffusion coefficient D m as predicted by Equation (39) in Ref. [18]. As it can bee seen, the results derived from all the microscopical details are well captured by the macroscopic diffusion coefficient.

Appendix A.7. Figure 9

Breakthrough curves obtained from solving Equation (16) for a simple linear adsorption process given by ρ ˙ = r a C b ( z ) with r a the adsorption rate and D 0 the diffusion coefficient. The pores considered are the winding (black lines) and tortuous (colour lines) pores with length L = 5 . The boundary conditions consist of fluid entering at the left ( C b ( z = 0 ) = 1 ), and exiting at the right ( C b ( z = L ) = 0 ). The values of the constants (in arbitrary units) were r a = 0 and D 0 = 1 for the solid lines, r a = 0.1 and D 0 = 0.75 for the dashed lines, r a = 0.4 and D 0 = 0.5 for the dotted lines, and r a = 1.0 and D 0 = 0.1 for the dash-dotted lines. In order to obtain the breakthrough curve, the temporal increasing of the concentration is measured at z = 4.5 . Our theory predicts that a small difference on the slope of these curves can be the result of purely geometrical changes, and the constriction and sinuosity of the pores can be reflected in this type of curves. [16].

Appendix A.8. Figure 10

Curves measuring the effective diffusion coefficient D m as a function of the loading. Each point in these plots corresponds to the solution of Equations (37), for the geometry and surface diffusion coefficient indicated. The fixed parameters are D 0 = 1 and κ ˜ a d s = 0.1 . For the horizontal axis, the changes in the average loading θ ( X ) X are obtained by averaging the surface concentration along the domain. Each point corresponds to a different value of K a d s which modifies the adsorption process and the amount of particles attached to the surface. For the vertical axis, the changes in K a d s modify the ratio of adsorption λ , changing the effective diffusion coefficient in the local scale in Equation (42) and, therefore modifying D m / D 0 in Equation (40). For the represented case, the rate K a d s was varied between 0.01 and 1 approximately.
As it is expected, the tortuous geometry decreases the effective diffusion coefficient respect to the straight pore, whereas the winding pore constitutes a middle case. Be aware how the surface diffusion augments the transport properties of the pore. Therefore, our theoretical framework allows us to estimate some qualitative aspects of a membrane, when taking as reference one with straight pores [18].

References

  1. Taylor, G.I. Dispersion of soluble matter in solvent flowing slowly through a tube. Proc. R. Soc. Lond. Ser. A Math. Phys. Sci. 1953, 219, 186–203. [Google Scholar]
  2. Aris, R. On the dispersion of a solute in a fluid flowing through a tube. Proc. R. Soc. Lond. Ser. A Math. Phys. Sci. 1956, 235, 67–77. [Google Scholar]
  3. Brenner, H. Macrotransport Processess; Butterworth-Heinemann: Boston, MA, USA, 1993. [Google Scholar]
  4. Ibrahim, H.; Hassan, H.; Mekhamer, H.; Kenawy, S. Diffusion and sorption of Cs+ and Sr 2+ ions onto synthetic mullite powder. J. Radioanal. Nucl. Chem. 2018, 319, 1–12. [Google Scholar] [CrossRef]
  5. Millhauser, G.L.; Salpeter, E.E.; Oswald, R.E. Diffusion models of ion-channel gating and the origin of power-law distributions from single-channel recording. Proc. Natl. Acad. Sci. USA 1988, 85, 1503–1507. [Google Scholar] [CrossRef]
  6. Wijmans, J.; Baker, R. The solution-diffusion model: A Review. J. Membr. Sci. 1995, 107, 1–21. [Google Scholar] [CrossRef]
  7. Yan, C.; Liu, J.; Liu, F.; Wu, J.; Gao, K.; Xue, D. Tube formation in nanoscale materials. Nanoscale Res. Lett. 2008, 3, 473–480. [Google Scholar] [CrossRef]
  8. Martínez-Balbuena, L.; Hernández-Zapata, E.; Santamaría-Holek, I. Onsager irreversible thermodynamics of the dynamics of transient pores in spherical lipid vesicles. Eur. Biophys. J. 2015, 44, 473–481. [Google Scholar] [CrossRef]
  9. Wu, R.; Liao, Q.; Zhu, X.; Wang, H. Pore network modeling of cathode catalyst layer of proton exchange membrane fuel cell. Int. J. Hydrog. Energy 2012, 37, 11255–11267. [Google Scholar] [CrossRef]
  10. Stavarek, P.; Vajglova, Z.; Kristal, J.; Jiricny, V.; Kolena, J. Self-sustained oscillations of temperature and conversion in a packed bed microreactor during 2-methylpropene (isobutene) hydrogenation. Catal. Today 2015, 256, 250–260. [Google Scholar] [CrossRef]
  11. Adler, P. Porous Media: Geometry and Transports; Elsevier: Amsterdam, The Netherlands, 2013. [Google Scholar]
  12. Otero, J.A.; Mazarrasa, O.; Villasante, J.; Silva, V.; Prádanos, P.; Calvo, J.I.; Hernández, A. Three independent ways to obtain information on pore size distributions of nanofiltration membranes. J. Membr. Sci. 2008, 309, 17–27. [Google Scholar] [CrossRef]
  13. Carberry, J.J.; Varma, A. Chemical Reaction and Reactor Engineering; CRC Press: Dover, NY, USA, 2001. [Google Scholar]
  14. Fogler, H.S. Elements of Chemical Reaction Engineering; Prentice-Hall International: London, UK, 1999. [Google Scholar]
  15. Glavatskiy, K.S.; Bhatia, S.K. Effect of pore size on the interfacial resistance of a porous membrane. J. Membr. Sci. 2017, 524, 738–745. [Google Scholar] [CrossRef]
  16. Ledesma-Durán, A.; Hernández Hernández, S.I.; Santamaría-Holek, I. Effectiveness Factor and Mass Transfer Coefficient in Wedge and Funnel Pores Using a Generalized Fick–Jacobs Model. J. Phys. Chem. C 2016, 120, 29153–29161. [Google Scholar] [CrossRef]
  17. Seetha, S.; Manickam, J.G.; McCutcheon, J.R. Pore structure characterization of asymmetric membranes: Non–destructive characterization of porosity and tortuosity. J. Membr. Sci. 2014, 454, 549–554. [Google Scholar]
  18. Ledesma-Durán, A.; Hernández, S.I.; Santamaría-Holek, I. Effect of Surface Diffusion on Adsorption–Desorption and Catalytic Kinetics in Irregular Pores. II. Macro-Kinetics. J. Phys. Chem. C 2017, 121, 14557–14565. [Google Scholar] [CrossRef]
  19. Chandler, M.; Zydney, A. Effects of membrane pore geometry on fouling behavior during yeast cell microfiltration. J. Membr. Sci. 2006, 285, 334–342. [Google Scholar] [CrossRef]
  20. Kanani, D.M.; Fissell, W.H.; Roy, S.; Dubnisheva, A.; Fleischman, A.; Zydney, A.L. Permeability–selectivity analysis for ultrafiltration: Effect of pore geometry. J. Membr. Sci. 2010, 349, 405–410. [Google Scholar] [CrossRef]
  21. Ledesma-Durán, A.; Hernández-Hernández, S.I.; Santamaría-Holek, I. Generalized Fick–Jacobs Approach for Describing Adsorption–Desorption Kinetics in Irregular Pores under Nonequilibrium Conditions. J. Phys. Chem. C 2016, 120, 7810–7821. [Google Scholar] [CrossRef] [Green Version]
  22. Zwanzig, R. Diffusion past an entropy barrier. J. Chem. Phys. 1992, 96, 3926–3930. [Google Scholar] [CrossRef]
  23. Bradley, R.M. Diffusion in a two-dimensional channel with curved midline and varying width: Reduction to an effective one-dimensional description. Phys. Rev. E 2009, 80, 061142. [Google Scholar] [CrossRef]
  24. Pineda, I.; Alvarez-Ramirez, J.; Dagdug, L. Diffusion in two-dimensional conical varying width channels: Comparison of analytical and numerical results. J. Chem. Phys. 2012, 137, 174103. [Google Scholar] [CrossRef]
  25. Berezhkovskii, A.; Pustovoit, M.; Bezrukov, S. Diffusion in a tube of varying cross section: Numerical study of reduction to effective one-dimensional description. J. Chem. Phys. 2007, 126, 134706. [Google Scholar] [CrossRef] [PubMed]
  26. Santamaría-Holek, I.; Grzywna, Z.J.; Miguel Rubi, J. A non-equilibrium thermodynamic model for combined adsorption and diffusion processes in micro-and nanopores. J. Non-Equilib. Thermodyn. 2012, 37, 273–290. [Google Scholar] [CrossRef]
  27. Santamaría-Holek, I.; Grzywna, Z.; Rubi, J. Entropic effects in diffusion-adsorption processes in micropores. Eur. Phys. J. Spec. Top. 2013, 222, 129–141. [Google Scholar] [CrossRef]
  28. Rubi, J.; Reguera, D. Thermodynamics and stochastic dynamics of transport in confined media. Chem. Phys. 2010, 375, 518–522. [Google Scholar] [CrossRef]
  29. Reguera, D.; Rubi, J. Kinetic equations for diffusion in the presence of entropic barriers. Phys. Rev. E 2001, 64, 061106. [Google Scholar] [CrossRef]
  30. Ledesma-Durán, A.; Hernández, S.; Santamaría-Holek, I. Relation between the porosity and tortuosity of a membrane formed by disconnected irregular pores and the spatial diffusion coefficient of the Fick-Jacobs model. Phys. Rev. E 2017, 95, 052804. [Google Scholar] [CrossRef] [PubMed]
  31. Ledesma-Durán, A.; Hernández, S.; Santamaría-Holek, I. Effect of Surface Diffusion on Adsorption–Desorption and Catalytic Kinetics in Irregular Pores. I. Local Kinetics. J. Phys. Chem. C 2017, 121, 14544–14556. [Google Scholar] [CrossRef]
  32. Low, Z.X.; Chua, Y.T.; Ray, B.M.; Mattia, D.; Metcalfe, I.S.; Patterson, D.A. Perspective on 3D printing of separation membranes and comparison to crossmark related unconventional fabrication techniques. J. Membr. Sci. 2017, 523, 596–613. [Google Scholar] [CrossRef]
  33. Kondepudi, D.; Prigogine, I. Modern Thermodynamics: From Heat Engines to Dissipative Structures; John Wiley and Sons: Hoboken, NJ, USA, 2014. [Google Scholar]
  34. Kärger, J.; Ruthven, D. Diffusion in Zeolites and other Microporous Solids; J. Wiley and Sons Inc.: New York, NY, USA, 1992; p. 341. [Google Scholar]
  35. Pineda, I.; Dagdug, L. Projection of two-dimensional diffusion in narrow asymmetric channels onto the longitudinal direction. J. Chem. Phys. 2014, 1579, 121–129. [Google Scholar]
  36. Berezhkovskii, A.; Szabo, A. Time scale separation leads to position–dependent diffusion along a slow coordinate. J. Chem. Phys. 2011, 135, 074108. [Google Scholar] [CrossRef]
  37. Ho, C.; Qiao, R.; Heng, J.B.; Chatterjee, A.; Timp, R.J.; Aluru, N.R.; Timp, G. Electrolytic transport through a synthetic nanometer-diameter pore. Proc. Natl. Acad. Sci. USA 2005, 102, 10445–10450. [Google Scholar] [CrossRef] [PubMed] [Green Version]
  38. Mistura, G.; Pozzato, A.; Grenci, G.; Bruschi, L.; Tormen, M. Continuous adsorption in highly ordered porous matrices made by nanolithography. Nat. Commun. 2013, 4, 2966. [Google Scholar] [CrossRef] [PubMed] [Green Version]
  39. Yameen, B.; Ali, M.; Neumann, R.; Ensinger, W.; Knoll, W.; Azzaroni, O. Single conical nanopores displaying pH-tunable rectifying characteristics. Manipulating ionic transport with zwitterionic polymer brushes. J. Am. Chem. Soc. 2009, 131, 2070–2071. [Google Scholar] [CrossRef] [PubMed]
  40. Yamauchi, Y.; Nagaura, T.; Ishikawa, A.; Chikyow, T.; Inoue, S. Evolution of standing mesochannels on porous anodic alumina substrates with designed conical holes. J. Am. Chem. Soc. 2008, 130, 10165–10170. [Google Scholar] [CrossRef] [PubMed]
  41. Siwy, Z.; Heins, E.; Harrell, C.C.; Kohli, P.; Martin, C.R. Conical-nanotube ion-current rectifiers: The role of surface charge. J. Am. Chem. Soc. 2004, 126, 10850–10851. [Google Scholar] [CrossRef]
  42. Siódmiak, J.; Santamaría-Holek, I.; Gadomski, A. On morphological selection rule of noisy character applied to model (dis) orderly protein formations. J. Chem. Phys. 2010, 132, 05B608. [Google Scholar] [CrossRef]
  43. Miyabe, K.; Guiochon, G. Measurement of the parameters of the mass transfer kinetics in high performance liquid chromatography. J. Sep. Sci. 2003, 26, 155–173. [Google Scholar] [CrossRef]
  44. Miyabe, K.; Guiochon, G. Fundamental interpretation of the peak profiles in linear reversed-phase liquid chromatography. Adv. Chromatogr. 2000, 40, 1–113. [Google Scholar]
  45. Miyabe, K.; Guiochon, G. Surface diffusion in reversed-phase liquid chromatography. J. Chromatogr. A 2010, 1217, 1713–1734. [Google Scholar] [CrossRef]
  46. Medveď, I.; Černỳ, R. Surface diffusion in porous media: A critical review. Microporous Mesoporous Mater. 2011, 142, 405–422. [Google Scholar] [CrossRef]
  47. Langmuir, I. The adsorption of gases on plane surfaces of glass, mica and platinum. J. Am. Chem. Soc. 1918, 40, 1361–1403. [Google Scholar] [CrossRef]
  48. Festa, R.; d’Agliano, E.G. Diffusion coefficient for a Brownian particle in a periodic field of force: I. Large friction limit. Phys. A Stat. Mech. Appl. 1978, 90, 229–244. [Google Scholar] [CrossRef]
  49. Kärger, J.; Kortunov, P.; Vasenkov, S.; Heinke, L.; Shah, D.B.; Rakoczy, R.A.; Traa, Y.; Weitkamp, J. Unprecedented insight into diffusion by monitoring the concentration of guest molecules in nanoporous host materials. Angew. Chem. Int. Edit. 2006, 45, 7846–7849. [Google Scholar] [CrossRef] [PubMed]
  50. Kärger, J.; Binder, T.; Chmelik, C.; Hibbe, F.; Krautscheid, H.; Krishna, R.; Weitkamp, J. Microimaging of transient guest profiles to monitor mass transfer in nanoporous materials. Nat. Mater. 2014, 13, 333–343. [Google Scholar] [CrossRef] [PubMed]
  51. Kärger, J.; Ruthven, D.M.; Theodorou, D.N. Diffusion in Nanoporous Materials; John Wiley & Sons: Hoboken, NJ, USA, 2012. [Google Scholar]
Figure 1. Geometry of an irregular tortuous pore of radius R ( z ) , transversal area A ( z ) and length L. Also shown are the three types of pores that will be used for numerical experiments. These experiments will consist on the study of the bulk and surface diffusion dynamics and its interplay with the adsorption–desorption and catalytic processes at the surface of the pore. The mathematical details of their geometries are summarized in Appendix A, in particular the values of the geometric parameters used in simulations are provided in Table A1.
Catalysts 09 00281 g001
Figure 2. Evolution of the non-equilibrium concentration profiles of the tortuous (black lines) and winding pores (colour lines) in two different situations. In (a) we present the diffusion dynamics in the absence of adsorption. Since we have designed the pores for having the same effective diffusion coefficient D b ( z ) , then the concentration profile evolves equally in both pores. However, in (b) we show that the adsorption efficiency is different in both pores because it depends on the length of the walls (proportional to their enhancement factor γ ) which is larger in the tortuous pore (black lines) than in the winding pore (colour lines). This fact causes that less particles reach the exit side of the pore (at the right). See Appendix A for details of the simulations.
Catalysts 09 00281 g002
Figure 3. Predictions for the normalized mass transfer coefficient k / k 0 (left) and effectiveness factor η (right) as a function of the pore geometry, for the four conical pores depicted in the figure using the reduced scheme. See Appendix A.
Catalysts 09 00281 g003
Figure 4. Projection approximation of the diffusion over the surface of a conical pore. (a) The effective length q appears due to the projection over the cone. (b) The motion along the q coordinate is approximately equal to the motion inside a two-dimensional funnel pore. The semicircular dotted lines indicate the exact form of the surface. For large pores as initially assumed L > > R , the error made by our approximation is negligible.
Catalysts 09 00281 g004
Figure 5. Langmuir adsorption dynamic inside the tortuous (black lines) and winding (color lines) pores in the presence of surface diffusion. In (a,b) figures the solid-lines correspond to the long-time (equilibrium) bulk concentration C b ( x ) and diffusion current J b ( x ) , the dashed-lines to the long-time (equilibrium) surface concentration C s ( x ) and diffusion current J s ( x ) and the dotted-lines to the long-time (equilibrium) total concentration C = C b + C s and current J = J b + J s . At long times the particles in the bulk tend to be distributed homogeneously inside the pore while in (c) the coverage fraction θ ( x ) shows that the adsorbed particles tend to segregate producing an accumulation in the wider regions of the pore. This interesting effect suggests the existence of bulk-surface exchange counter-fluxes in the interior of the pores, even when macroscopic equilibrium is reached. See Appendix A for simulation details.
Catalysts 09 00281 g005
Figure 6. Illustrative image of the different steps of the heterogeneous catalysis inside an irregular pore.
Catalysts 09 00281 g006
Figure 7. Numerical experiments predicting the surface concentration profiles of the species A and B of the heterogeneous isomerization reaction considered in Section 5.1. The upper line shows the tortuous pore together with the corresponding results Figures (a,b). In (a) the black lines show to the surface concentrations C A S ( x ) (dotted line) and C B S ( x ) (dashed line) together with the total concentration C = C A S + C B S (solid line) when the active sites are located in the positions indicated by the gray gridlines (corresponding to the wider positions of the pore). The color lines correspond to the same concentrations when the active sites are located in the orange gridlines (corresponding to the narrower positions of the pore). In (b) the corresponding diffusion fluxes as a function of time are shown. The bottom line shows a similar situation but for the sinuous pore. Negative values of the flux indicate that the species B leaves the pore at the left end. In (c) the solid lines (black and red) show a dramatic change of total mass transport depending on the position of the active sites. This is related with the also dramatic difference of efficiency of the heterogeneous isomerization reaction in this pore, see black and blue dashed lines. The changes are also drastic with respect to the tortuous pore. The total surface fluxes of species A and B are compared in (d). The details of the parameters used are given in Appendix A.
Catalysts 09 00281 g007
Figure 8. Concentration profiles in three pores depicted above, where an homogeneous adsorption process takes place along the pore with equal concentrations at both ends. In (a1) we show the predictions of the concentration profiles for a tortuous pore (green) when adsorption and bulk diffusion takes place at different times. Black lines show the predictions by Equations (16) and (29) whereas solid color lines (green) show the prediction by the most elemental one-dimensional diffusion Equation (12) having no-corrections from the geometry of the pore. In (a2) we show a similar comparison in the presence of surface diffusion. The comparisons in (b1,b2) correspond to the cylindrical pore (blue) and show that, only in this case, the approaches are equivalent, as expected. Comparisons in (c1,c2) correspond to the winding pore (red). Remarkable differences between tortuous and winding pores emerge from this simulation study, in particular in the case when surface diffusion is present. Cylindrical and tortuous pores have very similar behavior whereas the tortuous pore introduces large deviations with respecto to the elemental description of the concentration profile. See Appendix A for details of the parameters used in the simulations.
Catalysts 09 00281 g008
Figure 9. Breakthrough curves obtained from solving Equation (16) for a simple linear adsorption process given by ρ ˙ = r a C b ( z ) with r a the adsorption rate and D 0 the diffusion coefficient. The pores considered are the winding (black lines) and tortuous (colour lines) pores with length L = 5 . The boundary conditions consist of fluid entering at the left ( C b ( z = 0 ) = 1 ), and exiting at the right ( C b ( z = L ) = 0 ). The values of the constants (in arbitrary units) were r a = 0 and D 0 = 1 for the solid lines, r a = 0.1 and D 0 = 0.75 for the dashed lines, r a = 0.4 and D 0 = 0.5 for the dotted lines, and r a = 1.0 and D 0 = 0.1 for the dash-dotted lines. In order to obtain the breakthrough curve, the temporal increasing of the concentration is measured at z = 4.5 . Our theory predicts that a small difference on the slope of these curves can be the result of purely geometrical changes, and the constriction and sinuosity of the pores can be reflected in this type of curves. See Appendix A [16].
Catalysts 09 00281 g009
Figure 10. Effective diffusion coefficient of a membrane as a function of the loading for the three pores studied, and for several values of the surface diffusion coefficient. It is clear that the surface diffusion changes the concavity of the curve and, at fixed loading, increases the efficiency of the mass transport. See Appendix A for simulation details.
Catalysts 09 00281 g010

