Article

Heterostructure Cu2O/(001)TiO2 Effected on Photocatalytic Degradation of Ammonia of Livestock Houses

1
Chongqing Academy of Animal Sciences, Chongqing 402460, China
2
Scientific Observation and Experiment Station of Livestock Equipment Engineering in Southwest, Ministry of Agriculture, Chongqing 402460, China
3
College of Geology and Environment, Xi’an University of Science and Technology, Xi’an 710054, China
4
College of Mechanical and Electrical Engineering, Agricultural University of Hebei, Baoding 071001, China
*
Authors to whom correspondence should be addressed.
Catalysts 2019, 9(3), 267; https://doi.org/10.3390/catal9030267
Submission received: 15 February 2019 / Revised: 8 March 2019 / Accepted: 12 March 2019 / Published: 15 March 2019

Abstract

:
In this paper, a heterogeneous composite catalyst Cu2O/(001)TiO2 was prepared by the impregnation-reduction method. The crystal form, highly active facet content, morphology, optical properties, and the photogenerated electron-hole recombination rate of the as-prepared catalysts were investigated. The performance of Cu2O/(001)TiO2 was appraised by photocatalytic degradation of ammonia under sunlight and was compared with lone P25, Cu2O, and (001)TiO2 at the same reaction conditions. The results showed that 80% of the ammonia concentration (120 ± 3 ppm) was removed by Cu2O/(001)TiO2, which was a higher degradation rate than that of pure P25 (12%), Cu2O (12%), and (001)TiO2 (15%) during 120 min of reaction time. The reason may be due to the compound’s (Cu2O/(001)TiO2) highly active (001) facets content that increased by 8.2% and the band gap width decreasing by 1.02 eV. It was also found that the air flow impacts the photocatalytic degradation of ammonia. Therefore, learning how to maintain the degradation effect of Cu2O/(001)TiO2 with ammonia will be important in future practical applications.

1. Introduction

Ammonia is an important precursor of fine particulate matter PM2.5 in the atmosphere and promotes the formation of haze. China has been the one of largest ammonia emitters in the world [1]. An investigation of the NH3 emission sources and contribution rate in 2006 shows that the total ammonia emissions of China are 980 t/a, more than 96% and 45% of Europe and the USA, respectively, and contributes to global and Asian emissions by approximately 15% and 35%, respectively; of which, livestock manure accounts for approximately 54% of the total emissions [2]. In terms of the global ammonia emissions, animal husbandry is clearly the major contributor for ammonia pollution, as it accounts for 70.9% of the total [3]. The ammonia from animal husbandry may not only cause global climate change, but can also bring disease in animals and humans, such as paralysis centralis, endobronchitis, and others [4]. Therefore, strengthening the control of ammonia pollution of animal husbandry has become an important task for agricultural, non-point source pollution treatment in China.
In the past, livestock farms adopted traditional physical methods of adsorption and ventilation to eliminate the ammonia generated in livestock and poultry houses [5]. Although these methods can decrease the release concentration of ammonia over time, they cannot reduce the total amount of ammonia emissions and may aggravate the secondary ammonia pollution of the environment. With more exacting livestock air quality requirements from public authorities, some large-scale livestock farms have tried to erect biological exhaust air cleaning facilities to reduce ammonia, dust, and odor emissions, so that they can get a license to build livestock houses close to small towns or near farming households. Biological filters can clean NH3 emissions effectively, but limitations still exist, such as unstable operation and high replacement costs [6]; the end result is that most livestock farm ammonia emissions are not eliminated at all. Therefore, it is very important to develop a stable and efficient degradation material to deal with the air pollution from livestock farms.
As an ideal semiconductor photocatalytic material, titanium dioxide was discovered to be able to photodissociate water under ultraviolet irradiation by Fujishima in 1972 [7]. Since then, it has become a promising photocatalyst because of its good chemical stability, safety, non-toxicity, strong redox ability, and so on, and has been widely used in environmental control [8,9,10,11,12], exploitation of energy resources [13,14], bioengineering [15], self-cleaning material [16], anti-microbial [17], sensor [18], and other fields. In recent years, TiO2 was used as pigment coating to reduce ammonia emissions under ultraviolet light [19,20], with a 90% conversion efficiency of 200 ppm NH3 converted into N2 at high temperature (673 K) [21]. In the reaction process, the degradation product of NH3 is mainly N2, with N2O, NO2, and NO3 by-products [22,23]. However, TiO2 can only respond to high energy ultraviolet light due to its wide band gap (3.2 eV) [24], which makes the utilization ratio of TiO2 very low under sunlight with low ultraviolet content in the solar spectrum [25]. Meanwhile, the high photogenerated electron-hole recombination rate of TiO2 leads to its catalytic activity [26]. All of these considerations contribute to serious obstacles to TiO2 application in practice. To overcome these shortcomings, much research has been attempted to improve the performance of TiO2 by adjusting the exposure ratio of its highly active surface or combining the material with other semiconductors. Adjusting the (001) facets ratio of TiO2 (anatase) has been reported to be a efficiency way to improve the photocatalytic efficiency (Keyue Wu, [27]), but most of the available anatase crystals are primary composed of thermodynamic stable (101) surfaces [28], whose surface energy (0.44 J/m2) is much smaller than the (001) surface (0.90 J/m2) [29]. Another helpful way to facilitate charge separation and improve degradation performance is coupling with other semiconductors (C3N4 [30], PbS [31], WO3 [32], Cu2O [33], CdS [34], and others) with small band gaps; this can not only enhance the spectral response, but also transfer photogenerated electrons from one reporter to another. Among these semiconductors with small band gaps, the oxides of copper (CuxO) are fascinating materials due to their remarkable optical, electrical, thermal, and magnetic properties [35], among the CuxO, Cu2O has the advantages of simple preparation processes, low raw material price, environmental friendliness, and a good response in the visible range. Compared with other transition metal oxides, Cu2O is a promising green catalyst for environmental protection. As a p-type direct semiconductor [36], Cu2O can be coupled with n-type semiconductor TiO2 into a heterostructure. This heterostructure displays much better performance than the single material and is widely used for decomposing water [37], solar cells [38], and degrading pollutants [39]. At the same time, some interesting materials also need our attention. Syed et al. [40] synthesized α-Ga2O3 by a sonication-assisted method, which has excellent photocatalytic activity is observed under solar light irradiation with an energy bandgap reduction, due to the presence of trap states, which are located at about 1.65 eV under the conduction band minimum. Datta et al. [41] synthesized 2D α-MoO3−x nanosheets structural with defects and oxygen vacancies in the planar construction of molybdenum oxide nanosheets significantly increase the active sites of the catalyst, which act as key factors to promote the hydrogen evolution reaction (HER) performance.
In this paper, a heterogeneous composite catalyst Cu2O/(001)TiO2 was prepared by the impregnation-reduction method and was used to degrade ammonia in a livestock house under sunlight for the first time, so as to realize the efficient utilization of solar energy and offer an efficient degradation material for the field of animal husbandry.

2. Results and Discussion

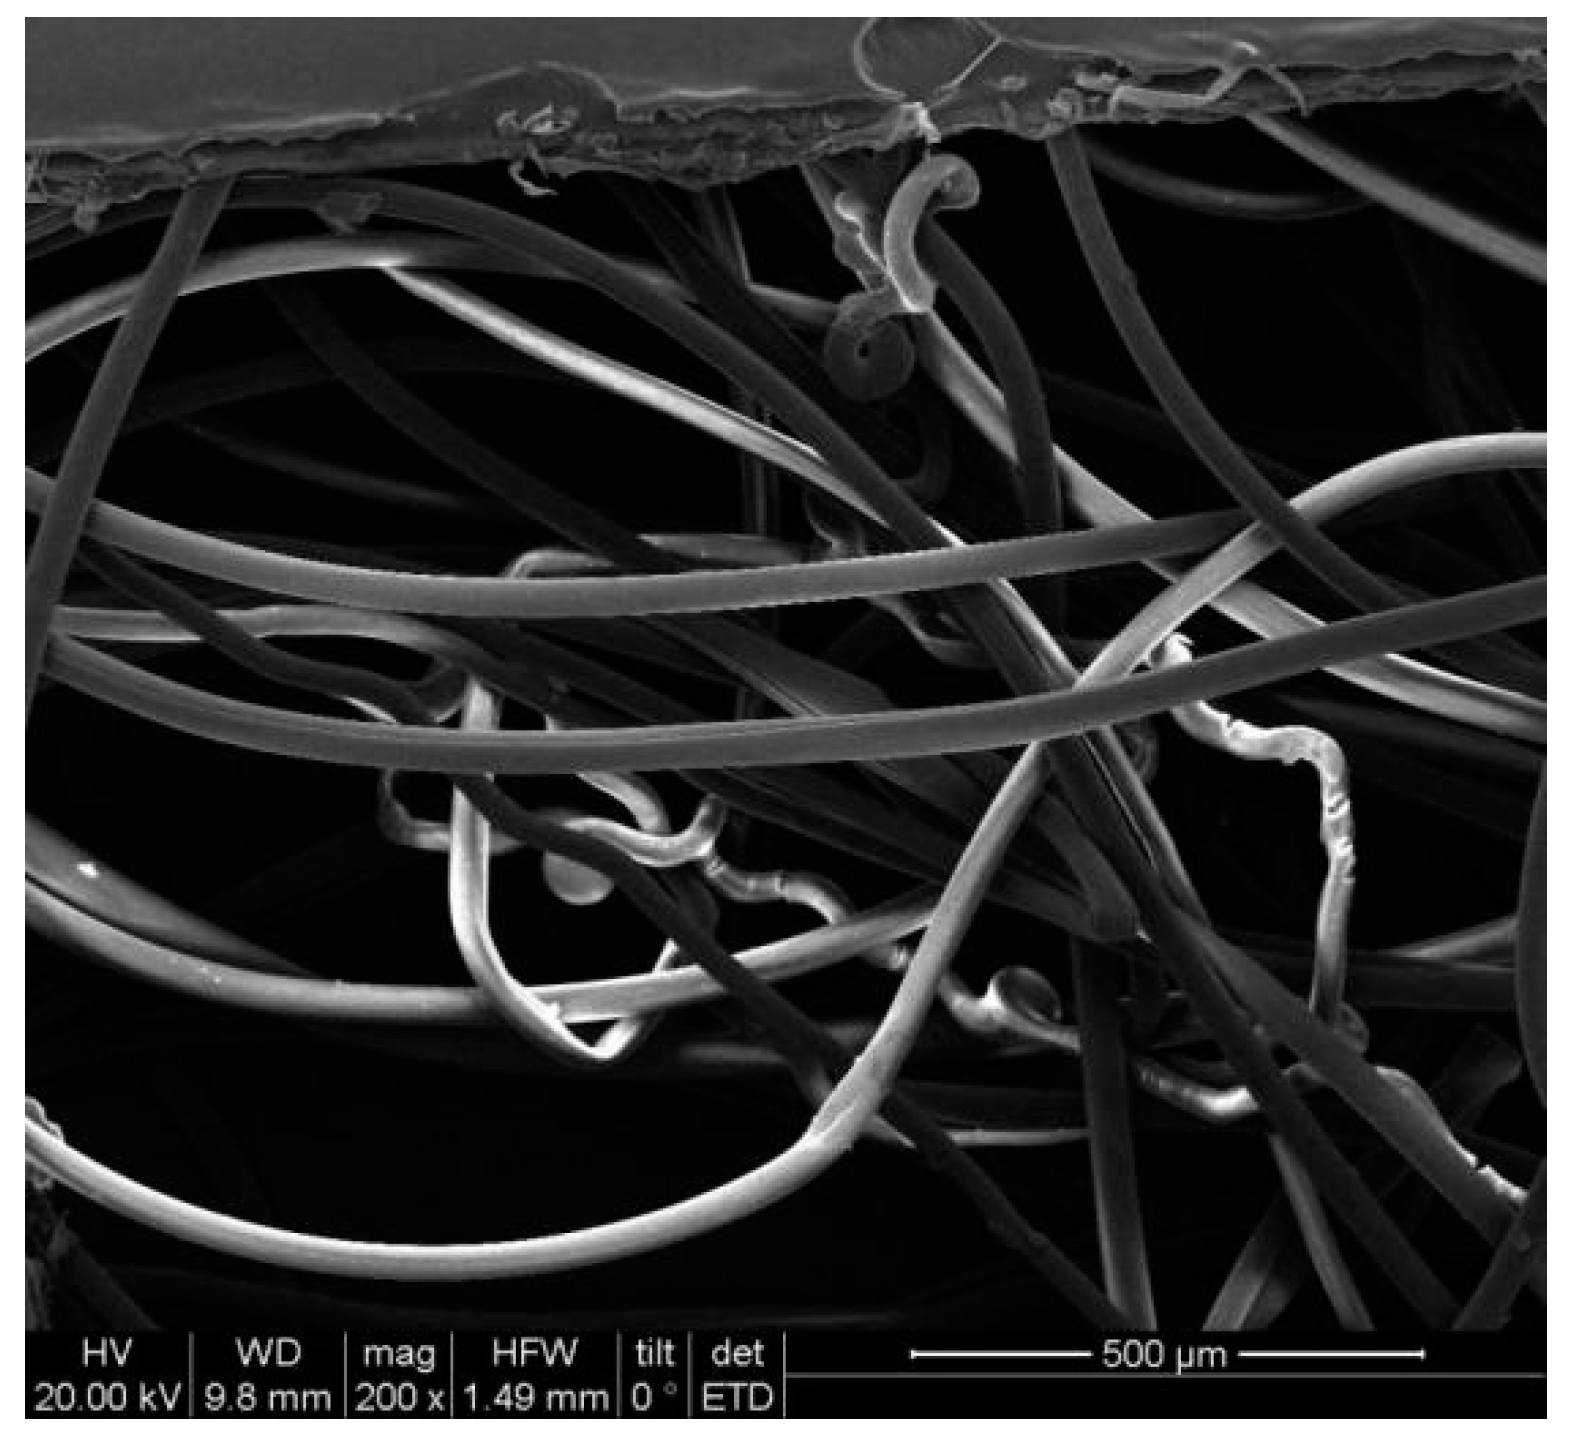
2.1. Morphology Analysis of Carrier (Polyester Fiber)

Figure 1 is a scanning electron microscope (SEM) view of the carrier (polyester fiber). It can be seen from the diagram that the carrier is folded by a lot of filaments into an interlaced three-dimensional structure, which can provide a large number of adhesion points to the catalysts.

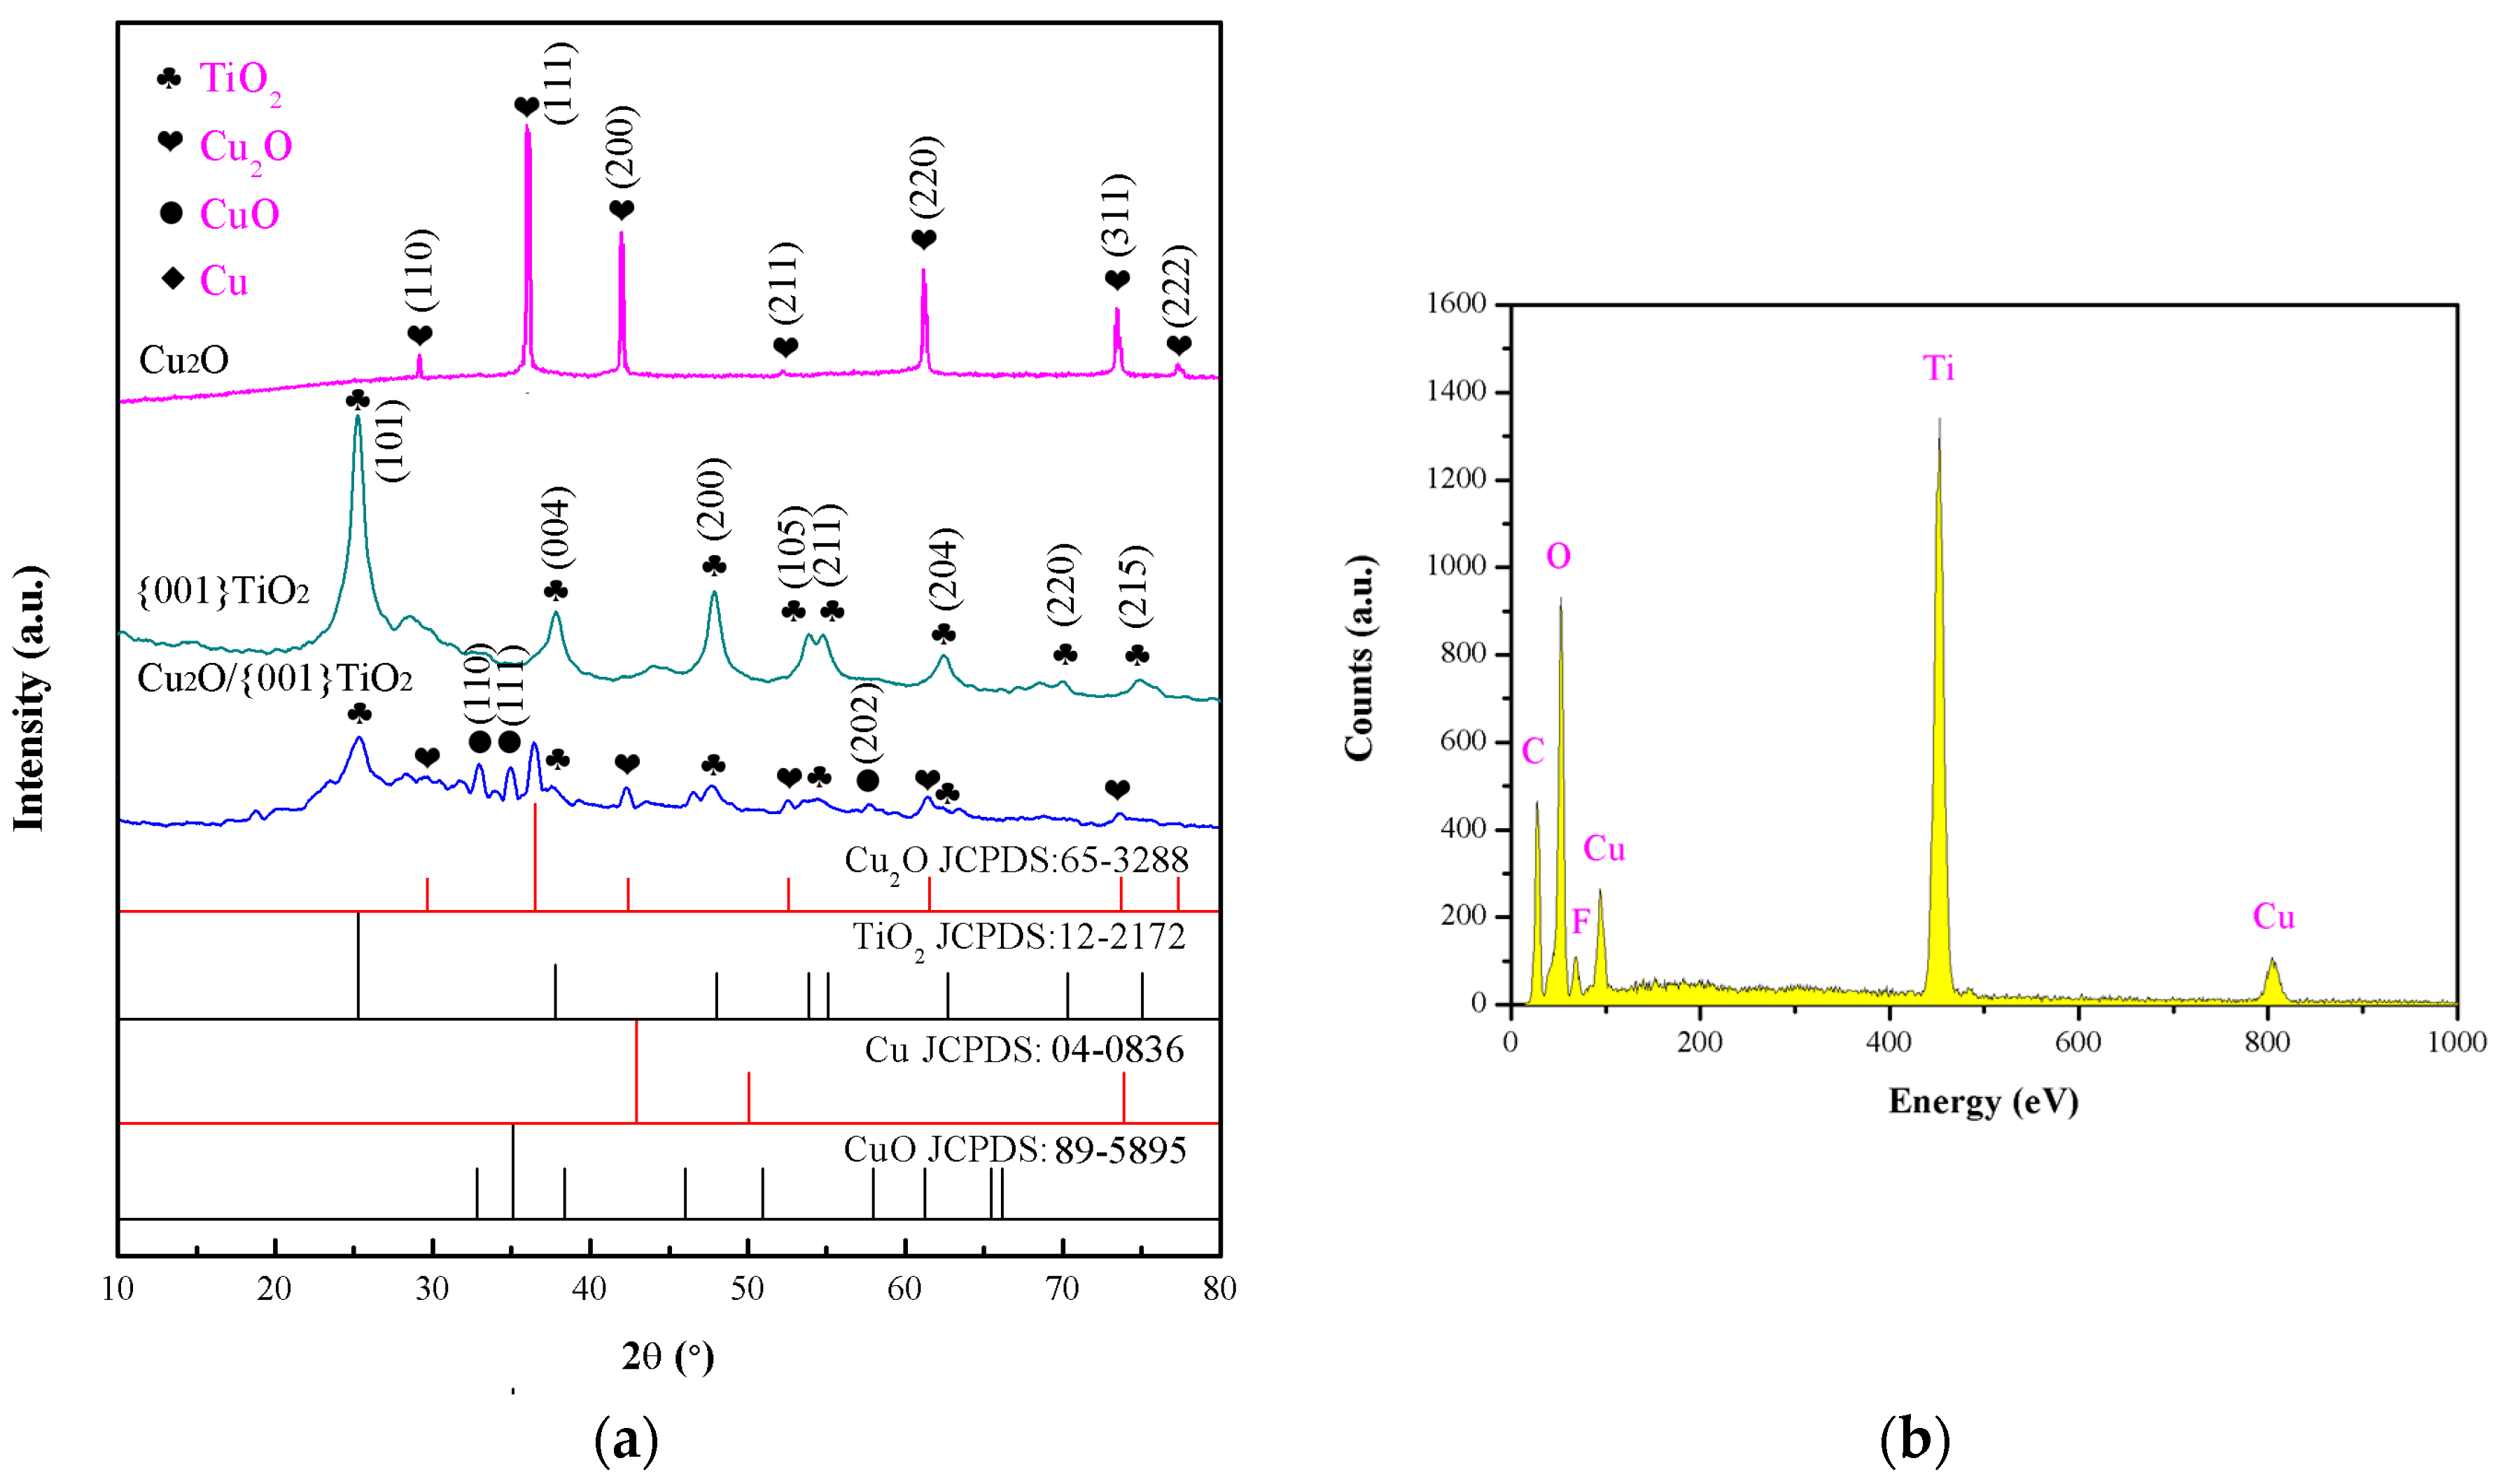
2.2. X-ray Diffraction of Catalysts

Figure 2a showed the characteristic peaks of the prepared (001) TiO2 catalyst at 2θ = 25.28, 37.80, 48.04, 53.89, 55.06, 62.68, 70.31, 75.03 corresponding to (101), (004), (200), (105), (211), (204), (220), and (215) crystal facets, respectively, almost the same as the anatase TiO2 (JCPDS no.21-1272) standard card [42]. The characteristic peaks of Cu2O appeared at 2θ = 29.63, 36.50, 42.40, 52.58, 61.52, 73.70, and 77.57, corresponding to (110), (111), (200), (211), (220), (311), and (222) crystal facets, almost in accordance with the standard card of Cu2O (JCPDS no.65-3288) [43]. The composite catalyst Cu2O/(001)TiO2 showed obvious characteristic peaks at 2θ = 25.28, 37.80, 48.04, 55.06, 62.68, corresponding to (101), (004), (200), (211), and (204) crystal facets, respectively, basically consistent with anatase TiO2. The composite catalyst Cu2O/(001)TiO2 showed obvious characteristic peaks at 2θ = 29.63, 42.40, 52.58, 61.52, 73.70, 77.57, corresponding to (110), (200), (211), (220), (311), and (222) crystal facets, almost in accordance with the standard card of Cu2O. The composite catalyst Cu2O/(001)TiO2 showed weak characteristic peaks at 2θ = 32.62, 38.73, 48.82, corresponding to (110), (111), (202) crystal facets, respectively, almost in accordance with the standard card of CuO (JCPDS no.89-5895). The composite catalyst Cu2O/(001)TiO2 showed the characteristic peak around at 2θ = 43.29, maybe corresponding to (111) crystal facet of Cu (JCPDS no.04-0836). From Figure 2b, it can be seen that there was no S element in the Cu2O/(001)TiO2 composite, which indicated that the reaction was sufficient and CuSO4 was not contained in the product. In summary, the prepared composite catalyst Cu2O/(001)TiO2 contains CuO and may also contain Cu.

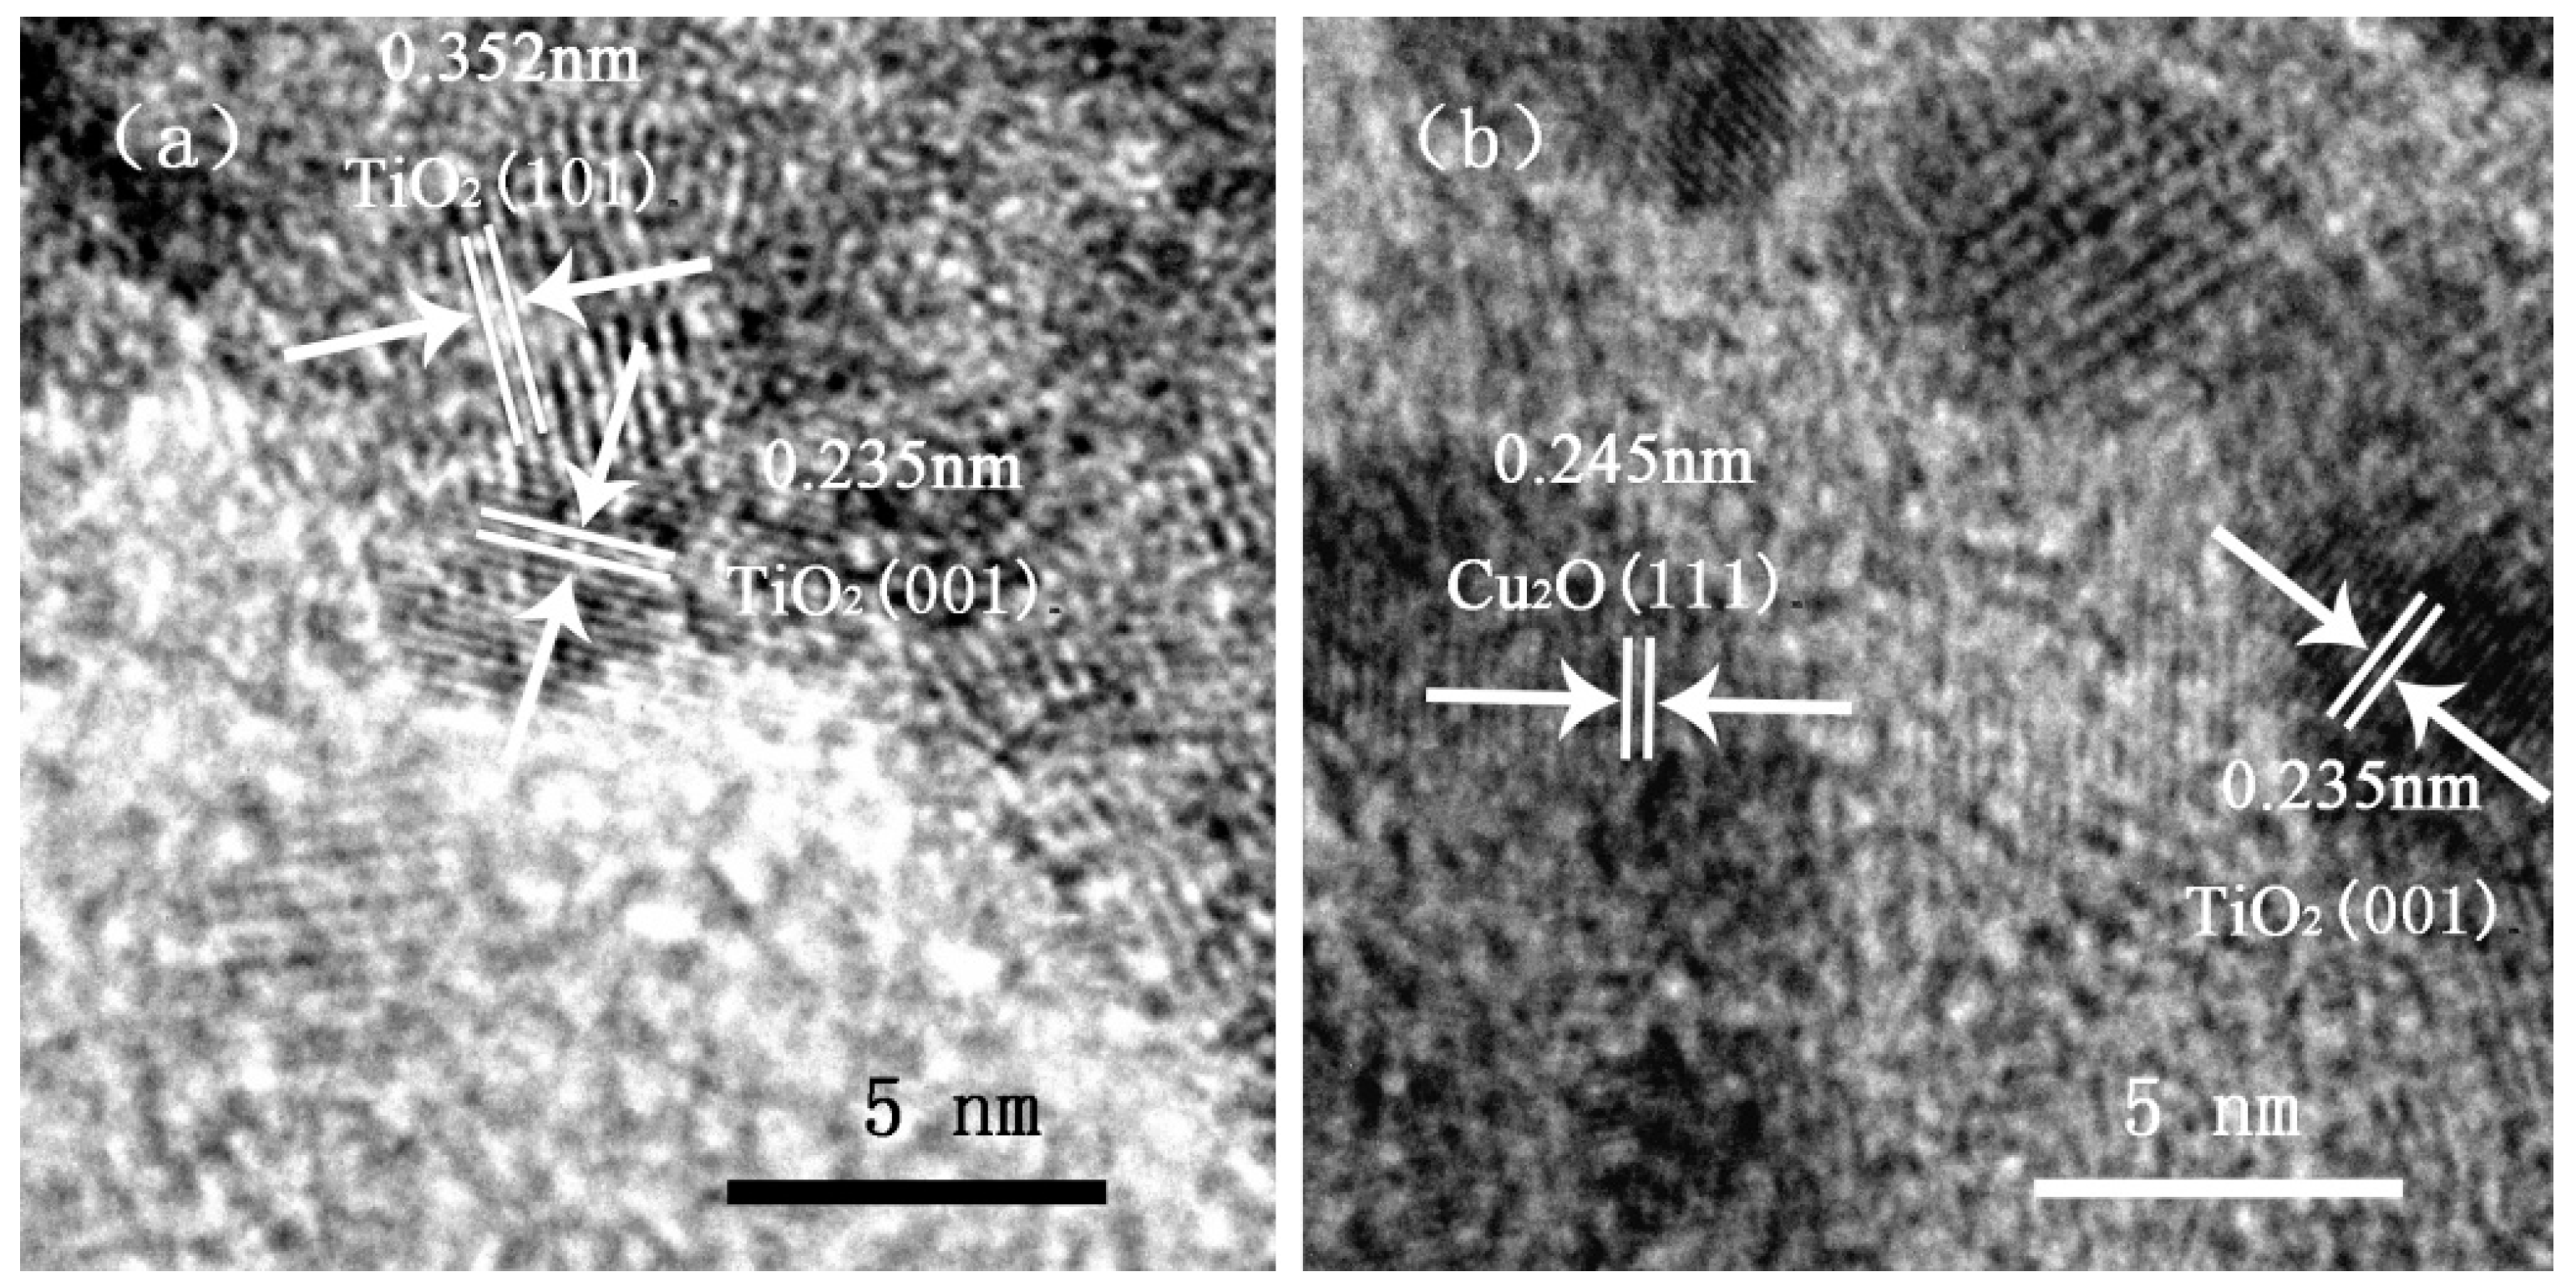
2.3. Crystal Facet Analysis of Catalysts

Figure 3a contains spacings of d = 0.352 nm and d = 0.235 nm, corresponding to the (101) and (001) facets of TiO2, respectively [44]. This shows that the prepared TiO2 has the high activity (001) facets. The Figure 3b shows d = 0.235 nm and d = 0.245 nm spacings, corresponding to the (001) facets of TiO2 and the (111) surface of Cu2O, respectively [45], which shows that the prepared composite catalyst contains the high activity (001) facets.

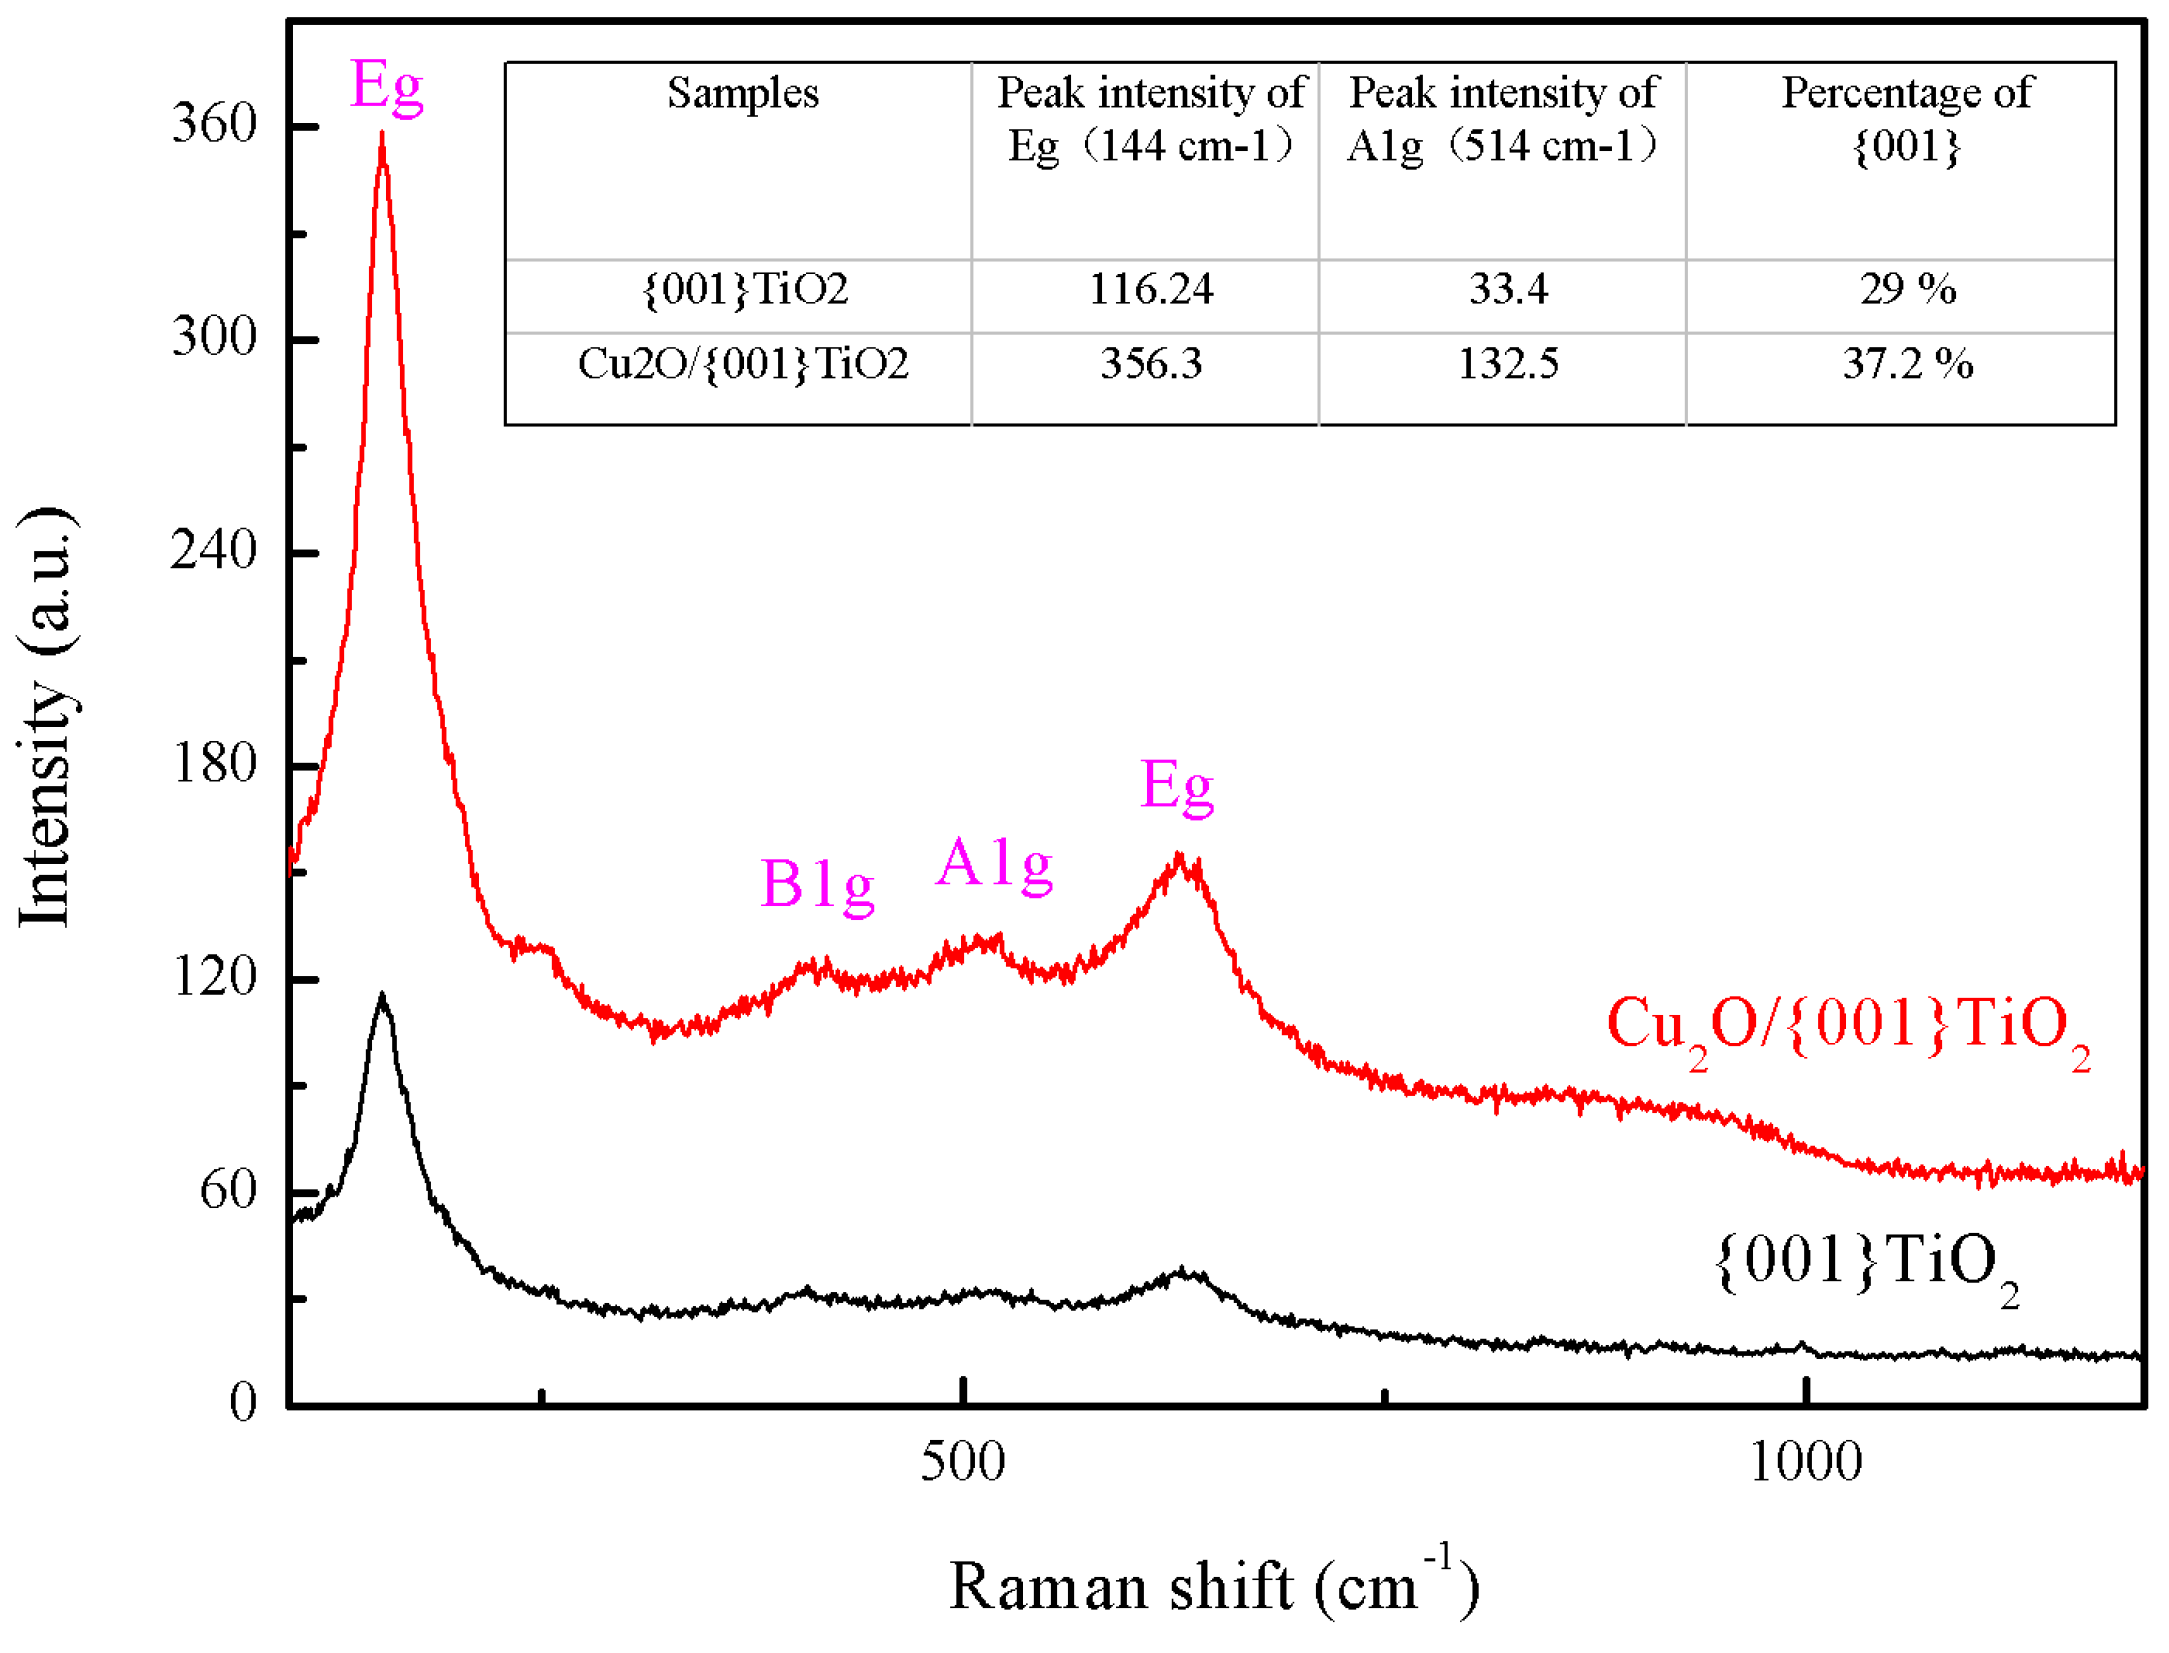
2.4. Raman Analysis of Catalysts

It can be seen in Figure 4. The peak at 144 cm−1 was marked as Eg and 514 cm−1 was marked as A1g. The ratio of peak strength at A1g to peak strength at Eg is the (001) exposure ratio of crystal facets. The calculated (001) facet content of prepared TiO2 is I(101)/I(004) = 29% [46], which is significantly lower than that of the compounded, calculated to be I(101)/I(004) = 37%. The reasons for this may be as follows:
CuSO 4   +   2 NaOH   =   Cu ( OH ) 2   +   Na 2 SO 4  
2 Cu ( OH ) 2 +   C 5 H 11 O 5 CHO C 5 H 11 O 5 COOH   +   Cu 2 O +   2 H 2 O
In the experiment, the amounts of CuSO4 and NaOH were 4.99 g and 4 g, respectively. Through the calculation of Reaction (1), it was found that the amount of NaOH is excessive. Assuming that all excessive sodium hydroxide existed in the whole system, the concentration range is about 0.197–0.317 mol/L. In the process of adding glucose drop by drop, the concentration of NaOH was also decreasing gradually. It was found that NaOH and (001)TiO2 not only increased the content of (001) facets, but also changed the morphology of the catalysts, which was consistent with the results of Hou et al. [47].

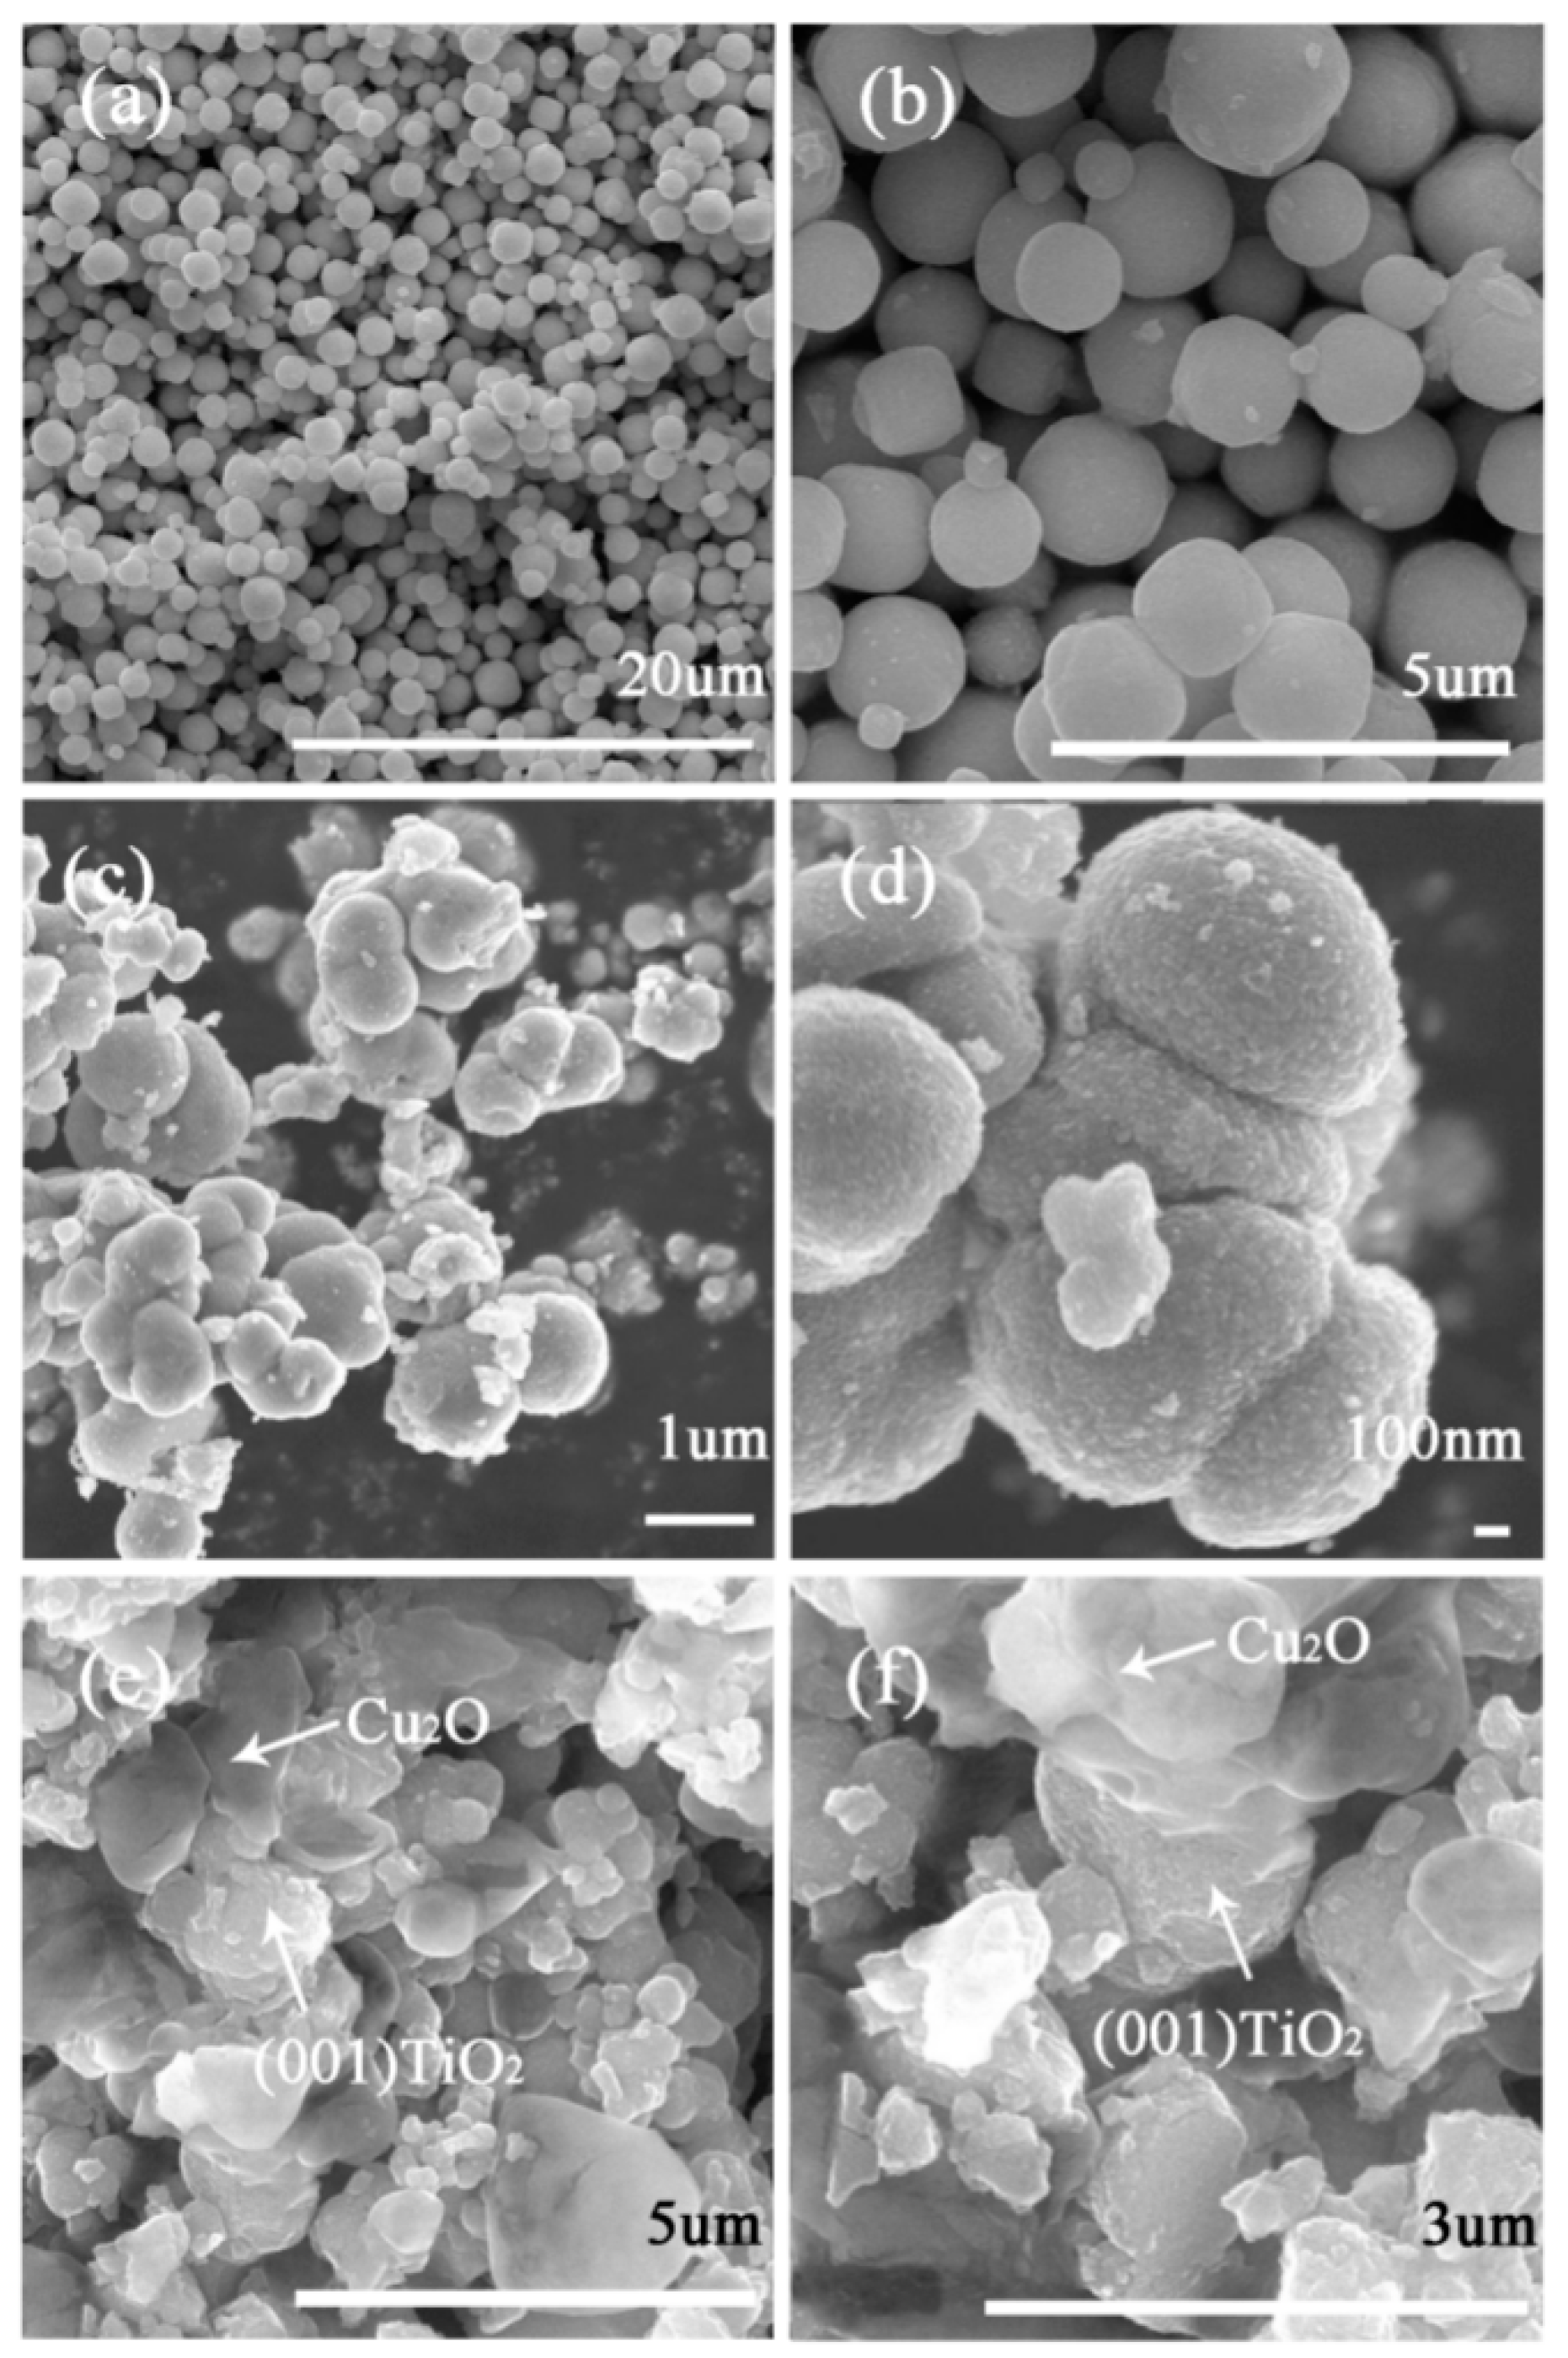
2.5. Catalyst Morphology Analysis

Figure 5 shows the SEM morphology images of the catalysts. From Figure 5a, it can be seen that the prepared Cu2O crystals have no obvious agglomeration phenomenon and the size is basically uniform. Figure 5b reveals a smooth, spherical surface; Figure 5c displays a slight agglomeration of (001)TiO2, which forms an irregular spherical shape by extrusion. Figure 5d exhibits a flat sphere with concave and convex surfaces; Figure 5e,f shows that the prepared Cu2O/(001)TiO2 has uniform dispersion and different sizes; the composite (001)TiO2 was no longer a crushed sphere with a rough surface, but a crushed sphere. This is due to the influence of residual sodium hydroxide. Raman analysis in this experiment showed that excess sodium hydroxide was present, which indicates that the conjecture is correct. The composite Cu2O was no longer globular, but flaky. This may be due to the influence of (001)TiO2 on the Cu+1 crystal nucleus adhering to the (001)TiO2 surface during in situ growth, which cannot grow in the same way as before. This resulted in the growth of new pancake-like catalysts; the new morphology can provide a better place for the separation of photogenerated carriers.

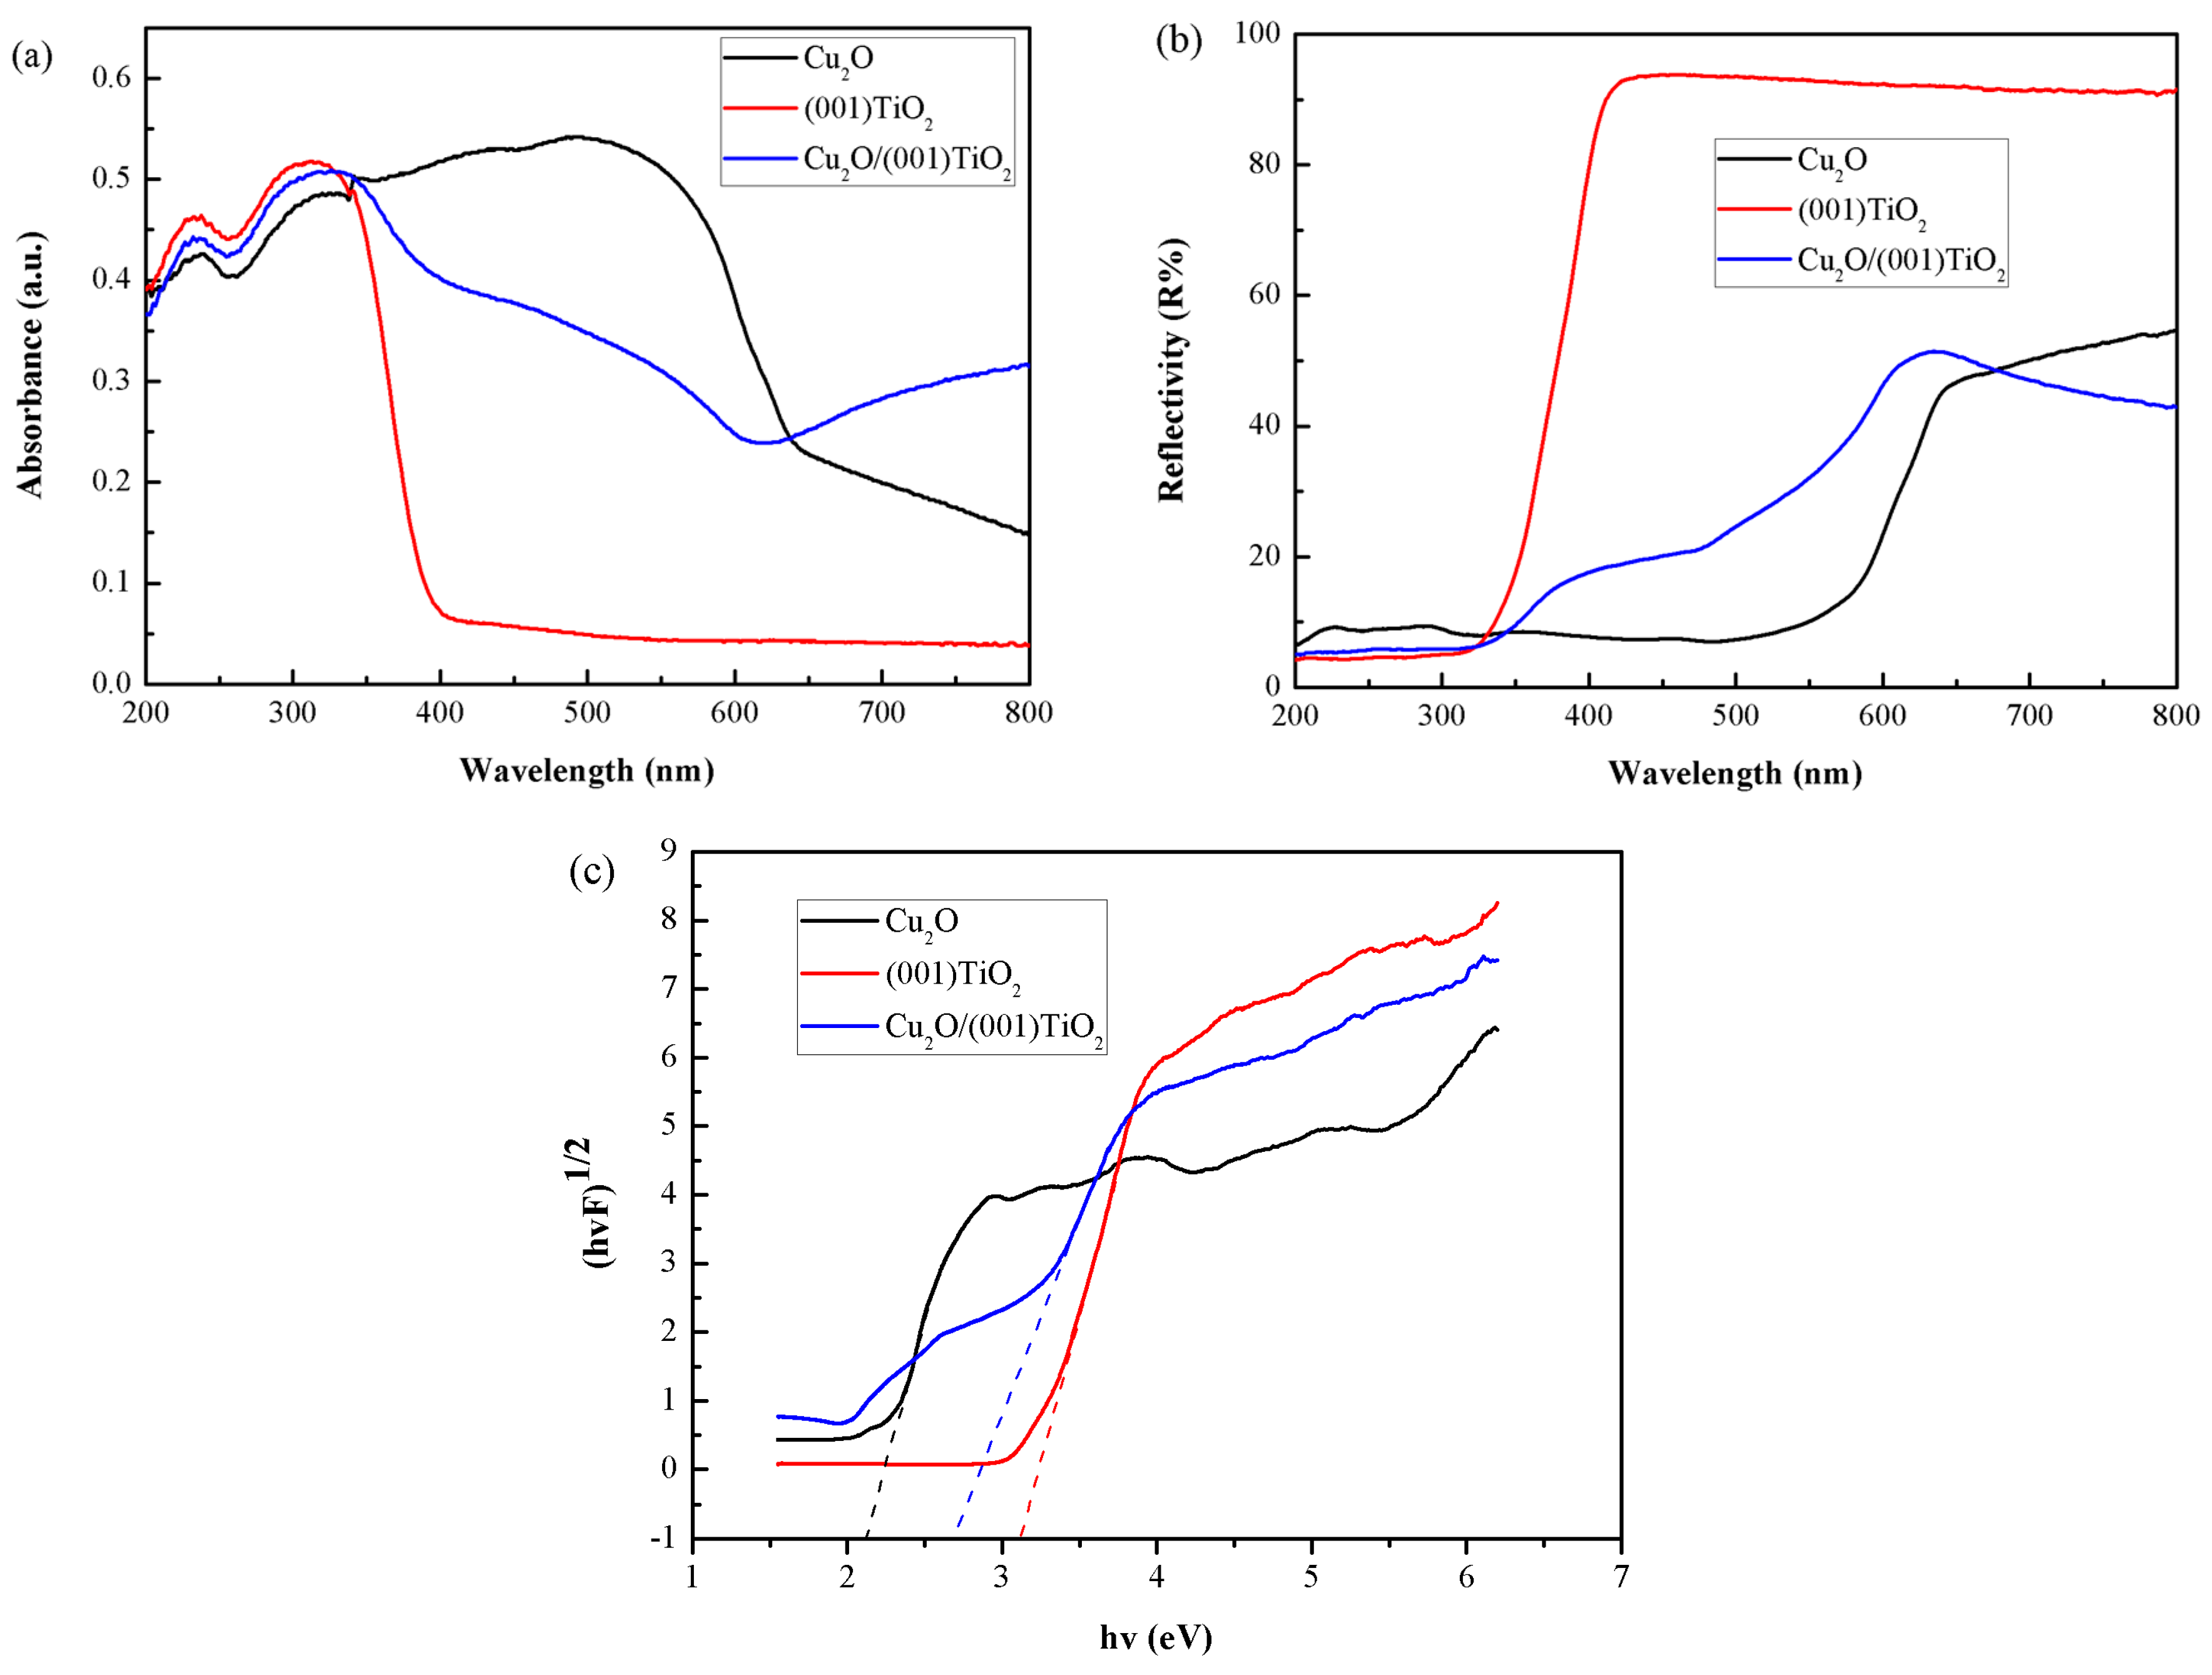
2.6. Optical Characterization and Band Gap Energy

Figure 6a showed the UV-Vis absorption spectra of the catalysts. We found that the absorption of (001)TiO2 is slightly stronger than that of Cu2O/(001)TiO2 in the range of 200–328 nm, while in the range of 328–800 nm, the absorption enhancement of the composite catalyst Cu2O/(001)TiO2 is much stronger than that of the (001)TiO2, which indicated that Cu2O/(001)TiO2 has strong light absorption ability mainly in the visible range. The Diffuse Reflectance Spectra (DRS) of the catalysts were measured and shown in Figure 6b, which is useful to study the optical properties of the materials and the band gap. From the DRS spectra is possible the determination of Eg by applying the Kubelka–Munk method using the following equations (Equations (3) and (4)) [48]:
F(R) = (1 − R)2/2R
(hvF)~(hv − Eg)2
where, F is the Kubelka–Munk function, R is the reflectance, hv is the photon energy, and Eg is the band gap. By plotting (hvF)1/2 for indirect allowed transitions versus hv, the Eg of the semiconductor samples can be obtained. The energy bang gap of the different samples can be calculated by the linear fit of the curve reported in the Figure 6c and the Eg values are determined by the intercept in the x-axis. Reported in Table 1 are the band gap energy values of the different samples calculated with the Kubelka–Munk method.
The band gaps of Cu2O, (001)TiO2, and Cu2O/(001)TiO2 are 2.12, 2.68, and 3.14 eV, respectively, which indicates that the composite Cu2O/(001)TiO2 is more easily excited than the single (001)TiO2, which enhanced its activity.

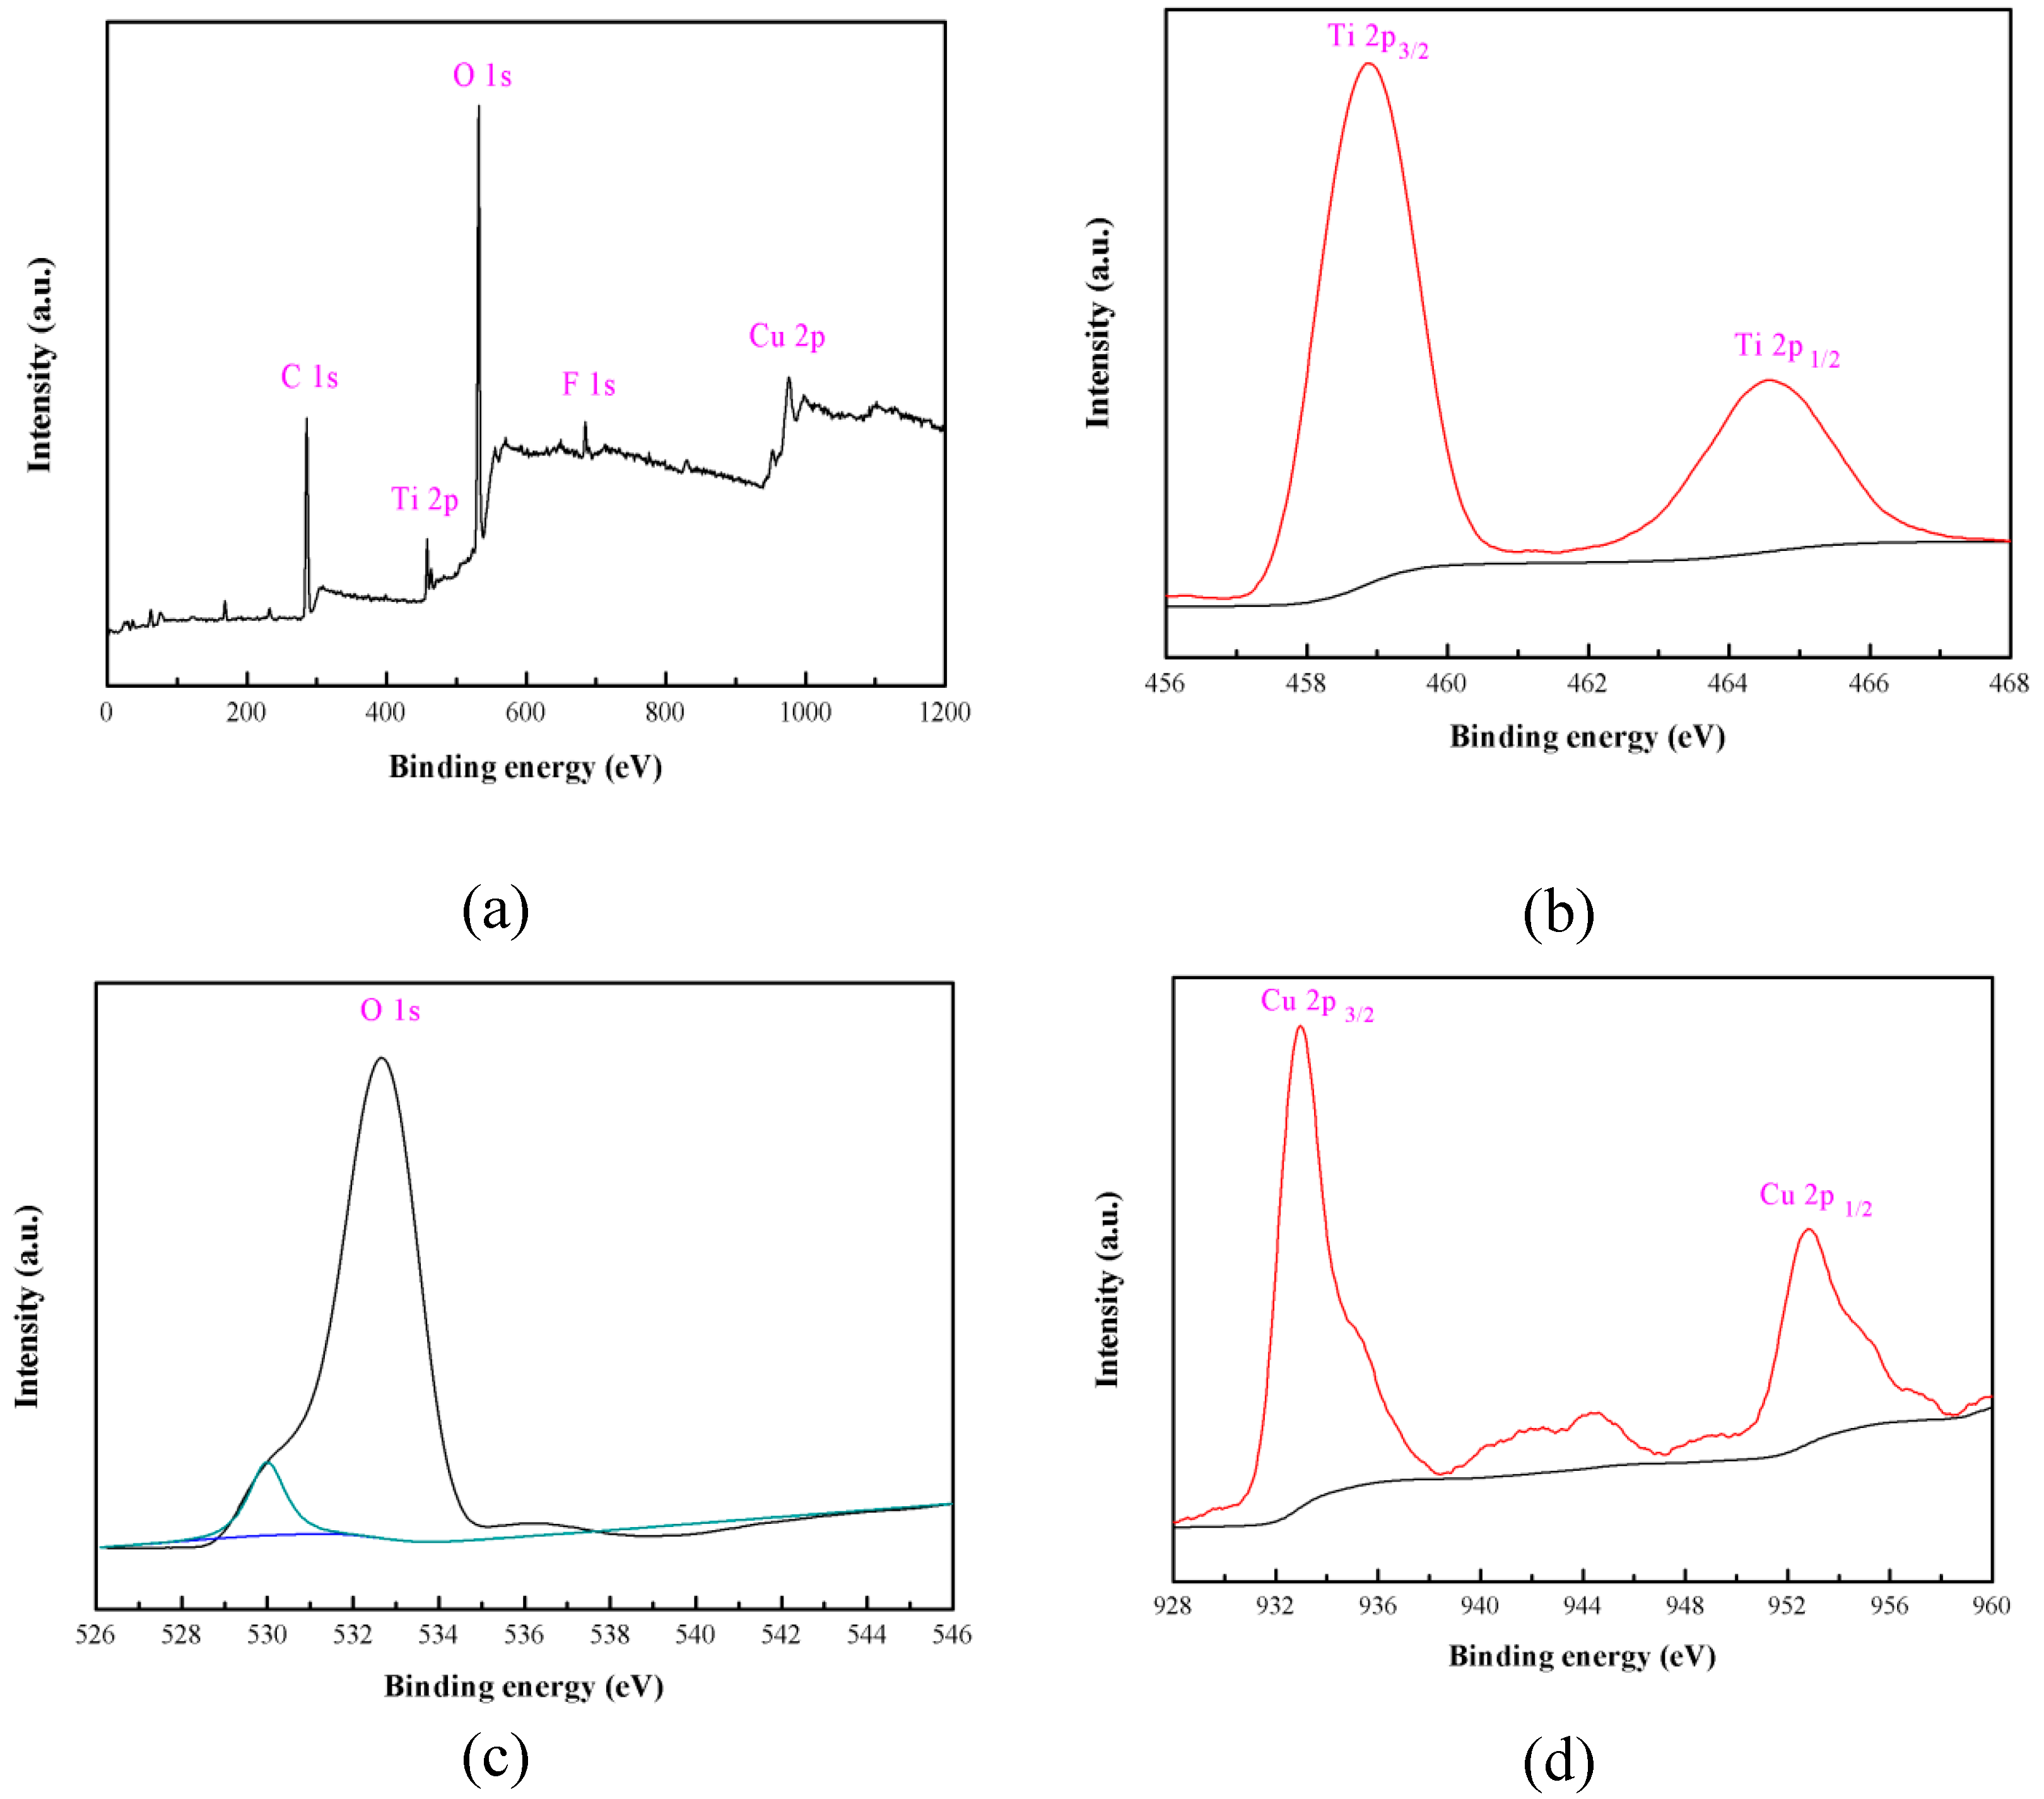
2.7. XPS Analysis of Catalyst

The elements and valence states of Cu2O/(001)TiO2 were analyzed by XPS, as shown in Figure 7a. A survey spectra of Cu2O/(001) TiO2 is seen, which contains information on C 1s, Ti 2p, O 1s, F 1s, and Cu 2p. Figure 7b showed that the binding energies for Ti 2p 3/2 and Ti 2p 1/2 are 458.90 and 464.59 eV, respectively, because Ti existed in the structure as Ti4+ [49,50], which was favorable for charge transfer between TiO2 and Cu2O. Figure 7c showed two characteristic peaks of O 1S in Cu2O/(001)TiO2, lattice oxygen of catalysts at 530.11 eV, and water molecules adsorbed on the catalyst surface at 532.64 eV [51,52]. Figure 7d showed peaks near 932.90 and 952.77 eV, which are characteristic of Cu+1 [53,54].

2.8. Fluorescent Analysis of Catalysts

Fluorescence spectra were used to characterize the photogenerated electron-hole combination of the photocatalysts. The higher the photogenerated electron-hole binding law, the stronger the fluorescence intensity [55]. It can be seen from Figure 8 that the photogenerated electrons and photogenerated holes of (001)TiO2 were greatly reduced after the introduction of Cu2O composite, which significantly improved the degradation efficiency of the catalyst during the degradation process [56].

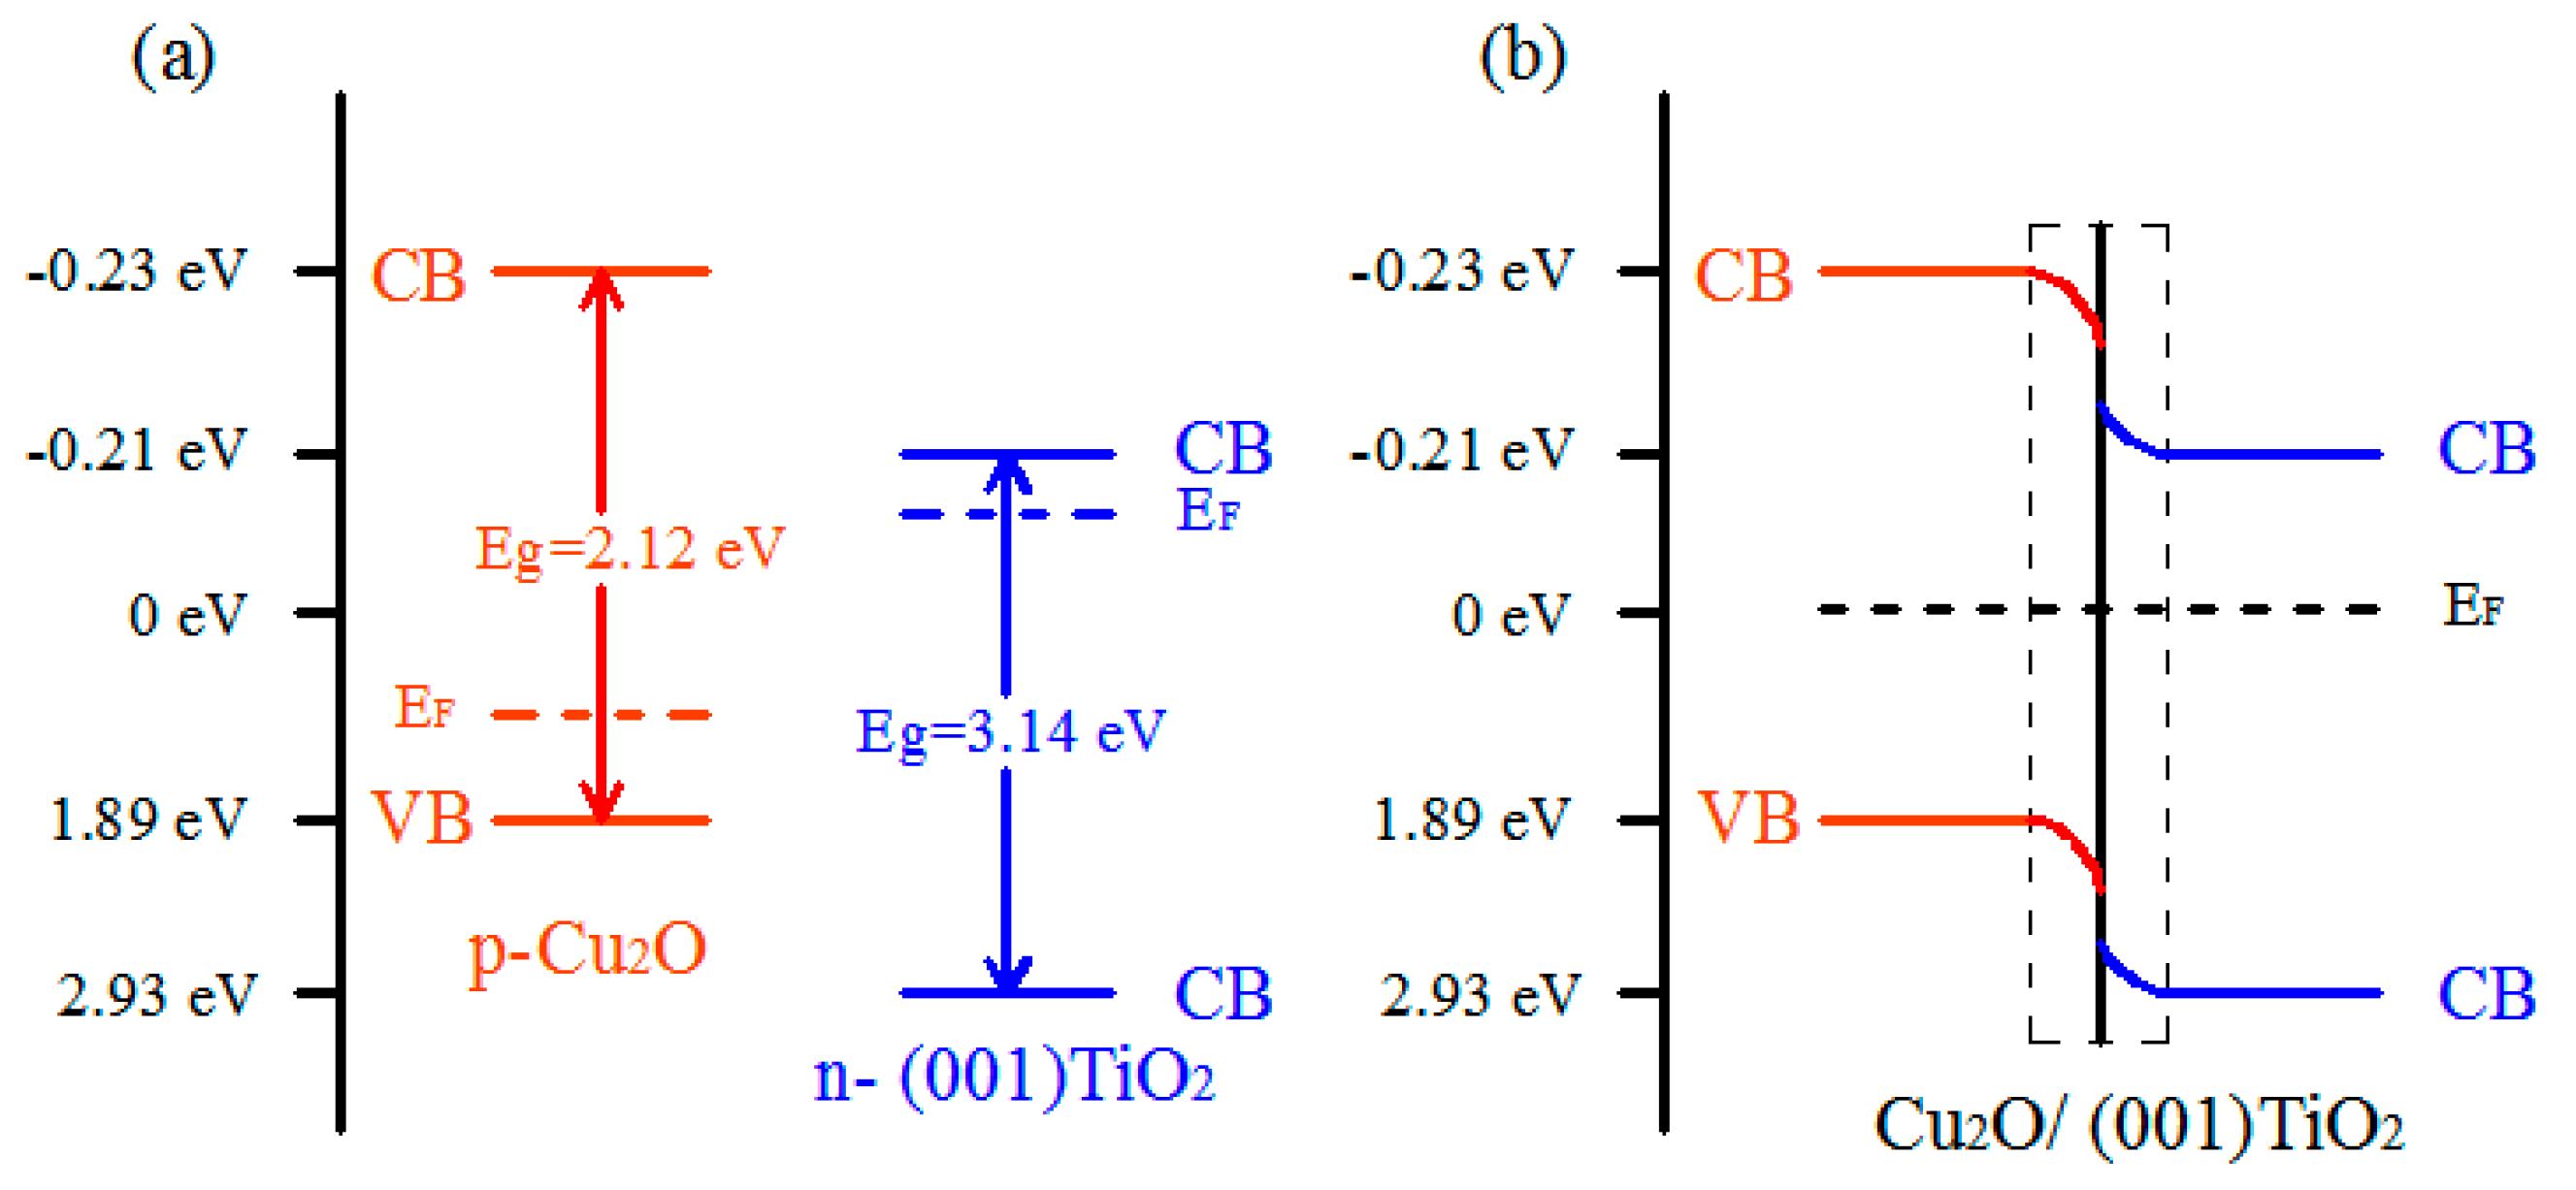
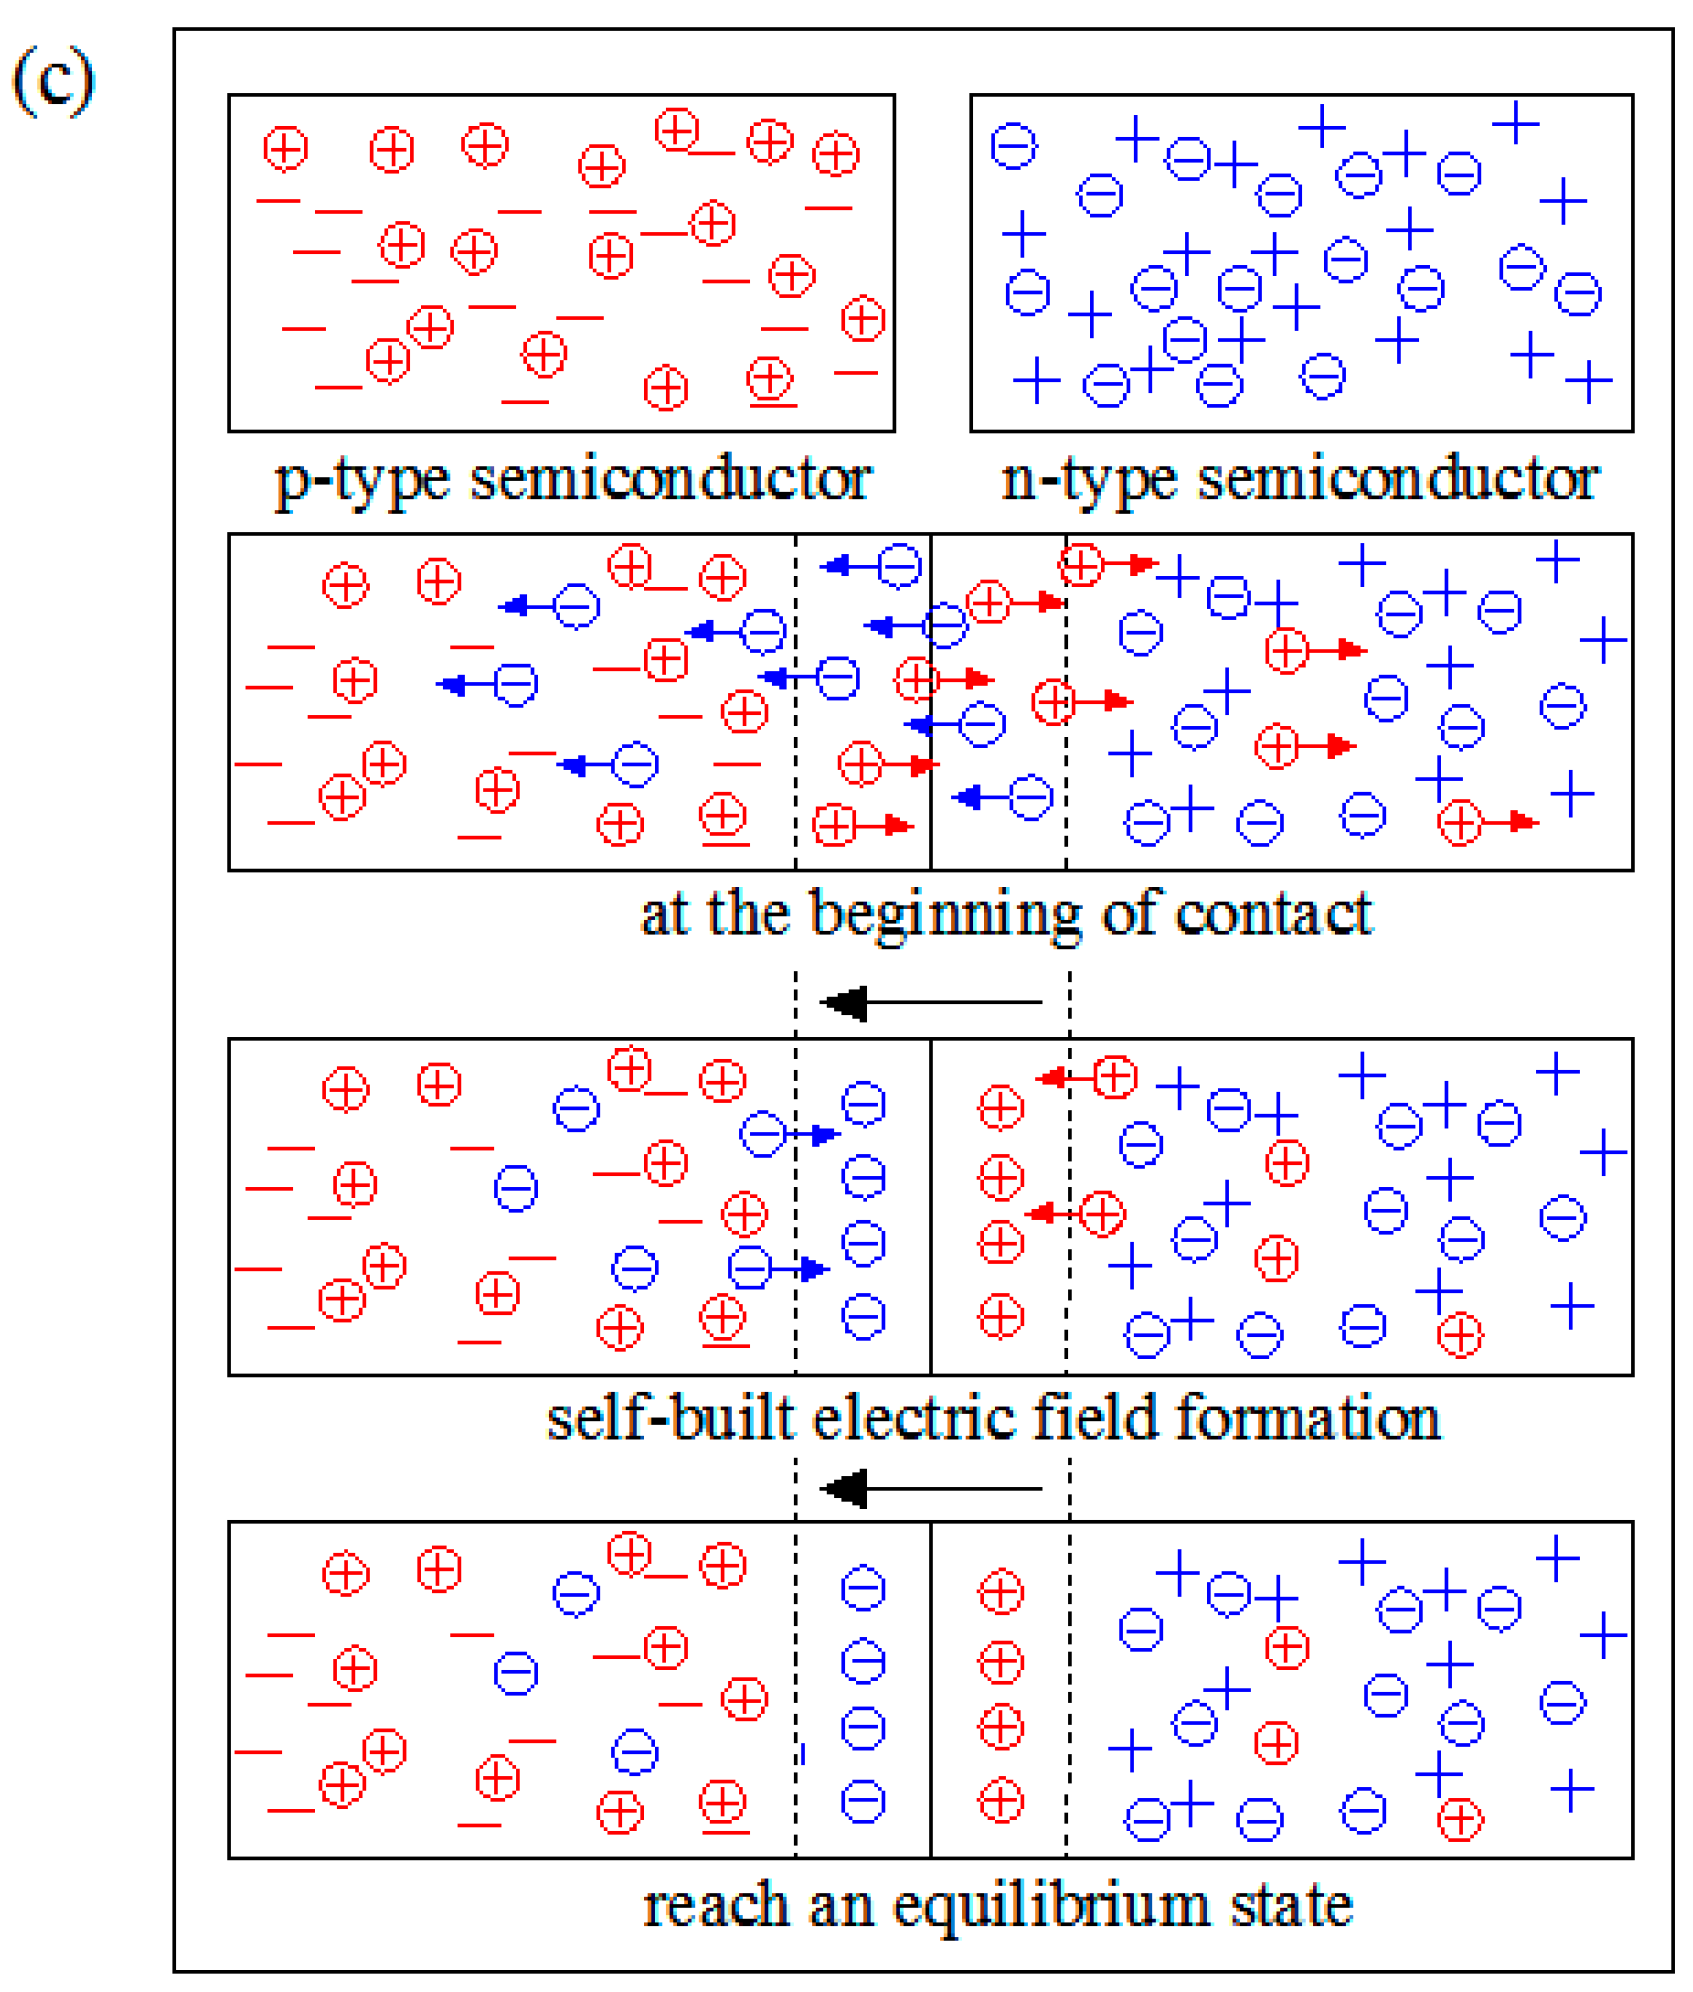
2.9. Compound Mechanism of Cu2O/(001)TiO2

We will explore the reasons for the improvement of photocatalytic performance by discussing the compound material mechanism. The conduction band position of semiconductor can be calculated by empirical formula [57]:
E CB   =   χ   Ec Eg / 2 E VB   =   E CB   +   Eg
where, ECB is the conduction band energy of semiconductors, χ is the geometric average of the absolute electronegativity of atoms in semiconductors, Ec is a constant relative to the standard hydrogen electrode (4.5 eV), Eg is the band gap width of semiconductors, and EVB is the valence band energy of semiconductors. The χ values of (001)TiO2 and Cu2O are about 5.86 and 5.33 eV, respectively.
The Eg values of (001)TiO2 and Cu2O were 3.14 and 2.12 eV, the ECB values of (001)TiO2 and Cu2O were −0.21 and −0.23 eV, and the EVB values were 2.93 and 1 eV, respectively, as shown in Figure 9a. Therefore, the electron transfer took place from the p-type semiconductor Cu2O onto the surface of n-type semiconductor (001)TiO2, which is helpful for the separation of light carriers and the catalytic performance of the composite catalyst, since EF of Cu2O and (001)TiO2 have differences in energy before and after catalyst contact. When p-type semiconductor contacts with n-type semiconductor, since the carriers type and concentration are different on both sides of the contact surface, the holes in the p-region are diffused toward the n-region, and the electrons in the n-region are also diffused into the p-region. This results in a decrease in the hole concentration on the side of the p-region near the interface, and a decrease in the electron concentration on the side of the n-region near the interface, so that there are almost no carriers that can move at the interface. Therefore, a positive space charge is generated in the n-region, and a negative space charge is generated in the p-region. These space charges form a self-built electric field near the interface, and the electric field direction points from the n-region to the p-region. Under the action of this electric field, under the action of this electric field, the carrier will drift and its direction is exactly opposite to the diffusion flow. The self-built electric field makes part of the holes entered the n-region return to the p-region, part of the electrons entered the p-region return to the n-region, and finally the diffusion flow and the drift flow reach an equilibrium state, and generally there is no macroscopic flow of carriers, as shown in Figure 9c. If there have no external electric field on either side of the p-n junction, then the entire system Fermi level should be the same. However, the existence of the space charge region will cause a self-built electric field in the vicinity of the interface, so that there is a potential difference near the p–n junction region, which eventually causes the energy band to bend, as shown in Figure 9b [58].

2.10. Degradation of Ammonia by the Catalysts

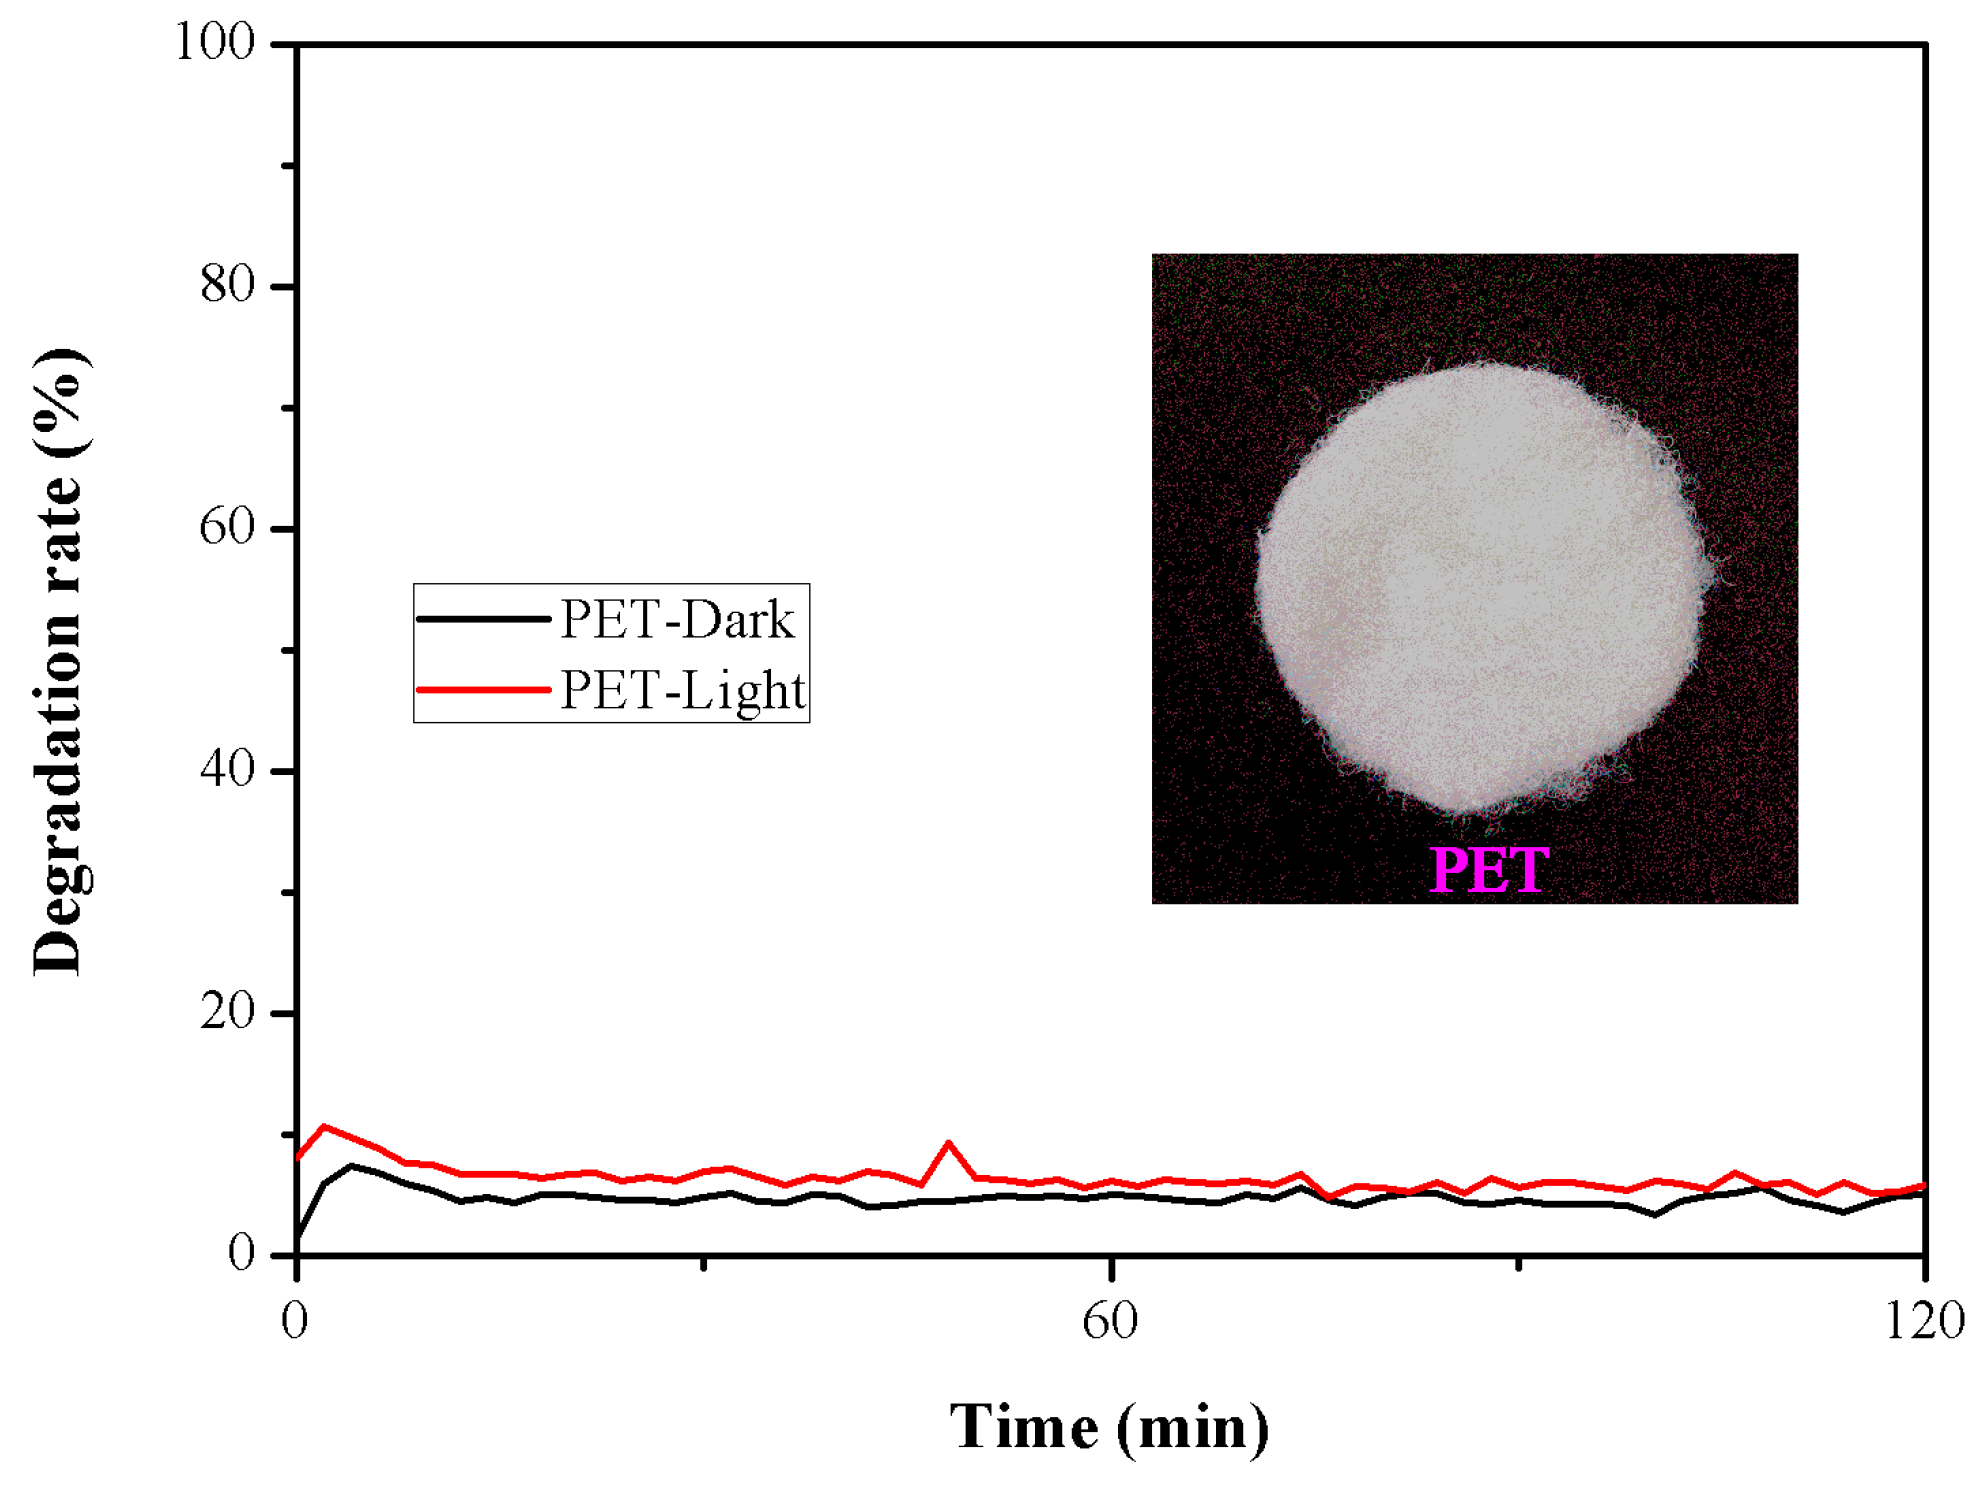
2.10.1. Controlled Test of Catalyst Carrier (Polyester Fiber Carrier)

The control experiment was conducted on the blank polyester fiber carrier (PET) that was not loaded with any photocatalyst; the absorptive photocatalytic efficiency of the blank PET on ammonia was measured in the presence or absence of light (Figure 10) within 120 min. Under the conditions of both dark and light, the degradation efficiency of the PET carrier on ammonia were 8% ± 1% respectively and the efficiency is not obviously improved, which means that the carrier of the PET itself hardly occurs photolysis. At the same time, the degradation rate of light is slightly lower than that of no light. It is possible that the temperature produced by light affects the stability of the gas.

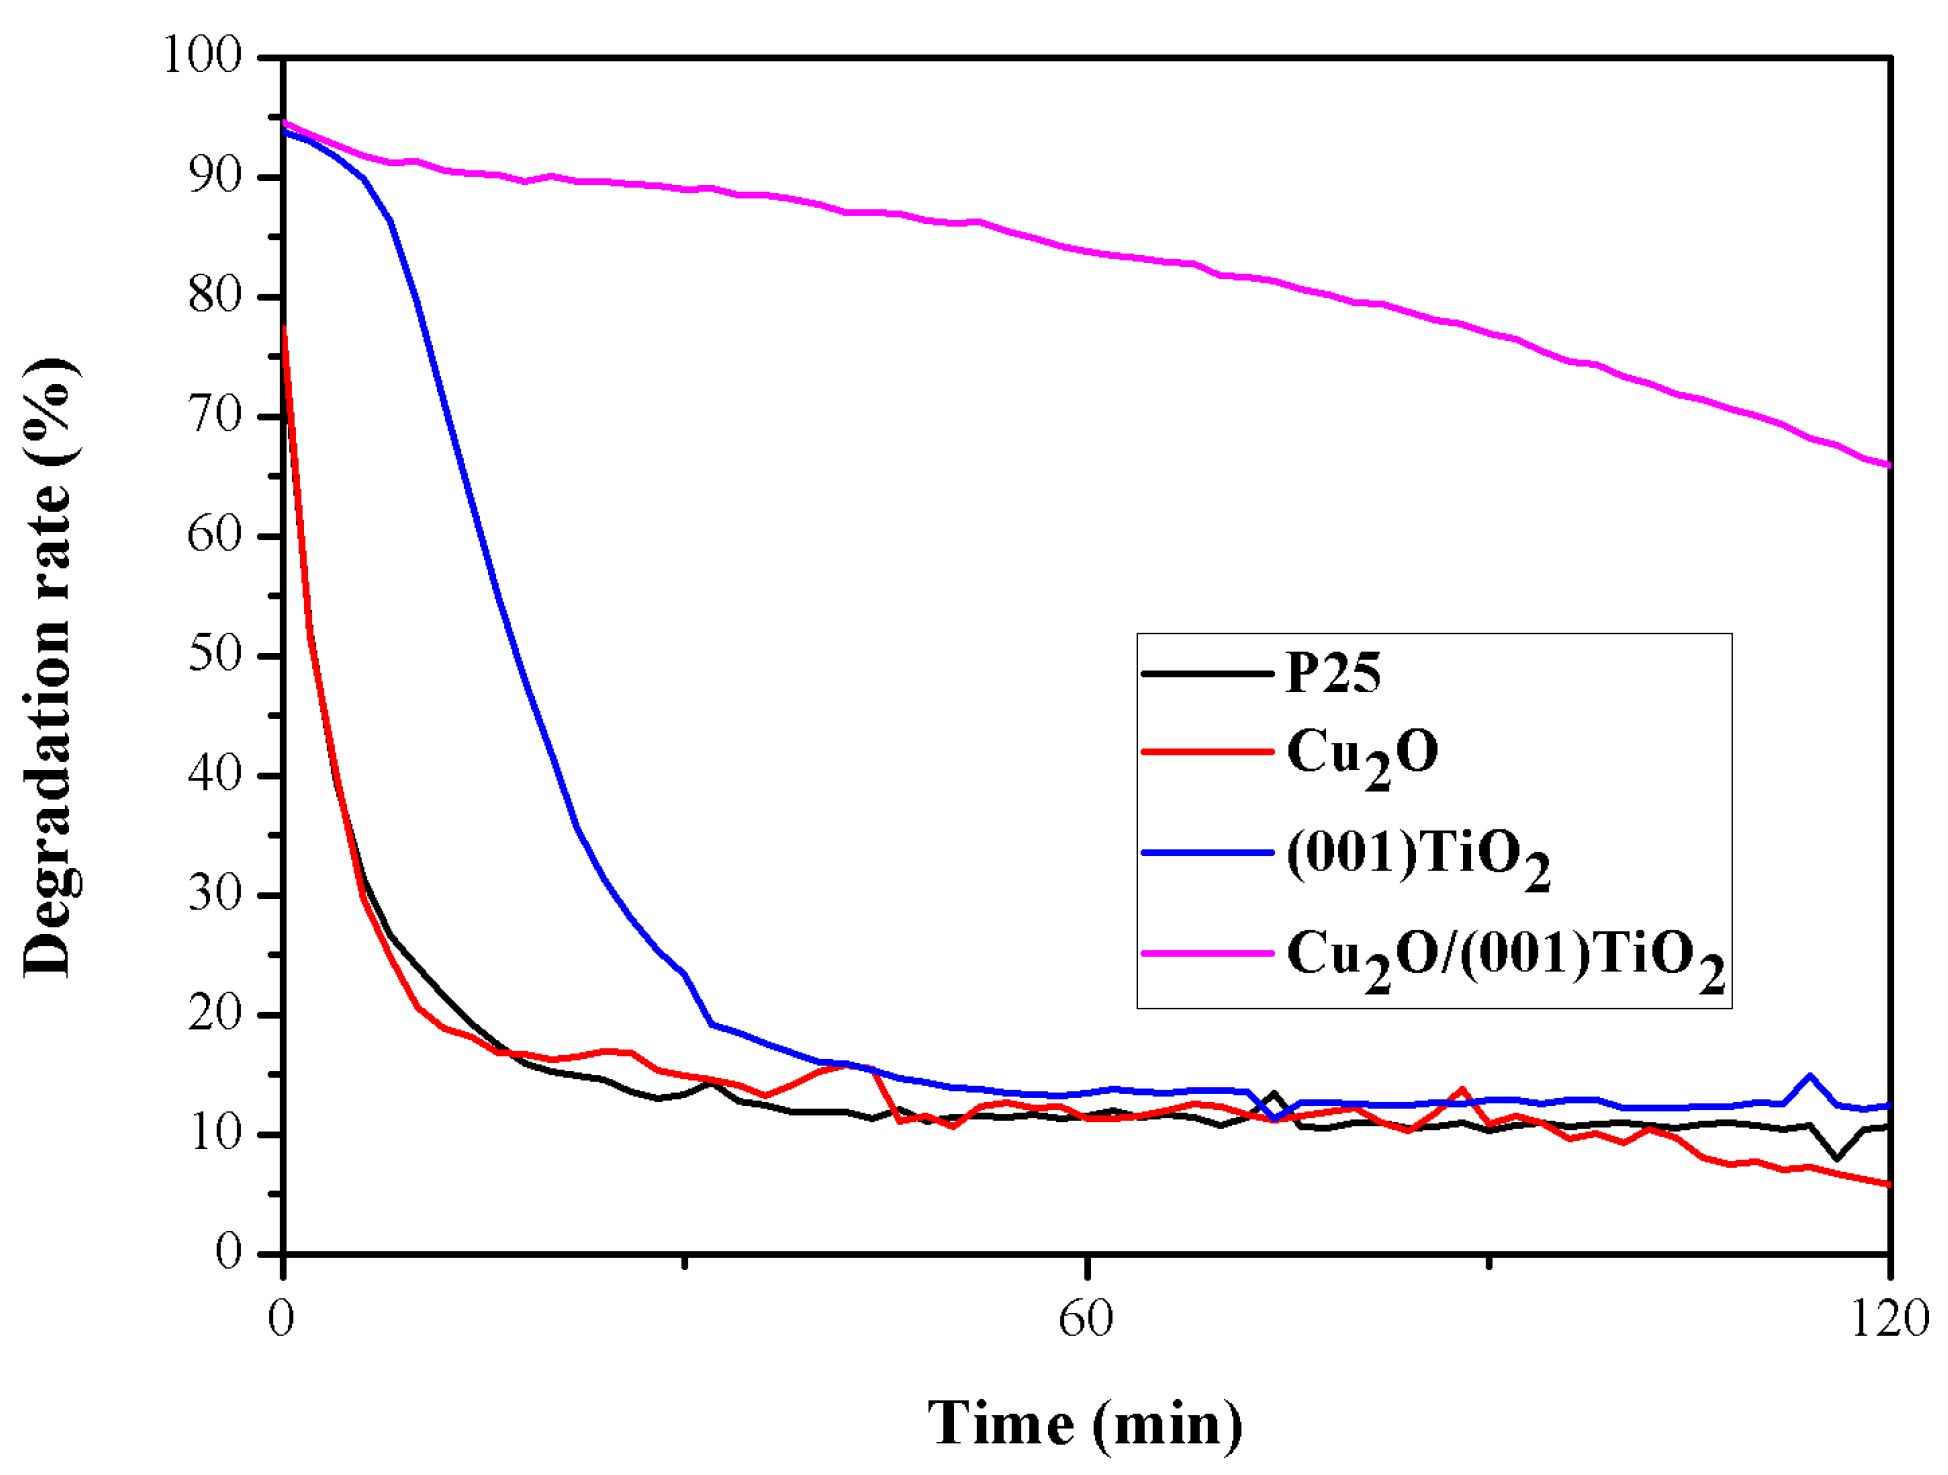
2.10.2. Degradation of Ammonia by Different Catalysts

As can be seen from Figure 11, the degradation rates of ammonia by single P25, Cu2O, and (001)TiO2 continued to decline in the first 30 min until about 15% ± 2%. This may be due to the fact that the sunlight itself is not pure ultraviolet light, so that the number of active sites can be activated may be relatively less. This means that many ammonia molecules were brought to the tail gas treatment area without contact with the catalyst. The degradation rate of ammonia by the composite catalyst Cu2O/(001)TiO2 maintained above 80% in the first 90 min, but decreased significantly in 90–120 min. This may be due to photocorrosion. Overall, the degradation effect of the composite catalyst was better than that of the single catalysts P25, Cu2O, and (001)TiO2.

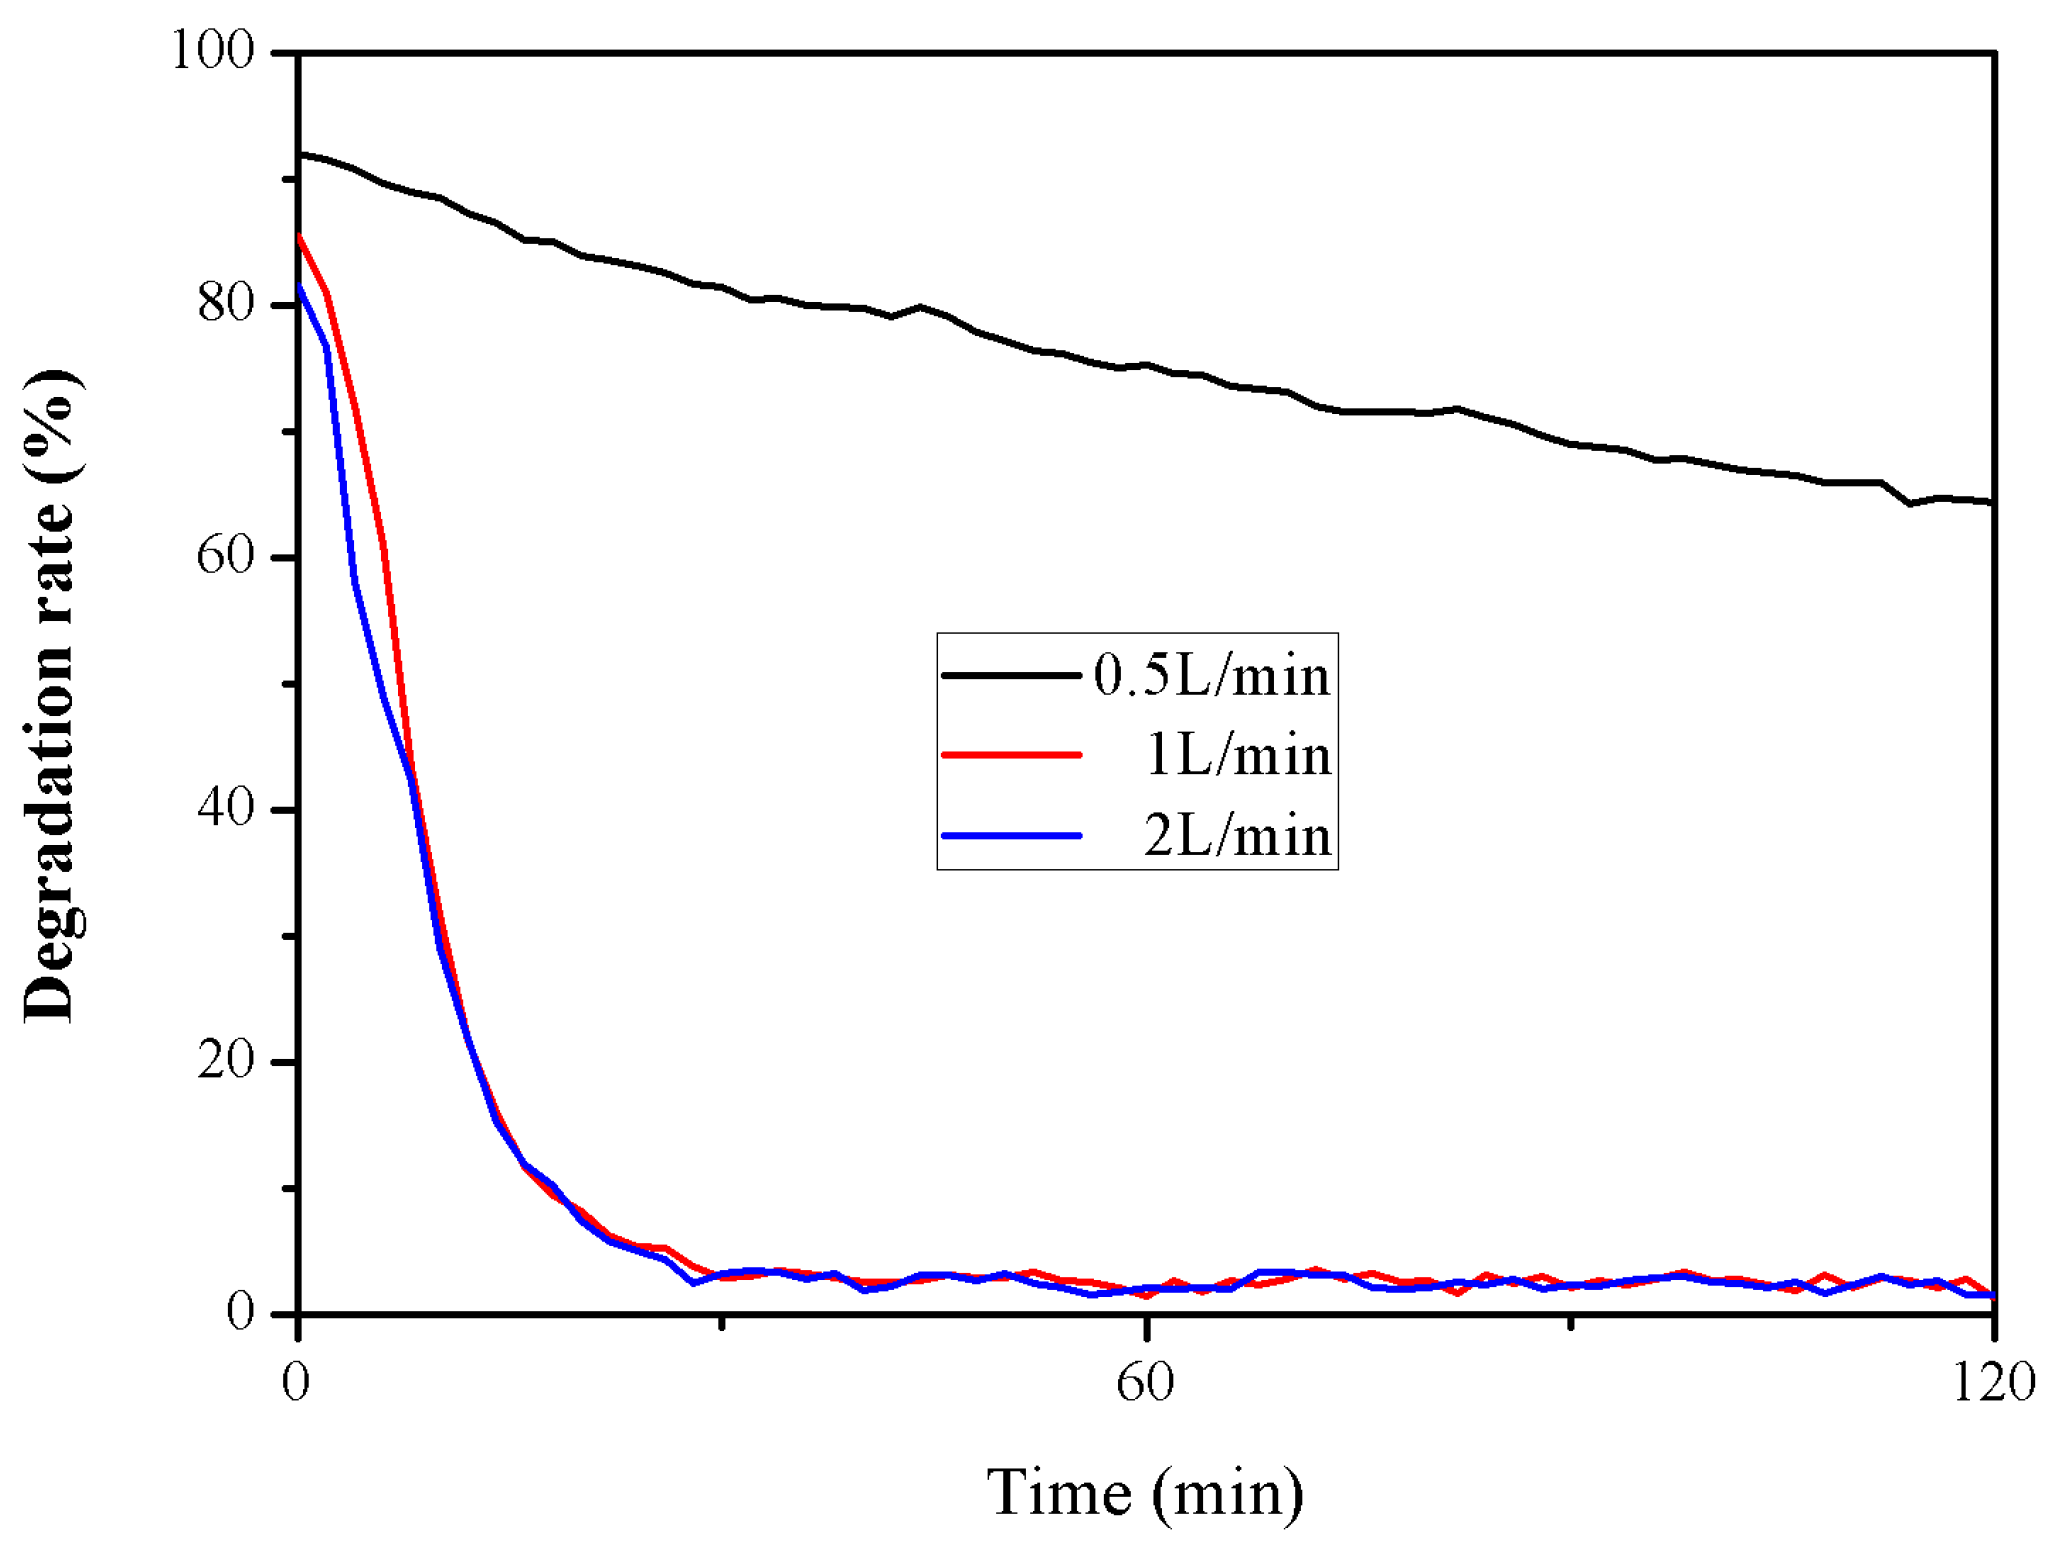
2.10.3. Degradation of Ammonia by Air Flow Rate

In the process of photocatalytic reaction of ammonia, the final reaction is carried out on the surface of photocatalyst, which generally undergoes the following continuous processes: ammonia diffuses to the surface of photocatalytic material; ammonia diffuses from the outer surface to the inner surface of the catalyst; ammonia molecules are adsorbed on the catalyst material; the adsorbed ammonia undergoes photocatalytic reaction; the products produced after photocatalytic reaction are desorbed from the surface of the catalyst; the products diffuse from the surface of the material to the outside surface; and the products desorb from the outside surface of the material to the air.
As can be seen from Figure 12, the air flow rate was varied between 0.5 min/L, 1 min/L, and 2 min/L. In this experiment, when other initial conditions were the same and the gas flow rate was gradually increased, the probability of ammonia adsorbed by the material decreases in unit time, the residence time on the catalyst surface was shortened, only NH3 adsorbed on the catalyst surface can be degraded, so the photocatalytic reaction was insufficient, and ultimately the degradation efficiency is reduced. Therefore, in the photocatalytic degradation of ammonia, it is very important to control the appropriate air flow rate.

2.10.4. Catalyst Reutilization Performance

As can be seen from Figure 13, the degradation rate of ammonia can be maintained at about 60% after three times of use, but the degradation effect will become worse as the number of times of use increases. This was because there was a loss of catalyst for each repeated use.

3. Materials and Methods

3.1. Materials

Butyl titanate, anhydrous glucose, sodium hydroxide (AR, Chengdu Kelong Chemical Reagent Factory, Chengdu, China), anhydrous ethanol (AR, Chongqing East Sichuan Chemical Co., Ltd., Chongqing, China), hydrofluoric acid (AR, Sichuan Xilong Chemical Co., Ltd., Chongqing, China), anhydrous copper sulfate (AR, Tianjin Da Mao Chemical Reagent Factory, Tianjin, China) and P25 (Degussa, Qingdao, China).

3.2. Preparation of (001)TiO2 Catalyst

Anhydrous ethanol (15.20 mL) was slowly added to 17.60 mL of butyl titanate and stirred until the solution was well distributed (designated solution A). Then, 15.20 mL of absolute ethanol was slowly added to 90 mL of ultra-pure water; 6 mL of hydrofluoric acid was then added to this solution (designated solution B). Next, the A solution was added to the B solution and was stirred under medium speed at room temperature for 2 h; the TiO2 gel was allowed to sit for 2 days and then moved to a stainless-steel reactor containing a PTFE inner container at 100 °C for 2 h. After cooling, the precipitates were separated and washed alternately with ultra-pure water and absolute ethanol for three times, drying in a 100 °C drying oven. After completion of a grinding process, the obtained powder was marked as (001)TiO2.

3.3. Preparation of Cu2O/(001)TiO2 Catalyst

CuSO4 (4.99 g) was weighed and dispersed in 100 mL distilled water. Then, 12.48 g (001)TiO2 was added to form a mixture. Ultrasound was used for 20 min. NaOH (4 g) was dissolved in 20 mL of distilled water; glucose (7.5 g) was dissolved in 75 mL of distilled water; then, the dissolved sodium hydroxide solution was added to the mixture of CuSO4 and (001)TiO2 dropwise, forming a blue precipitate. Then, the glucose solution was placed on a constant temperature magnetic stirrer and stirred continuously until the solution was heated to 34 °C. The heated glucose solution was added to the blue precipitation solution dropwise; then, the mixed solution was placed on a constant temperature magnetic stirrer and was stirred continuously, heated, and reacted until the solution reached 70 °C, and kept for 15 min at that temperature. During the whole process, the solution gradually changed from blue to dark green. Eventually, a brick-red precipitate appeared. The brick-red precipitate solution was centrifuged and then washed repeatedly with deionized water for three times. The brick-red substance was obtained by drying at 60 °C. Cu2O/(001)TiO2 was obtained by grinding the brick-red substance into powder.

3.4. Catalyst Powder Loading

In order to prevent the powder catalyst from blowing away, polyester fiber cotton was used as a carrier; this material has good light transmittance, is light-weight, and is easy to operate. The cotton was treated with 5 mol/L NaOH for 2 h, was washed repeatedly with deionized water until its pH was neutral, and was dried in a blast drying oven at 60 °C.
Before the catalysts from Section 2.2 and Section 2.3 were dried, the treated carriers were put into the washed catalysts solution, ran at a medium speed for 4 h in an oscillator, and were removed and dried in a blast drying chamber at 60 °C.

3.5. Catalyst Characterization

The crystal phase characteristics of the catalysts were measured by X-ray diffractometry (XRD, D8 Advance, Bruker, Rheinstetten, Germany) with Cu Kαradiation (λ = 0.154 nm) under 40 kV at a scan speed of 6°/min. The optical properties of the catalysts were characterized with a UV-Vis spectrophotometer (UV-Vis, U-3010, Hitachi, Tokyo, Japan). The detailed lattice spacing of the as-synthesized samples was evaluated by a high-resolution transmission electron microscope (HRTEM, Tecnai G2 F20, FEI, Hillsboro, OR, USA). The crystal facet contents of the catalysts were analyzed by using Raman spectroscopy (Raman, LabRAM XploRA INV, Horiba, France). The morphology of the catalysts was observed by a field-emission scanning electron microscope (FE-SEM, Inspect F50, Thermo Fisher Scientific, Waltham, USA) with an accelerating voltage of 25 kV. The elemental composition and element valence state of samples were analyzed by X-ray photoelectron spectroscopy (XPS, EscaLab 250Xi, Thermo Fisher Scientific, Waltham, USA). The photoelectron hole recombination of samples was evaluated by Photoluminescence emission spectra (PL, F-2700, Hitachi, Tokyo, Japan).

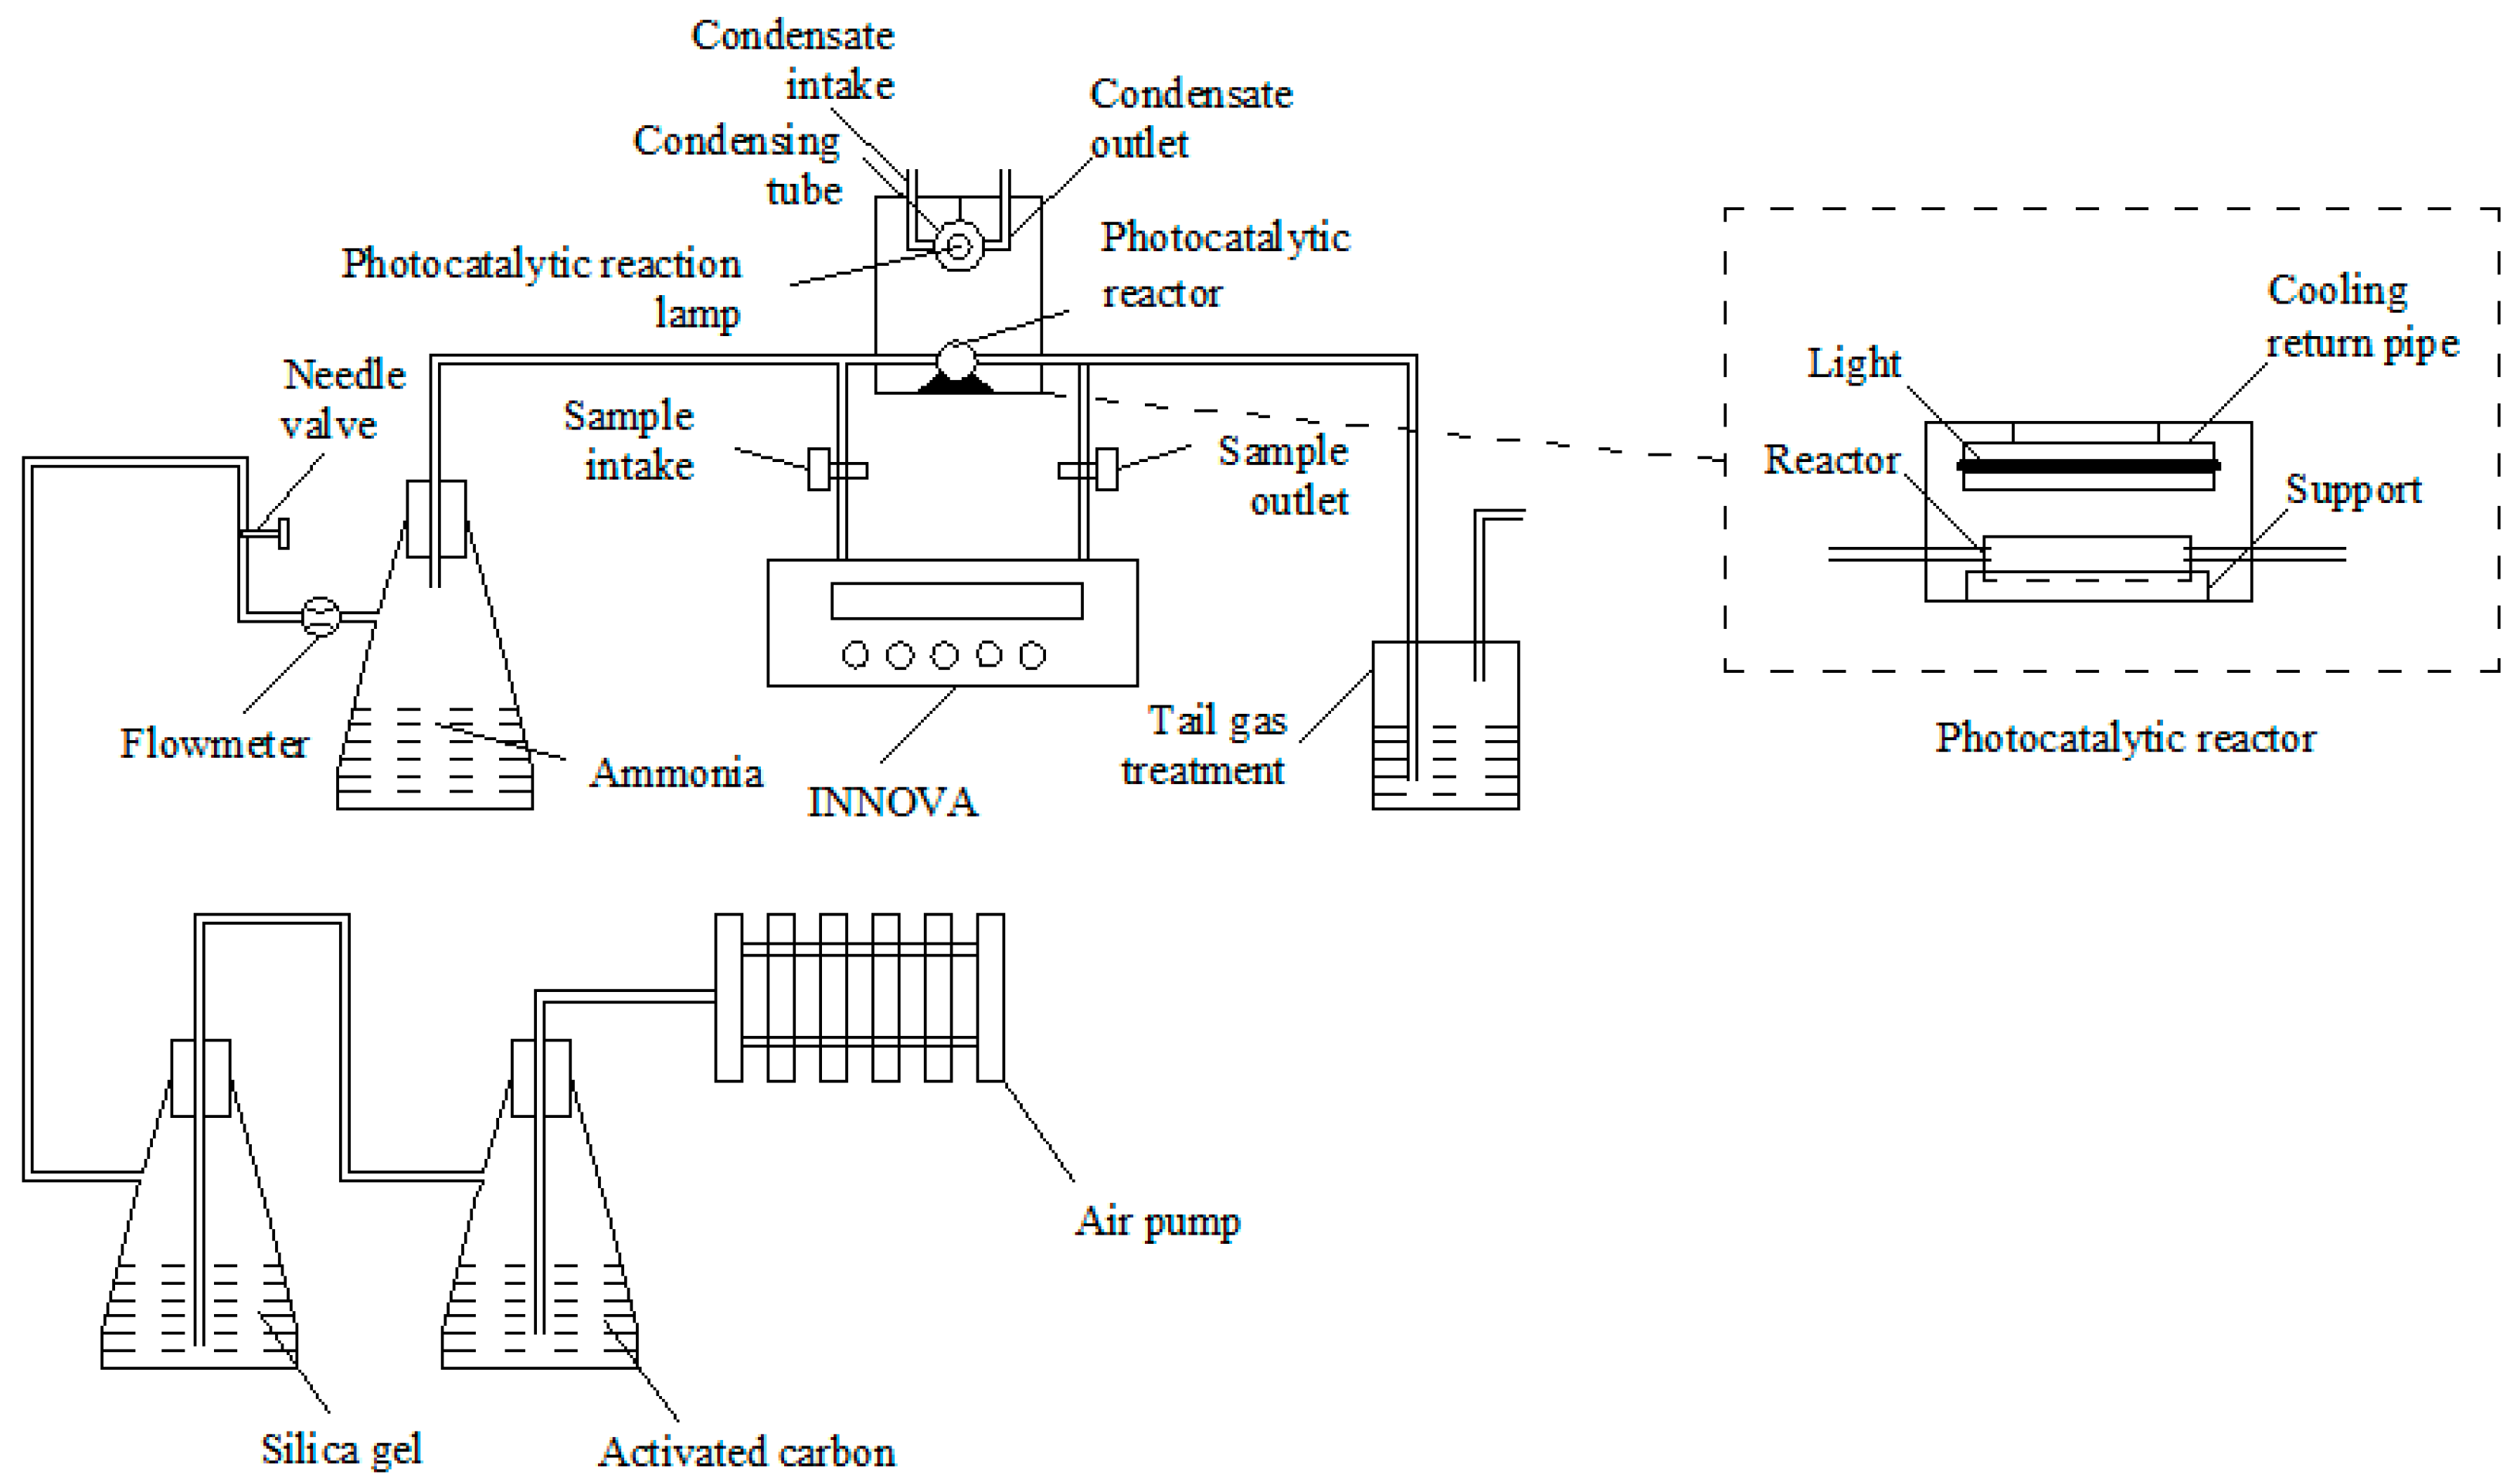
3.6. Experimental Equipment of Photocatalytic Ammonia Gas

As shown in Figure 14. A small air pump with a measuring range of 0–3 L/min was used as the source of air. The air from the air pump became clean air after being treated with activated carbon and silica gel; this clean air sent ammonia vaporized from ammonia water to the photocatalytic reaction chamber. The sampling inlet and sampling outlet were set before and after the photocatalytic reaction chamber, respectively, which were connected to the inlet and outlet of an INNOVA continuous detector to reflect the changes of concentration in the whole photocatalytic process. In the photocatalytic reaction chamber, a 300 W xenon lamp was used to simulate sunlight and a condensing reflux tube was installed outside the light source to reduce the influence of a large amount of heat generated by the light source on the experimental results; the remaining tail gas passed through the tail gas treatment device. The photocatalytic reaction tube was made of a quartz tube with a length of 6 cm, an outer diameter of 3 cm, and an inner diameter of 2.7 cm. The average load of the catalysts was 0.18 g. The remaining tail gas was treated by the tail gas treatment device.
There are two test ports before and after the reaction tube for ammonia degradation, namely, the sample intake and sample outtake, which are connected to INNOVA’s intake and outtake, respectively. INNOVA is an instrument for continuously detecting ammonia concentration changes online. The degradation rate at this moment is as follows:
The   degradation   rate   ( % )   = C in C out C in × 100 %
where, Cin is the ammonia concentration at the inlet and Cout is the concentration of ammonia after the photocatalytic reaction.

3.7. Photocatalytic Test

3.7.1. Controlled Test of Catalyst Carrier (Polyester Fiber)

The blank polyester fiber without any catalyst was placed in the sealed reactor. The temperature of the reactor was about 18 °C. The ammonia concentration was 120 ± 3 ppm, the air flow rate was 0.5 L/min, and the 300 W xenon lamp was used as the light source for the photocatalytic reaction.

3.7.2. Degradation of Ammonia by Different Catalysts

The polyester fibers loaded with P25, Cu2O, (001)TiO2, Cu2O/(001)TiO2 were placed in the sealed reactor. The temperature of the reactor was about 18 °C. The ammonia concentration was 120 ± 3 ppm, the air flow rate was 0.5 L/min, and the 300 W xenon lamp was used as the light source for the photocatalytic reaction.

3.7.3. Degradation of Ammonia by Air Flow Rate

The polyester fibers loaded with Cu2O/(001)TiO2 was placed in the sealed reactor. The temperature of the reactor was about 18 °C. The ammonia concentration was 120 ± 3 ppm, the air flow rate were 0.5, 1, 2 L/min, separately, and the 300 W xenon lamp was used as the light source for the photocatalytic reaction.

3.7.4. Catalyst Reutilization Performance

The polyester fibers loaded with Cu2O/(001)TiO2 was placed in the sealed reactor. The temperature of the reactor was about 18 °C. The ammonia concentration was 120 ± 3 ppm, the air flow rate was 0.5 L/min, and the 300 W xenon lamp was used as the light source for the photocatalytic reaction, after the reaction, the carrier was removed and baked at 70 °C for 30 min for the next reaction.

4. Conclusions

In this paper, the preparation of (001)TiO2 by the sol-gel method has been achieved and a heterogeneous structure of Cu2O/(001)TiO2 has been prepared by the impregnation-reduction method. XRD, SEM, PL, and other characterizations can confirm that Cu2O and (001)TiO2 were successfully compounded together. XPS can confirm that Cu was present in the form of Cu+1. The composite catalyst not only absorbed strongly in the visible light range, but also can be easily excited because of its small band gap, which made up for the shortcoming of low utilization of solar light by single TiO2. The results showed that the effect of Cu2O/(001)TiO2 composite catalyst on ammonia degradation is obviously better than that of single P25, Cu2O, and (001)TiO2. We also found that air flow has a very important impact in the whole photocatalytic ammonia gas. However, a great deal of dust in the colonies, preventing catalyst loss, and light corrosion are challenges that were present in this work.

Author Contributions

In this paper, S.P., L.L. and D.L. designed the experiments; H.W. conducted the experiments; J.Z. analyzed the data; Y.J. and Y.Z. analyzed the characterized the results. S.P. wrote the article.

Funding

This work was funded by the National Key R&D Program of China (2018YFD0800100), Chongqing Financial Special Funds Project-International Cooperation (19502), the earmarked fund for Modern Agro-industry Technology Research System (CARS-35), the agricultural development finance program of Chongqing (16406) and Scientific Observation and Experiment Station of Livestock Equipment Engineering in Southwest of China, Ministry of Agriculture and Rural Affairs.

Acknowledgments

We would like to thank LetPub (www.letpub.com) for its linguistic assistance during the preparation of this manuscript.

Conflicts of Interest

There is no conflict of interests exiting in the manuscript submission, and it is approved by all of the authors for publication. All the authors listed have approved the manuscript to be enclosed.

References

  1. Wu, Y.; Gu, B.; Erisman, J.W.; Reis, S.; Fang, Y.; Lu, X.; Zhang, X. PM2.5 pollution is substantially affected by ammonia emissions in China. Environ. Pollut. 2016, 218, 86–94. [Google Scholar] [CrossRef] [PubMed]
  2. Wang, R.; Ye, X.; Liu, Y.; Li, H.; Yang, X.; Chen, J.; Gao, W.; Yin, Z. Characteristics of atmospheric ammonia and its relationship with vehicle emissions in a megacity in China. Atmos. Environ. 2018, 182, 97–104. [Google Scholar] [CrossRef]
  3. Fuchs, W.; Wang, X.; Gabauer, W.; Li, Z. Tackling ammonia inhibition for efficient biogas production from chicken manure: Status and technical trends in Europe and China. Renew. Sustain. Energy Rev. 2018, 97, 186–199. [Google Scholar] [CrossRef]
  4. Schauberger, G.; Piringer, M.; Mikovits, C.; Zollitsch, W.; Hörtenhuber, S.J.; Baumgartner, J.; Niebuhr, K.; Anders, I.; Andre, K.; Hennig-Pauka, I. Impact of global warming on the odour and ammonia emissions of livestock buildings used for fattening pigs. Biosyst. Eng. 2018, 175, 106–114. [Google Scholar] [CrossRef]
  5. Zheng, M.; Zhou, N.; Liu, S.; Dang, C.; Liu, Y.; He, S.; Zhao, Y.; Liu, W.; Wang, X. N2O and NO emission from a biological aerated filter treating coking wastewater: Main source and microbial community. J. Clean. Prod. 2019, 213, 365–374. [Google Scholar] [CrossRef]
  6. Pu, S.H.; Liu, Z.H.; Yang, F.Y.; Long, D.B.; Liu, W.; Wang, H.; Huang, K.P.; Huang, X. Comparative study on the removal efficiency of hydrogen sulfide (H2S) using three different packings. J. Air Waste Manag. 2018, 68, 900–908. [Google Scholar] [CrossRef] [PubMed]
  7. Fujishima, A.; Honda, K. Electrochemical Photolysis of Water at a Semiconductor Electrode. Nature 1972, 238, 37–38. [Google Scholar] [CrossRef] [PubMed]
  8. Popova, G.Y.; Andrushkevich, T.V.; Chesalov, Y.A.; Stoyanov, E.S. In situ FTIR Study of the Adsorption of Formaldehyde, Formic Acid, and Methyl Formiate at the Surface of TiO2 (Anatase). Kinet. Catal. 2000, 41, 805–811. [Google Scholar] [CrossRef]
  9. Kim, Y.K.; Hong, S.J.; Kim, H.B.; Lee, S.W. Evaluation of In-Situ NOx Removal Efficiency of Photocatalytic Concrete in Expressways. KSCE J. Civ. Eng. 2018, 22, 2274–2280. [Google Scholar] [CrossRef]
  10. Negishi, N.; Takeuchi, K. Preparation of a transparent thin-film photocatalyst for elimination of VOC. Res. Chem. Intermediat. 2003, 29, 861–879. [Google Scholar] [CrossRef]
  11. Zhu, Q.; Liu, N.; Zhang, N.; Song, Y.Y.; Stanislaus, M.S.; Zhao, C.Y.; Yang, Y.N. Efficient photocatalytic removal of RhB, MO and MB dyes by optimized Ni/NiO/TiO2 composite thin films under solar light irradiation. J. Environ. Chem. Eng. 2018, 6, 2724–2732. [Google Scholar] [CrossRef]
  12. Zhang, Y.X.; Xu, M.J.; Li, H.; Ge, H.; Bian, Z.F. The enhanced photoreduction of Cr(VI) to Cr(III) using carbon dots coupled TiO2 mesocrystals. Appl. Catal. B Environ. 2018, 226, 213–219. [Google Scholar] [CrossRef]
  13. Yang, G.; Chen, D.M.; Ding, H.; Feng, J.J.; Zhang, J.Z.; Zhu, Y.F.; Hamid, S.; Bahnemannd, D.W. Well-designed 3D ZnIn2S4 nanosheets/TiO2 nanobelts as direct Z-scheme photocatalysts for CO2 photoreduction into renewable hydrocarbon fuel with high efficiency. Appl. Catal. B Environ. 2017, 219, 611–618. [Google Scholar] [CrossRef]
  14. Tambwekar, S.V.; Venugopal, D.; Subrahmanyam, M. H2 production of (CdS–ZnS)–TiO2 supported photocatalytic system. Int. J. Hydrogen Energy 1999, 24, 957–963. [Google Scholar] [CrossRef]
  15. Endres, P.J.; Tatjana, P.; Stefan, V.; Meade, T.J.; Woloschak, G.E. DNA−TiO2 Nanoconjugates Labeled with Magnetic Resonance Contrast Agents. J. Am. Chem. Soc. 2007, 129, 15760–15761. [Google Scholar] [CrossRef] [PubMed]
  16. Lettieri, M.; Colangiuli, D.; Masieri, M.; Calia, A. Field performances of nanosized TiO2 coated limestone for a self-cleaning building surface in an urban environment. Build. Environ. 2019, 147, 506–516. [Google Scholar] [CrossRef]
  17. Zhang, L.; Gao, Q.; Han, Y. Zn and Ag Co-doped Anti-microbial TiO2 Coatings on Ti by Micro-arc Oxidation. J. Mater. Sci. Technol. 2016, 32, 919–924. [Google Scholar] [CrossRef]
  18. Pan, T.T.; Cao, W.; Wang, M. TiO2 thin film temperature sensor monitored by smartphone. Opt. Fiber Technol. 2018, 45, 359–362. [Google Scholar] [CrossRef]
  19. Guarino, M.; Costa, A.; Porro, M. Photocatalytic TiO2 coating—To reduce ammonia and greenhouse gases concentration and emission from animal husbandries. Bioresour. Technol. 2008, 99, 2650–2658. [Google Scholar] [CrossRef] [PubMed]
  20. Costa, A.; Chiarello, G.L.; Selli, E.; Guarino, M. Effects of TiO2 based photocatalytic paint on concentrations and emissions of pollutants and on animal performance in a swine weaning unit. J. Environ. Manag. 2012, 96, 86–90. [Google Scholar] [CrossRef] [PubMed]
  21. Lee, S.M.; Lee, H.H.; Hong, S.C. Influence of calcination temperature on Ce/TiO2 catalysis of selective catalytic oxidation of NH3 to N2. Appl. Catal. A 2014, 470, 189–198. [Google Scholar] [CrossRef]
  22. Kolinko, P.A.; Kozlov, D.V. Products distribution during the gas phase photocatalytic oxidation of ammonia over the various titania based photocatalysts. Appl. Catal. B Environ. 2009, 90, 126–131. [Google Scholar] [CrossRef]
  23. Yamazoe, S.; Okumura, T.; Hitomi, Y.; Shishido, T.; Tanaka, T. Mechanism of Photo-Oxidation of NH3over TiO2: Fourier Transform Infrared Study of the Intermediate Species. J. Phys. Chem. C 2007, 111, 11077–11085. [Google Scholar] [CrossRef]
  24. Yamazoe, S.; Okumura, T.; Tanaka, T. Photo-oxidation of NH3 over various TiO2. Catal. Today 2007, 120, 220–225. [Google Scholar] [CrossRef]
  25. Li, H.X.; Bian, Z.F.; Zhu, J.; Huo, Y.N.; Li, H.; Lu, Y.F. Mesoporous Au/TiO2 nanocomposites with enhanced photocatalytic activity. J. Am. Chem. Soc. 2007, 129, 4538–4539. [Google Scholar] [CrossRef] [PubMed]
  26. Hu, L.Y.; Zhang, Y.M.; Zhang, S.M.; Li, B.X. A transparent TiO2–C@TiO2–graphene free-standing film with enhanced visible light photocatalysis. RSC Adv. 2016, 6, 43098–43103. [Google Scholar] [CrossRef]
  27. Wu, K.; Cui, J.B. Synthesis of TiO2 nanocrystals with exposed {001} facets and improved photocatalytic activity. Optik 2018, 164, 556–560. [Google Scholar] [CrossRef]
  28. Lazzeri, M.; Vittadini, A.; Selloni, A. Erratum: Structure and energetics of stoichiometric TiO2 anatase surfaces [Phys. Rev. B 63, 155409 (2001)]. Phys. Rev. B 2002, 65, 1–5. [Google Scholar] [CrossRef]
  29. Ali, M.M.; Sandhya, K.Y. Selective photodegradation and enhanced photo electrochemical properties of titanium dioxide–graphene composite with exposed (001) facets made by photochemical method. Sol. Energy Mater. Sol. Cells 2016, 144, 748–757. [Google Scholar] [CrossRef]
  30. Zhou, L.; Wang, L.Z.; Lei, J.Y.; Liu, Y.D.; Zhang, J.L. Fabrication of TiO2/Co-g-C3N4 heterojunction catalyst and its photocatalytic performance. Catal. Commun. 2017, 89, 125–128. [Google Scholar] [CrossRef]
  31. Hoyer, P.; Konenkamp, R. Photoconduction in porous TiO2 sensitized by PbS quantum dots. Appl. Phys. Lett. 1995, 66, 349–351. [Google Scholar] [CrossRef]
  32. Yu, S.Q.; Ling, Y.H.; Wang, R.G.; Zhang, J.; Qin, F.; Zhang, Z.J. Constructing superhydrophobic WO3@TiO2 nanoflake surface beyond amorphous alloy against electrochemical corrosion on iron steel. Appl. Surf. Sci. 2018, 436, 527–537. [Google Scholar] [CrossRef]
  33. Li, Z.Z.; Xin, Y.M.; Zhang, Z.H. New Photocathodic Analysis Platform with Quasi-Core/Shell-Structured TiO2 @Cu2 O for Sensitive Detection of H2O2 Release from Living Cells. Anal. Chem. 2015, 87, 10491–10497. [Google Scholar] [CrossRef] [PubMed]
  34. Li, G.S.; Wu, L.; Li, F.; Xu, P.P.; Zhang, D.Q.; Li, H.X. Photoelectrocatalytic degradation of organic pollutants via a CdS quantum dots enhanced TiO2 nanotube array electrode under visible light irradiation. Nanoscale 2013, 5, 2118–2125. [Google Scholar] [CrossRef] [PubMed]
  35. Zoolfakar, A.S.; Rani, R.A.; Morfa, A.J.; Mullane, A.P.; Zadeh, K.K. Nanostructured copper oxide semiconductors: A perspective on materials, synthesis methods and applications. J. Mater. Chem. C 2014, 27, 5247–5270. [Google Scholar] [CrossRef]
  36. Yang, Q.; Long, M.; Tan, L.; Zhang, Y.; Yang, J.O.; Liu, P.; Tang, A.D. Helical TiO2 Nanotube Arrays Modified by Cu–Cu2O with Ultrahigh Sensitivity for the Nonenzymatic Electro-oxidation of Glucose. ACS Appl. Mater. Interfaces 2015, 7, 12719–12730. [Google Scholar] [CrossRef] [PubMed]
  37. Senevirathna, M.K.I.; Pitigala, P.K.D.D.P.; Tennakone, K. Water photoreduction with Cu2O quantum dots on TiO2 nano-particles. J. Photochem. Photobiol. A 2005, 171, 257–259. [Google Scholar] [CrossRef]
  38. Barreca, D.; Carraro, G.; Gasparotto, A.; Maccato, C.; Cruzyusta, M.; Gómezcamer, J.L.; Morales, J.; Sada, C.; Sánchez, L. On the Performances of CuxO-TiO2 (x = 1, 2) Nanomaterials As Innovative Anodes for Thin Film Lithium Batteries. ACS Appl. Mat. Interfaces 2012, 4, 3610–3619. [Google Scholar] [CrossRef] [PubMed]
  39. Liu, X.M.; Cao, L.M.; Sun, W.; Zhou, Z.H.; Yang, J. A P/N type compounded Cu2O/TiO2 photo-catalytic membrane for organic pollutant degradation. Res. Chem. Intermed. 2016, 42, 6289–6300. [Google Scholar] [CrossRef]
  40. Syed, N.; Zavabeti, A.; Mohiuddin, M.; Zhang, B.Y.; Wang, Y.C.; Datta, R.S.; Atkin, P.; Carey, B.J.; Tan, C.; Embden, J.; et al. Sonication-Assisted Synthesis of Gallium Oxide Suspensions Featuring Trap State Absorption: Test of Photochemistry. Adv. Funct. Mater. 2017, 27, 1702295. [Google Scholar] [CrossRef]
  41. Datta, R.S.; Haque, F.; Mohiuddin, M.; Carey, B.J.; Syed, N.; Zavabeti, A.; Zhang, B.; Khan, H.; Berean, K.J.; Ou, J.Z.; et al. Highly active two dimensional α-MoO3−x for the electrocatalytic hydrogen evolution reaction. J. Mater. Chem. A 2017, 46, 24223–24231. [Google Scholar] [CrossRef]
  42. Wu, H.M.; Ma, J.Z.; Li, Y.B.; Zhang, C.B.; He, H. Photocatalytic oxidation of gaseous ammonia over fluorinated TiO2 with exposed (001) facets. Appl. Catal. B Environ. 2014, 152–153, 82–87. [Google Scholar] [CrossRef]
  43. Wen, X.; Long, M.; Tang, A. Flake-like Cu2O on TiO2 nanotubes array as an efficient nonenzymatic H2O2 biosensor. J. Electroanal. Chem. 2017, 785, 33–39. [Google Scholar] [CrossRef]
  44. Lv, K.; Xiang, Q.J.; Yu, J.G. Effect of calcination temperature on morphology and photocatalytic activity of anatase TiO2 nanosheets with exposed {001} facets. Appl. Catal. B Environ. 2011, 104, 275–281. [Google Scholar] [CrossRef]
  45. D’Amato, C.A.; Giovannetti, R.; Zannotti, M.; Rommozzi, E.; Ferraro, S.; Seghetti, C.; Minicucci, M.; Gunnell, R.; di Cicco, A. Enhancement of visible-light photoactivity by polypropylene coated plasmonic Au/TiO2 for dye degradation in water solution. Appl. Surf. Sci. 2018, 441, 575–587. [Google Scholar] [CrossRef]
  46. Chu, L.; Qin, Z.F.; Yang, J.P.; Li, X.A. Anatase TiO2 Nanoparticles with Exposed {001} Facets for Efficient Dye-Sensitized Solar Cells. Sci. Rep. 2015, 5, 12143. [Google Scholar] [CrossRef] [PubMed]
  47. Hou, C.T.; Hu, B.; Zhu, J.M. Photocatalytic Degradation of Methylene Blue over TiO2 Pretreated with Varying Concentrations of NaOH. Catalysts 2018, 8, 575. [Google Scholar] [CrossRef]
  48. Li, B.X.; Wang, Y.F. Facile synthesis and photocatalytic activity of ZnO–CuO nanocomposite. Superlattices Microstruct. 2010, 47, 615–623. [Google Scholar] [CrossRef]
  49. Hensel, J.; Wang, G.M.; Li, Y.; Zhang, J.Z. Synergistic Effect of CdSe Quantum Dot Sensitization and Nitrogen Doping of TiO2 Nanostructures for Photoelectrochemical Solar Hydrogen Generation. Nano Lett. 2010, 10, 478–483. [Google Scholar] [CrossRef] [PubMed]
  50. Park, S.M.; Razzaq, A.; Park, Y.H.; Sorcar, S.; Park, Y.; Grimes, C.A.; In, S.I. Hybrid Cu x O–TiO2 Heterostructured Composites for Photocatalytic CO2 Reduction into Methane Using Solar Irradiation: Sunlight into Fuel. ACS Omega 2016, 1, 868–875. [Google Scholar] [CrossRef]
  51. Yang, L.; Wang, W.H.; Zhang, H.; Wang, S.H.; Zhang, M.; He, G.; Lv, J.G.; Zhu, K.R.; Sun, Z.Q. Electrodeposited Cu2O on the {101} facets of TiO2 nanosheet arrays and their enhanced photoelectrochemical performance. Sol. Energy Mater. Sol. Cells 2017, 165, 27–35. [Google Scholar] [CrossRef]
  52. Xu, X.; Gao, Z.H.; Cui, Z.D.; Liang, Y.Q.; Li, Z.Y.; Zhu, S.L.; Yang, X.J.; Ma, J.M. Synthesis of Cu2O Octadecahedron/TiO2 Quantum Dot Heterojunctions with High Visible Light Photocatalytic Activity and High Stability. ACS Appl. Mater. Interfaces 2016, 8, 91–101. [Google Scholar] [CrossRef] [PubMed]
  53. Li, L.; Lei, J.G.; Jia, T.H. Facile fabrication of p–n heterojunctions for Cu2O submicroparticles deposited on anatase TiO2 nanobelts. Mater. Res. Bull. 2011, 46, 2084–2089. [Google Scholar] [CrossRef]
  54. Zhang, Z.Y.; Liu, K.C.; Bao, Y.N.; Dong, B. Photo-assisted self-optimizing of charge-carriers transport channel in the recrystallized multi-heterojunction nanofibers for highly efficient photocatalytic H2 generation. Appl. Catal. B 2017, 203, 599–606. [Google Scholar] [CrossRef]
  55. Yu, J.G.; Yu, H.G.; Cheng, B.; Zhao, X.J.; Yu, J.C.; Ho, W.K. The Effect of Calcination Temperature on the Surface Microstructure and Photocatalytic Activity of TiO2Thin Films Prepared by Liquid Phase Deposition. J. Phys. Chem. B 2003, 107, 13871–13879. [Google Scholar] [CrossRef]
  56. Ma, Q.L.; Zhang, H.X.; Cui, Y.Q.; Deng, X.Y.; Guo, R.N.; Cheng, X.W.; Xie, M.Z.; Cheng, Q.F. Fabrication of Cu2O/TiO2 nano-tube arrays photoelectrode and its enhanced photoelectrocatalytic performance for degradation of 2,4,6-trichlorophenol. J. Ind. Eng. Chem. 2018, 57, 181–187. [Google Scholar] [CrossRef]
  57. Hou, C.T.; Liu, W.L. One-step synthesis of OH-TiO2/TiOF2 nanohybrids and their enhanced solar light photocatalytic performance. R. Soc. Open Sci. 2018, 5, 172005. [Google Scholar] [CrossRef] [PubMed]
  58. Wang, Y.F.; Tao, J.J.; Wang, X.Z.; Wang, Z.; Zhang, M.; He, G.; Sun, Z.Q. A unique Cu2O/TiO2 nanocomposite with enhanced photocatalytic performance under visible light irradiation. Ceram. Int. 2017, 43, 4866–4872. [Google Scholar] [CrossRef]
Figure 1. SEM image of the carrier.
Catalysts 09 00267 g001
Figure 2. (a) XRD patterns of Cu2O, TiO2, and Cu2O/(001)TiO2; (b) EDS patterns of Cu2O/(001)TiO2.
Catalysts 09 00267 g002
Figure 3. HRTEM images of the catalysts. (a) (001)TiO2; (b) Cu2O/(001) TiO2.
Catalysts 09 00267 g003
Figure 4. Raman spectrum of the catalysts.
Catalysts 09 00267 g004
Figure 5. SEM images of the catalysts. (a,b) Cu2O; (c,d) (001)TiO2; (e,f) Cu2O/(001)TiO2.
Catalysts 09 00267 g005
Figure 6. (a) UV-vis Light Diffuse Reflectance spectra of the catalysts; (b) DRS spectra of the samples; (c) Band gap calculation from DRS spectra by Kubelka–Munk method of the materials.
Catalysts 09 00267 g006
Figure 7. XPS spectra of the as-prepared Cu2O/(001)TiO2 sample: (a) survey spectrum, (b) Ti 2p spectrum, (c) O 1s spectrum and (d) Cu 2p spectrum.
Catalysts 09 00267 g007
Figure 8. Fluorescence spectra of catalysts.
Catalysts 09 00267 g008
Figure 9. Energy band diagrams for (a) Cu2O and TiO2 before contact; (b) Cu2O/TiO2 composite; (c) Charge variations before and after contact of different types of semiconductors.
Catalysts 09 00267 g009aCatalysts 09 00267 g009b
Figure 10. Controlled test of catalyst carrier under light and dark conditions.
Catalysts 09 00267 g010
Figure 11. Degradation of ammonia by different catalysts.
Catalysts 09 00267 g011
Figure 12. Effect of air velocity on ammonia degradation.
Catalysts 09 00267 g012
Figure 13. Reusing performance of catalyst.
Catalysts 09 00267 g013
Figure 14. Schematic diagram of ammonia degradation unit.
Catalysts 09 00267 g014
Table 1. The band gap energy values of the different samples.
SamplesEg (eV)
Cu2O2.12
(001)TiO22.68
Cu2O/(001)TiO23.14

