Article

Advantageous Preparation of Digested Proteic Extracts from Spirulina platensis Biomass

by
Carlos M. Verdasco-Martín
,
Lea Echevarrieta
and
Cristina Otero
*
Department of Biocatalysis, Institute of Catalysis and Petroleochemistry, CSIC, C/ Marie Curie 2 L10, Madrid 28049, Spain
*
Author to whom correspondence should be addressed.
Catalysts 2019, 9(2), 145; https://doi.org/10.3390/catal9020145
Submission received: 26 November 2018 / Revised: 11 January 2019 / Accepted: 21 January 2019 / Published: 2 February 2019

Abstract

:
Spirulina biomass has great nutritional value, but its proteins are not as well adsorbed as animal ones are. New functional food ingredients and metabolites can be obtained from spirulina, using different selective biodegradations of its biomass. Four enzyme-assisted extraction methods were independently studied, and their best operation conditions were determined. Enzymes were employed to increase the yield of easily adsorbed proteic extracts. A biomass pre-treatment using Alcalase® (pH 6.5, 1% v/w, and 30 °C) is described, which increased the extraction yield of hydrophilic biocomponents by 90% w/w compared to the simple solvent extraction. Alcalase® gives rise to 2.5–6.1 times more amino acids than the others and eight differential short peptides (438–1493 Da). These processes were scaled up and the extracts were analyzed. Higher destruction of cell integrity in the case of Alcalase® was also visualized by transmission electron microscopy. The described extractive technology uses cheap, commercial, food grade enzymes and hexane, accepted for food and drug safety. It is a promising process for a competitive biofactory, thanks to an efficient production of extracts with high applied potential in the nutrition, cosmetic, and pharmaceutical industries.

1. Introduction

New functional products are increasingly demanded by the food, cosmetic, and pharmaceutical industries. Enzyme degrading processes of vegetable biomasses are a ‘white biotechnology’ for sustainable production of these new functional products [1]. Degradation of the cell membrane before the extraction of biocomponents facilitates the recovery of cytoplasmic products [2]. Since the great part of cyanobacteria biocomponents are inside the cell [3,4], their extraction can be improved via destructive pre-treatment of the cellular and subcellular structures [2,5]. To recover the biomass constituents, enzymatic tools provide energy savings compared to mechanical treatment processes or chemical catalytic hydrolysis at high temperatures. They also compete well in the selectivity of extracted biocomponents. Depending on the type of enzyme, the cellular membrane and cell components may be degraded in different ways. Consequently, the potential of this technology is high, considering the great variety of degradation products that can be obtained through the action of different types of selective catalysts. This fact opens many opportunities for enzyme technology. Examples of advantageous enzymatic processes able to extract high value products from vegetable and animal biomasses are: (i) degradation of cellulose to glucose using cellulases, and (ii) membrane phospholipid hydrolysis by lipases for production of essential fatty acids.
The food chain is based on algae and microalgae products. Microalgae are good protein and metabolite sources. Dietary supplements are obtained from them [6].
Cyanobacteria (also named blue algae) are prokaryotic, photosynthetic, unicellular microorganisms. To this group belong Arthrospira platensis and Arthrospira maxima (commonly named Spirulina platensis and Spirulina maxima). Spirulina platensis grows in Africa, Asia, and South America, with a characteristic helicoidal morphology [7]. Spirulina biomass (spirulina) has great potential for its composition and nutritional properties [8]. More than two thousand years ago, it was already being consumed by Aztecs. Spirulina properties are very much appreciated by modern society, being widely consumed for different types of healthy diets. Spirulina is a good source of essential amino acids, vitamins, carbohydrates, macro- and trace minerals, and other nutrients. The composition percent dry weight of spirulina is 64–73% protein, 12–17% carbohydrate, 5–7% lipids, 0.9% P, and 10.3–11.6% N. [9]. Blue pigments (phycocianins) of spirulina contribute to increasing the protein and iron availability [10]. Since 2011, spirulina is considered a safe ingredient in class A diet supplements [11]. Spirulina improves the immune system [12], and it has therapeutic effects against cancer and different virus, microbial, and inflammatory processes [1]. Spirulina provides high amounts of a unique antioxidant amino acid: L-ergothioneine (EGT; 2-mercaptohistidine trimethylbetaine) [13]. Spirulina supplementation provides vegetable proteins to the organism. To increase bioassimilation of its proteic material, extracts of its degraded proteic biocomponents must be obtained [14]. Additionally, the efficient extraction of intracellular components is limited by the cell membrane.
The cell membrane of Spirulina is analogous to that of Gram-negative bacteria [15]; they have two lipid membrane layers (cellular and cytoplasmic), separated by the murein layer. Murein is a rigid macromolecular structure formed by complex polymers of peptidoglycans and lipopolysaccharides. Peptidoglycans are covalently linked disaccharides and tetrapeptides. They are placed between cellular and cytoplasmic membranes, and linked to the external membrane layer by lipoproteins. Lipopolysaccharides are formed by a lipid and a complex polysaccharide chains. The cellular membrane has proteins non-covalently linked to lipids, whereas the cytoplasmic membrane is formed by lipoproteins (proteins covalently linked to lipids). The sugar complexes of cell membranes function as energy reserves (e.g., glucogen) [12].
Methods for cell membrane degradation may be physical (ultrasounds, microwaves [16,17], osmotic sock, pulse electric field, heat treatment [18], etc.), but may also be chemical or enzymatic [19,20]. The recovery of biocomponents can be achieved by different methods, such as those based on phase separation with solvents [21,22], supercritical fluids, pervaporation, etc. Safi et al. compared different fragile-cell-walled microalgae using several physical [23] and chemical [24] cell disruption methods. They were attacked according to the following order: Haematococcus pluvialis < Nannochloropsis oculata < Chlorella vulgaris < Porphyridium cruentumArthrospira platensis. These authors determined that among the physical methods employed for protein extraction, high-pressure cell disruption was the most efficient one, although it was not enough to recover more than 50% of the proteins from these green microalgae, indicating that more passes are required to completely disrupt their macrostructure, and thus more energy input is necessary [23]. Using several cycles, mechanical treatments released more proteins from all the microalgae compared to chemical treatments. Percentages of protein extracted from Spirulina biomass using an alkaline pre-treatment or high-pressure homogenization method were 68% and 75%, respectively [24]. On the other hand, some reports described different enzyme treatments of protein extracts from spirulina, obtaining several bioactive products. In all the cases, the protein extracts were obtained by mechanical methods, prior to being submitted to a given enzyme degradation. More precisely, the iron-chelating peptide Thr-Asp-Pro-Ile(Leu)-Ala-Ala-Cys-Ile(Leu), with a molecular weight of 802 Da, was obtained through the combined action of two proteases [25]. The protein extract was first obtained by homogenization of the cell suspension, centrifugation, and further precipitation of the supernatant with ammonium sulfate. The extracted material was then consecutively submitted to two proteolytic steps by two different proteases. In other study, the antihypertensive peptide Ile-Gln-Pro was prepared via Alcalase® digestion of previously extracted proteins by freeze–thawing and sonication procedures [26]. Similarly, two potential anti-inflammatory peptides (LDAVNR and MMLDF) were obtained by subsequent proteolysis with trypsin, chymotrypsin, and pepsine of the proteins that were previously extracted from spirulina by freeze–thawing and sonication procedures [27]. All these studies were focused on purification and characterization of particular bioactive peptides [25,26,27]. In these cases, only the fractions of proteins previously extracted by physical or mechanical methods were treated with enzymes, and in none of the cases did the authors take into consideration the advantage that the direct action of the enzymes on the spirulina cells provides: higher recovery of intracellular components (e.g., proteins). Hence, more studies based on direct enzyme extraction protocols are required. In order to take full advantage of the enzyme-assisted extractions of proteins, direct studies of the digestion of Spirulina cells by enzymes should be carried out. In that respect, appropriate use of the enzyme technology requires determining for each biocatalyst the influence of different operation parameters on the enzyme degrading activity for each specific biomass.
In this work, the application of different enzymes for obtaining easily adsorbed proteic extracts was studied. Different selective enzyme degradation processes of Spirulina biomass were investigated for the extraction of polar spirulina biocomponents. The biomass was enzymatically degraded using four different cheap and easily accessible commercial enzyme preparations. These processes at their corresponding best operation conditions were compared with the extraction done without any prior enzyme treatment of the biomass. In particular, two different enzyme treatments, based on the degradation of membrane proteins, lipoproteins, and peptidoglucan by two proteases (Alcalase® and Flavourzyme®), and two other biomass treatments using endo- and exo-glucanases (Ultraflo® and Vinoflow®) to breakdown the sugar polymer structure, were comparatively studied. The best values of the most important parameters of all the enzymatic pre-treatments for biomass degradation were determined. The corresponding extractive yields in dry weight of aqueous extracts were determined for the four enzyme extraction processes at their respective best conditions, and they were compared with those of the control extract (without enzyme assistance). Changes occurring at the cellular level after the different extraction processes were comparatively analyzed by transmission electron microscopy (TEM). Total amino acid contents of all hydrophilic extracts were compared.

2. Results and Discussion

A commercial dry biomass of the cyanobacteria Arthrospira platensis (Spirulina) was submitted to different enzyme degradations. S. platensis extractions after four different enzyme pre-treatments were independently studied. These processes were carried out in their respective best operation conditions and compared with the control (no enzyme added) extraction. Two distinct proteases and two distinct glucanases were used to favor biocomponent recovery via membrane enzymatic degradation. The four different enzyme extractions were analyzed in terms of both the weight yields of the dry aqueous extracts and their respective amino acids contents.

2.1. Enzyme-Assisted Extraction

The most important parameters of the enzyme-assisted degradation of spirulina were studied. The best operation conditions for each enzyme extraction were determined by following changes in each peak area value of the high performance liquid chromatography with a evaporative light scattering detector (HPLC-ELSD) chromatograms of the aqueous phase. In all cases, the area changes in all the significant peaks were inspected (see below). All significant peaks of the HPLC chromatogram exhibited the same dependence of the studied parameters, that is, the same variation (increase or decrease) of their area values with the studied parameter value, and the same optimal value. Hence, for the sake of clarity, the influences of pH, time, temperature, and enzyme loading are depicted with respect to the total area values of all significant peaks. Nevertheless, a couple of examples of the parameter (pH and time) effect in one peak area are also given.

2.1.1. Influence of pH

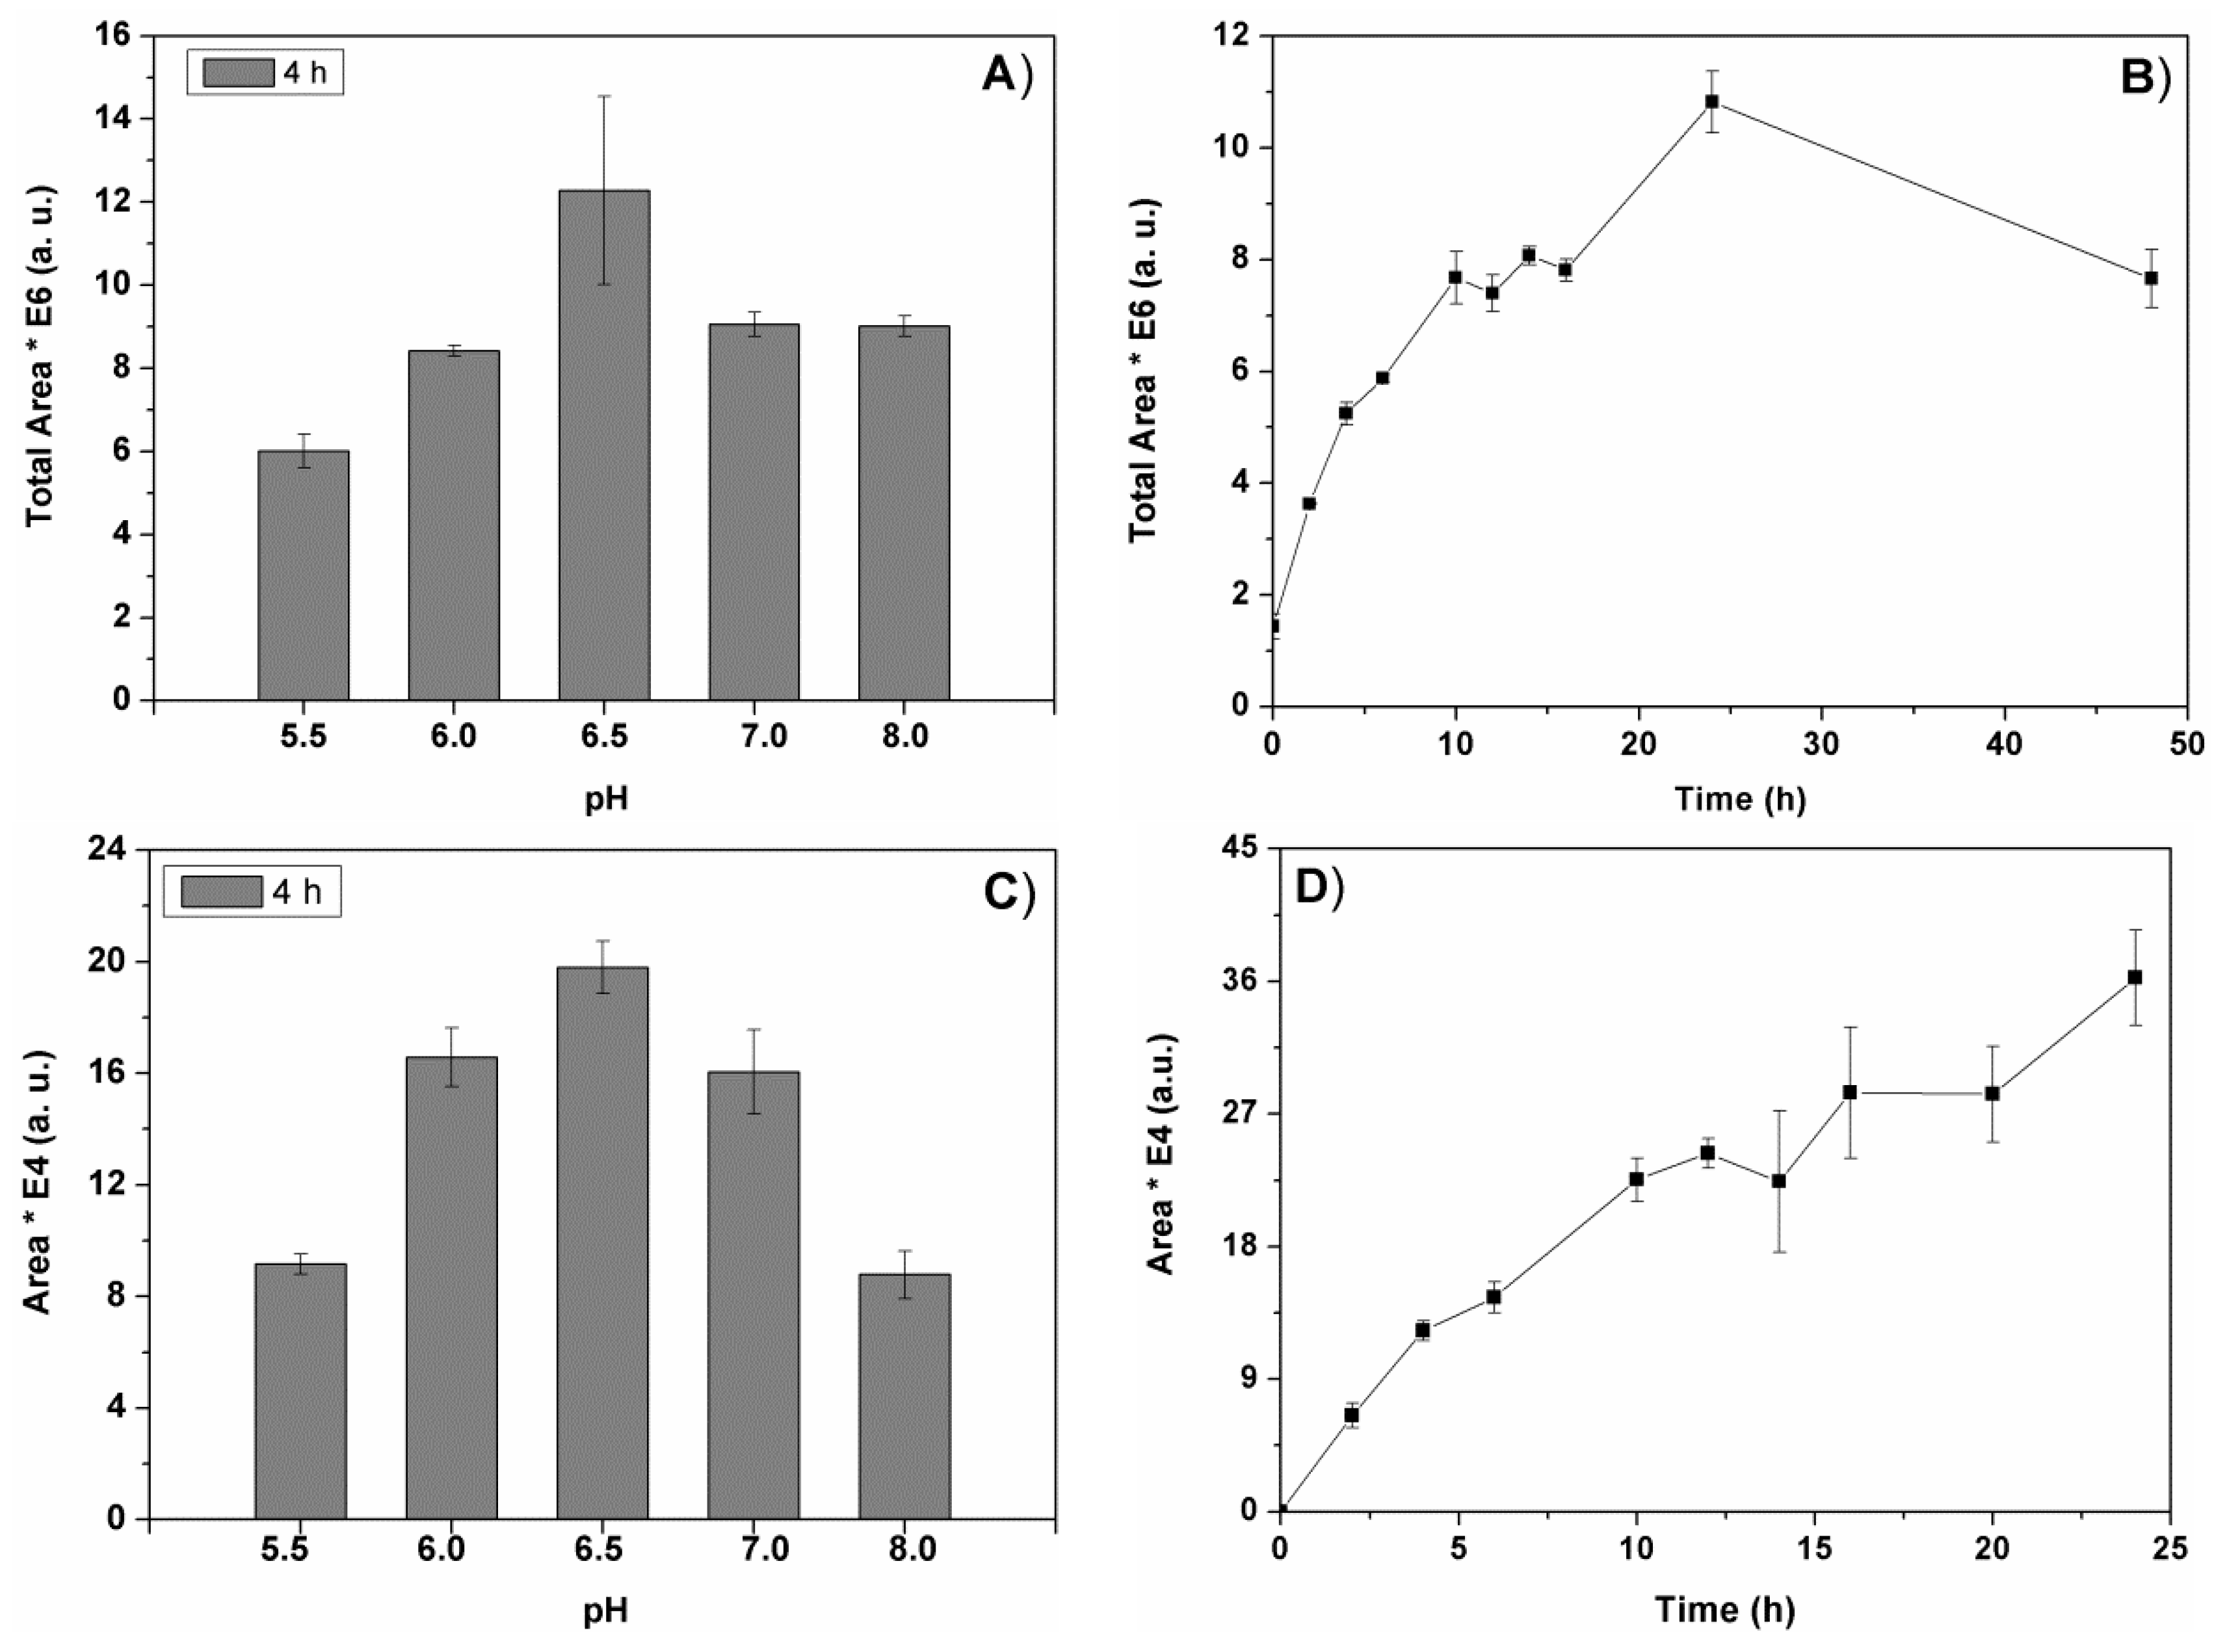
Figure 1 represents the change of the total peak areas in the chromatogram (Figure 1A), and the area of a representative individual peak (Figure 1C) obtained after 4h of biomass pre-treatment with Alcalase®. The maximal initial rate (4h) of the biocomponent extraction with Alcalase® was obtained at pH 6.5. The enzyme degradation process was faster at this pH value, giving rise to the maximal total peak area value obtained for a short time pre-treatment (4h, Figure 1A). For the extractions with Flavourzyme®, Ultraflo®, and Vinoflow®, the corresponding best pH values determined were 6.0, 7.0, and 6.5, respectively (not shown).
Lu et al. used a different pH value for the extraction of an anti-hypertensive peptide from spirulina using Alcalase® (pH 8.5 at 50 °C for 10h) after three cycles of freeze–thawing the biomass [26]. Kim et al. also used different operation conditions to obtain the iron-chelating peptide with a multi-enzymatic biomass degradation (Alcalase® pH 8.0 at 50 °C for 1 h + Flavourzyme® pH 7.0 at 50 °C for 8 h) [25]. The obtained products of their peptide degradation were also different from those of this study (work in progress, personal communication).
The dependence of the extraction yield on the pH parameter is a consequence of the effect of pH on the process of biomass degradation by the enzyme. Variations in the total charge of proteins with pH should determine their mutual interaction and interaction with the biocatalyst employed. For the extraction of anti-cancer biocomponents from spirulina, papaine presented an optimal pH of 6.5, while other enzymes exhibited very different optimal pH values (pH 2–8.5) [28]. Optimal values in the basic range of pH were earlier described for the extraction of spirulina antioxidants with different enzymes, although other group of enzymes exhibited low activities under these conditions [29]. Different proteases from those used here were earlier studied to extract spirulina oil, reporting an optimal pH range of 7.5–10 for the best biocatalyst [30].
The time course of the enzyme-assisted extraction at the best pH value was studied for the first 48 h. The results obtained with Alcalase® for all the chromatogram peaks are represented in Figure 1B, and for a representative peak in Figure 1D. Similarly to Alcalase® extraction, the other three types of enzyme extractions required 24 h of enzyme pre-treatment of spirulina to reach maximal recovery of biocomponents (not shown). These results (Figure 1B,D) were obtained via analyses of aliquots taken from the reaction mixtures at the indicated times, while those of Figure 1A,B correspond to analyses of lyophilized extracts. The two studies correspond to samples of different extract concentrations, so the area values of these two figures cannot be compared (see Materials and Methods Section 3.3.1).

2.1.2. Effect of Temperature

The effect of the temperature of the biomass pre-treatment on the extraction of polar biocomponents was carried out at the respective optimal pH values of each enzyme (Alcalase® at pH 6.5; Flavourzyme® at pH 6.0; Ultraflo® at pH 7.0; Vinoflow® at pH 6.5) and an enzyme loading of 1% (v/w) in the range 30–50 °C after 24 h of biomass treatment (Figure 2). The total area values of peak products of the corresponding aqueous extracts were calculated from the obtained HPLC-ELSD chromatograms. The area value corresponding to 1 g of spirulina was calculated and represented against temperature. Figure 2 depicts the total peaks area values obtained for Alcalase®.
Considering the experimental error, 30 °C was the best temperature determined for the extractions with Alcalase®. Similar results were obtained with the other three enzymes (not shown). From these results, 30 °C was determined to be the best temperature for the two proteases (Alcalase® and Flavourzyme®) and Ultraflo®, the latter one having β-glucanase and xylanase activities as well as several side activities (Cellulase, Hemicellulase, and Pentosanase). The optimal temperature value determined for Vinoflow® was 40 °C (not shown). In all cases, the best temperature to achieve the maximum recovery of biocomponents in the aqueous extract was relatively low. Vitamins, antioxidants, and other thermo-labile components of the extracts were relatively well preserved in this temperature range. At mild temperatures the energy expenses and the product lability were reduced, while the operational stability of the biocatalysts employed was increased. In fact, the decrease observed in the extraction of biocomponents at the higher temperatures (Figure 2), might be explained by a decay of the operational stability of the enzyme.
In the case of proteases, Zhang & Zhang reported higher optimal temperatures for enzyme-assisted extraction of anti-tumor polypeptides from spirulina with trypsin, pepsine, and papain, namely 42 °C, 37 °C, and 55 °C, respectively, than the ones herein determined [28].

2.1.3. Effect of the Enzyme Loading

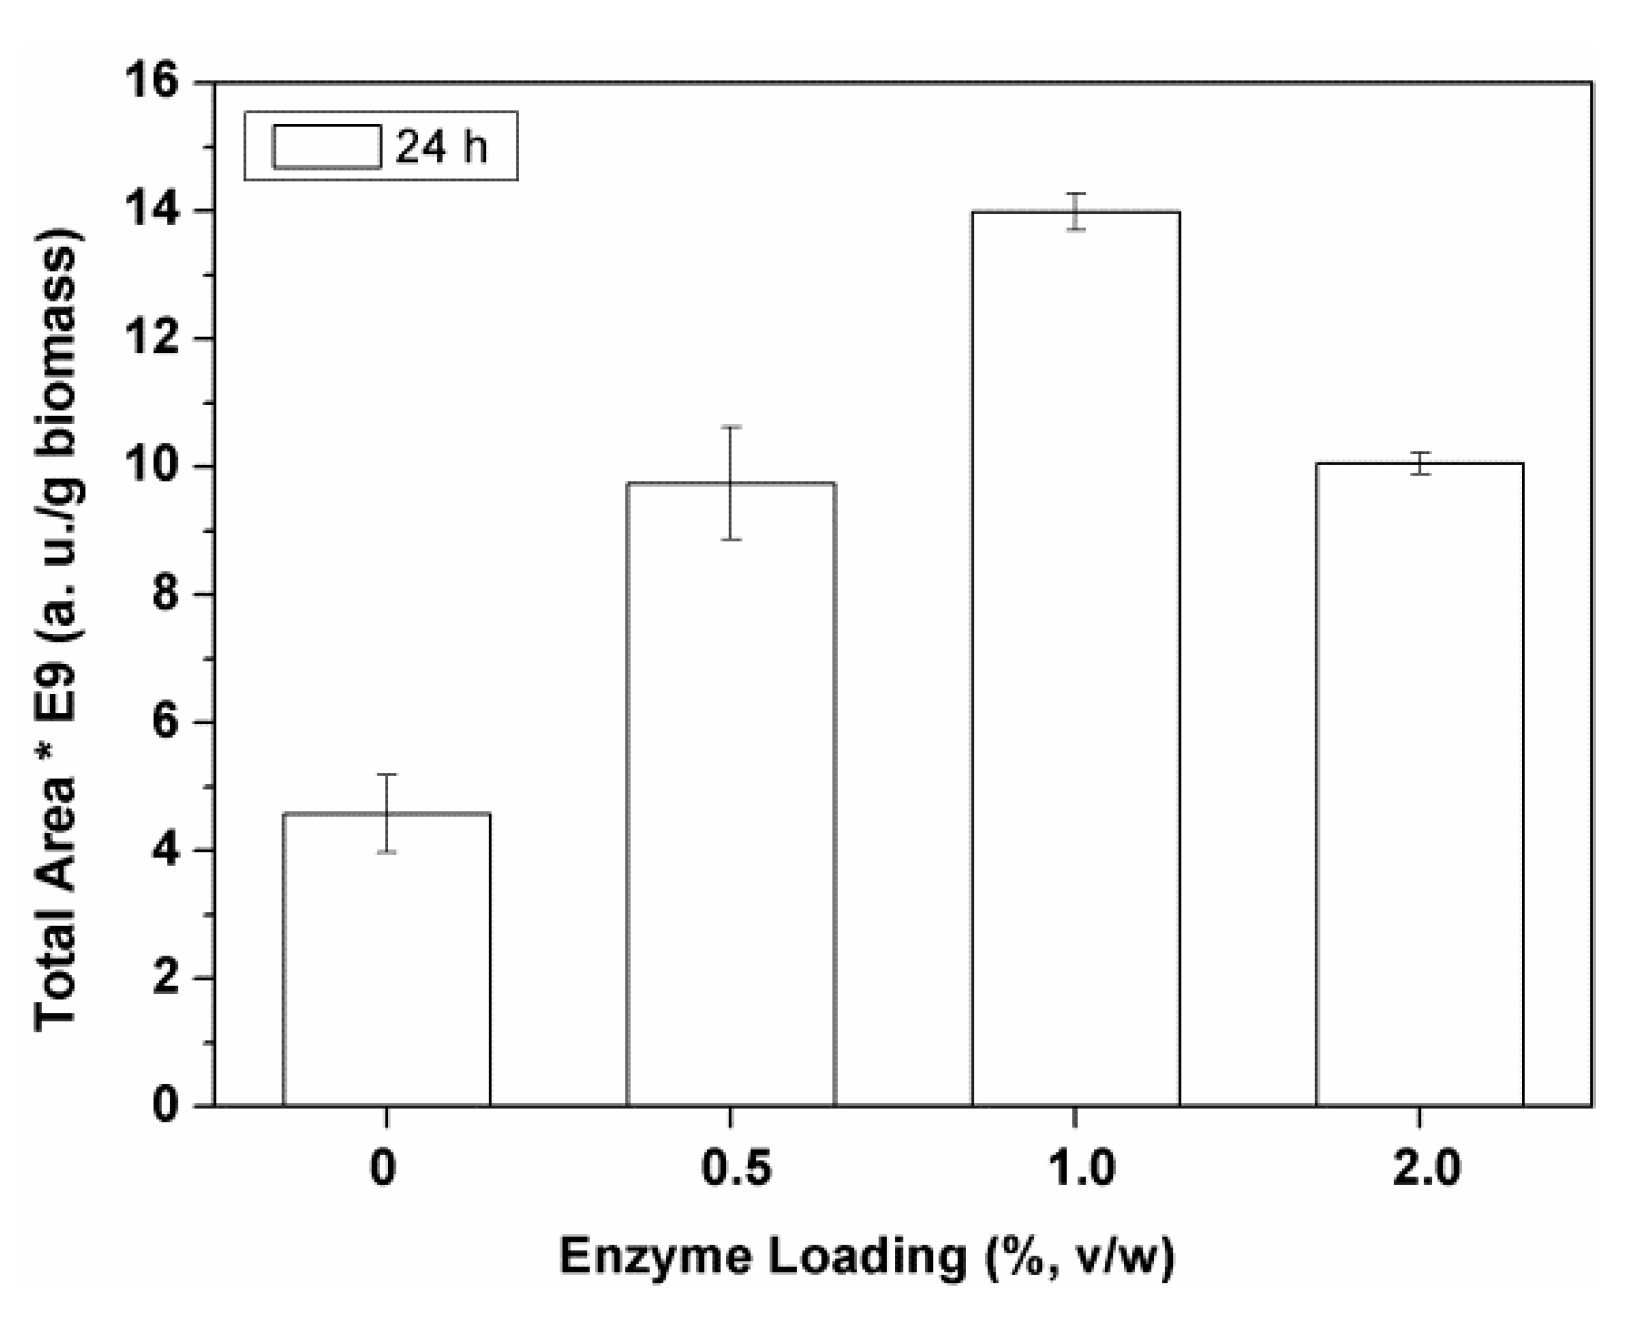
Catalyst charge affects the speed of biomass biodegradation prior to solvent extraction, determining the extraction yield value obtained at a given time.
The results obtained with different Alcalase® loadings (0–2% v/w enzyme) are represented in the Figure 3. These results were compared with those of a control extraction assay, where, instead of the enzyme solution, an equivalent volume of water solution was used (0% enzyme loading in Figure 3).
The extraction of polar biocomponents increased with the increase of the enzyme loading from 0.5% to 1% (v/w) Alcalase®, but it dramatically decreased with an higher enzyme amount (i.e., 2% v/w; Figure 3). The same best value was found for Flavourzyme® and Ultraflo®. The best enzyme loading of Vinoflow® was 2% (v/w) (not shown). These values correspond to 1.2–2.4% (w/w), considering the corresponding density values.
Our results are in good agreement with those of the literature, where the dependence of the extraction yield exhibits a maximum value, with a value of biocatalyst loading above which the process becomes less efficient [31]. The decrease of the product recovery when using high enzyme charges suggests that high enzyme concentrations might favor an excessive biodegradation of the biomass. Different types of biomasses require different amounts of biocatalysts. All these reports and the results of this work indicate that the optimal charge of enzyme requested depends on the type of biomass, type of the biocatalyst, and the biocomponents to be extracted.
The duration of the enzyme pre-treatment is an important parameter, involving important considerations in the process scale up. In this work, 24 h seemed to be necessary to get maximum extraction of intra- and extracellular biocomponents from spirulina. Liang et al. [5] studied an enzyme-assisted extraction of microalgae oil, where optimal yield extraction was found at 12 h of biomass biodegradation. These results, and those of the literature, suggest that the necessary time to degrade the biomass depends on both the enzyme and the biomass studied. It also substantially varies with the method used to degrade the biomass and the product to be extracted. Extractions based on the use of ultrasounds and microwave irradiation for biomass degradation use relatively short times (20 min–4 h) for antioxidant and pigment extractions from microalgae [16].

2.2. Scale Up and Extraction Yields

The four different enzyme-assisted extraction processes were carried out at their corresponding optimal operation conditions at a scale increased by a factor of 2.5. Ten grams of Spirulina biomass were used for each experiment. All the extracts were prepared in their respective optimal conditions (pH 6.5, 1% v/w and 30 °C for Alcalase®; pH 6.0, 1% v/w and 30 °C for Flavourzyme®; pH 7.0, 1% v/w and 30 °C for Ultraflo®; pH 6.5, 2% v/w and 40 °C for Vinoflow®). The control extract was obtained in this scale without any enzyme assistance, using milli-Q water instead of the enzyme solution, at 30 °C and 24h. The aqueous extracts obtained with the different enzyme-assisted methods were liophylyzed and kept at –70 °C.
Table 1 summarizes the recovery yields of aqueous extracts obtained. They are expressed in dry weight percent (calculated with respect to the starting Spirulina biomass).
All the enzyme-assisted extraction processes enabled greater yields of aqueous extracts than the control extraction, being higher the yields obtained with the two proteases (Alcalase® and Flavourzyme®). The highest extraction yield was obtained with Alcalase®. This biocatalyst enables an increase by 1.9 times of the weight of extract obtained, compared to the one obtained in the control extraction process without any enzyme assistance (Table 1).

2.3. Compositional Analysis of Polar Extracts

All dry extracts (obtained in their respective best conditions) were analyzed to determine their amino acid and peptide compositions. The extracts were rich in free amino acids and short peptides. The total values obtained for both hydrolyzed and free amino acids are given in Table 1.
Alcalase® extract had a significantly higher content of amino acids (45% w/w dry extract) than the extract obtained without any enzyme assistance (34% w/w), and also higher than the other three enzymatic extracts (13–17% w/w). Alcalase® extract has higher nutritional interest, and some of the peptides could exhibit bioactivities of therapeutic interest. This value corresponded to most amino acids of the spirulina (50–65% w/w, Table 2).
Total (hydrolyzed + free) amino acids content values were also calculated per gram of dry spirulina. The ratio between amounts of extracted amino acids for each particular method and the quantity obtained with the control extraction was greater than 1 only in the case of Alcalase®, indicating the superiority of Alcalase® method not only with respect to the control extraction, but also with respect to the other enzymatic methods (p ≤ 0.05). Remarkably, among the two proteolytic enzymes and the two studied glucanases, only Alcalase® significantly increased the recovery percentage of amino acids with respect to the control assay (853 µmol/g spirulina more). These results suggest that amino acid extraction is not necessarily improved by any type of protease-assisted extraction. However, only the process with Alcalase® yielded a weight of amino acids 2.5 times higher than the control extraction, and 3.1 times higher than the extraction with the other protease (Flavourzyme®). From 1 g biomass, the Alcalase® extraction method obtained 1426 µmol amino acids, a quantity 2.5–6.1 times higher than the total amount obtained with the other methods (control without enzyme and enzyme-assisted methods). The control extraction obtained only 573 µmol amino acids/g biomass.
Liquid chromatography coupled to an electrospray ionization mass spectrometer in positive ionization mode (LC ESI-MS/MS) analyses revealed that the most abundant peptides in the spirulina extracts obtained with four enzymes and without an enzyme pre-treatment (control) were all different from one extract to another. More specifically, the eight peptides present in Alcalase® extract were: MKKIEAIIRPF, LPPL, ALAVGIGSIGPGLGQGQ, TTAASVIAAAL, DFPGDDIPIVS, LELL, WKLLP, and CHLLLSM (438–1493 Da). By contrast, the control extract contained 12 peptides, namely: NGDPFVGHL, VFETGIKVVDL, DFFVDKL, SGPPLDIKL, DVNETVLDNLPKTRTQI, DVNETVLDNLP, DSLISGAAQAVY, GIGNDPLEIQF, GLILLPHLATL, GLILLPHLA, AVLGAGALFHTF, and DVNETVLDNLP (851–1955 Da).

2.4. Biomass Analyses by TEM

Structural changes in the spirulina were investigated by TEM analysis (Figure 4 and Figure 5).
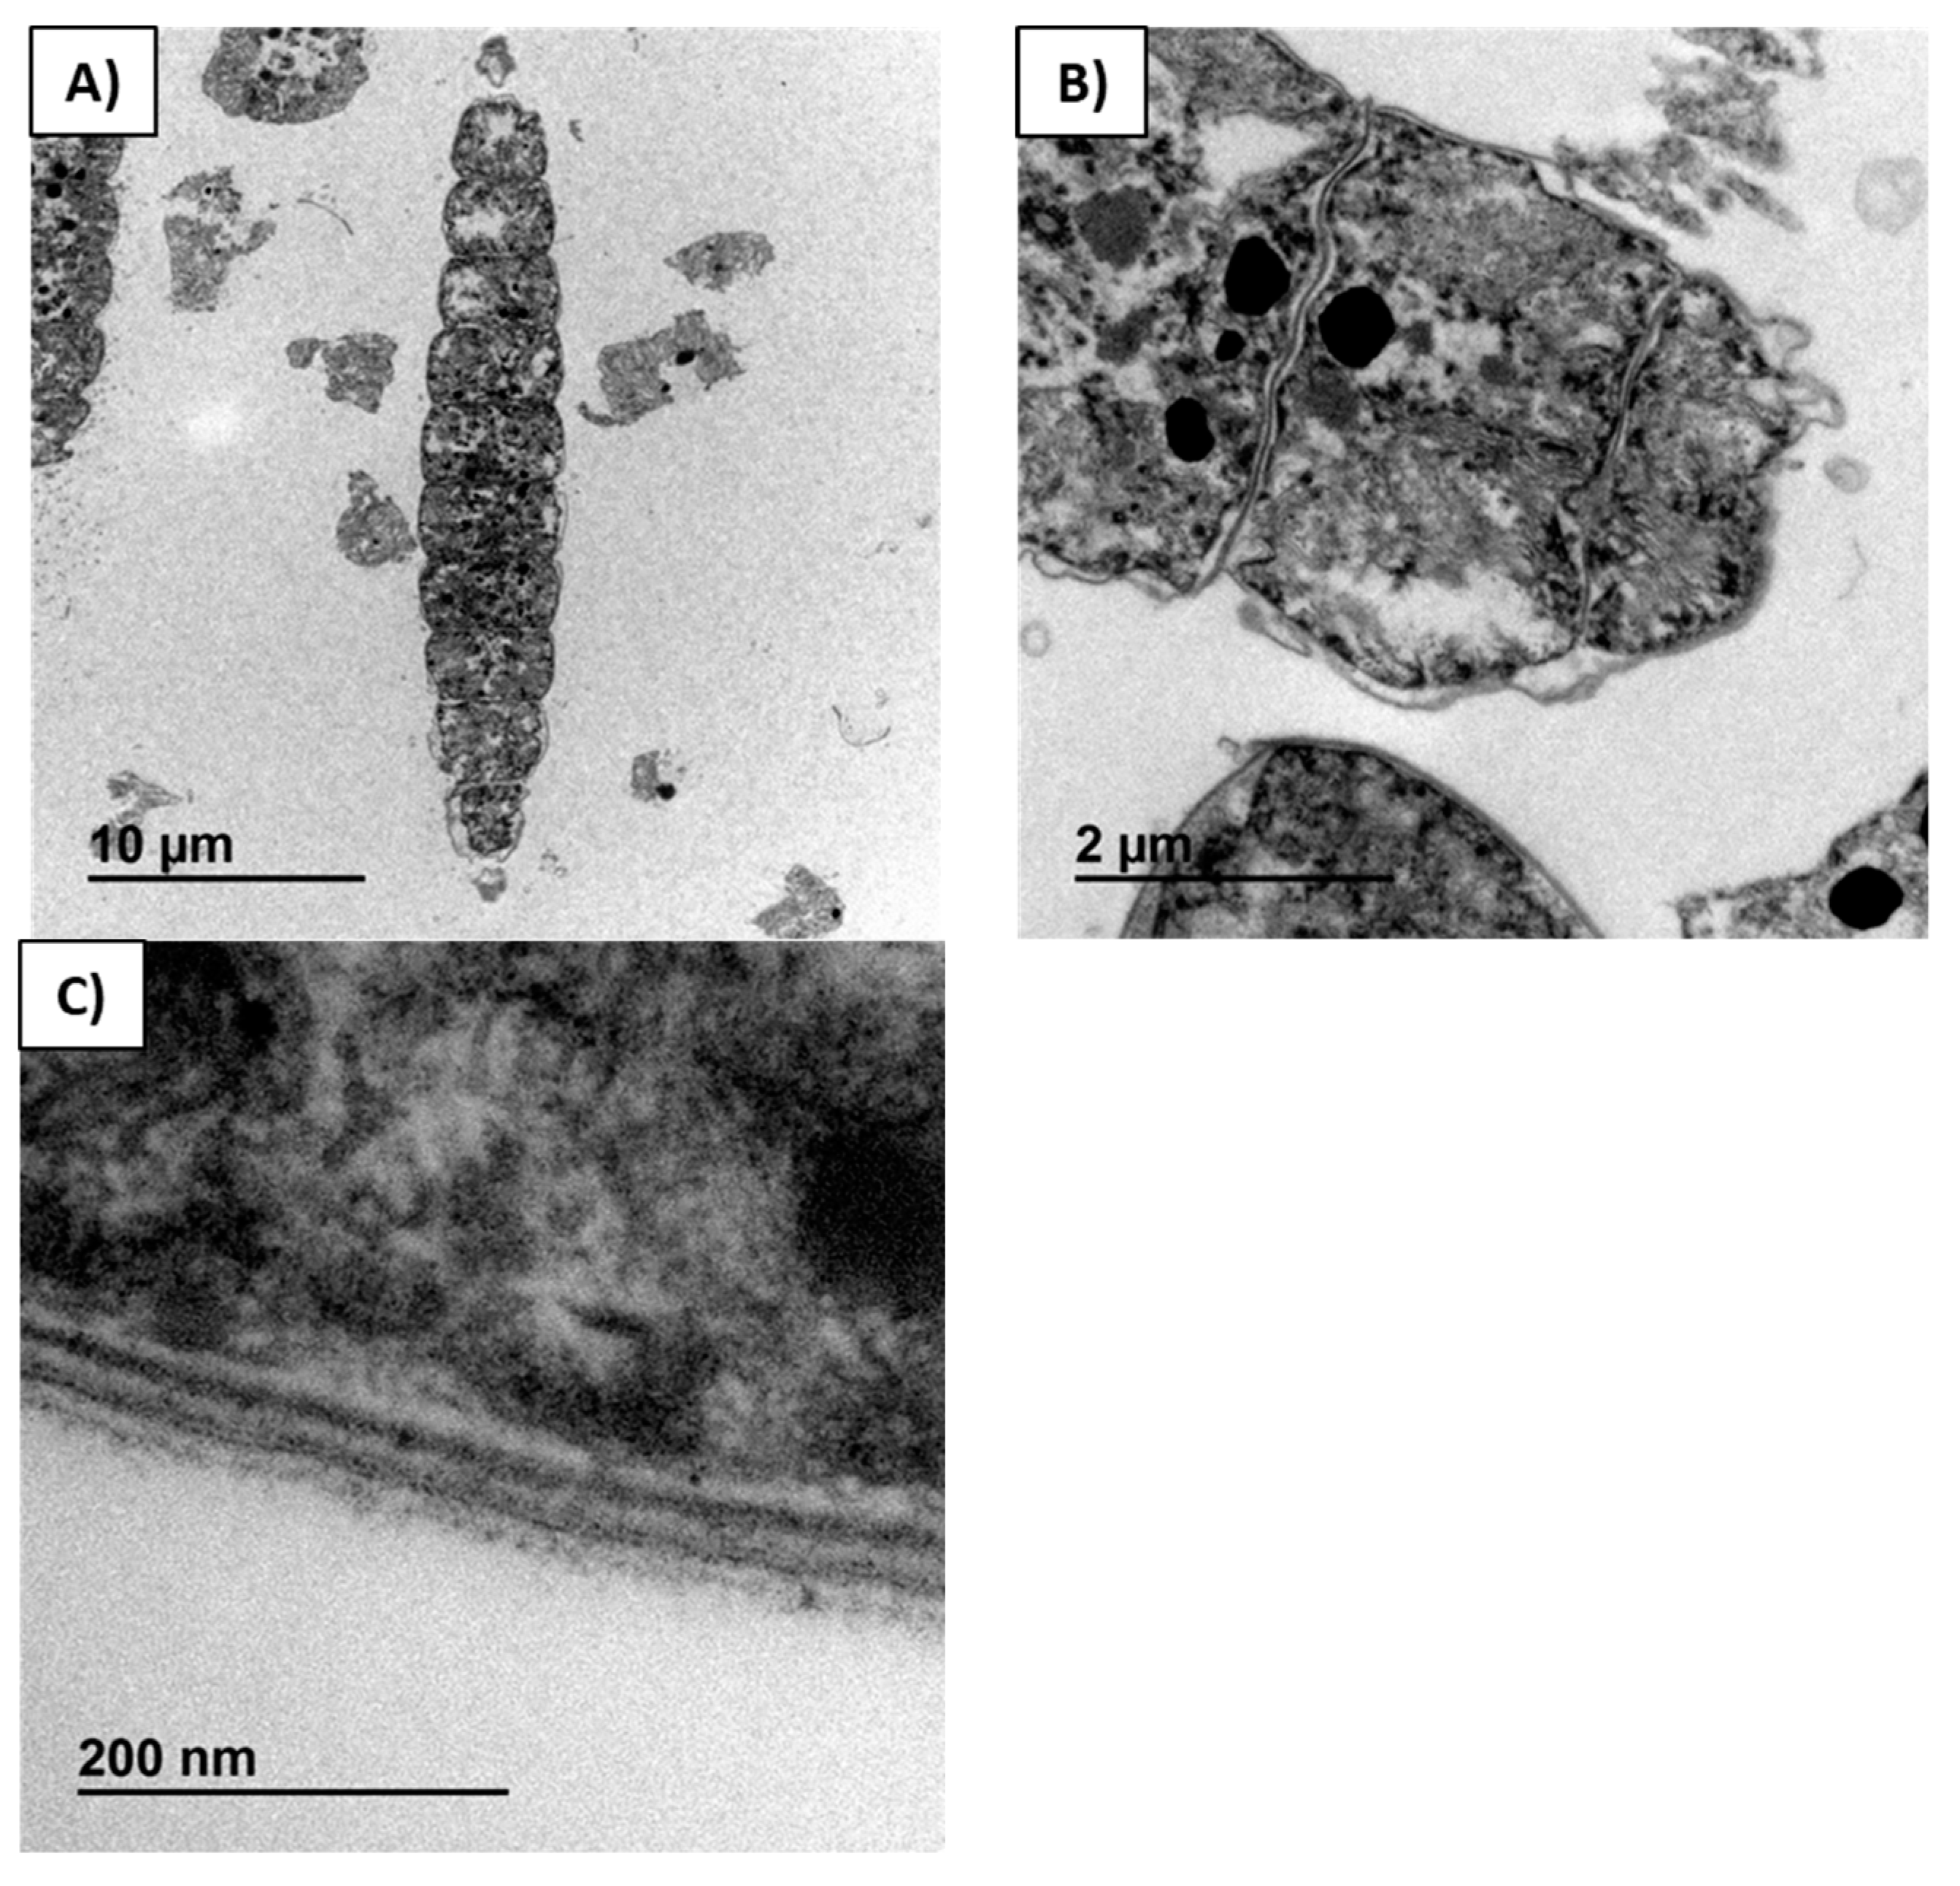
Figure 4A is a micrograph of commercial dry biomass not treated with enzymes nor extracted with any solvent, where a longitudinal section through a trichome with twelve cells is visualized. Complete integrity of the cellular material, including the membrane, is clearly visualized in Figure 4B,C. The four layers of cell membrane were identified (Figure 4C). In the starting spirulina, the cytoplasm and thylakoid system were compressed against the internal cell membrane.
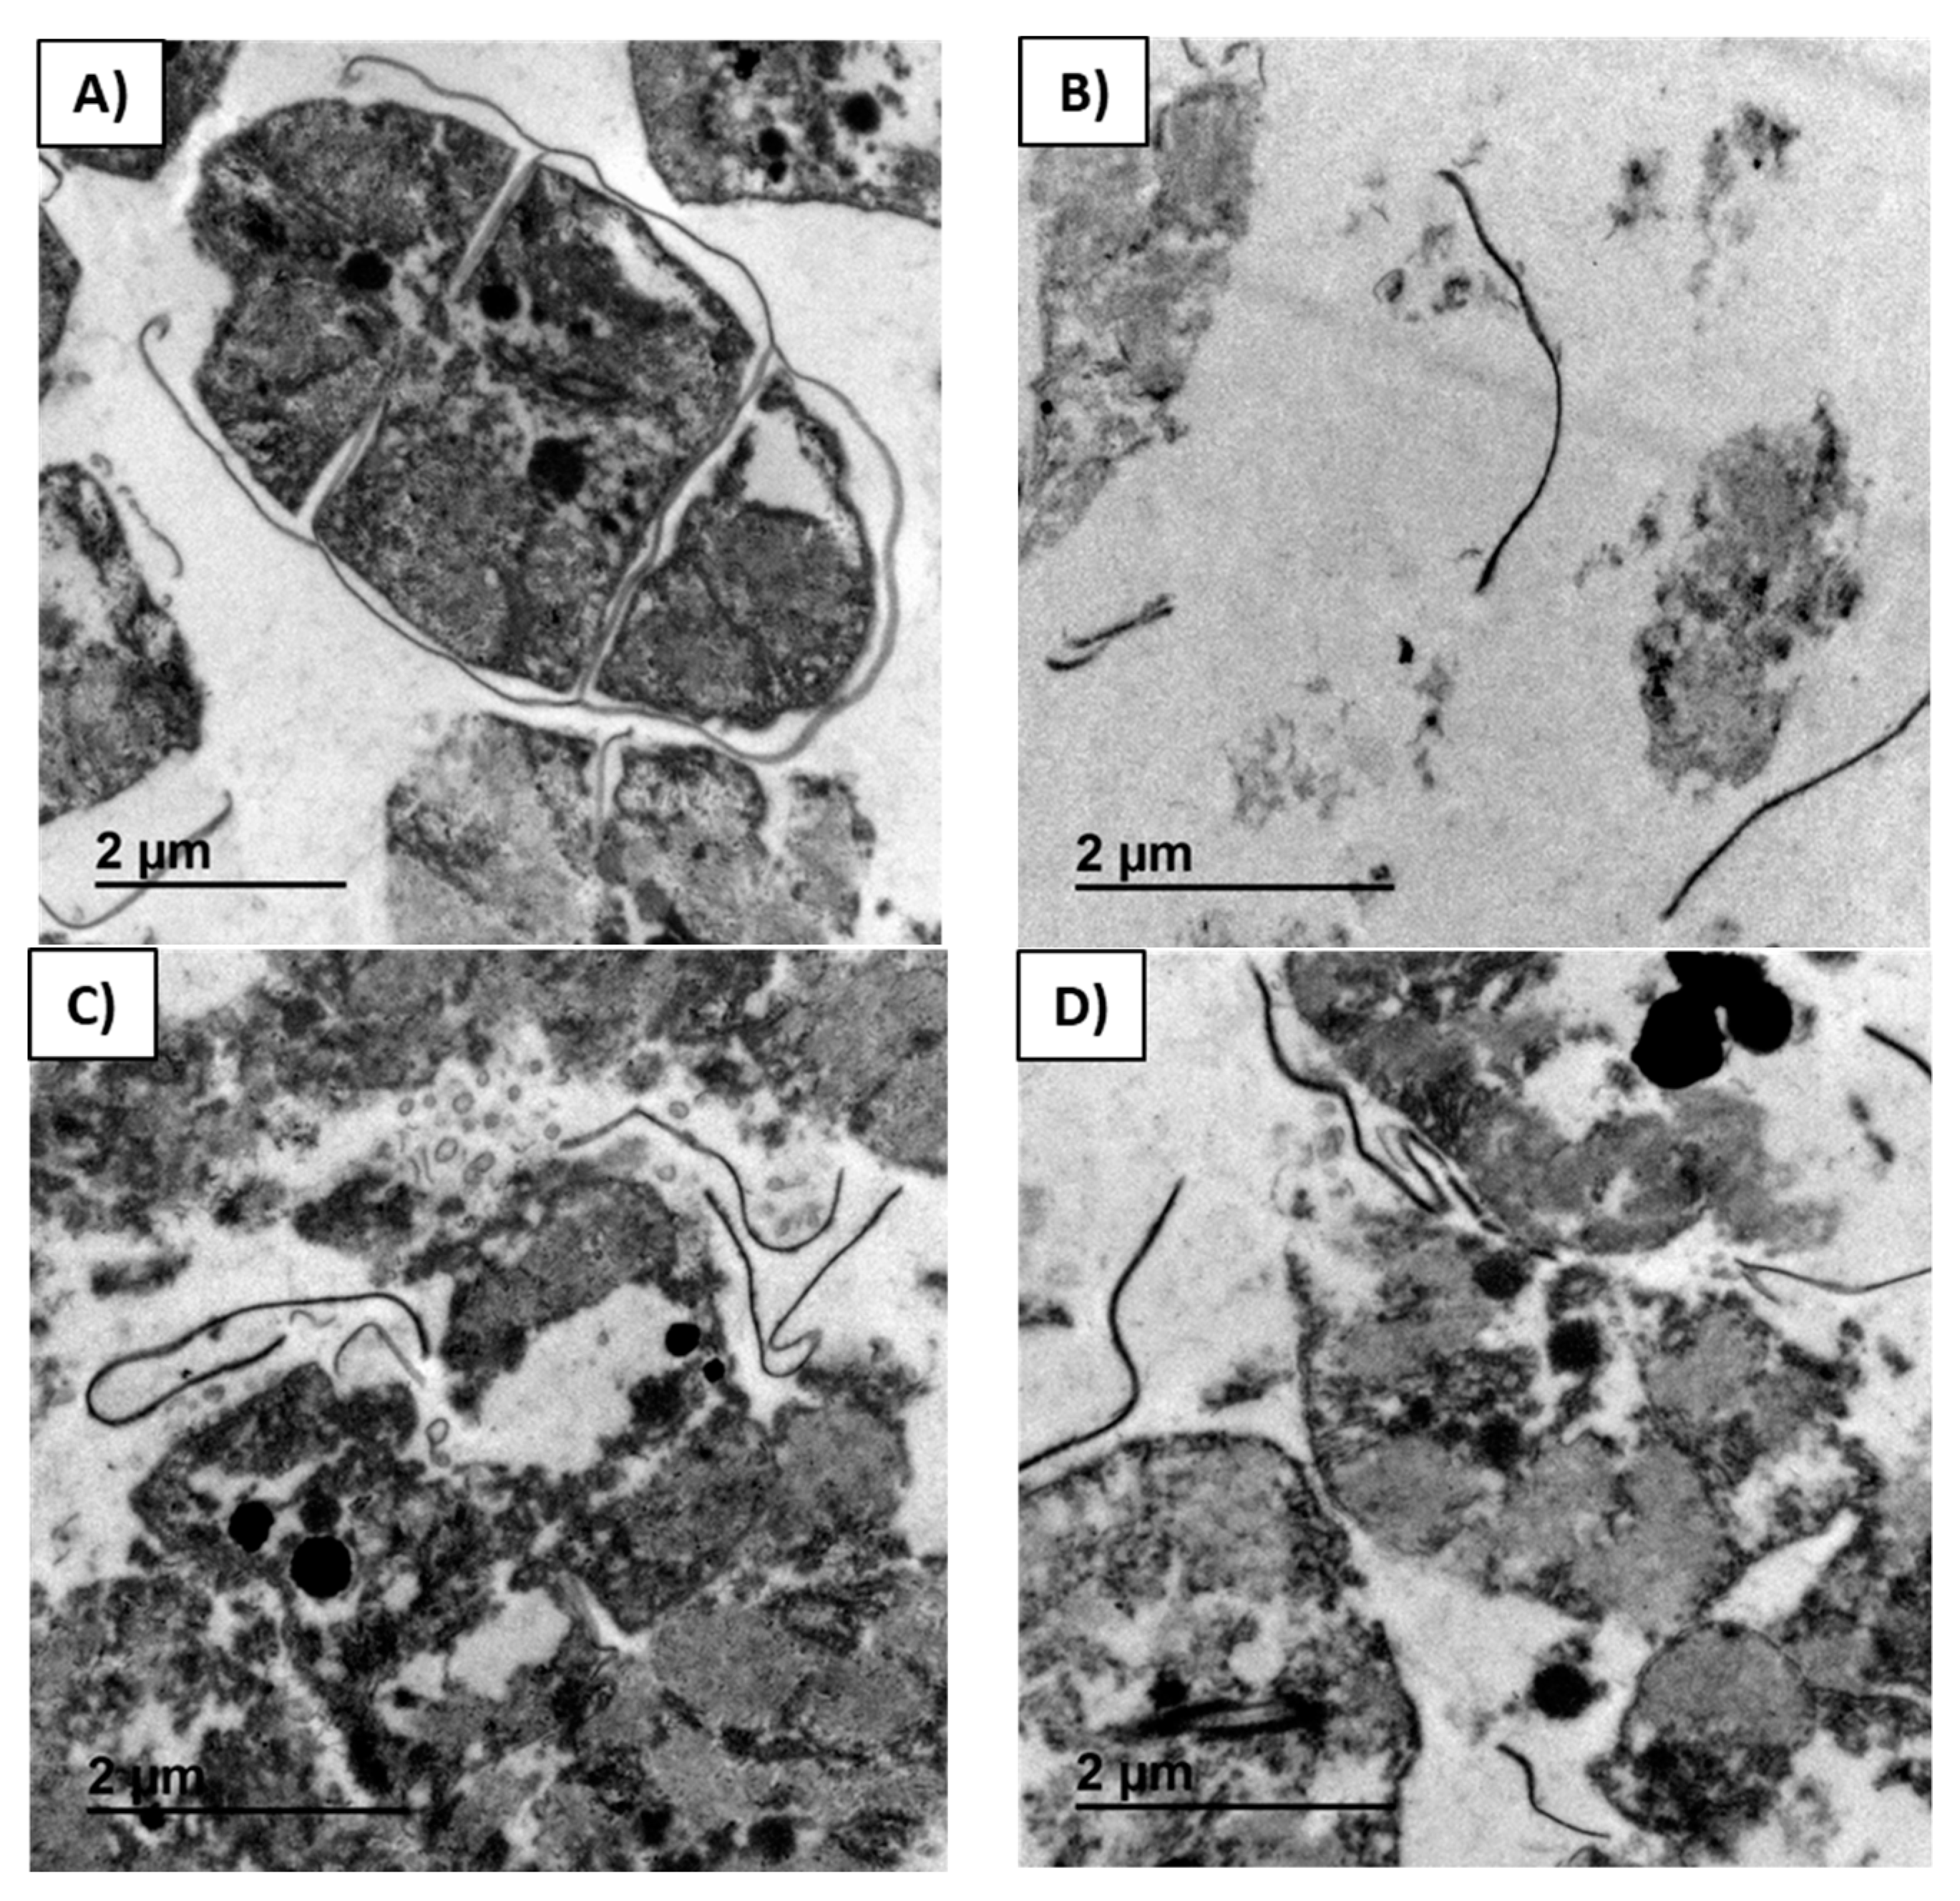
In Figure 5, the micrographs of residual biomass obtained after the control extraction (Figure 5A), and residual biomasses obtained after extraction with Alcalase® (Figure 5B), Ultraflo® (Figure 5C), and Vinoflow® (Figure 5D) assistance are compared at the same scale. Trichomes were still observed after the control extraction of the biomass, although their thylakoid system was not any more compressed against the internal cell membrane (Figure 5A). Cells after the control extraction exhibited a swelling phenomenon, and a few were detached from the trichome. By contrast, after all the enzyme extractions studied, the number of trichomes observed was minimal and cellular degradation was evident (Figure 5B–D). A dispersion of remaining (non-extracted) intracellular material and membrane rests was obtained after biomass treatment with Alcalase® (Figure 5B). After extraction with Alcalase® assistance, most of the cellular material disappeared. Consequently, the residual biomass is more transparent (Figure 5B) than the other ones (Figure 5A,C,D). This fact is due to the higher recovery of biocomponents with Alcalase® than with the control and other enzyme extractions (Figure 5A,B). These observations agree with previous studies, where cyanobacteria cells modified their shape and size, swelling after a Lysozyme treatment [32]. Less cellular material remained in the residual biomasses extracted with Ultraflo® and Vinoflow® (Figure 5C,D) than in the control experiment (lower observed electronic density). However, in all these cases the amount of cell residues was significantly greater than in the case of the Alcalase® extraction (Figure 3B). These findings are in good correspondence with the values of extraction yields obtained (Table 1), where the Alcalase® extraction process was the most effective one for biocomponent recovery of spirulina.
The micrographs of this study show that Alcalase® pre-treatment of the biomass is the most efficient, resulting in most of trichomes and spheroplasts degraded. Vladimirescu revealed the existence of differences in enzymatic sensitivity of cells [33]. Compared with other bacteria, Spirulina sp. has a thicker cell membrane that makes more difficult to detach the cells or spheroplasts from the trichome. Because of that, cell disintegration is not efficiently achieved with lysozyme treatment [34].
The comparative inspection of micrographs of residual biomasses obtained with the different enzyme-assisted extraction processes (Figure 5) reveals that the enzyme pre-treatment of the biomass that allowed the highest biocomponent recovery (Alcalase®) produces the greatest cellular degradation. Compared with the other enzyme-assisted extraction types, the biomass extracted after Alcalase® treatment appeared nearly completely disintegrated and with very low electronic density, as a result of the greater extraction of its biocomponents (Figure 5B–D).
The results here described support the implementation of enzyme technology to replace conventional extraction processes. The Alcalase® extraction herein reported significantly increased the yield and quality of aqueous extracts from A. (Spirulina) platensis biomass. The enzyme technology developed uses food grade enzymes and hexane, which are accepted by regulatory agencies for food and drug safety. This enzyme technology looks promising for a more efficient, safe, and environmentally clean industrial production of cyanobacteria extracts with high value in the nutrition, cosmetic, and pharmaceutical industries [14]. The potential of this extraction method will be further clarified once the extracted biocomponents are molecularly and functionally characterized. A complete characterization of the different aqueous extracts obtained with all the enzymes in their respective optimal operation conditions will be reported.

3. Materials and Methods

3.1. Materials

Arthrospira (Spirulina) platensis dry biomass was purchased from ASN Leader S.L. (Murcia, Spain). Composition of the cyanobacteria biomass provided by the manufacturer is given in Table 2. The cyanobacteria biomass was a lyophilized dry powder for nutrition use. Solvents were HPLC grade. N-Hexadecane was used as an internal standard, and sodium sulfate as a desiccant. All of them were from Sigma-Aldrich (Madrid, Spain). Buffer solutions used were CH3COONa/CH3COOH (pH 5-6), Na2HPO4/NaH2PO4 (pH 6.5-8), and NaCO3/ NaHCO2 (pH 8.5-9). Alcalase® 2.4 L FG, Flavourzyme®, Ultraflo® L, and Vinoflow® Max A were generously donated by Novozymes A/S (Kalundborg, Denmark). Alcalase® has an activity of 2.4 AU A/g. Flavourzyme® has at least 1000 LAPU/g (leucine aminopeptidase units/g determined with Leu-pNA), not being the single activity type in this preparation. The main activity of Ultraflo® L is β-glucanase (45 fungal β -glucanase (FBG) per g). In addition, it contains approximately 470 Farbe xylanase units (FXU) per g. Vinoflow® Max A has a declared activity of 46 BGXU/ml.
Alcalase® is a commercial preparation of a serine endo-peptidase (EC. 3.4.21.62) from Bacillus licheniformis (mainly subtilisin A). Alcalase® acts as an esterase, catalyzing the stereoselective hydrolysis of esters, and hydrolyzes amino esters including heterocyclic amino esters. Flavourzyme® is a peptidase preparation from Aspergillus oryzae, widely and diversely used for protein hydrolysis in industrial and research applications. Eight enzymes have been identified in Flavourzyme®, namely two aminopeptidases, two dipeptidyl peptidases, three endopeptidases, and one α-amylase. Purified Flavourzyme® enzymes were biochemically characterized with regard to pH and temperature profiles and molecular sizes [35]. Ultraflo® L is a multicomponent enzyme preparation that contains 5–10% (w/w) β-glucanase (endo-1,3(4)-) and 1–5% (w/w) xylanase (endo-1,4-) as the main active components (EC 3.2.1.6 and EC 3.2.1.8), produced by a strain of Humicola insolens. The enzyme preparation is used in the brewing industry to hydrolyze polysaccharide gums and to break down cell wall materials in cereals like beta-glucan and xylans [36]. These two types of enzymatic activities in Ultraflo® are cellulose action and catalysis of the hydrolysis of complex sugars in the amorphous regions of the cellular membrane. Ultraflo® L is also marketed within the European Union as a feed-additive under the name of ‘Pentopan/Biofeed Plus.’ There is a more abundant enzyme, while a second activity is due to other two enzymes. Vinoflow® Max A is a β-glucanase (exo-1,3-) preparation, used on wine to speed up the aging process [37]. All these enzyme preparations are GRAS type hydrolases.

3.2. Enzyme-Assisted Extraction of Spirulina Biocomponents

The enzyme-assisted extraction methods of the cyanobacteria biomass studied using Alcalase® 2.4 L FG, Flavourzyme®, Ultraflo® L, and Vinoflow® Max A differ in the cell degradation step (protein or sugar hydrolysis). All degraded biomasses were next extracted with solvents. These extractions were compared with the same solvent extraction procedure carried out without any enzyme assistance (control experiment).
The influence of the more important parameters of the enzymatic step was studied: pH 5.5–8, temperature 30–50 °C, and enzyme loading 0.5–2 (v/w, volume of enzyme preparation/weight of enzyme + biomass suspension). Optimal operation conditions of the four enzyme-assisted extraction processes were determined.
A suspension of the biomass (0.2 g/mL aqueous buffer) containing the corresponding loading of enzyme preparation (or an equivalent volume of milli-Q water, in the case of the control experiment), was kept under magnetic agitation for the indicated time at a controlled temperature. Unless indicated, the study was carried out in triplicate at the short and long reaction times (duration of enzyme pre-treatment: 4 and 24 h), as follows:
  • Effect of pH: This study was carried out at 40 °C and 1% (v/w) enzyme solution
  • Effect of temperature: This study was carried out at relatively mild temperatures (30–50 °C) at the optimal pH value previously determined.
  • Effect of enzyme loading: This study was performed at the optimal values of pH and temperature previously determined in the range of 0.5–2% (v/w) enzyme solution. The process extraction was followed at 1, 2, 4, 6, 8, and 24 h.
  • Solvent extraction step: Each aliquot (0.5 mL) of the enzyme–biomass suspension was dissolved in 1 mL hexane–isopropanol mixture (3:2, v/v). The resultant solution was centrifuged for 15 min at 10,000 rpm, and allowed to completely separate into the two liquid (aqueous and oil) phases. The residual biomass was then separated from the liquid phase. The liquid solution was then placed in a decantation funnel. After separation of the oil and aqueous phases, the oil phase was collected. Next, the oil phase extraction protocol was repeated two more times by adding 0.25 mL hexane-isopropanol mixture to the decantation funnel. Finally, the two liquid (aqueous and oil) extracts obtained were freeze-dried.
  • Scaled up extraction: In order to obtain greater amounts of extracts, all the extraction processes (enzyme-assisted and control extractions) were carried out at a scale factor of 2.5 at their respective optimal conditions for 24 h enzyme pre-treatment under magnetic agitation (500 rpm). Scaled up extraction processes were carried out as follows: pH 6.5, 30 °C and 1% v/w Alcalase®; pH 6.0, 30 °C and 1% v/w Flavourzyme®; pH 7.0, 30 °C; and 1% v/w Ultraflo®; pH 6.5, 40 °C and 2% v/w Vinoflow®. The extraction without enzyme digestion (control) was carried out using milli-Q water instead of the enzymatic preparation in buffer at 30 °C and 24h. After the indicated time, the enzyme–biomass mixture was centrifuged for 30 min at 14,000 rpm and 10 °C. All corresponding aqueous extracts were lyophilized for 4 days and then weighed. All dry weight values of the aqueous extracts were corrected by subtraction of the corresponding weight of the buffer enzyme solution (lower than 1% w/w). Residual biomasses obtained were dried under nitrogen. All the experiments were carried out in triplicate.

3.3. Analysis and Characterization of Aqueous Extracts

3.3.1. HPLC Analyses

A high-performance liquid chromatography apparatus coupled to an evaporative light scattering detector (HPLC-ELSD) was used for optimization of the enzymatic extraction process. These analyses allowed determination of relative changes of the biocomponent concentrations in the aqueous extracts obtained at different times of enzyme treatment.
Analyses were carried out with a Hitachi D-7000IF apparatus (Germany) with a silica column from Kromasil C18 (5 µm, 250 × 4.6 mm) connected to a Sedex 55 ELSD detector (SEDERE, France). Aqueous solution of the lyophilized samples (20 μL of 50 mg/mL) was injected and analyzed at 30 °C for 83 min with a gradient mobile phase at 1.5 mL/min, phase A being milliQ water (100% v/v) and phase B being acetonitrile/milliQ water (80:20 v/v). The composition of the phases (A:B) varied as follows: 96:4 for the first 5 min, increasing to 60:40 in 60 min, followed by a linear increase of Phase B up to 95% in 1 min. Composition was then maintained for the next 7 min (up to min 23), then the mobile phase returned to the first composition (96:4) and remained constant for the rest of the analysis. Analysis of each sample was replicated three times. For analyses of liquid aqueous extracts obtained after 4 h enzyme pre-treatment, 0.5 mL of aqueous phase was mixed with 1 mL distilled water, and 20 µL of the resultant solution was injected into the HPLC.

3.3.2. Amino Acid and Peptide Composition

The extracts obtained in the respective optimal conditions were analyzed to determine their composition in amino acids, using a chromatography procedure developed by Spackman et al. [38]. Solutions of the different aqueous extracts (1–2.6 mg/mL) were prepared in triplicate and placed in the hydrolysis tubes. Norleucine was used as the internal standard in this assay. The analyzer apparatus was calibrated with three tubes of hydrolysis containing known amounts of the standard and norleucine. Standard solutions were submitted to the same hydrolysis treatment as the extract solutions. Finally, all the hydrolysis tubes were vacuum dried in a Speed Vac.
The hydrolysis tubes containing the sample solutions were placed in glass bottles with a valve to make a vacuum, and purged with inert nitrogen gas. To each flask, 200 µL HCl 6N and 50 mg phenol were added. Next, a vacuum was applied to each flask for 20 sec and then they were purged with nitrogen inert gas for 20 sec. This process was repeated three times. Each flask was introduced into an oven at 110 °C for 21 h. After that, the hydrolysis tubes were dried in the Speed Vac. Hydrolyzed samples and standard were dissolved in buffer, and then injected into the analyzer.
Quantitative analysis of amino acids mixtures was carried out in a Biochrom 30 Series Amino Acid Analyzer, with a reproducibility >0.5 CV at 10 nmoles. Biochrom 30 uses the classic methodology for amino acid analysis, based on ion exchange liquid chromatography and a post-column reaction made continuous with ninhydrine, with a sensitivity of ∼10 pmol.
All the aqueous extracts were analyzed by liquid chromatography coupled to an electrospray ionization mass spectrometer in positive ionization mode (LC ESI-MS/MS) to identify their respective peptide components. Prior to analysis, the samples were cleaned with C18 tips. LC ESI-MS/MS analyses were carried out in an Ultimate 3000 nanoHPLC (Dionex, Sunnyvale, California) coupled to an ion trap mass spectrometer AmaZon Speed (Bruker Daltonics, Bremen, Germany). The reversed phase analytic column used was an Acclaim C18 PepMap of 75 µm × 15 cm, 3 µm particle size and 100 Å pore size (ThermoScientific, USA). The trap column was a C18 PepMap of 5 µm particle diameter, 100 Å pore size, connected in series with the analytical column. The loading pump flushed a solution of 0.1% trifluoroacetic acid in 98% water/2% acetonitrile (ScharLab, Barcelona, Spain) at 3 µL/ min The nanopump operated at a flow of 300 nL/min in gradient conditions, using 0.1% formic acid (Fluka, Buchs, Switzerland) in water (phase A), and 0.1% formic acid in 80% acetonitrile/20% water (phase B). The scheme of the elution gradient was: isocratic mode with 96% A, 4% B for 5 min, a linear increase to 40% B in 60 min, a linear increase to 95% B in 1 min, isocratic conditions of 95% B for 7 min, and return to initial conditions in 10 min. Five µL of extract solutions (4 µg/µL) were injected, and detected at 214 y 280 nm wavelengths. In a second analysis, 5 µL of extract solutions (10 µg/µL) were injected. The LC system was connected by a CaptiveSpray source (Bruker Daltonics, Bremen, Germany) to the ion trap spectrometer, operating in positive mode with a capillary voltage set of 1400 V. The automatic data acquisition allowed sequential observation of both MS spectra (m/z 350–1500) and the MS CID spectra of the 8 more abundant ions. In the analyses of 10 µg/µL samples, the MS spectra range was 100–1000 m/z. Exclusion dynamics were applied to prevent the isolation of the same m/z for 1 min after its fragmentation.
For peptide identification, MS and MS/MS data of individual fractions of HPLC were processed with DataAnalysis 4.1 (Bruker Daltonics, Bremen, Germany). MS/MS spectra (in the form of generic Mascot files) were analyzed against a data base obtained from NCBInr (National Center for Biotechnology Information) containing 68623 entries of proteins from both Spirulina and Arthrospira. The database search was carried out with Mascot v.2.6.0 (Matrix Science, London, UK) [39]. Search parameters were set as follows: oxidized methionine as the modification variable without enzyme restriction. Tolerance for peptide mass of 0.3 Da and 0.4 Da in MS and in MS/MS modes, respectively. In most of the cases, a precision of ±0.1–0.2 Da was obtained for both MS and MS/MS spectra.
Additionally, in the case of Alcalase® extract all MS and MS/MS spectra were analyzed using the ‘de novo’ tool of the Peaks software (Bioinformatics solutions, Inc).This program combines both the unconditioned ‘de novo’ analysis of MS/MS spectra with the more conventional search against organism-specific (i.e., Arthrospira–Spirulina) sequence databases. Only sequence assignments with confidence values equal or superior to 80 have been included, to avoid doubtful sequences. Note that this approach cannot distinguish the following identities: I and L, K and Q, F and M.

3.3.3. Statistical Analyses

The experiments were carried out in triplicate, reporting the results as their corresponding mean values with their standard errors, which were compared at confidence level of 95% (p ≤ 0.05) using the SPSS program.

3.4. Transmission Electronic Microscopy Analyses, TEM

Fresh and residual (extracted) biomass samples were visualized in a transmission electronic microscope. Morphological changes of the residual biomass after the enzyme-assisted extraction process were visualized and compared by TEM analyses. A Jeol Jem 1010 apparatus (100Kv, Yokyo, Japan), coupled to a digital camera Orius SC200 (Gatan Inc., Pleasanton, CA, USA) and the Digital Micrograph v 3.4 software for image acquisition, was used. Prior to analysis, all the samples were treated as follows: first they were washed three times with 0.1 M sodium phosphate buffer, pH 7.2, then transferred into 2% w/w bacteriological agar in buffer and fixed in glutaraldehyde (2.5% w/w) for 2 h 40 min, and finally washed with cacodylate buffer 0.1M (pH 7.3). Post-fixation of samples was done on 1–2 mm agar blocks with osmium tetroxide (1% w/w) for 1 h 40 min. Samples were then dehydrated in an oven with absolute ethanol and embedded in a durcupan resin, and then were polymerized at 60 °C over 48 h. Samples were cut into ultrafine layers (60 nm) with a Leica ultracut S. Finally the sample slices were dyed with uranyl and lead acetates.

4. Conclusions

Different extraction methods of high value hydrophilic spirulina biocomponents were implemented via four selective enzyme degradations of spirulina biomass. Comparison of the extracts obtained in their optimal operation conditions demonstrated that different products can be obtained through spirulina degradation by different enzyme types. The four enzyme-assisted extraction processes were superior to the corresponding extraction process without enzyme-assistance for prior biomass degradation. Among the two proteases and the endo- and exoglucanases, Alcalase® gave the highest extraction yield of hydrophilic extract, as a result of its effective degradation of membrane proteins, lipoproteins, and peptidoglucan. Both the extract composition and the amount of extracted biocomponents depended on the temperature, enzyme charge and type, pH, and duration of enzymatic pre-treatment of the biomass. Compared to conventional extraction processes, higher extraction yields were obtained in mild conditions; Alcalase® extract was the one with the highest protein content. All the protein extracts obtained could be applied for satiety and muscle building in sports/active nutrition, for geriatric population, convalescent patients, etc.

Author Contributions

This work was designed and supervised by C.O.; C.M.V.-M. and L.E. carried out the experimental work; statistical analyses were done by C.M.V.-M.

Funding

This research was partially supported by the Program of I+D Activities of the Autonomous Community of Madrid, Spain: Tecnología 2013 (Project INSPIRA1-CM Ref. S2013/ABI-2783 "Aplicaciones industriales de la Espirulina" with co-financiation of the European Structural Found (European Social Found -EFS- and European Found for Regional Development- FEDER-), and by MINECO of Spanish Government (grant Ref. CTQ2017-86170-R).

Acknowledgments

The authors wish to thank Rafael Montoro Carrillo (manager of ASN Leader S.L.) for the generous support with a Spirulina free sample and information provided. We also thank Ramiro Martínez (Novozymes, Spain) for kindly supplying the enzymes used in this research.

Conflicts of Interest

The authors declare no conflict of interest. The funders had no role in the design of the study; in the collection, analyses, or interpretation of data; in the writing of the manuscript, or in the decision to publish the results.

References

  1. Singh, R.; Parihar, P.; Singh, M.; Bajguz, A.; Kumar, J.; Singh, S.; Singh, V.P.; Prasad, S.M. Uncovering potential applications of cyanobacteria and algal metabolites in biology, agriculture and medicine: Current status and future prospects. Front. Microbiol. 2017, 8. [Google Scholar] [CrossRef] [PubMed]
  2. Fleurence, J. The enzymatic degradation of algal cell walls: A useful approach for improving protein accessibility? J. Appl. Phycol. 1999, 11, 313–314. [Google Scholar] [CrossRef]
  3. Beveridge, T.J. Structures of Gram-Negative Cell Walls and Their Derived Membrane Vesicles. J. Bacteriol. 1999, 181, 4725–4733. [Google Scholar] [PubMed]
  4. Zheng, H.; Yin, J.; Gao, Z.; Huang, H.; Ji, X.; Dou, C. Disruption of chlorella vulgaris cells for the release of biodiesel-producing lipids: A comparison of grinding, ultrasonication, bead milling, enzymatic lysis, and microwaves. Appl. Biochem. Biotechnol. 2011, 164, 1215–1224. [Google Scholar] [CrossRef] [PubMed]
  5. Liang, K.; Zhang, Q.; Cong, W. Enzyme-assisted aqueous extraction of lipid from microalgae. J. Agric. Food Chem. 2012, 60, 11771–11776. [Google Scholar] [CrossRef] [PubMed]
  6. Vilas, M.V.A.; Hernandez, C.O. At the Crossroads between Nutrition and Pharmacology; Bentham Science Publishers: Sharjah, UAE, 2017; Volume 2. [Google Scholar]
  7. Vonshak, A. Spirulina Platensis Arthrospira: Physiology, Cell-Biology and Biotechnology; Taylor & Francis: Milton Park, Oxfordshire, UK, 1997. [Google Scholar]
  8. El-Baz, F.K.; El-Senousy, W.M.; El-Sayed, A.B.; Kamel, M.M. In vitro antiviral and antimicrobial activities of Spirulina platensis extract. J. Appl. Pharm. Sci. 2013, 3, 52–56. [Google Scholar] [CrossRef]
  9. Clement, G. Une nouvelle algue alimentaire:la Spiruline. Rev. Inst. Pasteur de Lyon 1971, 4, 103–114. [Google Scholar]
  10. Campanella, L.; Crescentini, G.; Avino, P. Chemical composition and nutritional evaluation of some natural and commercial food products based on Spirulina. Analusis 1999, 27, 533–540. [Google Scholar] [CrossRef] [Green Version]
  11. Hsueh, Y.C.; Wang, B.J.; Yu, Z.R.; Wang, C.C.; Koo, M. Optimization of a continuous preparation method of arthrospira platensis γ-linolenic acid by supercritical carbon dioxide technology using response surface methodology. Sains Malaysiana 2015, 44, 1739–1744. [Google Scholar]
  12. Singh, S.; Kate, B.N.; Banecjee, U.C. Bioactive compounds from cyanobacteria and microalgae: An overview. Crit. Rev. Biotechnol. 2005, 25, 73–95. [Google Scholar] [CrossRef]
  13. Pfeiffer, C.; Bauer, T.; Surek, B.; Schömig, E.; Gründemann, D. Cyanobacteria produce high levels of ergothioneine. Food Chem. 2011, 129, 1766–1769. [Google Scholar] [CrossRef]
  14. Lupatini, A.L.; Colla, L.M.; Canan, C.; Colla, E. Potential application of microalga Spirulina platensis as a protein source. J. Sci. Food Agric. 2017, 97, 724–732. [Google Scholar] [CrossRef] [PubMed]
  15. Palinska, K.A.; Krumbein, W.E. Perforation patterns in the peptidoglycan wall of filamentous cyanobacteria. J. Phycol. 2000, 36, 139–145. [Google Scholar] [CrossRef]
  16. Bermúdez Menéndez, J.M.; Arenillas, A.; Menéndez Díaz, J.A.; Boffa, L.; Mantegna, S.; Binello, A.; Cravotto, G. Optimization of microalgae oil extraction under ultrasound and microwave irradiation. J. Chem. Technol. Biotechnol. 2014, 89, 1779–1784. [Google Scholar] [CrossRef]
  17. Hahn, T.; Lang, S.; Ulber, R.; Muffler, K. Novel procedures for the extraction of fucoidan from brown algae. Process Biochem. 2012, 47, 1691–1698. [Google Scholar] [CrossRef]
  18. Postma, P.R.; Pataro, G.; Capitoli, M.; Barbosa, M.J.; Wijffels, R.H.; Eppink, M.H.M.; Olivieri, G.; Ferrari, G. Selective extraction of intracellular components from the microalga Chlorella vulgaris by combined pulsed electric field-temperature treatment. Bioresour. Technol. 2016, 203, 80–88. [Google Scholar] [CrossRef] [PubMed]
  19. Neves, V.T.D.C.; Sales, E.A.; Perelo, L.W. Influence of lipid extraction methods as pre-treatment of microalgal biomass for biogas production. Renew. Sustain. Energy Rev. 2016, 59, 160–165. [Google Scholar] [CrossRef]
  20. Rosenthal, A.; Pyle, D.L.; Niranjan, K. Aqueous and enzymatic processes for edible oil extraction. Enzyme Microb. Technol. 1996, 19, 402–420. [Google Scholar] [CrossRef]
  21. Bligh, E.G.; Dyer, W.J. A rapid method of total lipid extraction and purification. Can. J. Biochem. Physiol. 1959, 37, 911–917. [Google Scholar] [CrossRef]
  22. Folch, J.; Lees, M.; Sloane Stanley, G.H. A simple method for the isolation and purification of total lipides from animal tissues. J. Biol. Chem. 1957, 226, 497–509. [Google Scholar]
  23. Safi, C.; Ursu, A.V.; Laroche, C.; Zebib, B.; Merah, O.; Pontalier, P.Y.; Vaca-Garcia, C. Aqueous extraction of proteins from microalgae: Effect of different cell disruption methods. Algal Res. 2014, 3, 61–65. [Google Scholar] [CrossRef]
  24. Safi, C.; Charton, M.; Ursu, A.V.; Laroche, C.; Zebib, B.; Pontalier, P.Y.; Vaca-Garcia, C. Release of hydro-soluble microalgal proteins using mechanical and chemical treatments. Algal Res. 2014, 3, 55–60. [Google Scholar] [CrossRef]
  25. Kim, N.H.; Jung, S.H.; Kim, J.; Kim, S.H.; Ahn, H.J.; Song, K.B. Purification of an iron-chelating peptide from spirulina protein hydrolysates. J. Korean Soc. Appl. Biol. Chem. 2014, 57, 91–95. [Google Scholar] [CrossRef]
  26. Lu, J.; Ren, D.F.; Xue, Y.L.; Sawano, Y.; Miyakawa, T.; Tanokura, M. Isolation of an antihypertensive peptide from alcalase digest of spirulina platensis. J. Agric. Food Chem. 2010, 58, 7166–7171. [Google Scholar] [CrossRef] [PubMed]
  27. Vo, T.S.; Ryu, B.; Kim, S.K. Purification of novel anti-inflammatory peptides from enzymatic hydrolysate of the edible microalgal Spirulina maxima. J. Funct. Foods 2013, 5, 1336–1346. [Google Scholar] [CrossRef]
  28. Zhang, B.; Zhang, X. Separation and nanoencapsulation of antitumor polypeptide from Spirulina platensis. Biotechnol. Prog. 2013, 29, 1230–1238. [Google Scholar] [CrossRef] [PubMed]
  29. Ismaiel, M.M.S.; El-Ayouty, Y.M.; Piercey-Normore, M. Role of pH on antioxidants production by Spirulina (Arthrospira) platensis. Braz. J. Microbiol. 2016, 47, 298–304. [Google Scholar] [CrossRef]
  30. In, M.J.; Gwon, S.Y.; Chae, H.J.; Kim, D.C.; Kim, D.H. Production of Spirulina Extract by Enzymatic Hydrolysis. J. Korean Soc. Appl. Biol. Chem. 2007, 50, 304–307. [Google Scholar]
  31. Mushtaq, M.; Sultana, B.; Anwar, F.; Adnan, A.; Rizvi, S.S.H. Enzyme-assisted supercritical fluid extraction of phenolic antioxidants from pomegranate peel. J. Supercrit. Fluids 2015. [Google Scholar] [CrossRef]
  32. Lindsey, J.K.; Vance, B.D.; Keeter, J.S.; Scholes, V.E. Spheroplast formation and associated ultrastructural changes in a synchronous culture of Anacystis nidulans treated with lysozyme. J. Phycol. 1971, 7, 65–71. [Google Scholar] [CrossRef]
  33. Vladimirescu, A.F. Isolation of permeaplasts and spheroplasts from Spirulina platensis. Romanian Biotechnol. Lett. 2010, 15, 5361–5368. [Google Scholar]
  34. Yi, P.; Zhao, Y.J.; Guo, H.L. Induction of vacuolated spheroplasts and isolation of vacuoles in cyanobacteria. J. Phycol. 2005, 41, 366–369. [Google Scholar] [CrossRef]
  35. Merz, M.; Eisele, T.; Berends, P.; Appel, D.; Rabe, S.; Blank, I.; Stressler, T.; Fischer, L. Flavourzyme, an Enzyme Preparation with Industrial Relevance: Automated Nine-Step Purification and Partial Characterization of Eight Enzymes. J. Agric. Food Chem. 2015, 63, 5682–5693. [Google Scholar] [CrossRef] [PubMed]
  36. Smith, J. Mixed β-Glucanase, Xylanase from Humicola Insolens; Chemical and Technical Assessment (CTA); FAO: Rome, Italy, 2004; pp. 1–5. [Google Scholar]
  37. Pronk, I.M.E.J.; Leclercq, C. Mixed xylanse, β-glucanase enzyme preparation produced by a strain of humicola insolens. WHO Food Addit. Ser. JECFA 2004, 52, 1–6. [Google Scholar]
  38. Spackman, D.H.; Stein, W.H.; Moore, S. Automatic Recording Apparatus for Use in the Chromatography of Amino Acids. Anal. Chem. 1958, 30, 1190–1206. [Google Scholar] [CrossRef]
  39. Perkins, D.N.; Pappin, D.J.C.; Creasy, D.M.; Cottrell, J.S. Probability-based protein identification by searching sequence databases using mass spectrometry data. Electrophoresis 1999, 20, 3551–3567. [Google Scholar] [CrossRef]
Figure 1. Enzyme-assisted extraction with Alcalase® of the polar spirulina biocomponents. Variations of total peak area in the HPLC-ELSD analyses: (a) effect of pH on the total area of peak products extracted at 4 h of enzyme treatment. (b) Time course of the extraction at optimal pH 6.5, for the total peak area. (c) Variation of the area value of the peak at 67.83 min retention time, for 4 h of enzyme treatment. (d) Time course of the extraction at optimal pH 6.5, for the peak at 5.5 min retention time. Other conditions: 1% (v/w) enzyme loading and 40 °C. A.U.: arbitrary area units.
Catalysts 09 00145 g001
Figure 2. Effect of the temperature on the Alcalase® assisted extraction of the polar spirulina biocomponents. Variation of total peak areas in the HPLC-ELSD analyses relative to 1 g biomass. Conditions: 1% (v/w) enzyme loading and pH 6.5; A.U.: arbitrary units.
Catalysts 09 00145 g002
Figure 3. Effect of the enzyme loading on the Alcalase® assisted extraction of the polar spirulina biocomponents. Variation of total peak areas in the HPLC-ELSD analyses relative to 1 g biomass. Conditions: 30 ºC and pH 6.5; A.U.: arbitrary units.
Catalysts 09 00145 g003
Figure 4. Micrographs of Arthrospira (Spirulina) platensis dry biomass, neither treated with any enzyme nor extracted by any solvent; (A) a longitudinal cut trichome and several transversally cut trichomes; (B) three contiguous cyanobacteria of a trichome separated by their cell walls; (C) detail of the cell wall.
Catalysts 09 00145 g004
Figure 5. Transmission electron microscope (TEM) micrographs of residual biomasses of Arthrospira p., obtained after the control extraction (A) and the extractions with Alcalase® (B), Ultraflo® (C), and Vinoflow® (D) pre-treatments. Extracts were obtained in their optimal conditions (pH 6.5, 1% v/w Alcalase® and 30 °C; pH 7.0, 1% v/w Ultraflo® and 30 °C; pH 6.5, 2% v/w Vinoflow® and 40 °C), and the control experiment was done with milli-Q water instead of the enzyme solution at 30 °C and 24 h.
Catalysts 09 00145 g005
Table 1. Extraction yield and total content of amino acids of the aqueous extracts obtained with the enzyme-assisted and control extraction procedures in their respective optimal operation conditions.
SampleYieldTotal Amino Acid Content
(%, w/w) 1% (w/w) µmol/g Extractmg/g Biomassµmol/g BiomassR 3
Control 219.20 ± 0.2034.4 ± 0.52986 ± 4766.0 ± 1.0573 ± 91.0
Alcalase®36.50 ± 0.1045.0 ± 7.13907 ± 69164 ± 26.01426 ± 252.5
Flavourzyme®31.80 ± 0.1016.9 ± 0.21471 ± 1653.8 ± 0.5468 ± 50.8
Ultraflo®19.70 ± 0.1013.7 ± 0.51189 ± 4027.0 ± 0.91234 ± 80.4
Vinoflow®26.30 ± 0.1013.5 ± 0.11172 ± 935.5 ± 0.3308 ± 30.5
1 By weight percent with respect to the starting Spirulina biomass. 2 No enzyme pre-treatment. 3 Mole ratio of total amino acids obtained per gram of extract with and without enzyme assistance. Mean values of individual amino acid contents of all the extracts resulted statistically not equal in the t-test (p ≤ 0.05).
Table 2. Composition of spirulina from ASN LEADER S.L., provided by the manufacturer.
General Composition
ProteinsLipidsCarbohydratesMineralsFiberEnergy
50–65%6–7.5%18–22%15%0.2%390 cal/100 g

