Article

Comparision on the Low-Temperature NH3-SCR Performance of γ-Fe2O3 Catalysts Prepared by Two Different Methods

Institute of Thermal Energy Engineering, School of Mechanical Engineering, Shanghai Jiao Tong University, Shanghai 200240, China
*
Author to whom correspondence should be addressed.
Catalysts 2019, 9(12), 1018; https://doi.org/10.3390/catal9121018
Submission received: 28 October 2019 / Revised: 29 November 2019 / Accepted: 30 November 2019 / Published: 3 December 2019
(This article belongs to the Special Issue Green Chemistry and Environmental Processes)

Abstract

:
Maghemite (γ-Fe2O3) catalysts were prepared by two different methods, and their activities and selectivities for selective catalytic reduction of NO with NH3 were investigated. The methods of X-ray powder diffraction (XRD), Brunauer–Emmett–Teller (BET), X-ray photoelectron spectroscopy (XPS), hydrogen temperature-programmed reduction (H2-TPR), ammonia temperature-programmed desorption (NH3-TPD), transmission electron microscopy (TEM), Energy-dispersive X-ray spectroscopy (EDS), and in situ diffuse reflectance infrared Fourier transform spectroscopy (in situ DRIFTS) were used to characterize the catalysts. The resulted demonstrated that the γ-Fe2O3 nanoparticles prepared by the facile method (γ-Fe2O3–FM) not only exhibited better NH3-SCR activity and selectivity than the catalyst prepared by the coprecipitation method but also showed improved SO2 tolerance. This superior NH3-SCR performance was credited to the existence of the larger surface area, better pore structure, a high concentration of lattice oxygen and surface-adsorbed oxygen, good reducibility, a lot of acid sites, lower activation energy, adsorption of the reactants, and the existence of unstable nitrates on the surface of the γ-Fe2O3–FM.

1. Introduction

Nitrogen oxides (NOx, x = 1, 2) are the main sources of global environmental concerns like acid rain, fine particle pollution, smog, and ozone depletion [1]. The demand for reducing fuel consumption and making the environment clean has increased with increased awareness in society about protecting the global environment. Due to this persistent demand, NOx legislation for both point and mobile sources has become more and more strict [2]. Therefore, in the recent era, a lot of focus is given to the removal of NOx by the researchers. To meet these strict regulations for NOx abatement, selective catalytic reduction (SCR) of NOx with ammonia (NH3) has become the most efficient and widely used NOx abatement technology, for point sources like coal-fired power plants [3].
In recent years, Fe2O3 has been extensively studied as a primary catalyst due to its naturally environmentally benign features, low toxicity, and noticeable thermal stability [2]. For example, Shen et al. [4] used a sol–gel method to dope Mn-Ce/TiO2 with iron to make Fe-Mn-Ce/TiO2 catalyst. It was found that the addition of Fe has enhanced the low-temperature NH3-SCR activity of the catalyst. Yang et al. [5] substituted low-cost Fe2O3 to replace WO3 in the V2O5/WO3-TiO2 catalyst to improve the N2 selectivity of the catalyst. He found that the support (Fe2O3-TiO2) mainly resulted in the acid sites in the catalysts, so the adsorbed NH3 was favored to be activated by Fe3+ rather than by V5+. Liu et al. [6] used the hydrothermal method to prepare an environmentally benevolent Fe-Ce-Ti mixed oxide catalyst. It was found that the addition of Fe significantly achieved excellent NO reduction (over 90% NO conversion at 200 °C), N2 selectivity (nearly 100% N2 selectivity), and SO2 tolerance of the catalysts. Wang et al. [7] prepared Fe2O3 particles with aqueous precipitation method and found that the Fe2O3 particles exhibited excellent catalytic activity reaching almost 95% in a low-temperature range of 150 to 270 °C. However, the SO2 tolerance of the Fe2O3 catalyst was not very good. The literature shows the potential of Fe2O3 catalysts as an active component to selectively catalyze the reduction of NO to nontoxic N2 at low-temperatures. In most of these works, the active ingredient in the Fe2O3 was α-Fe2O3 (hematite). However, Liu et al. [8] prepared α-Fe2O3 and γ-Fe2O3 particles by the coprecipitation method and compared the catalytic activity and selectivity of both these phases of ferric oxide under the same conditions. The results demonstrated that the γ-Fe2O3 catalyst’s surface adsorbed the nitric oxide and ammonia more easily and efficiently than then α-Fe2O3 catalyst’s surface. This enhanced adsorption resulted in superior catalytic activity and N2 selectivity of the γ-Fe2O3 catalyst at low temperatures (100–300 °C). γ-Fe2O3 is nonstoichiometric iron oxide. It can be considered as a Fe2+-deficient Fe3O4 with a unit cell representation of (Fetet3+)8[Feoct3+5/6VFe1/6]16O32, where the brackets () represents tetrahedral sites, VFe represents a cations vacancy, and [] represents octahedral sites. Some portion of Fe3+ can be easily reduced to Fe2+ in magnetite because of its metastability [9]. Figure 1 shows the structure of the nonstoichiometric iron oxide (γ-Fe2O3). The octahedral and tetrahedral interstitial sites in the γ-Fe2O3 structure along with octahedral vacancies could be seen. Apart from this, γ-Fe2O3 can also facilitate CO oxidation [10] desulfurization [11] and mercury oxidation [12].
It is reported that in the SCR reaction, the method of preparation of a catalyst strongly affects the catalytic activity of catalyst [14]. For example, Chen et al. [15] used three different methods to synthesized a series of Fe-Mn mixed oxide catalysts. The methods were the coprecipitation method, citric acid method, and solid reaction method. The catalyst synthesized by the citric acid method exhibited better activity (reaching 98.8% NOx conversion) at 120 °C than other methods. Previously, Wang et al. [16] synthesized a series of γ-Fe2O3 catalysts with microwave-assisted coprecipitation method (MACP). The catalytic activity of γ-Fe2O3 catalysts synthesized by using different precipitation techniques as well as by using different precipitants was compared. The results demonstrated that among all the catalysts, the γ-Fe2O3 catalyst synthesized by direct titration precipitation technique and NH4OH as precipitant showed better SCR performance. However, the researchers were unable to achieve good surface chemistry of the γ-Fe2O3 catalyst due to the conventional preparation method. As a result, NO reduction activity was not good (approximately 52% at 200 °C) at low temperatures. In addition, the conventional synthesis process to prepare γ-Fe2O3 particles, such as coprecipitation [7], microemulsions [17], thermal decomposition [18,19,20], sol–gel [21,22,23], and some other chemical processes [24,25], also requires long reaction time, suitable pH value, and surfactants or certain additives for synthesizing pure γ-Fe2O3 particles with controllable morphology. Furthermore, in order to gain monodisperse and single-phase products, purification and centrifugation are also required. All this makes these processes very cumbersome and complicated procedures for synthesizing monodisperse γ-Fe2O3.
Motivated by the idea to find an efficient, environmentally benign, and low-cost γ-Fe2O3 catalyst with improved NH3-SCR performance, we prepared γ-Fe2O3 nanoparticles by a facile one-step synthesis method. The NH3-SCR performance of the γ-Fe2O3 catalyst prepared by the facile method (γ-Fe2O3–FM) was also compared with the catalyst prepared by the conventional coprecipitation method (γ-Fe2O3–CP). The methods of XRD, BET, XPS, H2-TPR, NH3-TPD, TEM, EDS, and in situ diffuse reflectance infrared Fourier transform spectroscopy (DRIFTS) were used to characterize the catalysts. The result demonstrated that the γ-Fe2O3-FM exhibited superior NH3-SCR performance than γ-Fe2O3–CP. The γ-Fe2O3-FM exhibited regular spherical particles, smaller particle diameter, larger surface area, and better pore connections. The facile method also inhibited the formation of the α-Fe2O3 in the catalyst, which positively influenced the low-temperature SCR activity and selectivity of the catalyst. γ-Fe2O3-FM also contains a higher concentration of lattice and surface-adsorbed oxygen, good reducibility, many acid sites, lower activation energy, more adsorption of the reactants, and the existence of unstable nitrates on the surface.

2. Results and Discussion

2.1. Characterization

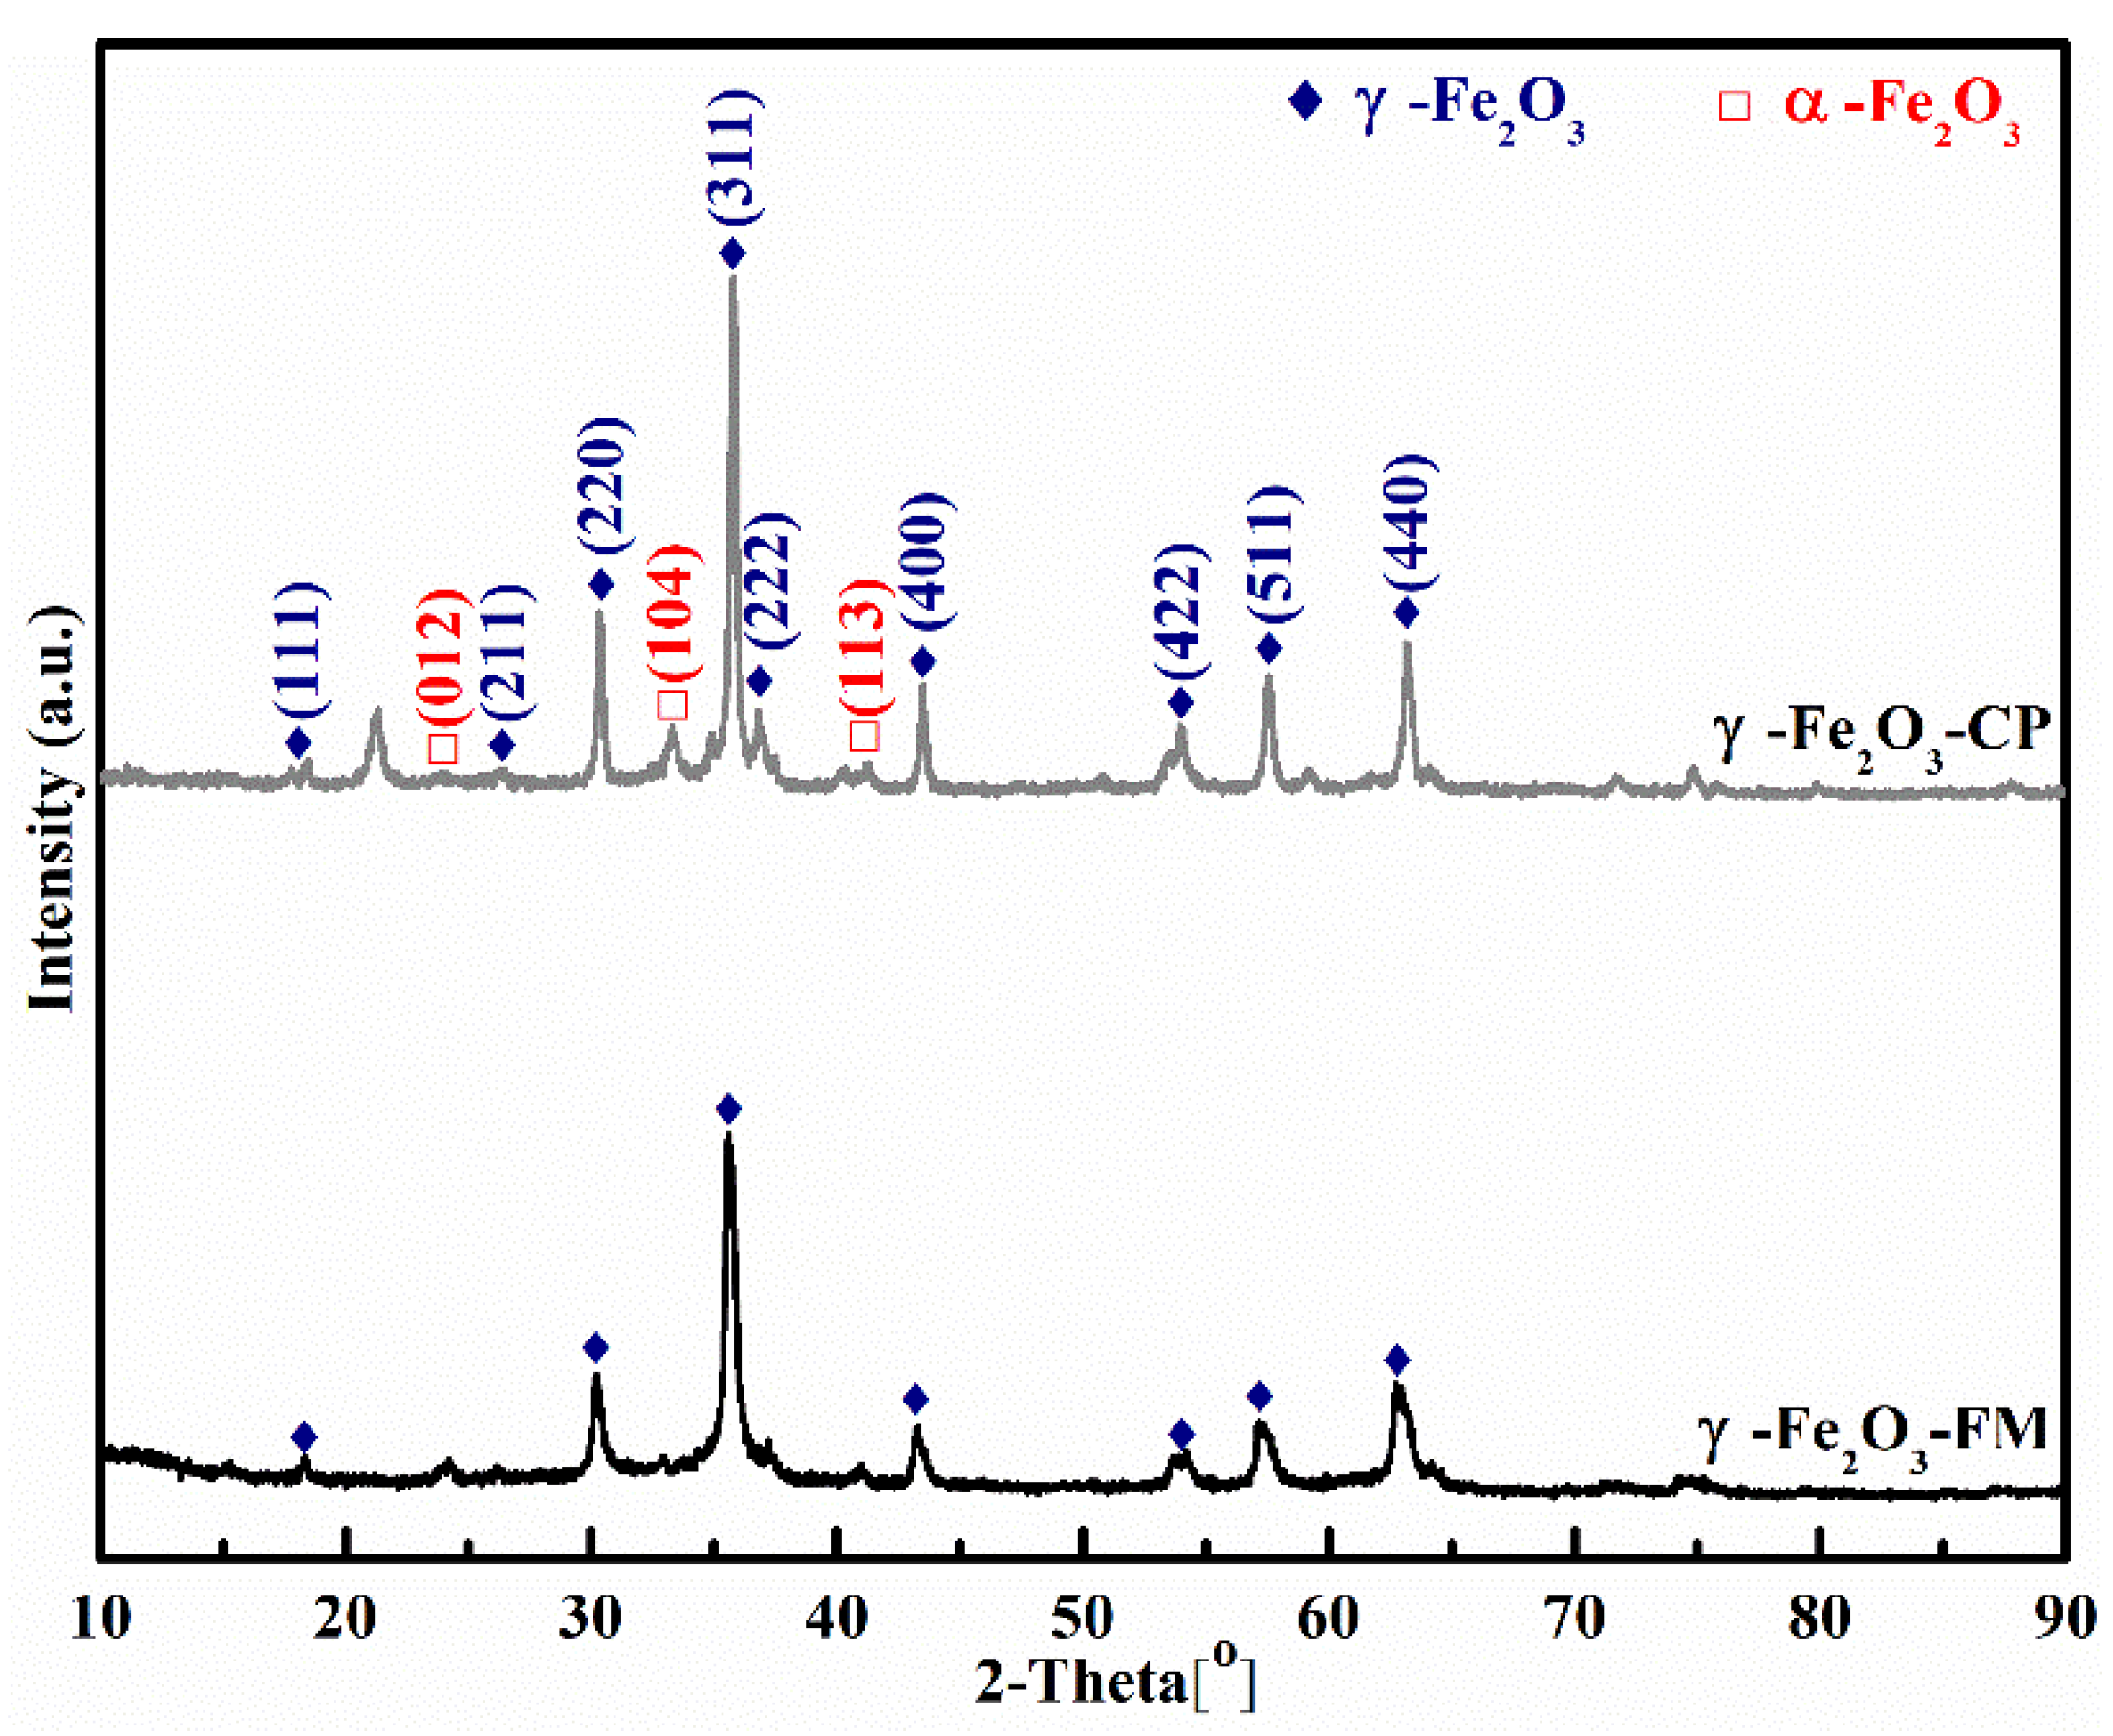
Figure 2 shows the X-ray diffraction patterns of the catalysts synthesized by two different methods (FM and CP). It can be seen, from the sharp diffraction peaks at 2θ equal 18.46°, 26.35°, 30.36°, 35.76°, 37.2°, 43.49°, 53.93°, 57.49°, 63.17° (JCPDS 39-1346), that the main phase present in the γ-Fe2O3-CP was maghemite (γ-Fe2O3) with good crystallinity. Whereas, 2θ equal 24.2°, 33.2°, and 41.2° coincide well with the characteristics peaks of hematite (α-Fe2O3) (JCPDS 89-8104), which suggests that some spots of α-Fe2O3 are present in the sample of γ-Fe2O3-CP. In comparison, all the diffraction peaks of the γ-Fe2O3-FM corresponded well with the maghemite (γ-Fe2O3) (JCPDS 39-1346), avoiding the formation of the α-Fe2O3, which can be beneficial to promote the NH3-SCR denitration performance.
The diffraction peak intensities of the γ-Fe2O3-FM are higher than the γ-Fe2O3-CP, also the shapes of the peaks were sharper. It is evident from the Scherrer formula (Equation (6)) that the crystallite size of a catalyst and half-width of diffraction peak is inversely proportional to each other. Therefore, the crystallite size, as well as the crystallinity of the γ-Fe2O3-CP was higher than that of γ-Fe2O3-FM, which might be due to an increase in the formation of α-Fe2O3 as well as the difference of the preparation method. Thus, the facile method using the DMF solvent can avoid the creation of the crystalline phase of α-Fe2O3, which resulted in a higher BET surface area of the sample (Table 1).
Table 1 shows the values of specific surface areas, pore volume, and pore size of the catalysts. The results demonstrated that the specific surface area and the specific pore volume of the γ-Fe2O3-FM were 3.45 and 1.39 times larger than that of γ-Fe2O3-CP, respectively. Meanwhile, a difference of around 7.30 nm could be seen in the average pore diameter of the two samples, γ-Fe2O3-FM having a lower value (5.419 nm). The number of active sites could be achieved by attaining a higher surface area and pore volume of the catalyst. It can be concluded that this facile method using DMF as a solvent can aid to achieve a decrease in average pore diameter as well as the particle size of the γ-Fe2O3 catalyst. These results could easily be verified by the TEM images.
N2 adsorption-desorption curves of the two catalysts measure at the temperature of liquid N2 are shown in Figure 3A. When comparing these isotherms with the IUPAC classification, the isotherm of the γ-Fe2O3-CP resembled type II isotherm [26] dedicated to macroporous materials. Additionally, the type of hysteresis loop resembled with H3 type, which demonstrated that a slit-shaped pore structure could be present in the catalyst [27]. However, the isotherm of the γ-Fe2O3-FM resembled type IV isotherms [28]. The type IV isotherms were characterized as mesoporous materials ranging from 2 to 50 nm. The type of hysteresis loop resembled with H2 type, which demonstrated that the pore structure could be present in an ink bottle-shaped structure [29].
If we compare the closure points of the hysteresis loop for the catalysts, we can see that the closure points of the γ-Fe2O3-CP are at higher P/Po as compare to that of γ-Fe2O3-FM, which indicate that number of micropores (<2 nm) are present in the γ-Fe2O3-FM. Moreover, lower P/Po closure points of the hysteresis loops for the γ-Fe2O3-FM indicated that the average pore size of the γ-Fe2O3-FM was lower than the γ-Fe2O3-CP. Meanwhile, it can be seen from Table 1 that the particle sizes and surface areas of the two catalysts were inversely proportional to each other. Therefore, more pore volume and inner surface area of the catalyst can help NH3-SCR reaction.
Figure 3B shows the pore size distribution of the catalysts. The results showed that the γ-Fe2O3-FM pore size was distributed from 2 to 8 nm, it also has a well-developed pore structure. However, the pore size of the γ-Fe2O3-CP has shown no peaks between 2 and 8 nm. The first peak could be seen at 12.20 nm, and then two small peaks are seen from 15 to 50 nm, indicating a reduction in its pore structure. It can be determined that the coprecipitation method was playing a part in destroying the pore structure of the catalyst, especially between 2 and 8 nm. From the results demonstrated in Figure 3, it can be determined that the NH3-SCR activity is enhanced when the quantity of the pores increases between 2 to 8 nm. γ-Fe2O3-FM containing pores 2–8 nm in size and a well-developed structure exhibited better NH3-SCR activity (approximately 10% higher at 230 °C) than γ-Fe2O3-CP containing more pores within 15 to 50 nm. As well, in γ-Fe2O3-CP with the shifting of pore volume peak right word and increase in the pores within 15 to 50 nm, the number of available active sites decreases due to the collapse of the pore structure which adversely affected the NH3-SCR activity.
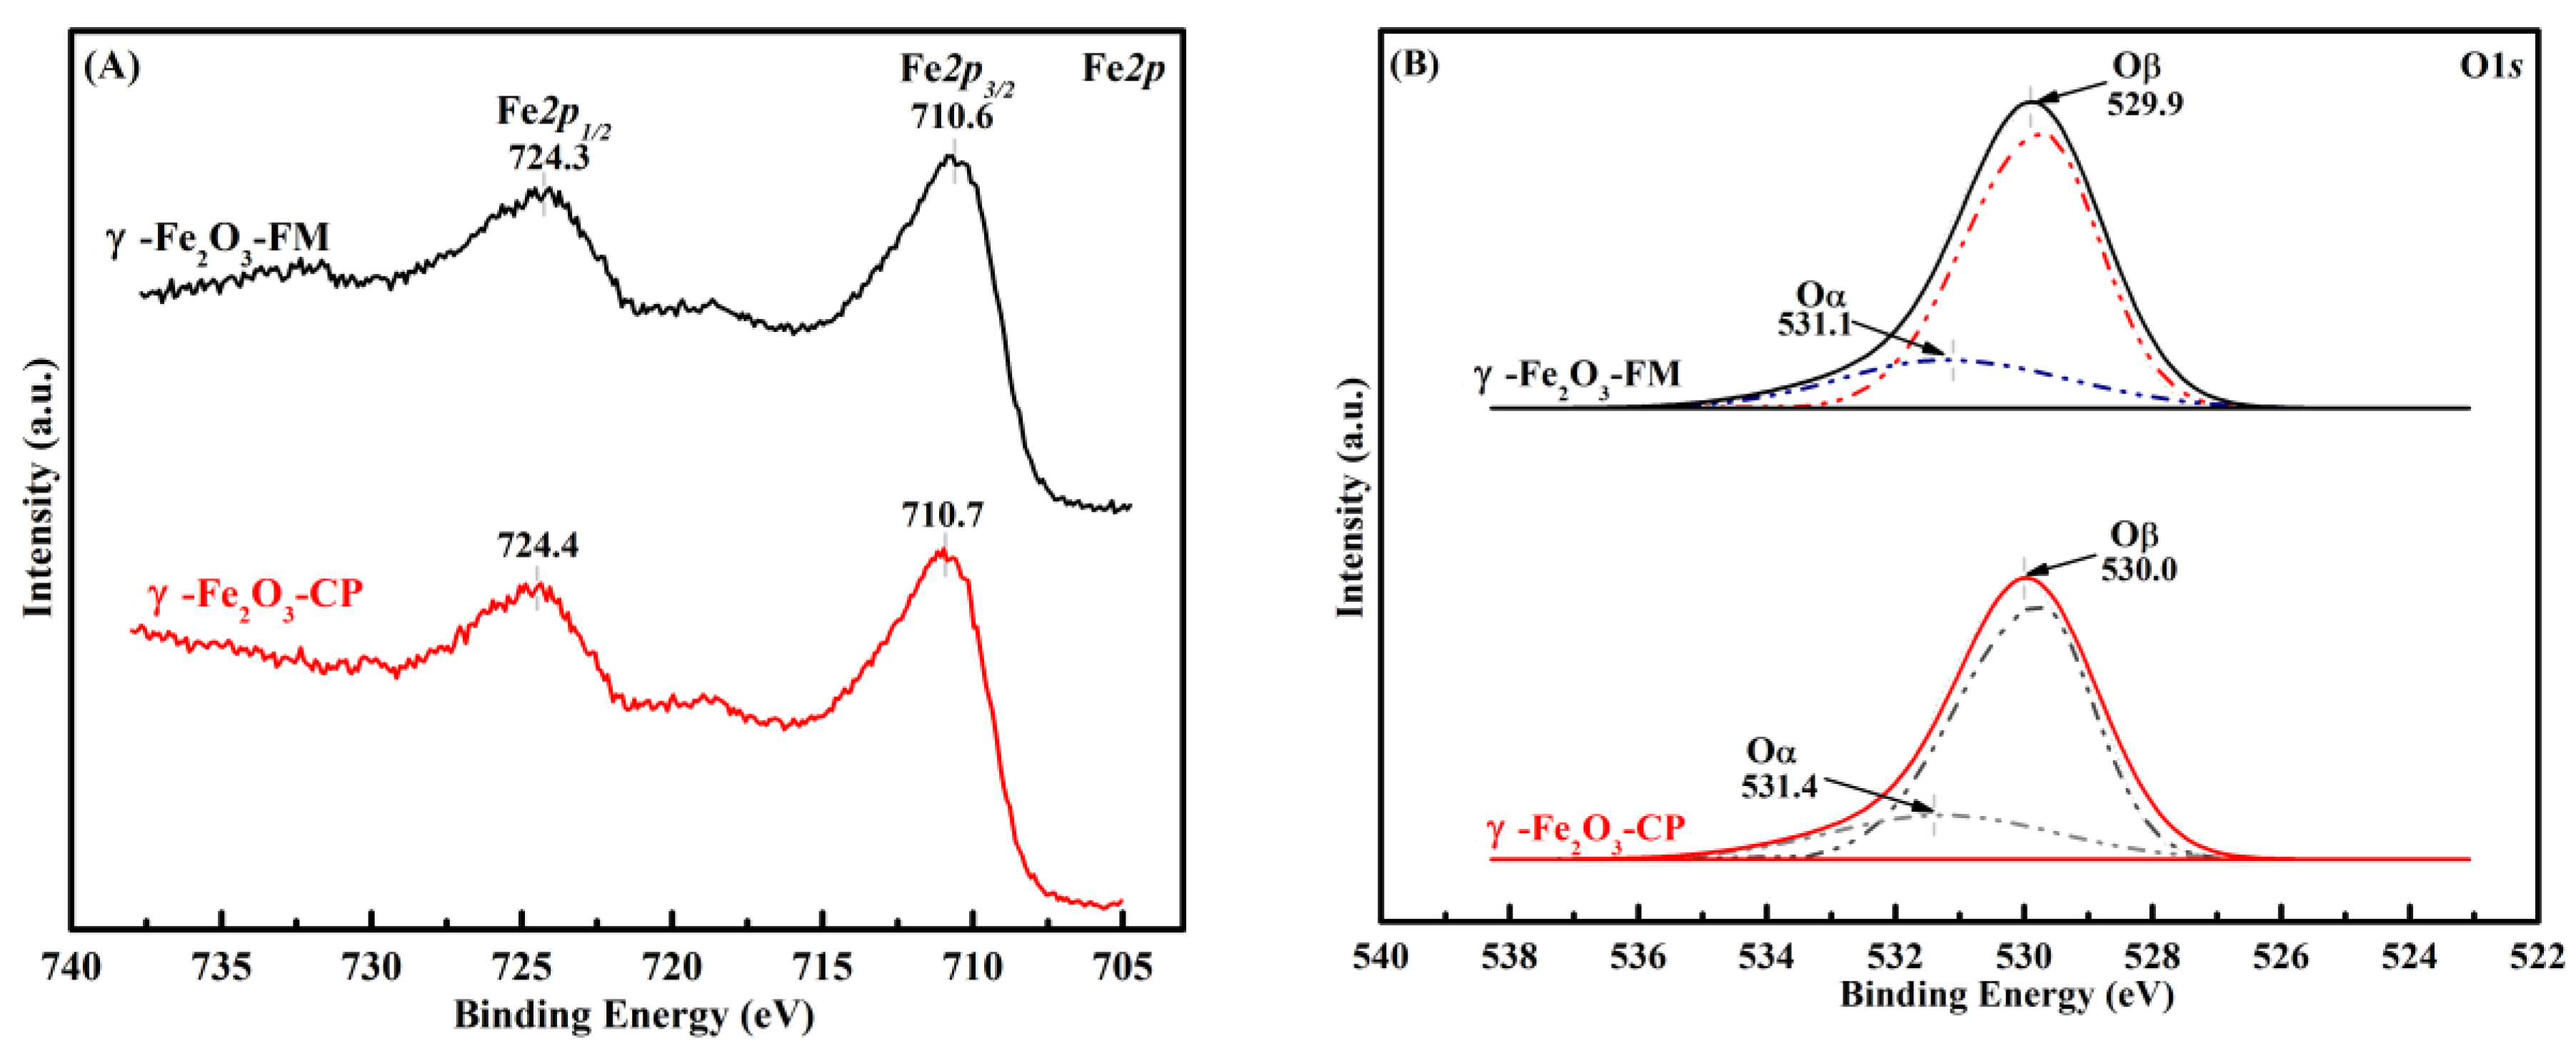
XPS analysis was carried out to characterize the oxidation state of the surface elements on the iron (III) oxide catalysts (Figure 4). It can be seen from Figure 4A that electron-binding energies of Fe 2p3/2 (710.6–710.7 eV) and Fe 2p1/2 (724.3–724.4 eV) correspond well to Fe (III) [30], and the binding energy values of Fe 2p for γ-Fe2O3-FM were slightly less than γ-Fe2O3-CP, maybe due to the existence of hematite phases (α-Fe2O3) in the γ-Fe2O3-CP catalyst. Figure 4B shows the deconvolution of the O 1s spectrum. The binding energy at 529.9–530.0 eV corresponds to the lattice oxygen O2− (denoted by Oβ), whereas, the sub-bands at higher binding energy (531.1–531.4) were assigned to surface adsorbed oxygen such as O or O22– which correspond to defect oxide/hydroxyl-like group (denoted as Oα) [31]. Surface chemisorbed oxygen (Oα) is very active in oxidation reactions because its mobility is higher than the lattice oxygen (Oβ) [32], and the high SCR activity could be correlated with the high content of chemisorbed oxygen on the catalyst’s surface. The ratios of Oα/(Oα + Oβ) over γ-Fe2O3-FM and γ-Fe2O3-CP are 33.59% and 31.86%, respectively. This indicated the existence of more hydroxyls/defect oxide on the γ-Fe2O3-FM catalyst’s surface. In the SCR reaction, these hydroxyls/defect oxides are supposed to offer acid sites to the ammonia molecule to adsorb in the form of coordinated NH3 and NH4+.
In order to have further insight into the NO conversion of the catalysts, the H2-TPR experiments of γ-Fe2O3-FM and γ-Fe2O3-CP catalysts were conducted. Generally, the hydrogen consumption peaks located at 250–500 °C are attributed to surface lattice oxygen, and peaks at 500–800 °C are attributed to bulk lattice oxygen [33]. It can be seen in Figure 5A that two well-separated reduction peaks were present in the H2-TPR profiles of the catalysts. Surface lattice oxygen was credited with the reduction process of maghemite to magnetite (γ-Fe2O3 → Fe3O4) in the low-temperature peak, and the bulk lattice oxygen was responsible for the reduction of magnetite to metallic iron (Fe3O4 → Fe) in the high-temperature peak [33]. In actuality, with a sample heating rate of 5.5 °C and higher, two heavily overlapped peaks could be observed in the high-temperature region (as shown in Figure 5A). That is why the reduction of magnetite was believed to happen in a two-step magnetite reduction sequence, i.e., 2Fe3O4 → 6FeO → 6Fe [34]. γ-Fe2O3-CP was characterized by three different reduction peaks at 355 °C, 624 °C, and 772 °C, corresponding to the reduction of Fe2O3 to Fe3O4 (355 °C), Fe3O4 to FeO (624 °C), and FeO to Fe (772 °C) [33,34]. However, the results exhibited that the corresponding temperatures to the reduction peaks have shifted to lower values for the γ-Fe2O3-FM, which indicated higher mobility of the oxygen species in the γ-Fe2O3-FM. As the reducibility can be indicated by the reduction peak temperature, the lower reduction peak temperature indicated stronger reducibility. Therefore, the catalytic activity of γ-Fe2O3-FM was better than that of γ-Fe2O3-CP.
One of the main processes of the NH3-SCR reaction is the adsorption and activation of ammonia on the acid sites that exist on a catalyst’s surface. In order to examine this, NH3-TPD experiments were conducted. It can be seen from Figure 5B that the samples have three NH3 desorption peaks from 50–500 °C. It is suggested that ionic NH4+ are ascribed to Brønsted acid sites, which are considered thermally less stable than the coordinated NH3 molecules linked to the Lewis acid sites [33]. Consequently, it can be concluded that the adsorption peaks at lower temperatures (118, and 134.8 °C) are assigned to weak acid sites (weakly bonded NH3), the medium temperature peaks (197, 231.7 °C) can be assigned to both Lewis and Bronsted acid sites, and the adsorption peaks at higher temperatures (294 and 343.2 °C) can be ascribed to Lewis acid sites. Therefore, NH3-TPD results indicated the presence of both Lewis and Brønsted acid sites in the catalysts for ammonia adsorption. Note that the peak area of γ-Fe2O3-FM Lewis acid sites and weak Brønsted acid sites is obviously greater than those of γ-Fe2O3-CP. The peak area implies the amount of ammonia adsorption in the sample [34], this indicated that γ-Fe2O3-CP has less number of acid sites than the γ-Fe2O3-FM. Therefore, the catalytic activity and selectivity of the γ-Fe2O3-FM were higher than the γ-Fe2O3-CP.
Figure 6 shows the TEM images of the γ-Fe2O3 samples prepared by two different methods, it can be seen that the γ-Fe2O3 catalysts synthesized by different methods contain different microstructures. γ-Fe2O3-FM showed fine spherical particles with relatively uniform particle diameter (Figure 6A–C, respectively). HRTEM characterizations demonstrated lattice fringes of the obtained ferrite (Figure 6) and the interfringe distance shown in Figure 6E is 0.252 nm, which corresponds well to {311} planar space of γ-Fe2O3 nanoparticles. Meanwhile, (Figure 6I) gives EDS data of γ-Fe2O3-FM nanoparticles and the Cu peaks were shown in the results may be due to the copper net used during the experiments. The elemental ratio of Fe:O is determined to be 32.89:61.50, which is very near to the stoichiometry of γ-Fe2O3, which further approves that the structure and composition are coincident with the chemical formulation of γ-Fe2O3. Figure 6J exhibited the same particle size distribution obtained from the TEM micrograph, and it can be seen that the uniform particle distribution is shown by the histogram. The Gaussian fit was used to find mean particle sizes, which comes out near 10 ± 1 nm, which is comparable with XRD linewidth results.
In addition, the particles of γ-Fe2O3-FM are relatively uniform and regular spherical particles; an obvious decrease in particle diameter and better pore connection could be observed (Figure 6 A–C, respectively). However, γ-Fe2O3-CP demonstrated irregular particle morphology, due to the sintering phenomenon, the existence of the needle-like particles, slice particles, as well as aggregated particles in the TEM of γ-Fe2O3-CP. In addition during the sintering phenomenon, the phenomenon of interparticle conglutination will become worse, and in the meantime, the pore voids are completely plugged due to the breakdown of the pore structure. Spherical particles can offer a larger specific surface area as compared to the needle particles and slice particles [16], which will increase the adsorption sites on the surface of the catalyst. In addition, mass transfer and diffusion can be ensured by the better pore connections, which will influence the NH3-SCR reaction positively.
Table 2 shows the EDS analysis of the two samples. As expected, the major elements in the ferric oxide samples are Fe and O (some proportion of Cu was present because it was used to guarantee the electrical conductivity of these samples, and C was present from the gelatinous substrate). It can be seen from Table 2 that the O/Fe atomicity ratio over γ-Fe2O3-FM surface was 1.86, whereas, in the γ-Fe2O3-CP, the ratio was 1.45. This indicated that the crystal surface of the γ-Fe2O3-FM could be exposed by more number of lattice oxygen sites because of the plentiful adsorbed oxygen and lattice oxygen on the catalyst’s surface, the catalyst’s surface oxidizability will enhance, which in turn will increase the NH3-SCR activity.

2.2. Low-Temperature NH3-SCR Performance

The low-temperature SCR removal activity and N2 selectivity of the two maghemite samples are shown in Figure 7. The NH3-SCR performance of γ-Fe2O3-FM is obviously better than γ-Fe2O3-CP. The NO conversion of γ-Fe2O3-FM reached approximately 96% at 230 °C, and the N2 selectivity remained above 90% up to 290 °C (Figure 7A,B). Dong et al. previously reported the catalytic activity of the maghemite catalyst prepared by a microwave-assisted coprecipitation method (γ-Fe2O3-MACP), and the results are also plotted in Figure 7A for comparison. In the study of Dong et al. [16], the GHSV was lower than our experiment, still the NO conversion was lower than that of the γ-Fe2O3-FM at low temperatures.
The influence of SO2 and H2O on the SCR activity of both samples was investigated at 230 °C (Figure 7C). To test SO2 tolerance, 300 ppm SO2 was added to the simulated flue gas after 40 min of stable reaction. It can be seen that the NO conversion of the γ-Fe2O3-FM showed a negligible decrease and the NO conversion still remained above 90% after 100 min. However, the NO conversion decreased from 94% to 79% in 200 min, after that the NO conversion became almost stable. When SO2 feed was stopped after 400 min, the NO conversion was restored to some extent. Compared with the previous reports [35,36], our experiments exhibited that the γ-Fe2O3-FM had better tolerance to SO2 at 230 °C in one hour of added SO2. However, the coexistence of H2O and SO2 caused more catalyst deactivation to the addition of a single gas (SO2), because H2O can compete with the gaseous NH3 for the active sites [35]. When 5 vol% H2O and 300 ppm SO2 was added to the simulated flue gas after 40 min of stable reaction, the synergy effects of the H2O and SO2 could be seen on the NO conversion of the γ-Fe2O3–FM. Similar variation trends in the decrease of NO conversion for γ-Fe2O3–CP could be seen after the addition of H2O and SO2 in the feed gas. However, the decrease in the catalytic activity was more may be due to a decrease in the surface area of the sample. The results showed that the decrease in activity by H2O and SO2 are due to their competing adsorption with the reactant over the surface of the catalyst.
Figure 7D shows the Arrhenius plot of NO oxidation over the two samples in the temperature range of 140 to 290 °C. Equation (5) was used to find out the NO oxidation rate of reaction in this temperature range. The slop of the plot was used to find out the activation energy for NO oxidation. With γ-Fe2O3-FM the activation energy (17 KJ·mol−1) is much lower than that of γ-Fe2O3-CP (29 KJ·mol−1). Note that the value of the activation energy of γ-Fe2O3-FM is much lower not only from γ-Fe2O3-CP (29 KJ·mol−1), but also some other catalysts like Ti0.9Fe0.1O2−δ, (27 KJ·mol−1) [37], and MnOx/TiO2 (38 KJ·mol−1) [38]. It is also well known that activation energy is an important parameter in the NH3-SCR reaction, because lower the activation energy means to lower the reaction temperature required for the reaction to take place. Therefore, γ-Fe2O3-FM shows its superior NH3-SCR performance for low temperatures. This result showed that under these conditions the active sites generated on the catalysts may have changed; however, the NO2 produced in large quantities at higher temperatures (300–350 °C) did not play its part in the NH3-SCR activity due to its deactivation mechanism.

2.3. NO and NH3 Oxidation Activity

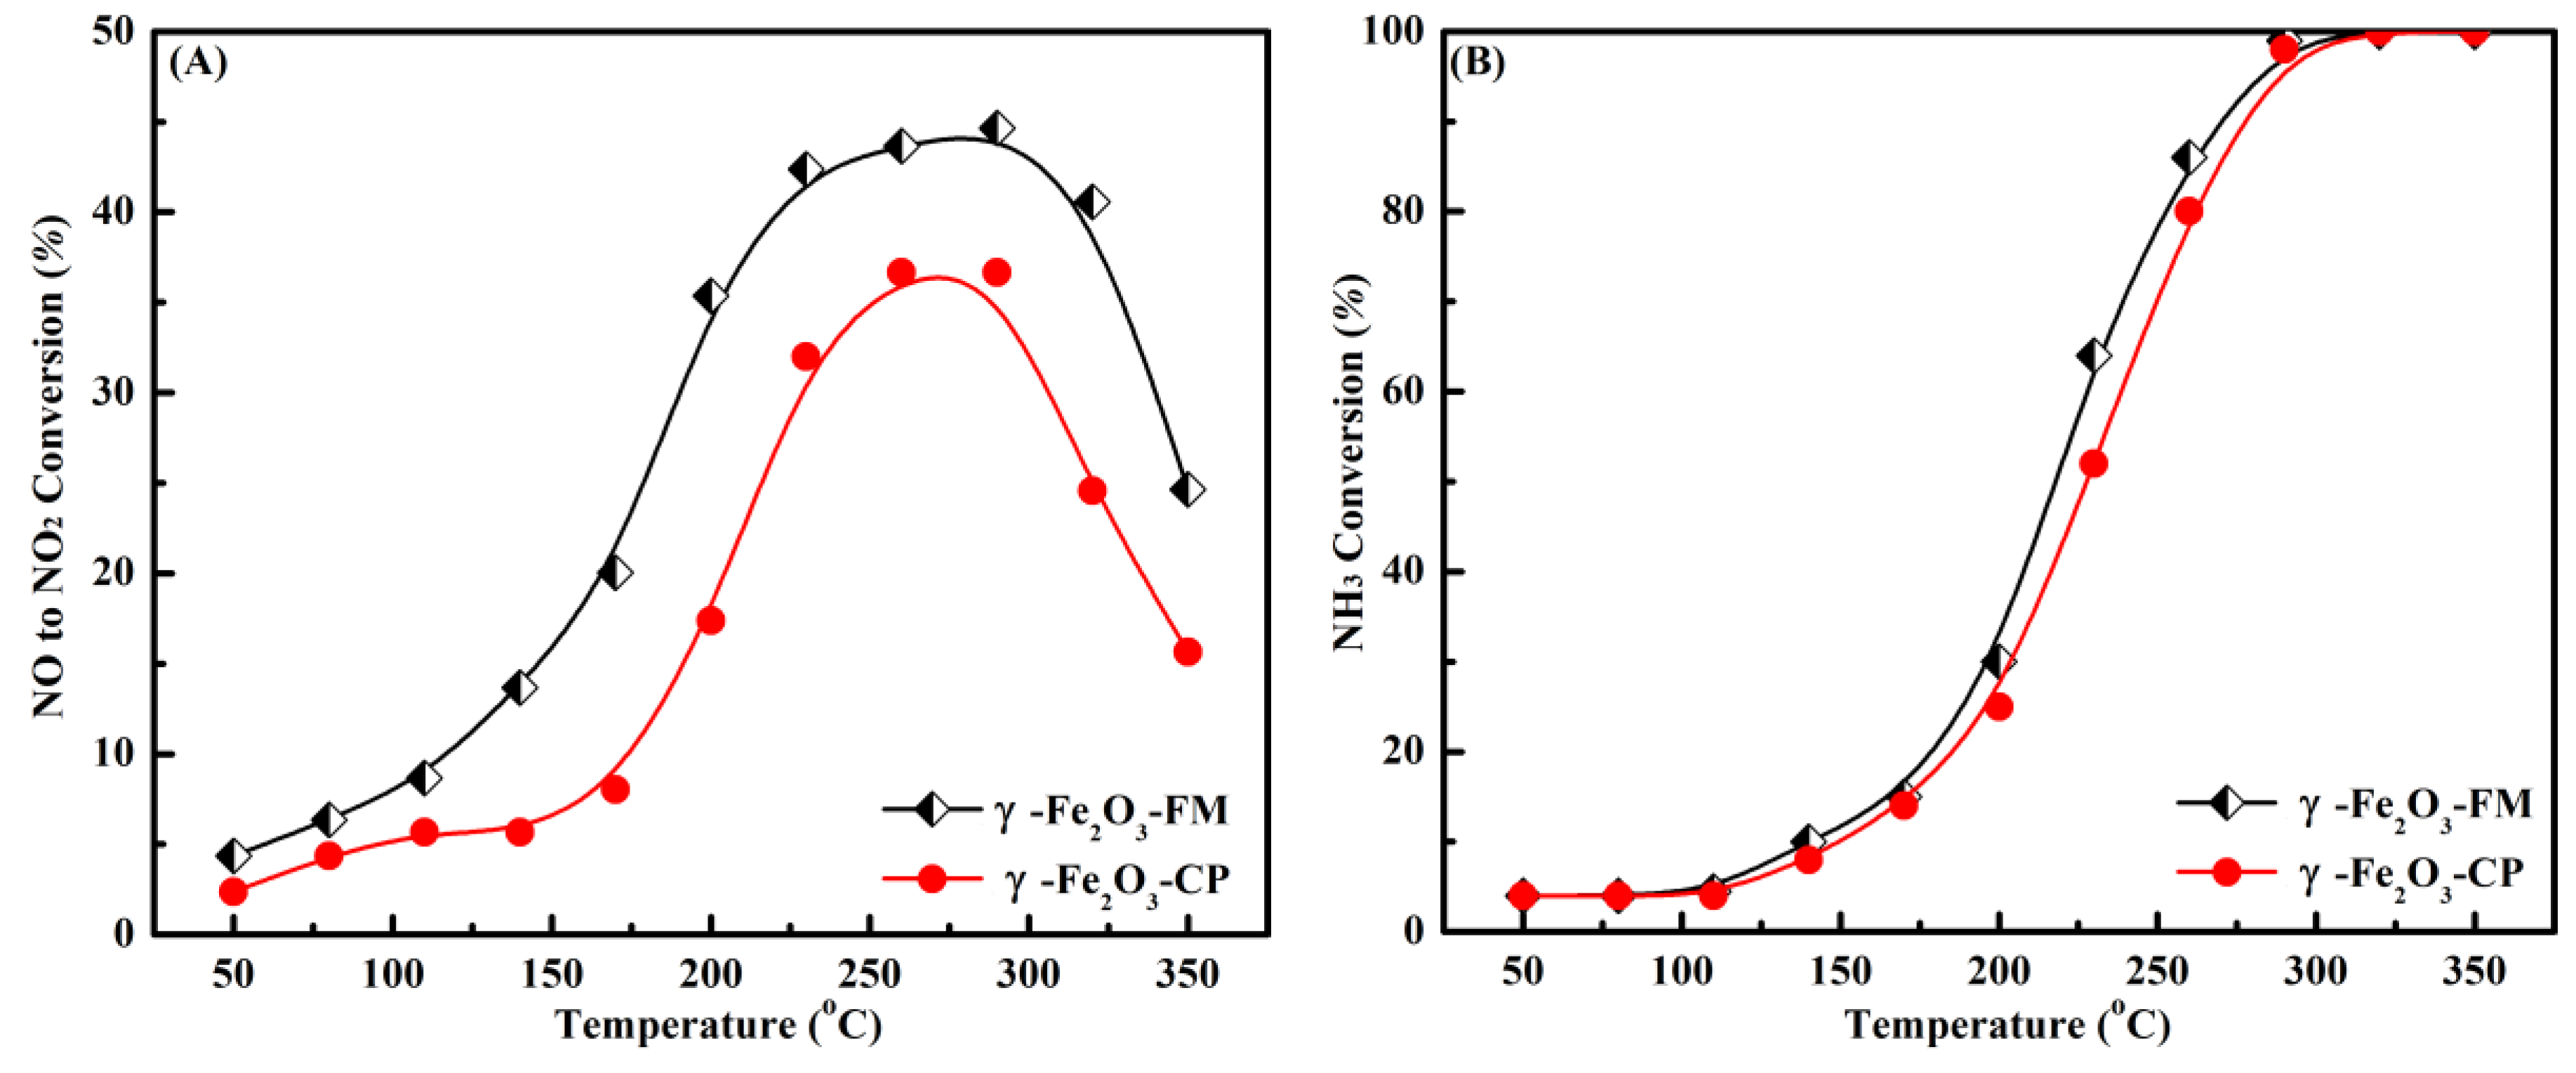
It was reported that, with the increase in the NO2/NO molar ratio in the feeding gas, the fast SCR reaction, NO+ NO2+2NH3→2N2+3H2O, could be promoted, which can significantly boost the low-temperature SCR activity of the catalyst [15]. That is why separate NO oxidation activities of the different samples were tested and results are demonstrated in Figure 8A. It can be seen that with the rise in temperature the NO oxidation activities increased first up to 300 °C and then decreased. Some evident differences could be seen between the NO oxidation activity and NH3-SCR activity of the samples which could be ascribed to the role of ammonia during NH3-SCR reaction; in real SCR reaction, the presence of NH3 would raise the NO to NO2 conversion in comparison to the pure NO oxidation. NO conversion to NO2 was verified to be a slow step for the SCR reaction, and the NO2 generated was quickly consumed in the existence of ammonia [39,40]. Besides, Figure 8B shows that the NH3 oxidation of the samples increased with the rise in temperature. This increase in the NH3 oxidation at high temperatures is considered a side reaction, aiding in the formation of NO in the NH3-SCR system and also causing the deactivation of the catalysts at high temperatures [41]. Similar to the NO oxidation ability, the NH3 oxidation activity of the γ-Fe2O3-FM was higher than γ-Fe2O3-CP. Note that the catalytic activity and selectivity of two samples also increase in the same manner.

2.4. In Situ DRIFTS Study of γ-Fe2O3-FM

2.4.1. Ammonia Adsorbents over γ-Fe2O3-FM

The reaction mechanism over SCR catalysts has always been a topic of interest for researchers and different hypotheses were proposed by the researchers for the SCR mechanism. To find the reaction mechanism of the γ-Fe2O3-FM in situ studies have been performed.
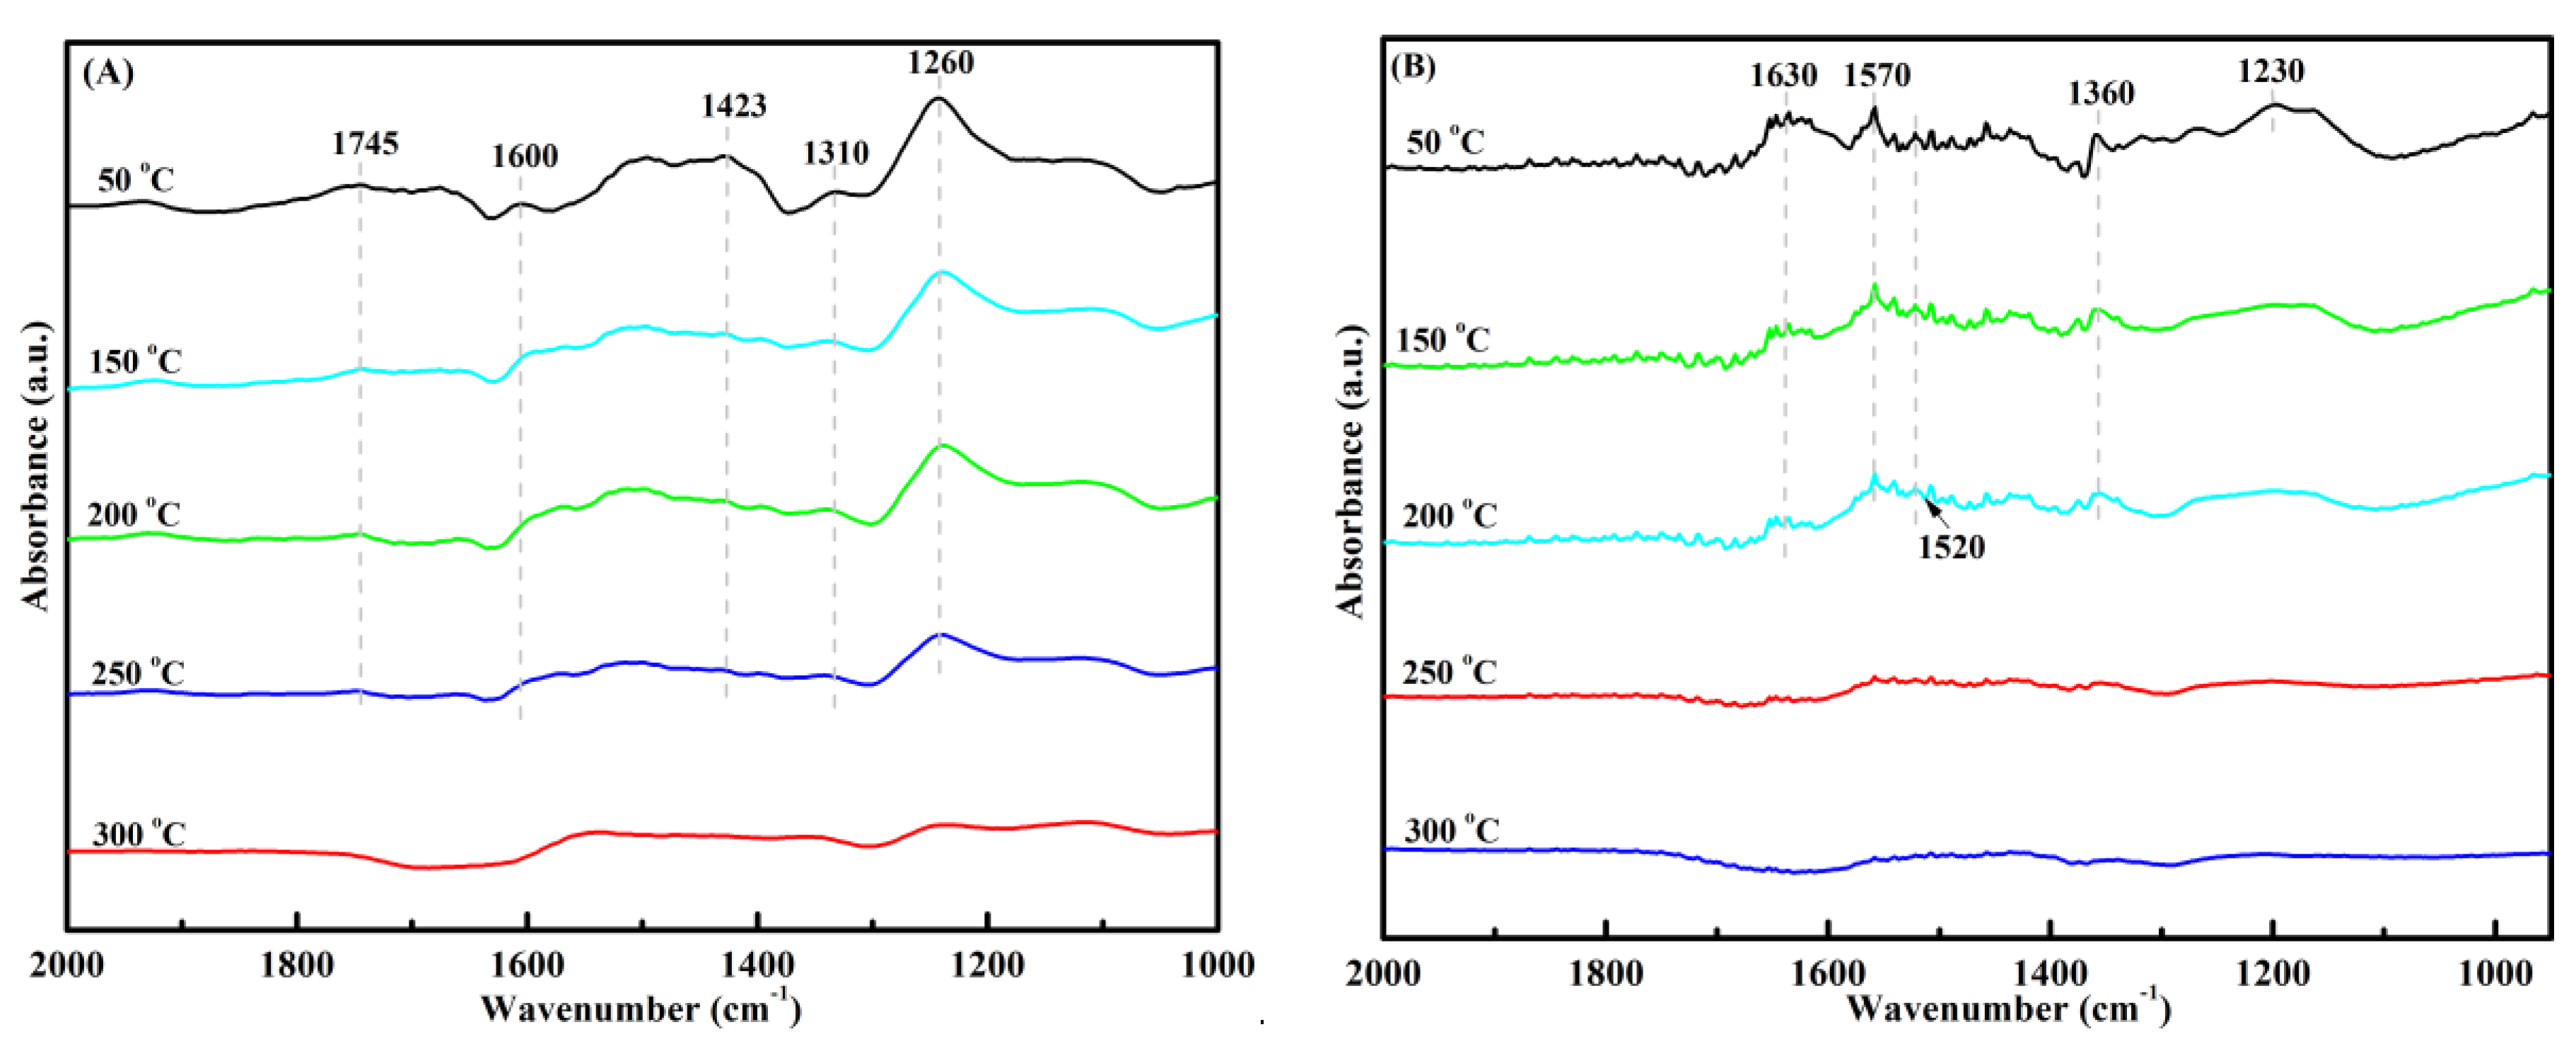
It is known that adsorption of NH3 on Lewis acid or Brønsted acid sites forms coordinated NH3 or NH4+ in the NH3-SCR reaction [42]. Then the gaseous or adsorbed NO reacts with these coordinated NH3 or NH4+ to produce nitrogen and water as a product. Therefore, the catalyst’s surface acidity is a vital factor for an NH3-SCR reaction. The DRIFTS spectra for adsorption of ammonia at different temperatures over γ-Fe2O3-FM are shown in Figure 9A. The band at 1745 and 1600 cm−1 were assigned to coordinated NH3 linked to the Lewis acid sites [43], and the band at approximately 1310 cm−1 can be linked to the symmetric deformation of NH3 coordinatively linked to one type of Lewis acid sites [43]. Moreover, the band at 1423 and 1260 cm−1 are ascribed to ionic NH4+ bound to the Brønsted acid sites [44].
The results demonstrated that NH3 species adsorbed over γ-Fe2O3-FM showed a slow decrease and less amount of oxidized intermediates were present over the γ-Fe2O3 catalyst with the rise in temperature. Some ammonia absorbents were present on the surface of the γ-Fe2O3 catalyst even at higher temperatures (200–300 °C). By taking into account the XPS and NH3-TPD results, we can say that the γ-Fe2O3-FM catalyst may have a number of defect oxides on its surface, as well as higher ammonia adsorption, which could be the reason of the better NH3-SCR catalytic activity.

2.4.2. Nitric Oxide Plus Oxygen Adsorption over γ-Fe2O3-FM

In situ DRIFTS spectra of co-adsorption of NO + O2 over the catalysts are displayed in Figure 9B. It can be seen that the bands appeared were less thermally stable. A band at 1630 cm−1 was attributed to gaseous NO2 [45]. A broad band centered at 1230 cm−1 can be linked to bridging nitrate species. The bands at 1570, 1520, and 1360 cm−1 were attributed to bidentate nitrate, monodentate nitrate, and monodentate nitrite species, respectively [46]. Additionally, their intensities were reduced with the rise in temperature and the peaks almost disappeared after 200 °C [41,45]. By taking into account these results, we can conclude that adequate NO2 ad species were formed by the oxidation of NO ad species over the γ-Fe2O3-FM catalyst, accompanied by the transformation of some species like bidentate nitrate into other species which were active in the reaction. These characteristics could be the possible reasons for the excellent NH3-SCR activity of the γ-Fe2O3-FM catalyst.

2.4.3. Ammonia Ad Species Reaction with Nitrogen Oxides

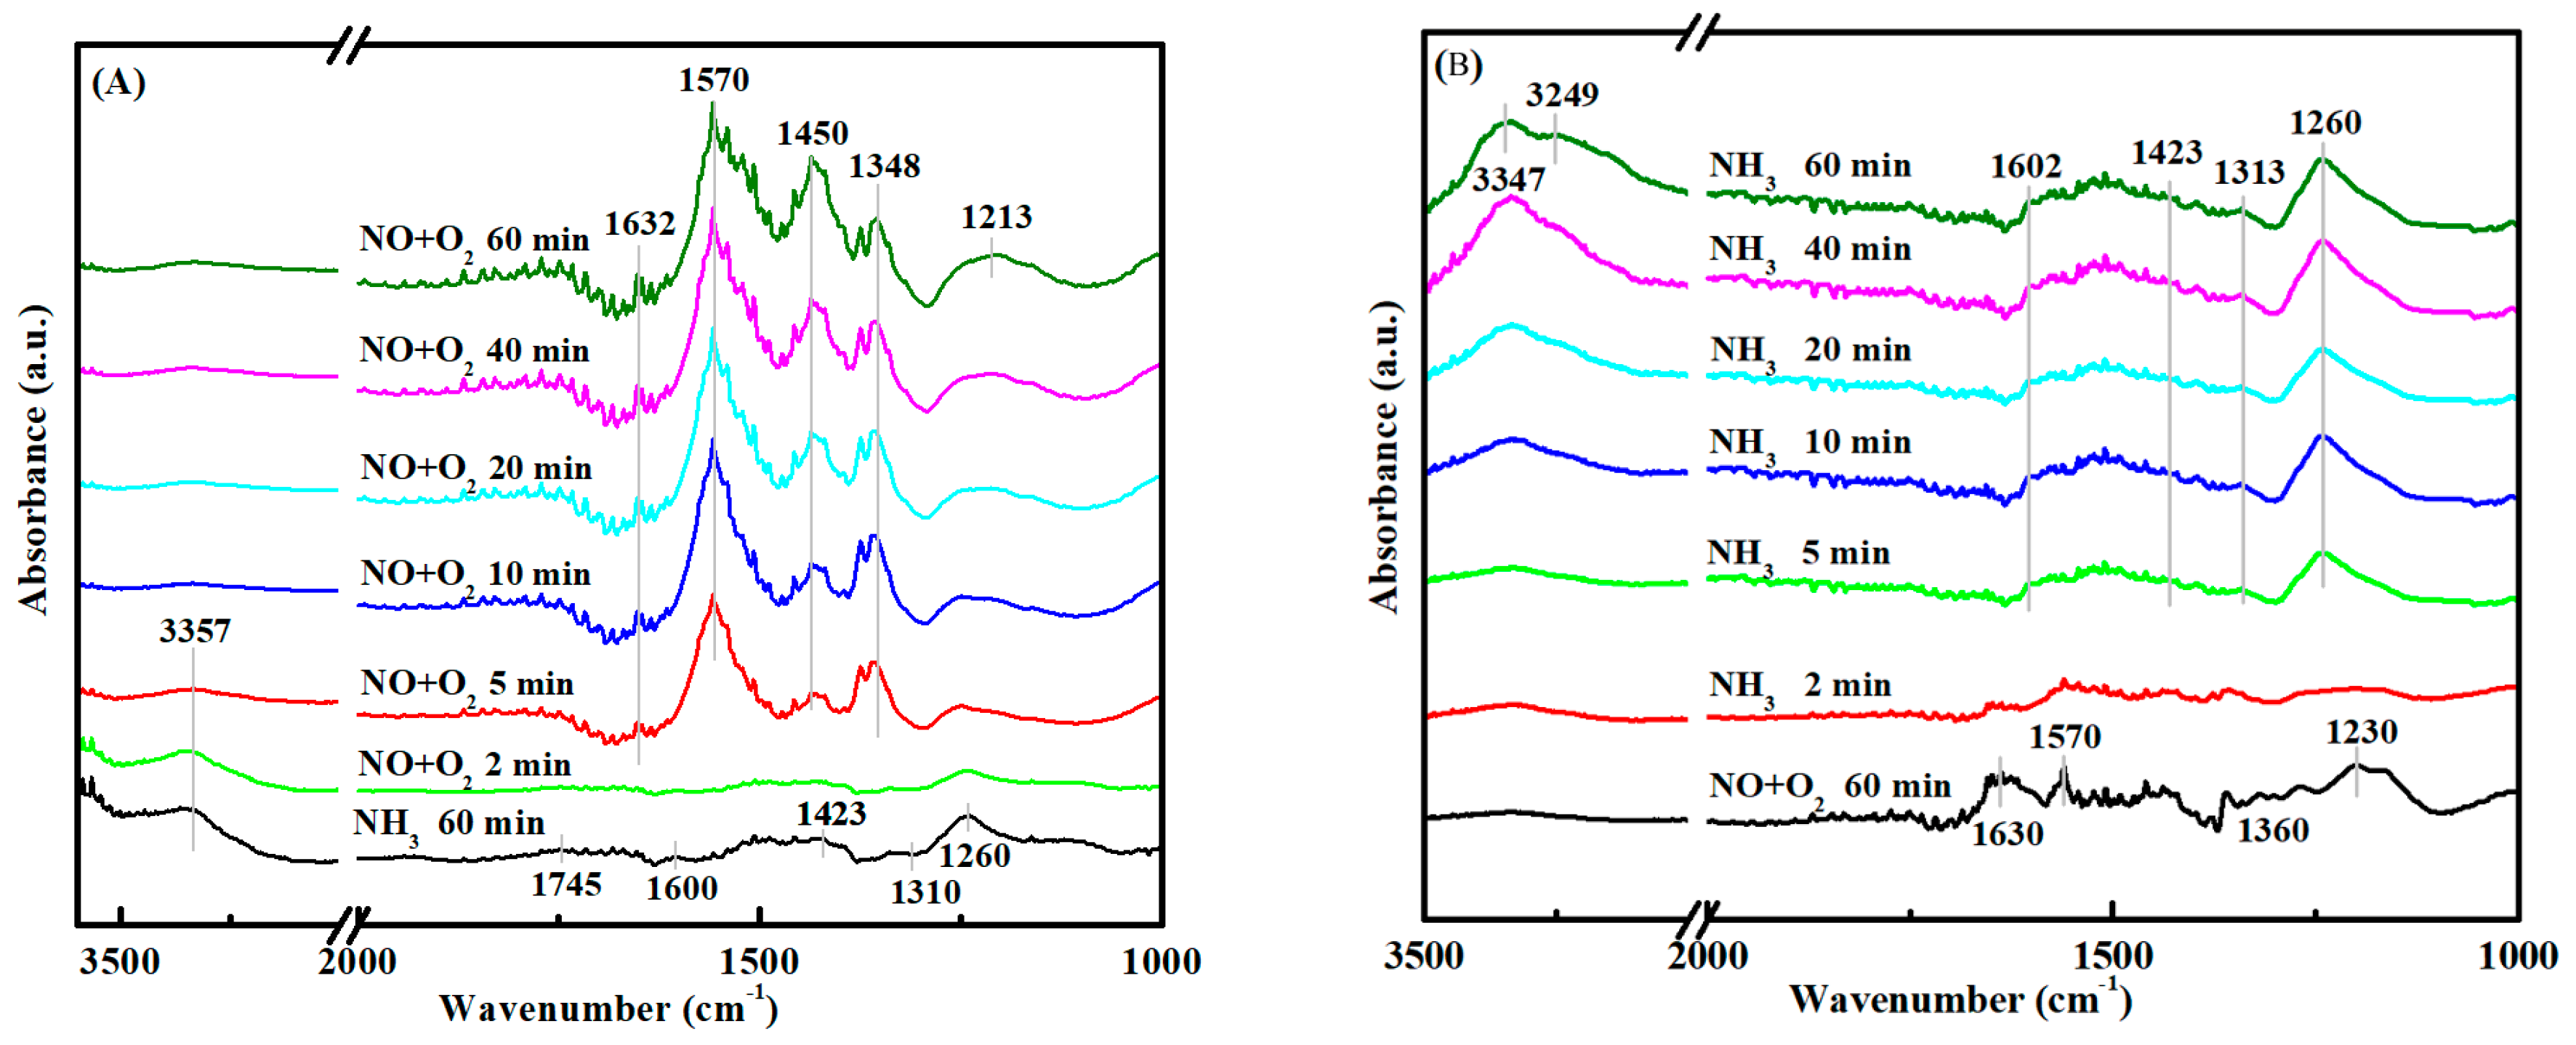
To examine the adsorbed ammonia reaction with nitrogen oxide over the γ-Fe2O3-FM catalyst, the NO + O2 flow was introduced to the ammonia pre-exposed catalysts at 200 °C and then the changes in the DRIFTS spectra were recorded with respect to time (Figure 10A). After treating the γ-Fe2O3-FM catalyst with NH3/N2 gases, a series of bands linked to Brønsted acid sites (1423, and 1260 cm−1), and Lewis acid sites (3357, 1745, 1600, 1310 cm−1) appeared in the DRIFTS spectra of the γ-Fe2O3-FM catalyst (Figure 10A) [42]. The intensities of these bands reduced quickly after passing the gases NO + O2/N2 and vanished completely after 5 min of exposure of the gases. And the bidentate nitrate species (1570 cm−1), trans-N2O22− species (1450 cm−1), gaseous NO2 (1632 cm−1), nitro species (M-NO2) (1348 cm−1), nitrite species (1213 cm−1) were formed [47]. This result implies that the NH3 ad species could react quickly with the gas phase NOx on the γ-Fe2O3-FM catalyst’s surface at 200 °C.

2.4.4. Nitrogen Oxides Ad Species Reaction with Ammonia

The transient studies were conducted to examine the adsorbed nitrogen oxide species reactivity in the NH3-SCR reaction over the γ-Fe2O3-FM catalyst (Figure 10B). It is apparent that after turning on the flow of ammonia over the catalyst peaks linked to gaseous NO2 (1630 cm−1), monodentate nitrate (1287 cm−1), M-NO2 nitro compounds (1360 cm−1) disappeared within 2 min, demonstrating that these species were active in the reaction [48]. Afterward, ionic NH4+ bound to the Brønsted acid sites (1423 cm−1) and coordinated NH3 on Lewis acid sites (3347, 1313, 1602 cm−1) formed on the catalyst’s surface.
It can be seen from the in situ DRIFTS results that both Brønsted acid and Lewis acid sites were present over the γ-Fe2O3-FM catalyst’s surface. However, a lesser amount of intermediates was found on the γ-Fe2O3-FM catalyst’s surface, indicating that the adsorbed ammonia species were steady on γ-Fe2O3–FM. In addition, unstable nitrates were present over the γ-Fe2O3-FM catalyst and more NO2 ad species were formed by the oxidation of NO ad species, which promoted the SCR reaction. The DRIFTS results exhibited that both NO and NH3 can be adsorbed on the γ-Fe2O3-FM catalyst’s surface. Adsorbed NH3 species can react with gaseous NO+O2 or/and adsorbed NOx species. Therefore, over γ-Fe2O3-FM NO reduction followed both the Eley-Rideal and Langmuir-Hinshelwood mechanisms.

3. Materials and Methods

3.1. Materials and Reagents

To prepare the γ-Fe2O3 catalysts by coprecipitation method, Iron (II) Sulfate Heptahydrate (FeSO4.7H2O) (99.5%, Sigma Aldrich) was used as a Fe precursor. In the first step, a certain amount of FeSO4.7H2O was dissolved in the deionized water to make a 0.2 M solution. The solution obtained was then stirred for 60 min at 25 °C. Next, a certain amount of precipitator was added into the solution dropwise with continuous stirring for 2–3 h by maintaining the pH of the solution around 9–10. Without aging, the resulting precipitated particles are filtered out and then washed thoroughly with the DI water. Last, the precipitate was desiccated at 105 °C for 10 h and calcined at 220 °C for 3 h in air.
To prepare the γ-Fe2O3 nanoparticles with a facile method, Dimethyl Formamide (DMF) (99.5%, Sigma Aldrich) was used as a solvent to dissolve the Iron (III) Nitrate Nonahydrate (Fe (NO3)3·9H2O) (98.5%, Sigma Aldrich) to make a 0.6 molar solution. This solution was calcined in the presence of air with a suitable heating rate for 2 h at 220 °C to obtain γ-Fe2O3 nanoparticles [49]. The schematic representation for the preparation of the γ-Fe2O3-FM by the facile one-step synthesis method is shown in Figure 11. Both the samples were crushed and sieved to 40–60 mesh size to examine their catalytic activities. DMF, as a polar aprotic solvent, aids the contact and diffusion of the reactant molecules in the way of volatilization. When the precursors are calcined at moderate temperature (200 °C in our case), a large area of γ-Fe2O3 nucleation is crystallized to the uniform nanoparticles, which can be confirmed by TEM image and XRD spectrum of γ-Fe2O3–FM. DMF is a commendable solvent in comparison to water, and DMF is associated well with the cations [50]. As a solvent, DMF could disperse the ions, and coats each ion during the calcination process [51]. Cao et al. prepared maghemite nanoparticles with both water and DMF as a solvent. He also found that under the same experimental conditions, α-Fe2O3 particles are produced with water as a solvent but it cannot generate in DMF (also could be seen in Figure 2) [49]. This illustrates that DMF may slower the reaction process of calcination, which restrains the transformation process of γ-Fe2O3 to α-Fe2O3, and this was better at promoting the NH3-SCR denitration performance sequentially.

3.2. Experimental Setup and Governing Equations

The experimental setup included a simulated flue gas system, an electrically heated test rig, a fixed-bed quartz reactor, and a flue gas analyzer system. The reactor was made of quartz glass (6mm i.d × 500 mm length). A K-type thermocouple of 2 mm diameter with an accuracy of 2.5 °C was inserted into the reactor to obtain the data of the flue gas temperature from the reactor inlet and outlet. The reaction gas consisted of 500 ppm NO, 500 ppm NH3, 3 vol% O2, 300 ppm SO2 (when used), and/or 5 vol% H2O (when used), N2 balance, the total mass flow rate of 150 mL·min−1, and with a corresponding gas hourly space velocity (GHSV) of 40,000 h−1. Water vapors were generated by passing N2 through a heated gas-wash bottle containing deionized water. Mass flow controllers (MFCs) (CS200A, CS200D, Sevenstar, Beijing, China) were used to control the flow of simulated flue gas. Due to the density difference, for the NH3-SCR activity test 0.2 g of γ-Fe2O3-FM powder, and 0.1 g of γ-Fe2O3-CP powder were used to obtain the consistent GHSV.
A flue gas analyzer (Testo 350, Lenzkirch, Germany) was used to constantly monitor the concentrations of NO, NO2, O2. To test N2 selectivity, the outlet gas compositions were detected by GC-14C with Porapak Q column (Shimadzu, Kyoto, Japan) and FT-IR spectrometer (Vertex70v, Billerica, USA) with a scanning range of 4000 to 400 cm−1, 0.15 cm−1 resolution, and an average of 32 scans for each spectrum. Using the concentration of gases at steady state, NO conversion and N2 selectivity were calculated according to the following equations.
NO   conversion   ( % ) = [ NO ] i n [ NO ] o u t [ NO ] i n × 100 %
N 2   selectivity   ( % ) = [ NO ] i n + [ NH 3 ] i n [ NO ] o u t [ NH 3 ] o u t 2 [ N 2 O ] o u t [ NO ] i n + [ NH 3 ] i n [ NO ] o u t [ NH 3 ] o u t × 100 %
where [NO]in represents the NO concentration at the inlet of the reactor (ppm) and [NO]out represents the NO concentration at the outlet of the reactor (ppm).
Both NO and NH3 oxidation tests were conducted in the same reactor. For NO oxidation, the feed gas consisted of 500 ppm NO, 3 vol% O2, and balance N2. For NH3 oxidation, the feed gas consisted of 500 ppm NH3, 3vol% O2, and balance N2. The total flow rate was 150 mL·min−1. The NO to NO2 conversion percentage was calculated using the following equation.
NO   to   NO 2 conversion   ( % ) = [ NH 3 ] o u t [ NH 3 ] i n × 100 %
The NH3 conversion percentage was calculated using the following equation.
NH 3   conversion   ( % ) = [ NH 3 ] i n [ NH 3 ] o u t [ NH 3 ] i n × 100 %
where [NH3]in and [NH3]out represent the concentration of NH3 in inlet and outlet flue gases, respectively (ppm).
With the assumption that the components of the reaction were free of limitations for diffusion, the equation used to calculate the NO oxidation rate normalized by the specific surface area of the catalyst is given as follows,
Rate   ( mmol .   m 2 .   h 1 ) = X NO QC f V m WS BET
where XNO represents the NO-to-NO2 conversion, Cf denotes the inlet concentration of NO (500 ppm), Q represents the volumetric flow rate (mL·h−1), Vm is the molar volume of gas (22.4 mL·mmol−1), SBET denotes the value of a specific area of the catalyst (m2·g−1), and W represents the weight of the catalyst (g) [43].
The Scherrer formula is
D = 0.94 × λ / ( β × C o s θ )
where D represents the average diameter of particles, λ denotes the wavelength of incident X-ray, β is the half-width of diffraction peak, and θ is the diffraction angle.

3.3. Characterization Used

X-ray powder diffraction (XRD) measurements were carried out to determine the crystalline structures of the catalysts with CuKα radiation on a D8 Advance X-ray diffractometer (Bruker, Billerica, USA). The scan rate of the diffraction pattern was 1° min−1 with a resolution of 0.02°, and the diffraction pattern was taken in a 2θ range of 10 to 90°.
An Autosorb-IQ3 (Quantachrome; Anton Paar, Austria) analyzer was used to determine the Brunauer–Emmett–Teller (BET) surface properties of the catalysts. To examine the surface characteristics of the catalysts, the samples were undergone by N2 adsorption at 77 K; next, the samples were degassed under vacuum for 12 h at 180 °C.
X-ray photoelectron spectroscopy (XPS) analysis was performed on an AXIS Ultra DLD (Shimadzu Kratos, Kyoto, Japan) X-ray photoelectron spectrometer with a spherical mirror and concentric hemispherical detector operating at constant pass energy (PE = 46.95 eV). All binding energies (BE) were referenced to the C1s line at 284.6 eV.
An AutoChem II 2920 (Micrometrics, Norcross, USA) instrument was used to conduct temperature-programmed reduction (H2-TPR) experiments. Each catalyst (100 mg) was placed in a quartz U-tube reactor to conduct the experiment. The samples were pretreated in He at 100 °C for 1 h before reduction and then cooled to a temperature of 50 °C. Then, the samples were heated from 50–700 °C with a heating rate of 5.5 °C·min−1 and were simultaneously introduced to a mixture of gases (90% Ar and 10% H2) with a flow rate of 0.03 L·min−1. A thermal conductivity detector (TCD) was used to determine the content of H2 in the effluent gas.
An AutoChem II 2920 (Micrometrics, Norcross, USA) instrument was used to conduct temperature-programmed desorption (NH3-TPD) experiments. Each catalyst (100 mg) was placed in a quartz U-tube reactor to conduct the experiment. The samples were pretreated at 100 °C in He gas atmosphere with a flow rate of 0.03 L·min−1 for 2 h. After that, the samples were cooled to a temperature of 50 °C, and at this temperature, the samples were fed with a mixture of gases (10% NH3 and 90% He) until saturation. Then, He gas was used for cleaning the samples. After this, the samples were heated to 550 °C with a heating rate of 10 °C·min−1.
The morphology of the catalysts was examined by the transmission electron microscope (TEM, Tecnai G2 spirit Biotwin with accelerating voltage of 120 kV) (FEI, Hillsboro, OR, USA), whereas scanning electron microscope (SEM) Sirion 200 (Thermo Fisher Scientific, Waltham, MA, USA) was used to obtain the energy-dispersive spectrum analysis (EDS) of the catalysts.
FTIR spectrometer (Thermo Fisher Scientific, Waltham, MA, USA) (Nicolet 6700) (with a Harrick DRIFTS cell having an MCT detector and ZnSe windows) was used to conduct in situ diffuse reflectance infrared Fourier transform spectroscopy (DRIFTS) experiments. Liquid nitrogen was used to cool the MCT detector. To simulate the real flue gas conditions, mass flow controllers (CS200A, CS200D, Sevenstar, Beijing, China) and a temperature controller were used. The first step in each experiment includes the degasification of the ground samples (placed in a ceramic crucible) with a flow of nitrogen at 300 °C for 60 min, then the background spectrum was recorded in the flow of nitrogen. Next, this background spectrum was automatically subtracted from all the final spectrums of the particular catalyst. To understand the adsorption studies of NH3 (or NO + O2), the catalysts were exposed to a flow of NH3 (or NO + O2), the catalysts were purged with N2 for 30 min, and the spectra were collected. Now, with the rise in temperature the spectra were collected at the desired temperatures, whereas in the transient studies, after exposing the pretreated catalysts to a flow of NH3 (or NO + O2) for 60 min and purging it with nitrogen for 30 min, the gas flow was switched to NO + O2 (or NH3) to achieve the changes in the DRIFTS spectra with in real-time. Feeding gases flow rate was kept at 150 mL·min−1 and the spectral resolution was 4 cm1 with collecting 100 scans for the spectra, with reaction conditions of 500 ppm NO, 500 ppm NH3, 3 vol% O2, and N2 balance.

4. Conclusions

This study compares the NH3-SCR performance of the maghemite catalysts prepared by a facile method and the conventional coprecipitation method. The resulted demonstrated that the γ-Fe2O3 nanoparticles prepared by the facile method (γ-Fe2O3-FM) not only exhibited better NH3-SCR activity and selectivity than the catalyst prepared by the coprecipitation method but also showed improved SO2 tolerance. The γ-Fe2O3-FM exhibited regular spherical particles, smaller particle diameter, larger surface area, and better pore connections. The facile method also inhibited the formation of the α-Fe2O3 in the catalyst, which positively influenced the low-temperature SCR activity and selectivity of the catalyst. In addition, a higher concentration of lattice and surface-adsorbed oxygen, good reducibility, a lot of acid sites, lower activation energy, better adsorption of the reactants, and the existence of unstable nitrates on the surface of the γ-Fe2O3-FM catalyst were responsible for the excellent NH3-SCR performance of the γ-Fe2O3-FM catalyst.

Author Contributions

Conceptualization, E.W.; methodology, N.H. and E.W.; Characterization, N.H., S.F.; and M.T.A.; investigation, N.H. and E.W.; writing—original draft preparation, N.H. and E.W.; writing—review and editing, E.W., N.H, and M.T.A.; visualization, S.F. and N.H.; supervision, E.W; funding acquisition, E.W.

Funding

This work was supported by the National Natural Science Foundation of China (grant no. 50676057).

Acknowledgments

The authors would like to thank the National Natural Science Foundation of China for the research funding.

Conflicts of Interest

The authors declare no conflicts of interest.

References

  1. Liu, F.; Asakura, K.; He, H.; Liu, Y.; Shan, W.; Shi, X. Influence of calcination temperature on iron titanate catalyst for the selective catalytic reduction of NOx with NH3. Catal. Today 2011, 164, 520–527. [Google Scholar] [CrossRef]
  2. Husnain, N.; Wang, E.; Li, K.; Anwar, M.T.; Mehmood, A.; Gul, M.; Li, D.; Jinda, M. Iron oxide-based catalysts for low-temperature selective catalytic reduction of NOx with NH3. Rev. Chem. Eng. 2019, 35, 239–264. [Google Scholar] [CrossRef]
  3. Husnain, N.; Wang, E.; Fareed, S. Low-temperature selective catalytic reduction of NO with NH3 over natural iron ore catalyst. Catalysts 2019, 9, 956. [Google Scholar] [CrossRef] [Green Version]
  4. Shen, B.; Liu, T.; Zhao, N.; Yang, X.; Deng, L. Iron-doped Mn-Ce/TiO2 catalyst for low temperature selective catalytic reduction of NO with NH3. J. Environ. Sci. 2010, 22, 1447–1454. [Google Scholar] [CrossRef]
  5. Yang, S.J.; Wang, C.Z.; Ma, L.; Peng, Y.; Qu, Z.; Yan, N.Q. Substitution of WO3 in V2O5/WO3-TiO2 by Fe2O3 for selective catalytic reduction of NO with NH3. Catal. Sci. Technol. 2013, 3, 161–168. [Google Scholar] [CrossRef]
  6. Liu, Z.; Liu, Y.; Chen, B.; Zhu, T.; Ma, L. Novel Fe-Ce-Ti catalyst with remarkable performance for the selective catalytic reduction of NOx by NH3. Catal. Sci. Technol. 2016, 6, 6688–6696. [Google Scholar] [CrossRef]
  7. Wang, X.; Gui, K. Fe2O3 particles as superior catalysts for low temperature selective catalytic reduction of NO with NH3. J. Environ. Sci. 2013, 25, 2469–2475. [Google Scholar] [CrossRef]
  8. Liu, C.; Yang, S.; Ma, L.; Peng, Y.; Hamidreza, A.; Chang, H. Comparison on the performance of α-Fe2O3 and γ-Fe2O3 for selective catalytic reduction of nitrogen oxides with ammonia. Catal. Lett. 2013, 143, 697–704. [Google Scholar] [CrossRef]
  9. Lu, C.; Li, J.; Peng, Y.; Wang, D.; Gan, L.; Ma, Y. De-reducibility mechanism of titanium on maghemite catalysts for the SCR reaction: An in situ DRIFTS and quantitative kinetics study. Appl. Catal. B Environ. 2017, 221, 556–564. [Google Scholar]
  10. Xu, H.; Ni, K.; Li, X.; Fang, G.; Fan, G. Structural transformation of Pd-α-Fe2O3 and Pd-γ-Fe2O3 catalysts and application in the CO oxidation reaction. RSC Adv. 2017, 7, 51403–51410. [Google Scholar] [CrossRef] [Green Version]
  11. Ishaq, M.; Sultan, S.; Ahmad, I.; Ullah, H.; Yaseen, M.; Amir, A. Adsorptive desulfurization of model oil using untreated, acid-activated and magnetite nanoparticle loaded bentonite as adsorbent. J. Saudi. Chem. Soc. 2017, 21, 143–151. [Google Scholar] [CrossRef] [Green Version]
  12. Lin, C.; Pehkonen, S.O. Aqueous free radial chemistry of mercury in the presence of iron oxides and ambient aerosol. Atmos. Environ. 1997, 31, 4125–4137. [Google Scholar] [CrossRef]
  13. Stevin, M.; Wagner, M.; Schmid, M.; Parkinson, G.S.; Diebodd, U. Surface point defects on bulk oxides: Atomically-resolved scanning probe microscopy. Chem. Soc. Rev. 2017, 46, 1772–1784. [Google Scholar] [CrossRef] [PubMed] [Green Version]
  14. Shi, X.; Liu, F.; Xie, L.; Shan, W.; He, H. NH3-SCR performance of fresh and hydrothermally aged Fe-ZSM-5 in standard and fast selective catalytic reduction reactions. Environ. Sci. Technol. 2013, 47, 3293–3298. [Google Scholar] [CrossRef]
  15. Chen, Z.; Wang, F.; Li, H.; Yang, Q.; Wang, L.; Li, X. Low-Temperature selective catalytic reduction of NOx with NH3 over Fe–Mn mixed-oxide catalysts containing Fe3Mn3O8 phase. Ind. Eng. Chem. Res. 2011, 51, 202–212. [Google Scholar] [CrossRef]
  16. Wang, D.; Yang, Q.; Li, X.; Peng, Y.; Li, B.; Si, W. Preparation of γ-Fe2O3 catalysts and their deNOx performance: Effects of precipitation conditions. Chem. Eng. Technol. 2018, 41, 1019–1026. [Google Scholar] [CrossRef]
  17. Vidal-Vidal, J.; Rivas, J.; López-Quintela, M.A. Synthesis of monodisperse maghemite nanoparticles by the microemulsion method. Colloids Surf. A Physicochem. Eng. Asp. 2006, 288, 44–51. [Google Scholar] [CrossRef]
  18. Zare, N.; Zabardasti, A.; Mohammadi, A.; Azarbani, F. Synthesis of spherical Fe3O4 nanoparticles from the thermal decomposition of iron (III) nano-structure complex: DFT studies and evaluation of the biological activity. Bioorg. Chem. 2018, 80, 334–346. [Google Scholar] [CrossRef]
  19. Aliahmad, M.; Nasiri, M.N. Synthesis of maghemite (γ-Fe2O3) nanoparticles by thermal-decomposition of magnetite (Fe3O4) nanoparticles. Mater. Sci. Pol. 2013, 31, 264–268. [Google Scholar] [CrossRef]
  20. Al-Gaashani, R.; Radiman, S.; Tabet, N.; Daud, A.R. Rapid synthesis and optical properties of hematite (α-Fe2O3) nanostructures using a simple thermal decomposition method. J. Alloys. Compd. 2013, 550, 395–401. [Google Scholar] [CrossRef]
  21. Ismail, A.A. Synthesis and characterization of Y2O3/Fe2O3/TiO2 nanoparticles by sol-gel method. Appl. Catal. B Environ. 2005, 58, 115–121. [Google Scholar] [CrossRef]
  22. Alagiri, M.; Hamid, S.B.A. Sol-gel synthesis of α-Fe2O3 nanoparticles and its photocatalytic application. J. Sol.-Gel. Sci. Technol. 2015, 74, 783–789. [Google Scholar] [CrossRef]
  23. Reda, S.M. Synthesis of ZnO and Fe2O3 nanoparticles by sol-gel method and their application in dye-sensitized solar cells. Mater. Sci. Semicond. Process. 2010, 13, 417–425. [Google Scholar] [CrossRef]
  24. Lassoued, A.; Dkhil, B.; Gadri, A.; Ammar, S. Control of the shape and size of iron oxide (α-Fe2O3) nanoparticles synthesized through the chemical precipitation method. Results. Phys. 2017, 7, 3007–3015. [Google Scholar] [CrossRef]
  25. Khodadadi-Moghaddam, M.; Salimi, F.; Sahebalzamani, H.; Jafari, N. Synthesis of Fe2O3 nanoparticles via various methods and coating with silica for drug immobilization. Synth. React. Inorg. Met. Nano-Metal. Chem. 2013, 43, 1224–1227. [Google Scholar] [CrossRef]
  26. Zhang, G.; Huang, X.; Tang, Z. Enhancing Water resistance of a Mn-based catalyst for low temperature selective catalytic reduction reaction by modifying super hydrophobic layers. ACS Appl. Mater. Interfaces 2019, 11, 36598–36606. [Google Scholar] [CrossRef]
  27. Duan, Z.; Chi, K.; Liu, J.; Shi, J.; Zhao, Z.; Wei, Y. The catalytic performances and reaction mechanism of nanoparticle Cd/Ce-Ti oxide catalysts for NH3-SCR reaction. RSC Adv. 2017, 7, 50127–50134. [Google Scholar] [CrossRef] [Green Version]
  28. Jiang, M.; Wang, J.; Wang, J.; Shen, M. The influence of Si/Al ratios on adsorption and desorption characterizations of Pd/Beta served as cold-start catalysts. Materials 2019, 12, 1045. [Google Scholar] [CrossRef] [Green Version]
  29. Li, Y.; Wan, Y.; Li, Y.; Zhan, S.; Guan, Q.; Tian, Y. Low-temperature selective catalytic reduction of NO with NH3 over Mn2O3-doped Fe2O3 hexagonal microsheets. ACS Appl. Mater. Interfaces 2016, 8, 5224–5233. [Google Scholar] [CrossRef]
  30. Shan, H.; Liu, C.; Liu, L.; Zhang, J.; Li, H.; Liu, Z. Excellent toluene sensing properties of SnO2-Fe2O3 interconnected nanotubes. ACS Appl. Mater. Interfaces 2013, 5, 6376–6380. [Google Scholar] [CrossRef]
  31. Ning, R.; Chen, L.; Li, E.; Liu, X.; Zhu, T. Applicability of V2O5-WO3/TiO2 catalysts for the SCR denitrification of alumina calcining flue gas. Catalysts 2019, 9, 220. [Google Scholar] [CrossRef] [Green Version]
  32. Wu, Z.; Jin, R.; Liu, Y.; Wang, H. Ceria modified MnOx/TiO2 as a superior catalyst for NO reduction with NH3 at low-temperature. Catal. Commun. 2008, 9, 2217–2220. [Google Scholar] [CrossRef]
  33. Yu, J.; Si, Z.; Chen, L.; Wu, X.; Weng, D. Selective catalytic reduction of NOx by ammonia over phosphate-containing Ce0.75Zr0.25O2 solids. Appl. Catal. B Environ. 2015, 163, 223–232. [Google Scholar] [CrossRef]
  34. Xu, L.; Yang, Q.; Hu, L.; Wang, D.; Peng, Y.; Shao, Z.; Lu, C.; Li, J. Insights over titanium modified FeMgOx catalysts for selective catalytic reduction of NOx with NH3: Influence of precursors and crystalline structures. Catalysts 2019, 9, 560. [Google Scholar] [CrossRef] [Green Version]
  35. Li, Q.; Yang, H.; Ma, Z.; Zhang, X. Selective catalytic reduction of NO with NH3 over CuOx-carbonaceous materials. Catal. Commun. 2012, 17, 8–12. [Google Scholar] [CrossRef]
  36. Xie, G.; Liu, Z.; Zhu, Z.; Liu, Q.; Ge, J.; Huang, Z. Simultaneous removal of SO2 and NOx from flue gas using a CuO/Al2O3 catalyst sorbent: II. Promotion of SCR activity by SO2 at high temperatures. J. Catal. 2004, 224, 42–49. [Google Scholar] [CrossRef]
  37. Roy, S.; Viswanath, B.; Hegde, M.S.; Madras, G. Low-temperature selective catalytic reduction of NO with NH3 over Ti0.9M0.1O2−δ (M = Cr, Cr, Mn, Fe, Co, Cu). J. Phys. Chem. C 2008, 112, 6002–6012. [Google Scholar] [CrossRef]
  38. Wu, Z.; Jiang, B.; Liu, Y.; Zhao, W.; Guan, B. Experimental study on a low-temperature SCR catalyst based on MnOx/TiO2 prepared by sol-gel method. J. Hazard. Mater. 2007, 145, 488–494. [Google Scholar] [CrossRef]
  39. Madia, G.; Koebel, M.; Elsener, M.; Wokaun, A. The effect of an oxidation precatalyst on the NOx reduction by ammonia SCR. Ind. Eng. Chem. Res. 2002, 41, 3512–3517. [Google Scholar] [CrossRef]
  40. Koebel, M.; Madia, G.; Elsener, M. Selective catalytic reduction of NO and NO2 at low temperatures. Catal. Today 2002, 73, 239–247. [Google Scholar] [CrossRef]
  41. Madia, G.; Koebel, M.; Elsener, M.; Wokaun, A. Side reactions in the selective catalytic reduction of NOx with various NO2 fractions. Ind. Eng. Chem. Res. 2002, 41, 4008–4015. [Google Scholar] [CrossRef]
  42. Liu, F.; He, H.; Ding, Y.; Zhang, C. Effect of manganese substitution on the structure and activity of iron titanate catalyst for the selective catalytic reduction of NO with NH3. Appl. Catal. B Environ. 2009, 93, 194–204. [Google Scholar] [CrossRef]
  43. Cai, S.; Shi, L.; Huang, L.; Zhang, D.; Hu, H.; Li, H. Mechanistic aspects of deNOx processing over TiO2 supported Co–Mn oxide catalysts: Structure–activity relationships and In Situ DRIFTs analysis. ACS Catal. 2015, 5, 6069–6077. [Google Scholar]
  44. Cai, S.; Zhang, D.; Shi, L.; Li, H.; Huang, L.; Hu, H. In Situ DRIFTs investigation of the low-temperature reaction mechanism over Mn-doped Co3O4 for the selective catalytic reduction of NOx with NH3. J. Phys. Chem. C. 2015, 119, 22924–22933. [Google Scholar]
  45. Kijlstra, W.S.; Brands, D.S.; Poels, E.K.; Bliek, A. Mechanism of the selective catalytic reduction of NO by NH3 over MnOx/Al2O3. J. Catal. 1997, 218, 208–218. [Google Scholar] [CrossRef]
  46. Gu, T.; Liu, Y.; Weng, X.; Wang, H.; Wu, Z. The enhanced performance of ceria with surface sulfation for selective catalytic reduction of NO by NH3. Catal. Commun. 2010, 12, 310–313. [Google Scholar] [CrossRef]
  47. Cataluna, R.; Arcoya, A.; Martínez-Arias, A.; Conesa, J.C.; Seoane, X.L.; Soria, J. NO reaction at surface oxygen vacancies generated in cerium oxide. J. Chem. Soc. Farad. Trans. 2004, 91, 1679–1687. [Google Scholar]
  48. Underwood, G.M.; Miller, T.M.; Grassian, V.H. Transmission FT-IR and knudsen cell study of the heterogeneous reactivity of gaseous nitrogen dioxide on mineral oxide particles. J. Phys. Chem. A 1999, 103, 6184–6190. [Google Scholar] [CrossRef]
  49. Cao, D.; Li, H.; Pan, L.; Li, J.; Wang, X.; Jing, P. High saturation magnetization of γ-Fe2O3 nano-particles by a facile one-step synthesis approach. Sci. Rep. 2016, 6, 1–9. [Google Scholar] [CrossRef] [Green Version]
  50. Santos, P.; Marzan, L.M. N, N-Diamethylformamide as a reaction medium for metal nanoparticle synthesis. Adv. Funct. Mater. 2009, 19, 679–688. [Google Scholar] [CrossRef]
  51. Muzart, J. N, N-Diamethylformamide: Much more than a solvent. Tetrahedron 2009, 65, 8313–8323. [Google Scholar] [CrossRef]
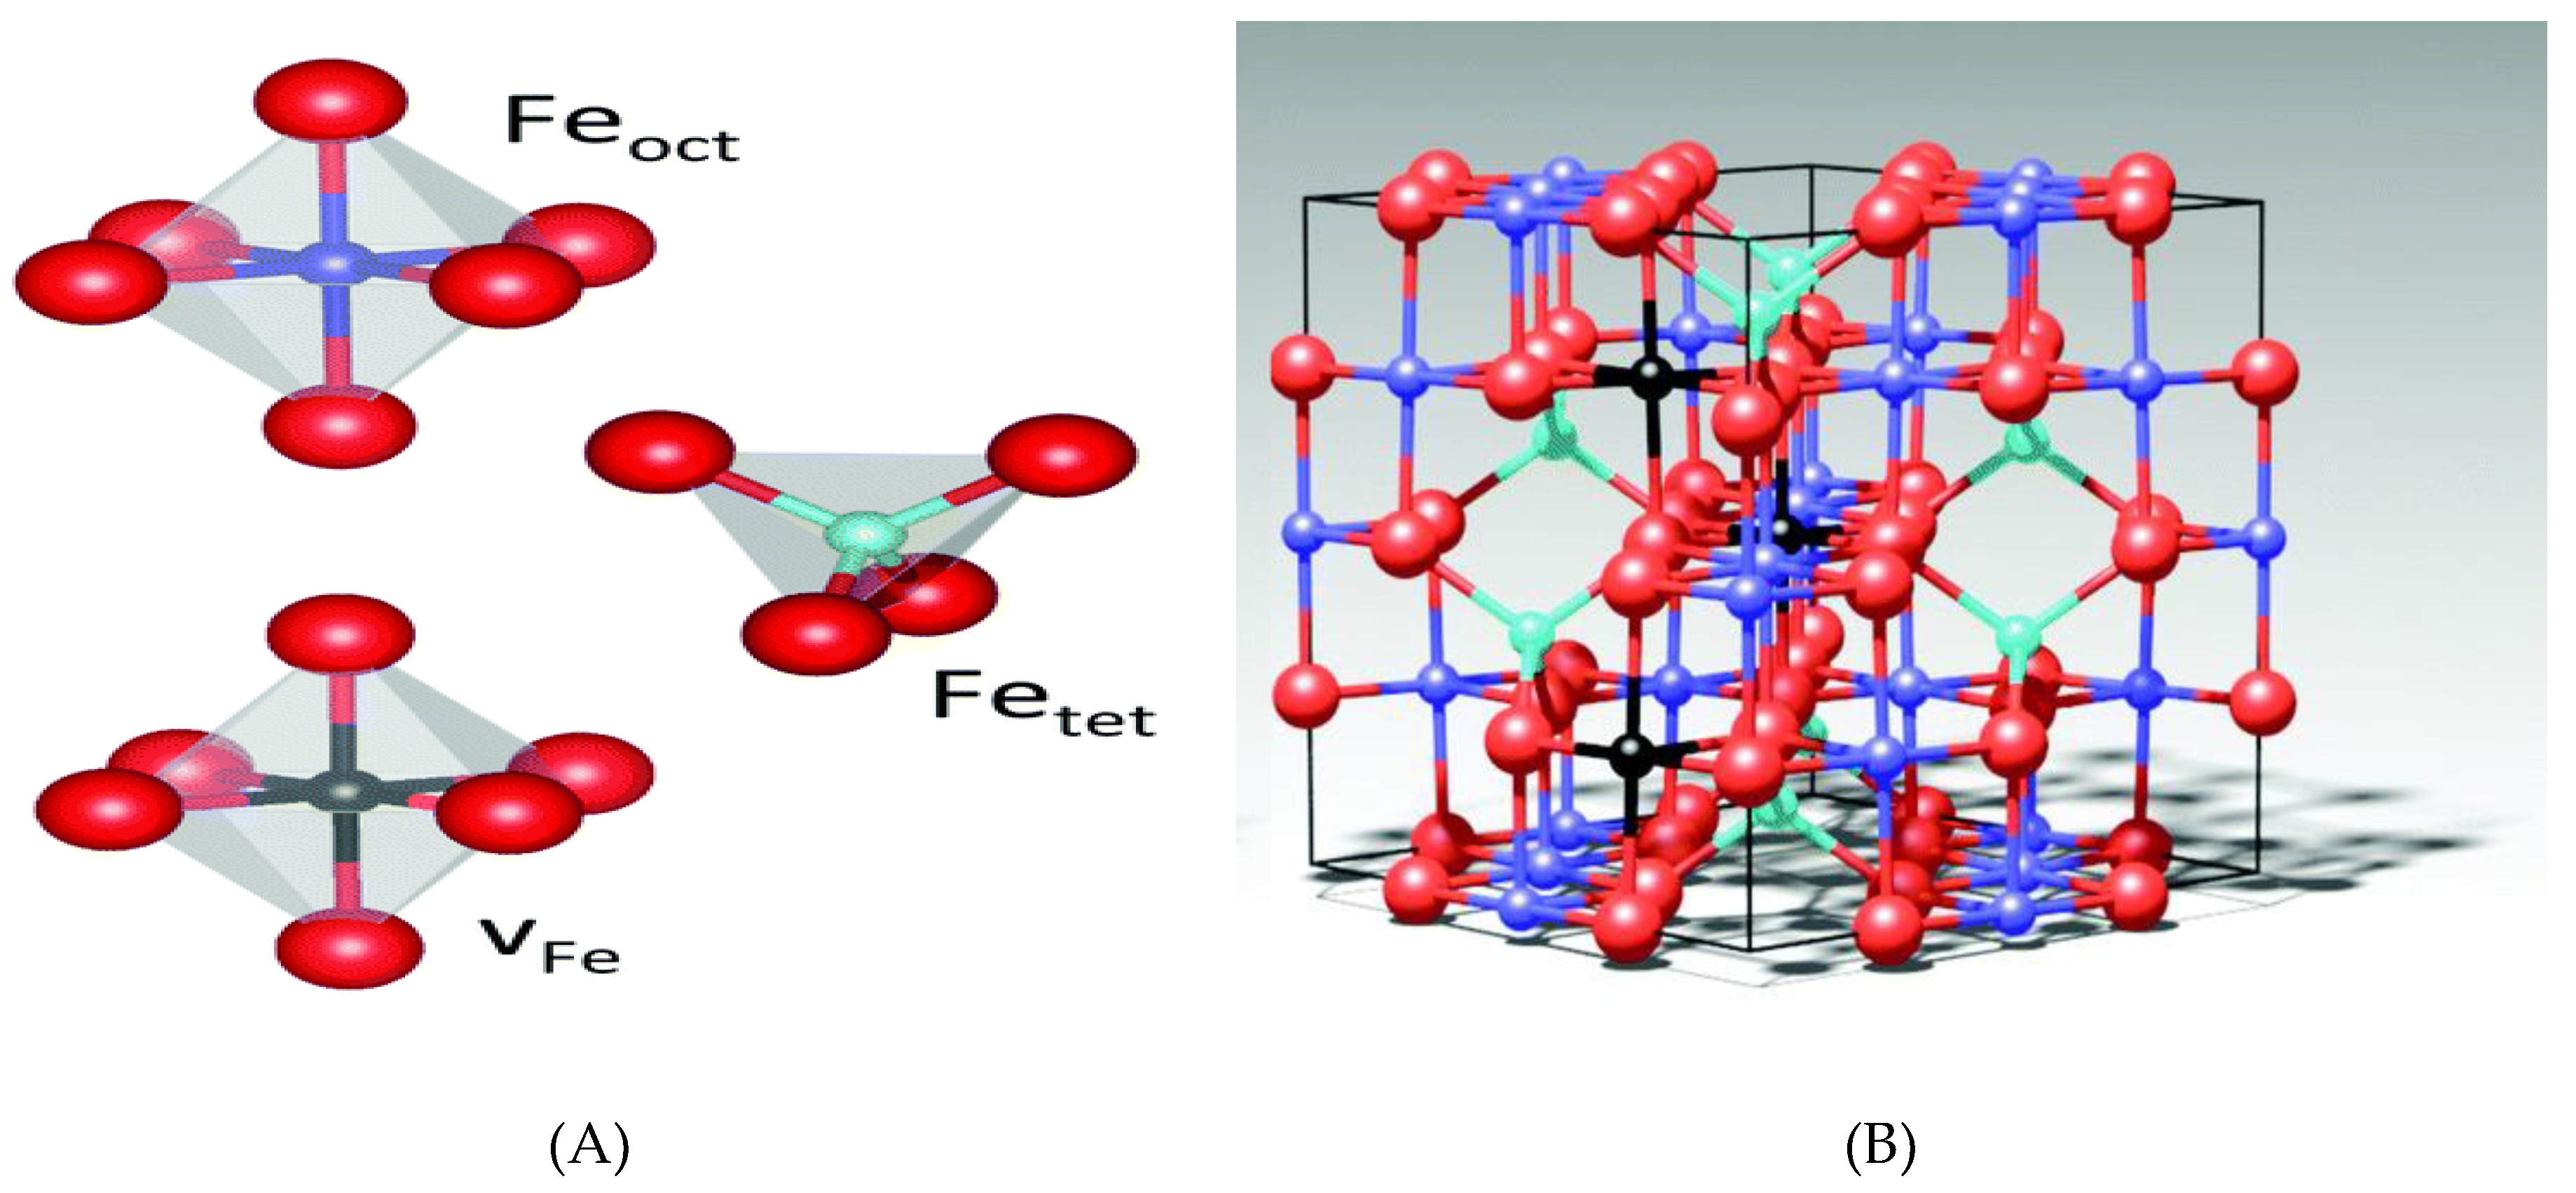
Figure 1. Structure of γ-Fe2O3 (A) octahedral (Feoct) and tetrahedral (Fetet) interstitial sites along with octahedral vacancies; (B) spinel structure of γ-Fe2O3 with randomly distributed Feoct vacancies [13].
Catalysts 09 01018 g001
Figure 2. XRD spectra of the γ-Fe2O3 catalysts.
Catalysts 09 01018 g002
Figure 3. γ-Fe2O3 catalyst (A) N2 adsorption–desorption; (B) distribution of pore size.
Catalysts 09 01018 g003
Figure 4. XPS spectra of (A) Fe 2p and (B) O 1s.
Catalysts 09 01018 g004
Figure 5. (A) H2-TPR. (B) NH3-TPD of the catalysts.
Catalysts 09 01018 g005
Figure 6. TEM images (AC) γ-Fe2O3–FM. (FH) γ-Fe2O3-CP. (D) SAED. (E) HRTEM image. (I) EDX. (J) Grain size distribution of γ-Fe2O3-FM nanoparticles.
Catalysts 09 01018 g006
Figure 7. (A) Comparison of the NO conversion of the catalysts. (B) N2 selectivity of the catalysts. (C) Influence of H2O and SO2 on SCR activity of the catalysts at 230 °C. (D) Arrhenius plots of NO oxidation rates. Reaction conditions of used experiments: 500 ppm NO, 500 ppm NH3, 3 vol% O2, N2 balance, 300 ppm SO2 (when used), and/or 5 vol% H2O (when used), total flow rate 150 mL·min−1, and GHSV = 40,000 h−1. Reaction conditions of Dong et al.: 1000 ppm NO, 1000 ppm NH3, 3 vol% O2, N2 balance, and GHSV = 30,000 h−1 [16].
Catalysts 09 01018 g007
Figure 8. (A) NO oxidation activity. (B) NH3 oxidation activity. Reaction conditions: 500 ppm NO or 500 ppm NH3, 3 vol% O2, N2 balance, total flow rate 150 mL·min−1, and GHSV = 40,000 h−1.
Catalysts 09 01018 g008
Figure 9. In situ diffuse reflectance infrared Fourier transform spectroscopy (DRIFTS) spectra of (A) NH3 adsorption. (B) NO + O2 adsorptions over γ-Fe2O3-FM.
Catalysts 09 01018 g009
Figure 10. In situ DRIFTS (A) in a flow of NO + O2 on adsorbed ammonia species and (B) a flow of ammonia on adsorbed NO + O2 species at 200 °C over γ-Fe2O3-FM.
Catalysts 09 01018 g010
Figure 11. Schematic for the preparation of γ-Fe2O3-FM by facile one-step synthesis method.
Catalysts 09 01018 g011
Table 1. Textural parameters of the catalysts.
SamplesSBET (m2·g−1) aPore Volume (cm3·g−1) bPore Diameter (nm) cParticle Size (nm)
γ-Fe2O3-FM194.910.2715.41910.30
γ-Fe2O3-CP56.40.19512.7284.8
γ-Fe2O3-MACP [16]29.40.1317.192.6
a BET surface area. b BJH desorption pore volume. c BJH desorption pore diameter.
Table 2. The EDS analysis of the catalysts.
SamplePercentage by Atomicity (at%)Percentage by Weight (wt%)O/Fe
FeOCCuFeOCCuAtomicity RatioWeight Ratio
γ-Fe2O3-FM32.8961.501.381.2161.1532.760.552.571.860.53
γ-Fe2O3-CP39.7957.681.390.8466.6927.560.522.561.450.42