Article

Enhanced Photocatalytic Activity of Electrospun β-Ga2O3 Nanofibers via In-Situ Si Doping Using Tetraethyl Orthosilicate

1
Department of Materials Engineering, Korea Aerospace University, Goyang 10540, Korea
2
School of Electrical Engineering, Korea Advanced Institute of Science and Technology (KAIST), Daejeon 34141, Korea
*
Author to whom correspondence should be addressed.
Catalysts 2019, 9(12), 1005; https://doi.org/10.3390/catal9121005
Submission received: 17 October 2019 / Revised: 26 November 2019 / Accepted: 26 November 2019 / Published: 30 November 2019
(This article belongs to the Special Issue Nanomaterials in Catalysis Applications)

Abstract

:
β-Ga2O3 has attracted considerable attention as an alternative photocatalyst to replace conventional TiO2 under ultraviolet-C irradiation due to its high reduction and oxidation potential. In this study, to enhance the photocatalytic activity of β-Ga2O3, nanofibers are formed via the electrospinning method, and Si atoms are subsequently doped. As the Si concentration in the β-Ga2O3 nanofiber increases, the optical bandgap of the β-Ga2O3 nanofibers continuously decreases from 4.5 eV (intrinsic) to 4.0 eV for the Si-doped (2.4 at. %) β-Ga2O3 nanofibers, and accordingly, the photocatalytic activity of the β-Ga2O3 nanofibers is enhanced. This higher photocatalytic performance with Si doping is attributed to the increased doping-induced carriers in the conduction band edges. This differs from the traditional mechanism in which the doping-induced defect sites in the bandgap enhance separation and inhibit the recombination of photon-generated carriers.

1. Introduction

TiO2, as well as ZnO nanoparticles, have been investigated as excellent photocatalytic materials in both public and scientific areas due to their relatively high oxidation potential, chemical stability, and nontoxicity [1,2,3]. Although the photocatalytic efficiency of ZnO is inferior to that of TiO2, it has wider applications than TiO2 [3]. Recently, attention has increased in Ga2O3 (Eg = ~4.9 eV), which possesses a much higher energy band gap compared to TiO2 (~3.3 eV) and ZnO (~3.3 eV) [4,5,6,7,8]. A higher energy bandgap is beneficial to obtain a high overpotential value, which often determines the kinetics of photocatalysts for a hydrogen evolution reaction (HER) and oxygen evolution reaction (OER) [4,5,6,7,8]. It has also been reported that Ga2O3 degrades gaseous benzene, liquid phase rhodamine B, methyl blue (MB), and even perfluorooctanoic/salicylic acid [4,6,7]. The electronic band structure of β-Ga2O3 exhibits almost direct bandgap behavior [8], which is beneficial to the efficient photocatalytic activity of Ga2O3. In fact, one study reported that the photocatalytic activity of Ga2O3 outperformed that of conventional TiO2 under ultraviolent-C (UVC) irradiation, which was, in part, attributed to the higher energy bandgap value of Ga2O3 (~4.7 eV) over that of TiO2 (~3.3 eV) [9]. Though Ga2O3 semiconductors have been studied for more than a half-century, they have recently gained substantial attention for next-generation power electronics [8]. This implies that the fundamental understanding of Ga2O3 could be enhanced, which would expedite the development of a Ga2O3-based photocatalyst. It is well known that photocatalytic efficiency can be enhanced by increasing the surface area of a photocatalyst [10]. The formation of nanostructures such as nanoparticles, nanorods, and nanoflakes, rather than thin film, is a simple and effective approach to increasing surface area and thus photocatalytic performance [10]. The photocatalytic properties of nanostructures are further associated with shape (crystalline faces), defects, and doping [11]. For the present work, β-Ga2O3 nanofibers were formed via the electrospinning method, and their photocatalytic properties were evaluated by degrading the MB. To further enhance the photocatalytic properties, Si atoms were simultaneously doped in the β-Ga2O3 nanofibers during the electrospinning process. The doped ions generated a defect level, resulting in additional energy levels within the energy bandgap. Generally, these defects often serve as electron and/or hole trap sites leading to effective electron-hole separation and the inhibition of electron-hole recombination, allowing more carriers to diffuse in the surface (extending the lifetime of carriers) and increasing the reaction probability. Aside from the defect generation, more photo-induced electrons were populated in the conduction band edge due to the bandgap narrowing effect as the Si concentration increased in the β-Ga2O3 nanofibers. The increased electron density was able to enhance the photocatalytic activity of the β-Ga2O3 nanofibers. Scanning electron microscopy (SEM), X-ray diffraction (XRD), photoluminescence (PL) spectroscopy, and ultraviolet-visible (UV-Vis) diffuse reflectance spectroscopy were utilized at room temperature to correlate the structural, optical, and photocatalytic properties of the intrinsic Ga2O3 with those of the Si-doped Ga2O3.

2. Results and Discussion

Figure 1 exhibits typical SEM images of the Ga2O3 nanofibers with different Si concentrations. The electrospinning process used to form the Ga2O3 nanofibers was optimized to create continuous nanofibers that were able to maintain themselves regardless of the Si concentration (0~2.4 at. %). The average diameter of the intrinsic Ga2O3 nanofibers was about 90 nm, and the diameter increased to 110 and 190 nm for the nanofibers with Si concentrations of Si 0.6 at. % and Si 2.6 at. %, respectively. These increases were attributed to the higher solution viscosity caused by adding the TEOS. In a previous study, chain entanglement in a polymer solution was reinforced but chain mobility degraded as the viscosity in the solution increased, which resulted in less extension during the electrospinning process, thereby producing a thicker fiber [12,13]. The intrinsic Ga2O3 nanofibers exhibited a porosity microstructure, as shown in Figure 1a. The formation of a porous surface was inevitable due to the decomposition of polyvinylpyrrolidone (PVP) during the heat treatment in the electrospinning method [14,15]. The surface roughness of the Ga2O3 nanofiber became smoother with the Si concentration, and the dopants in the oxide nanostructure reconstructed the surface defects, thereby improving the surface characteristics [16]. The surface area of the Ga2O3 nanofibers was 2.67 m2/g, and the value of the Ga2O3 nanofibers with Si 0.6 at. % decreased to as little as 1.46 m2/g. This decrease of the surface area with dopants matched the observations using SEM. However, the surface area of the Ga2O3 nanofibers with Si 2.4 at. % increased to as high as 7.07 m2/g. This sudden increase was presumably attributed to the formation of a snowflake surface, as shown in Figure 1c (the detailed surface area results are presented in Figure 3b). Elemental mappings (inset in Figure 1) extracted from EDS measurements showed a spatial distribution of the compositional elements (Ga, O, and Si), revealing that the Si atoms were uniformly distributed on the Ga2O3 nanofibers.
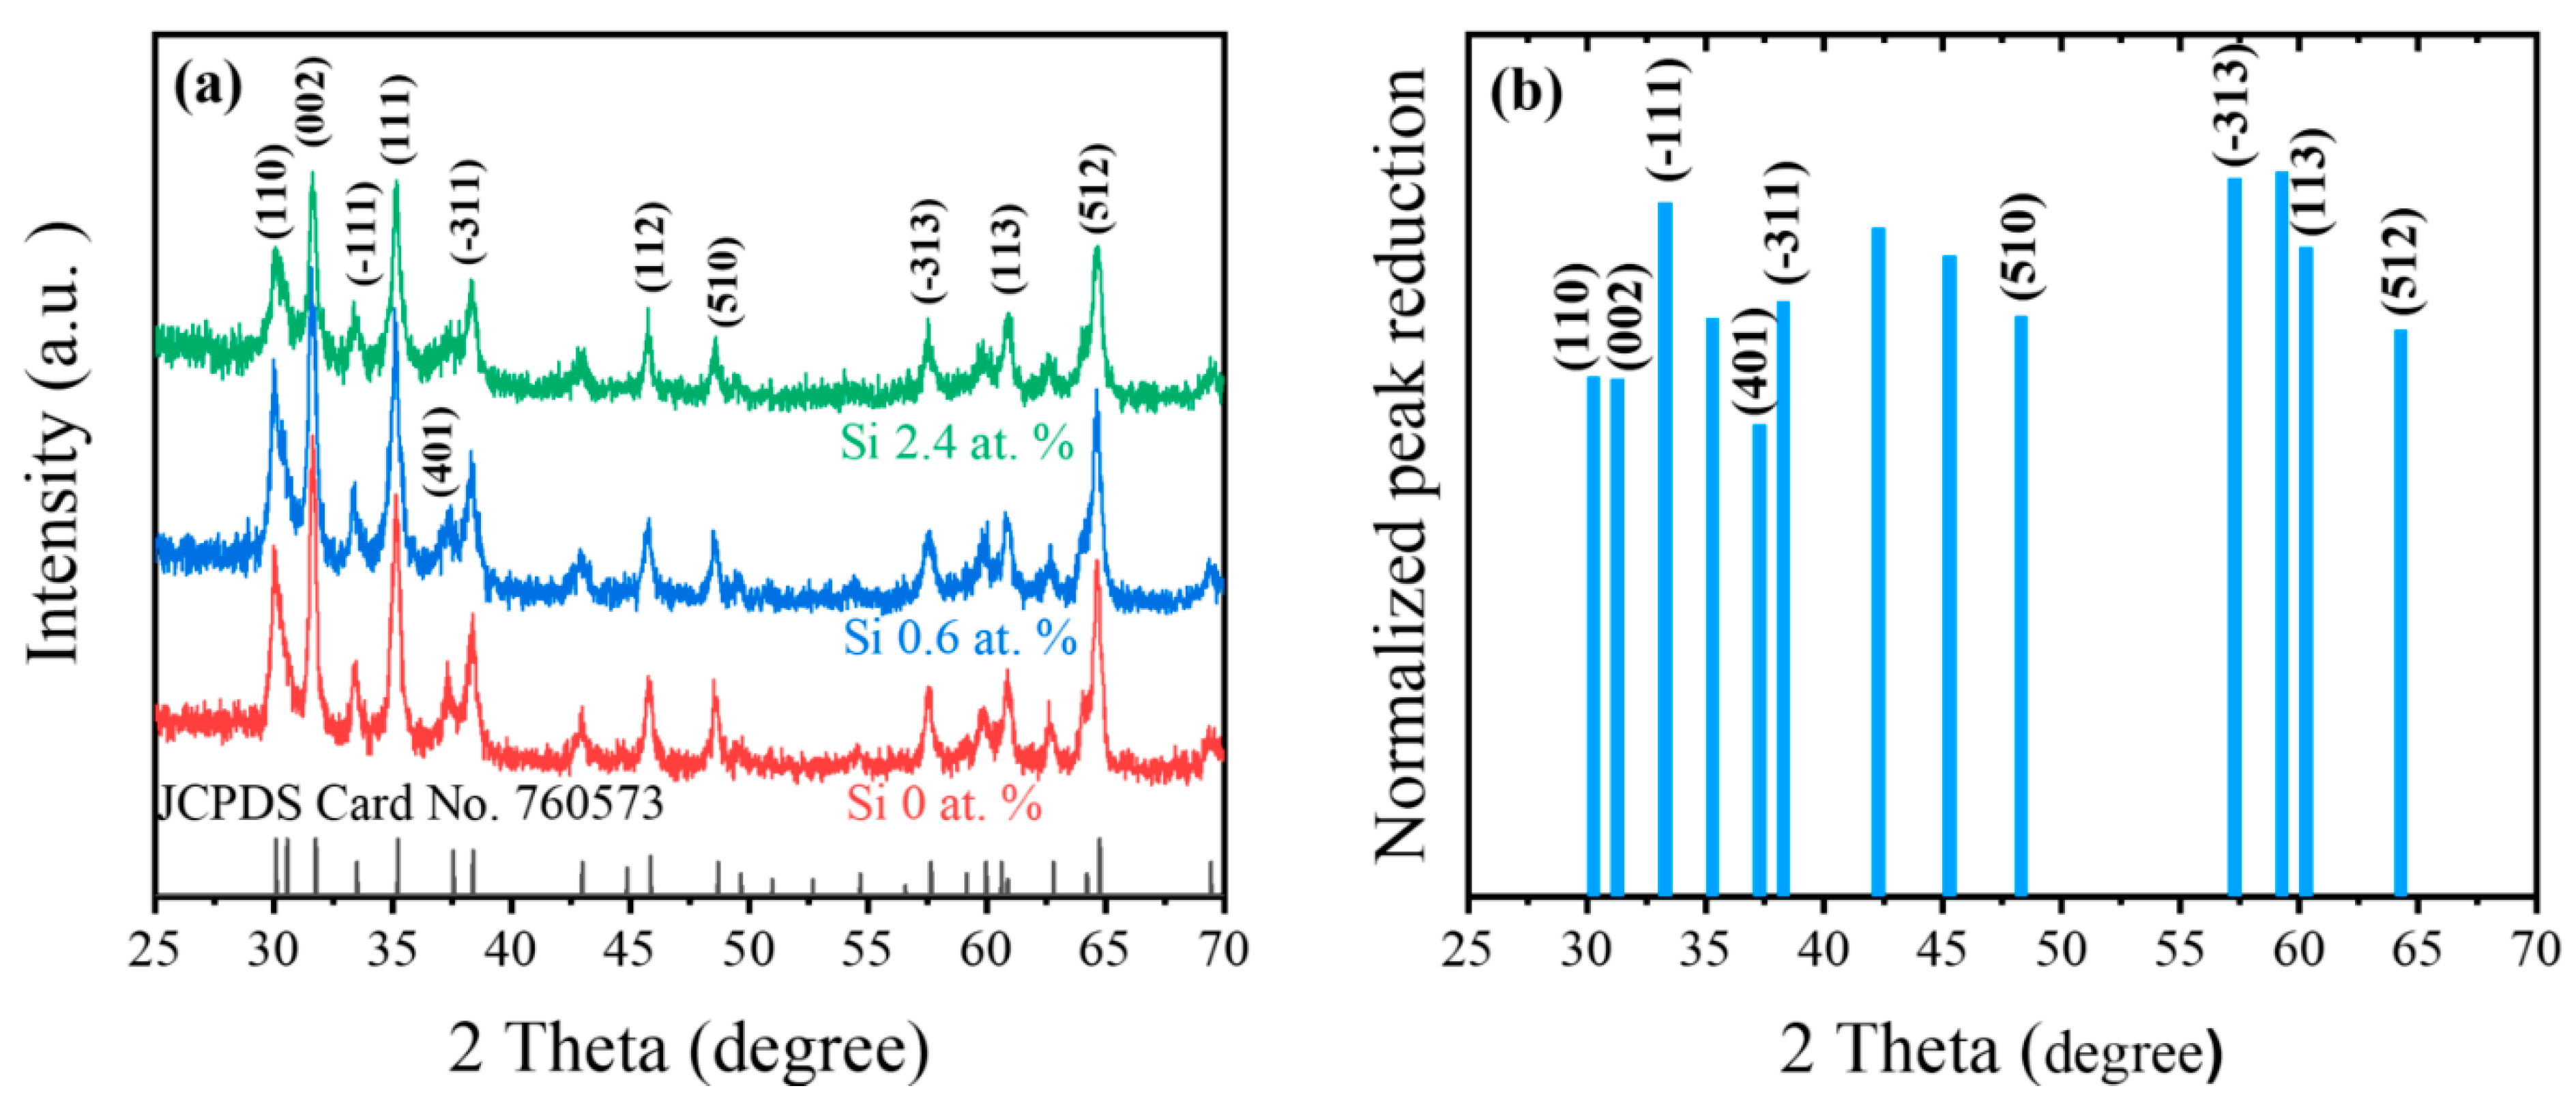
The XRD analysis of the Ga2O3 nanofibers with different Si concentrations is compared in Figure 2a and supplementary information (Figure S1). The polycrystalline structure of the Ga2O3 nanofibers corresponded to the monoclinic β-Ga2O3 phase regardless of the Si concentration according to JCPDS (760573). It was found that particular peaks dropped dramatically while some peaks only decreased a little as the Si concentration in the β-Ga2O3 increased; a further investigation on plane dependence according to the dopant introduced would be worthwhile to better understand the Ga atom replacement with Si dopants. The reduction in the normalized peak intensity of the β-Ga2O3 nanofibers with Si doping was further quantified, as shown in Figure 2b. The suppression of a particular β-Ga2O3 peak (110) caused by adding Si atoms was also observed in the Sn-doped β-Ga2O3 [17]. This indicated that like the Sn-doped β-Ga2O3, the Si-dopants substitutionally incorporated Ga atoms in an octahedral site [18]. It was also found that as the Si concentrations increased, the full width at half maximum (FWHM) of the peaks increased, which was attributed to the decrease in the average grain size and/or increase of structural disorder. It was noted that as the stacking fault density increased, the probability for nucleation sites increased, and eventually, the grain size decreased [19].
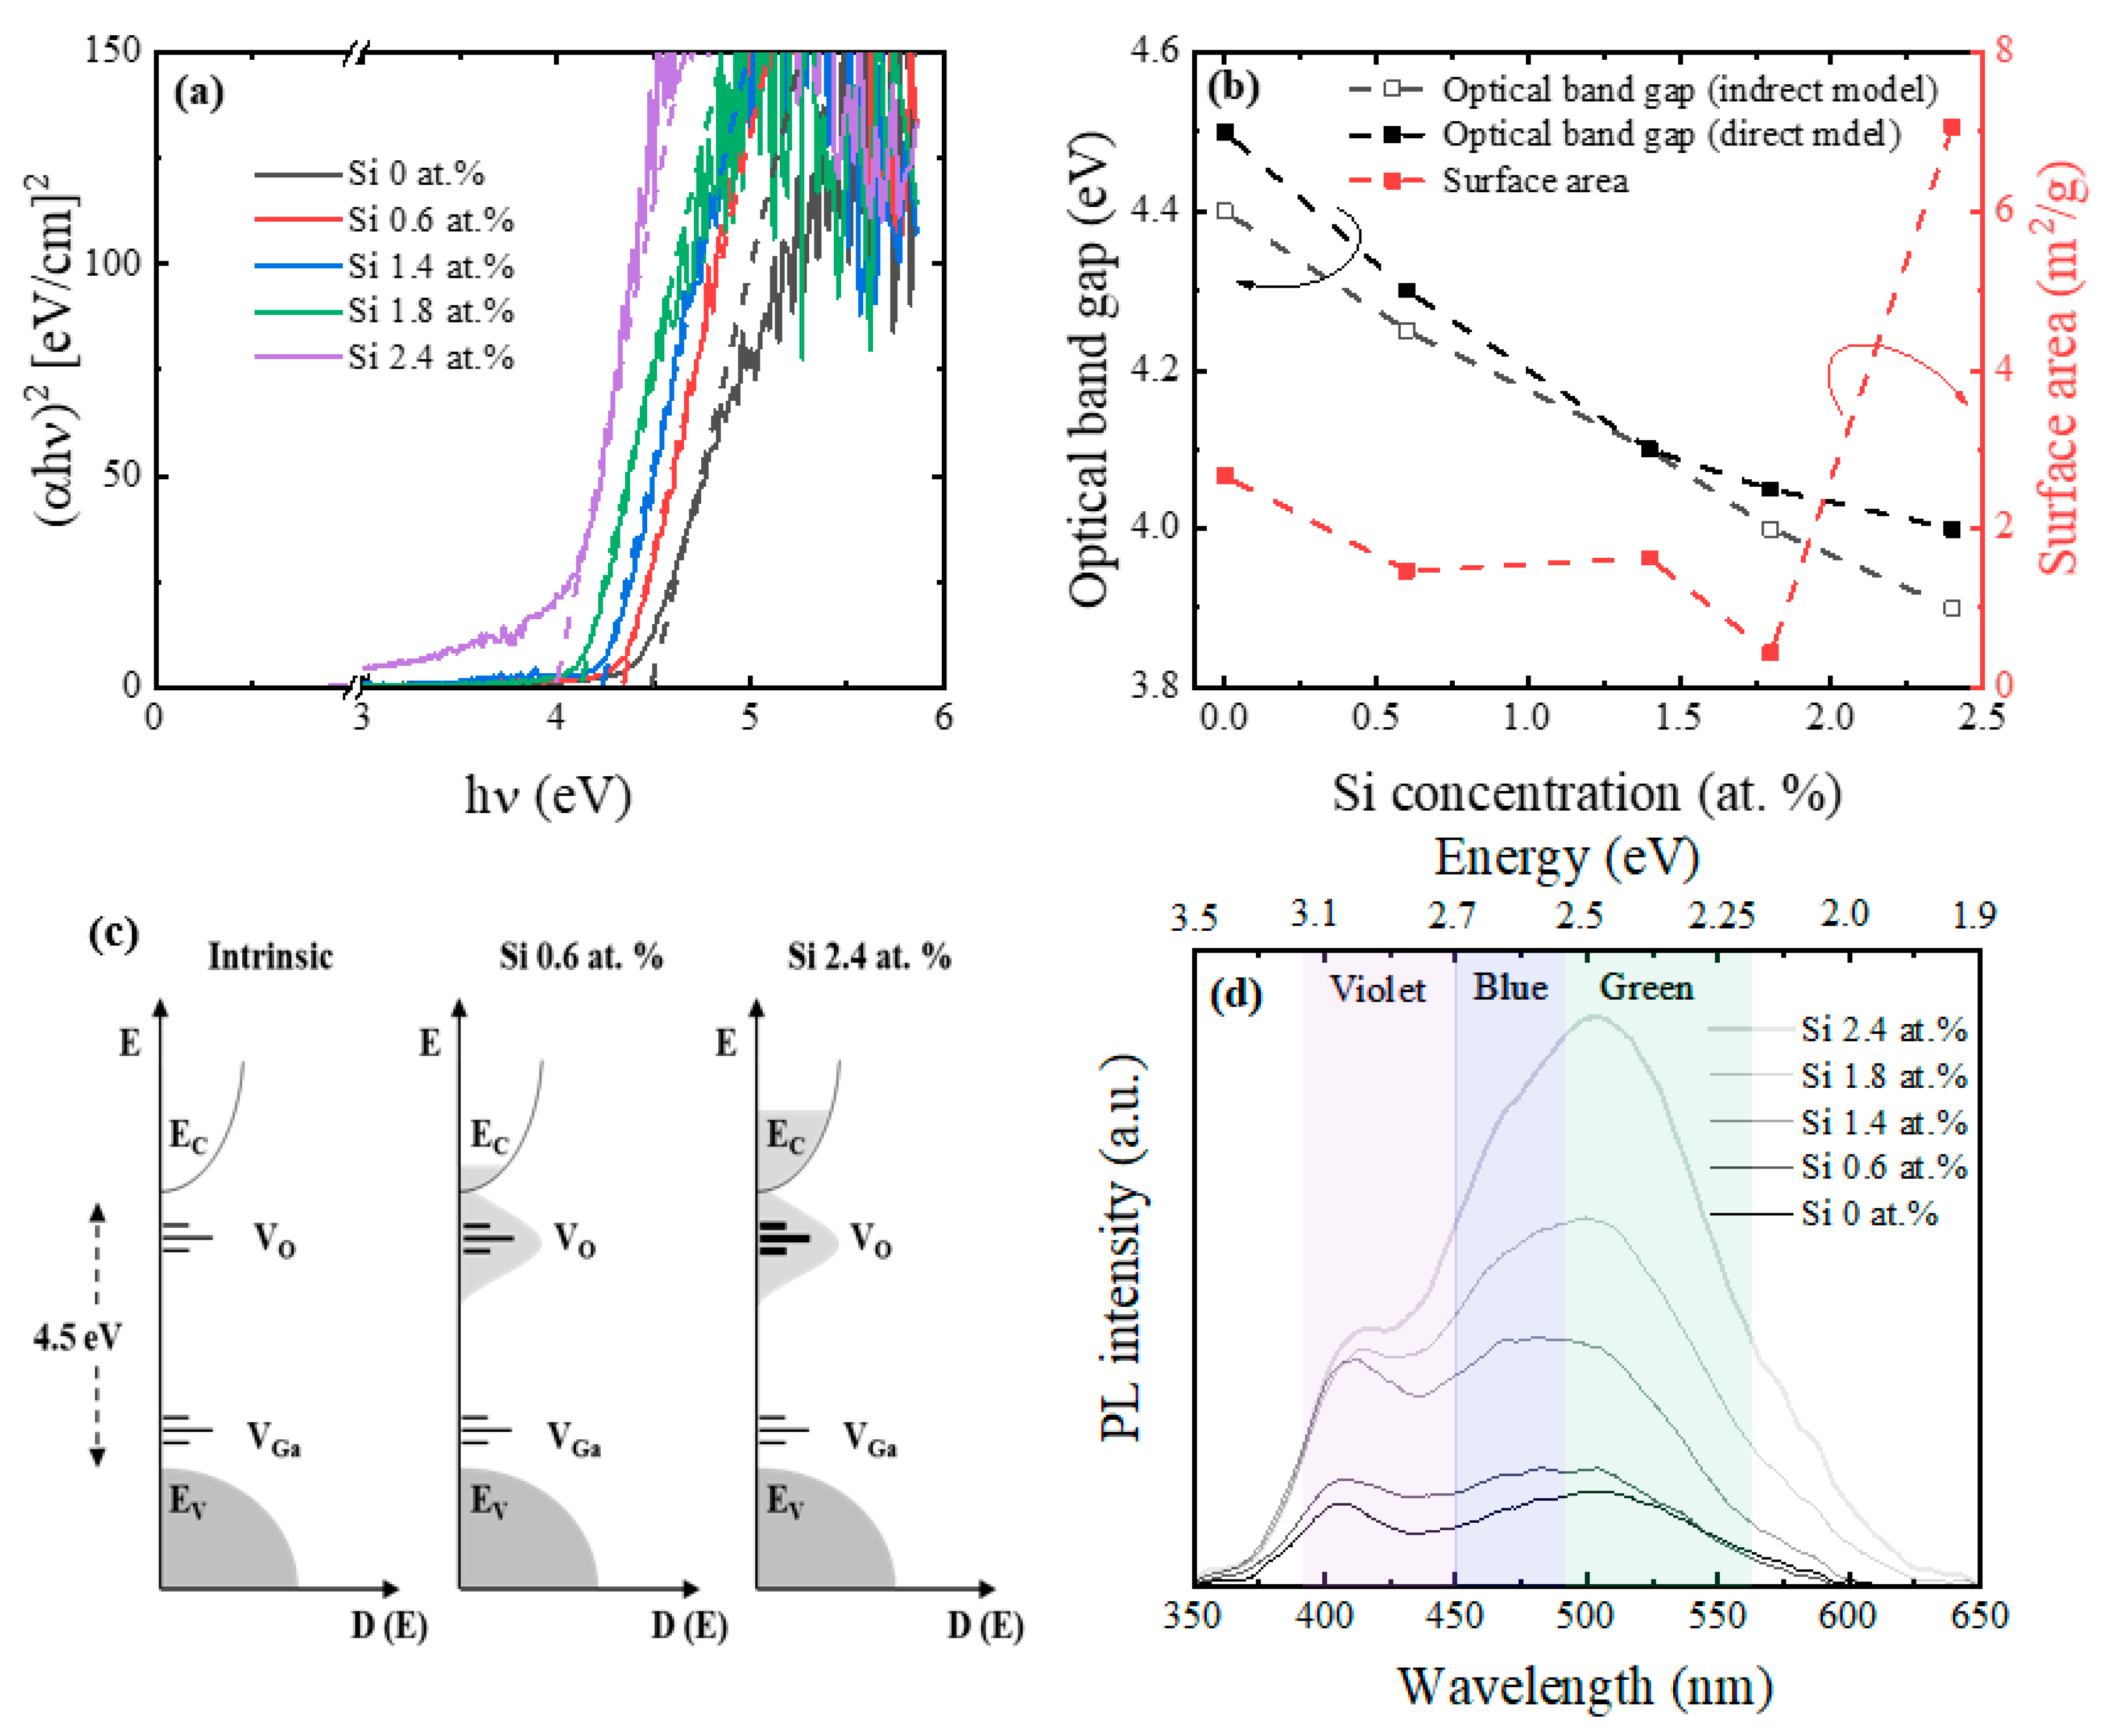
The optical transmittance of β-Ga2O3 nanofibers with different Si concentrations was compared, and a Tauc plot was subsequently derived, as presented in Figure 3a. The optical bandgaps of the β-Ga2O3 nanofibers with different Si dopants were extracted via linear extrapolation from this Tauc plot (both direct and indirect bandgap model) [20]. The extracted optical bandgap of the polycrystalline β-Ga2O3 nanofibers was around 4.5 eV, which was smaller than that of the single crystalline β-Ga2O3 (4.77 eV) [8]. This discrepancy was presumably attributed to the photon scattering in the surface and the grain boundary of the polycrystalline nanofibers [21,22]. The optical bandgap of the β-Ga2O3 nanofibers continuously decreased from 4.5 eV (intrinsic) to 4.0 eV for the Si-doped (2.4 at. %) β-Ga2O3 nanofibers. This bandgap reduction was explained by the enhanced density of localized states caused by the Si dopants, as shown in Figure 3c, which was generated due to the Si dopants on the substitutional sites of the Ga atoms [23]. The donor and acceptor states in the intrinsic β-Ga2O3 nanofibers were formed by an oxygen vacancy (VO) and gallium (VGa), respectively [24]. Though these states of VO and VGa have been sharply described within the bandgap in Figure 3c, they were expected to exhibit tails because these VO and VGa sites were randomly distributed. Figure 3d shows the PL spectra of the Ga2O3 nanofibers with different Si concentrations at room temperature. The intrinsic β-Ga2O3 nanofibers showed multiple peaks ranging between 400 and 550 nm, representing violet, blue, and green emissions. These violet, blue, and green emissions have also been observed from Ga2O3 nanowires [25,26]. It was reported that the violet and blue emissions in the Ga2O3 nanowires originated from the recombination of an electron on a donor with a hole on an acceptor, rather than via band-to-band recombination, because the excitation wavelength (325-nm light (3.8 eV)) was lower than the bandgap of the Ga2O3 nanofibers [27]. The violet emission intensity linearly increased at the low Si concentration region (Si 0~1.4%), but it remained constant at the high Si concentration region (>Si 1.4%). These enhanced intensities of the violet, blue, and green emissions at the low Si concentration region were attributed to the increased VO and VGa caused by the addition of Si atoms [27]. A further enhancement in the Si concentration expanded the Si dopant energy band, as seen in Figure 3d. The minimum band edge of this energy band had an energy level located below that of the VO, which explained the enhanced blue and green emissions with the high Si concentration region. The increase in the green emissions with Si-doping in the β-Ga2O3 was consistent with a previous report in which the green emissions appeared in the presence of Si impurities [24]. In short, the violet emissions increased via the increased VO and VGa at the low Si concentration region and then saturated, whereas Si dopants also induced the blue and green emissions and this effect dominated in the relatively high Si concentration region.
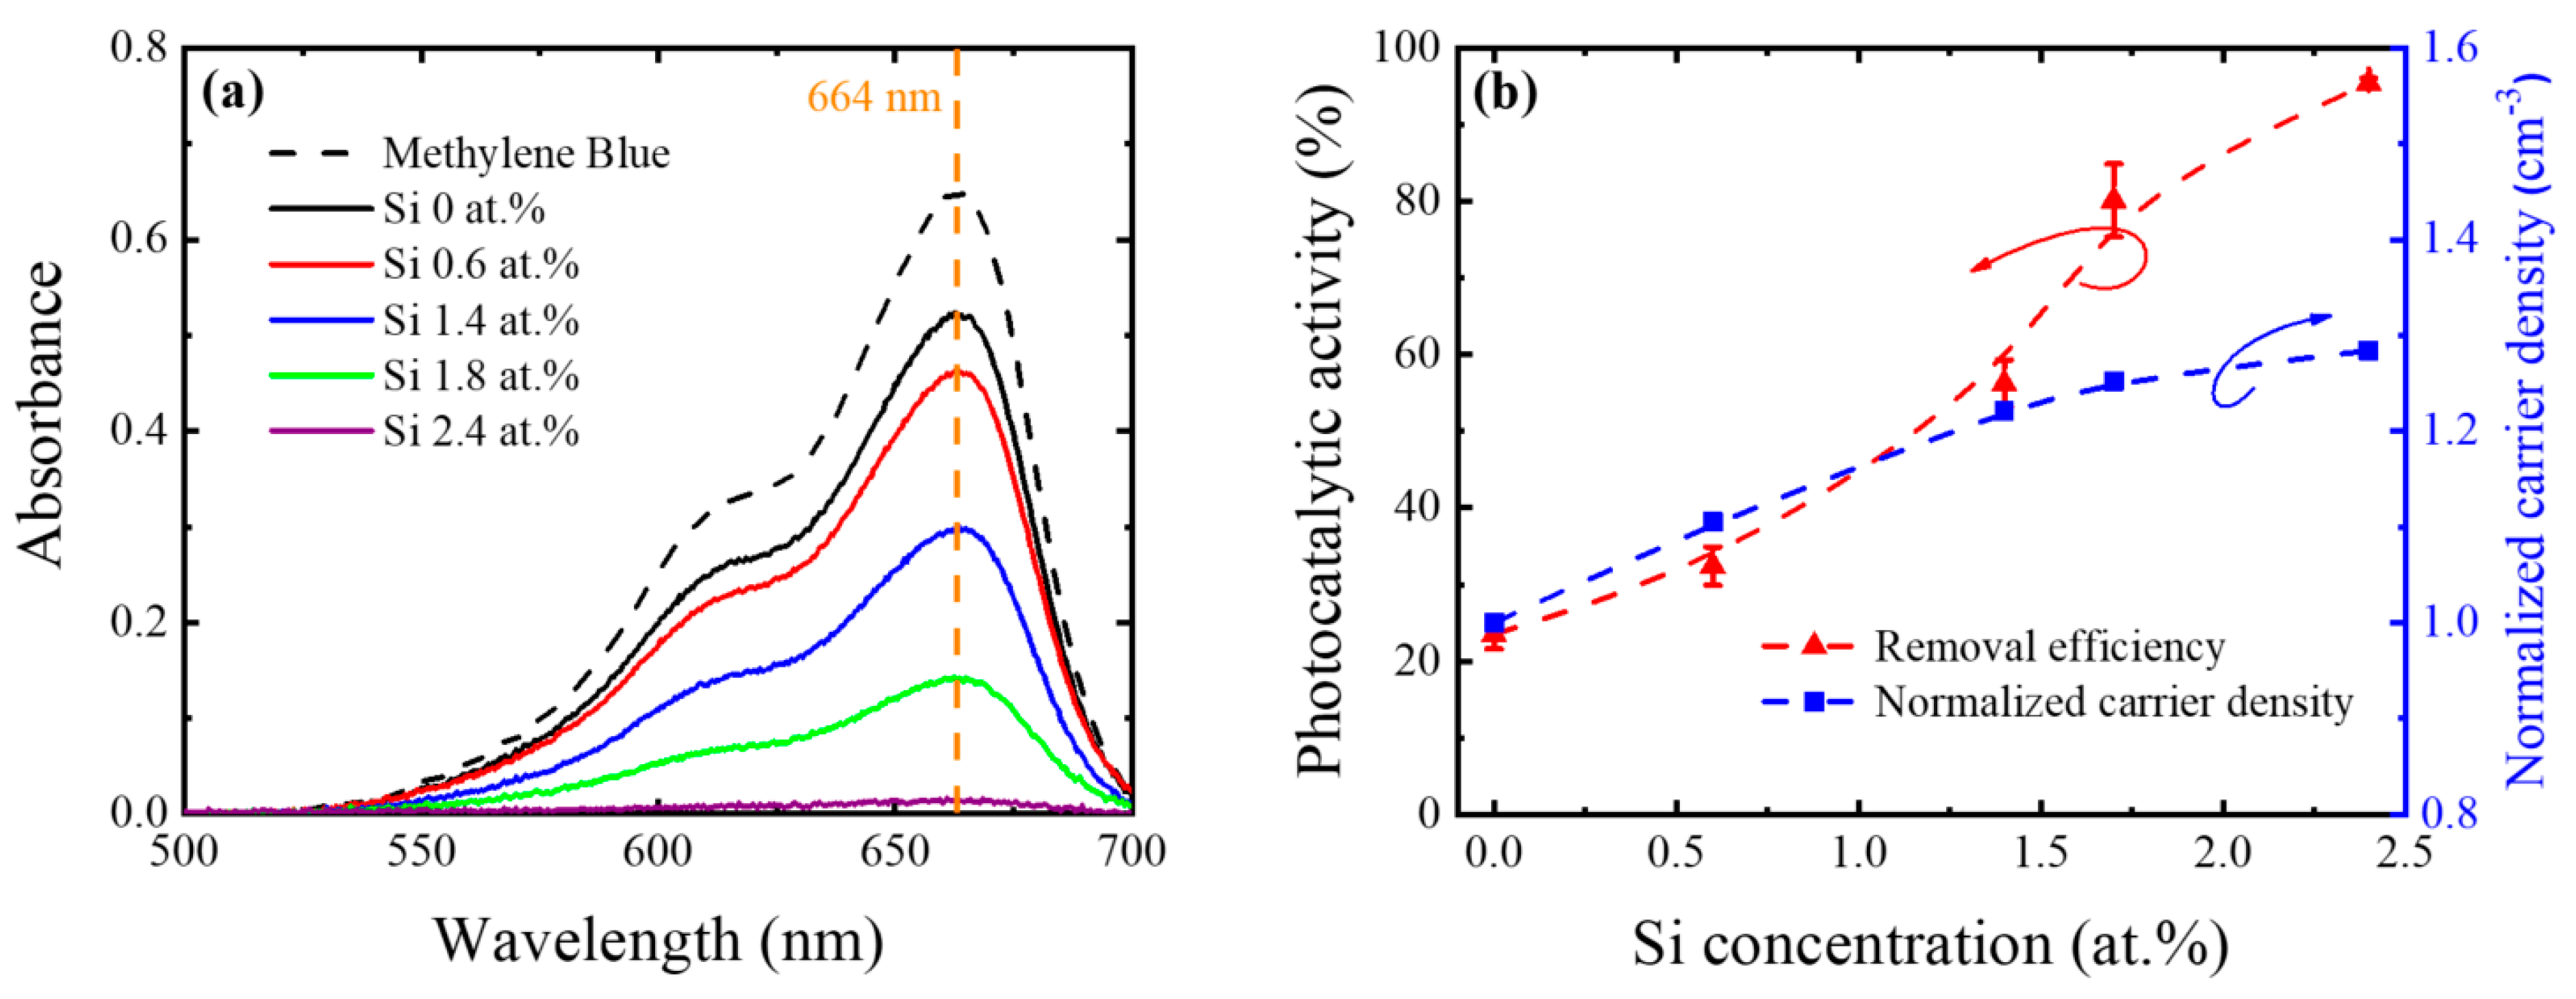
Finally, the photocatalytic activity of β-Ga2O3 nanofibers with different Si concentrations was evaluated according to the photodegradation of MB dye in an aqueous solution under ultraviolet-C (UVC) radiation. Figure 4a shows the optical absorption spectra of the MB solution in the presence of β-Ga2O3 nanofibers with different Si concentrations after UVC irradiation. It was shown that the absorption spectra of the MB solution in the presence of β-Ga2O3 nanofibers degraded with Si doping. The photocatalytic performance of the β-Ga2O3 nanofibers with Si doping was quantitatively determined via absorbance values at λ = 664 nm. The photocatalytic activity, as shown in Figure 4b, was obtained using Formula (1).
Photocatalytic   activity   = ( Ci C Ci ) × 100
where Ci and C are the absorbance of the MB solution in the presence of β-Ga2O3 nanofibers with different Si concentrations at λ = 664 nm before irradiation and after irradiation, respectively.
In addition, the normalized carrier density in the conduction band edge of the β-Ga2O3 nanofibers was also shown as a function of Si concentration. The results showed that the photocatalytic activity of the β-Ga2O3 nanofibers was continuously enhanced with Si doping. These results suggested that β-Ga2O3 nanofibers with Si doping offered the potential for valuable applications in water treatment and the degradation of volatile organic compounds (VOCs). The photocatalytic activity of the β-Ga2O3 nanofibers as shown in Figure 4 was correlated with both the PL and optical bandgap results in Figure 3. In previous reports where dopants were introduced in transparent conductive oxides (TCOs) such as Ce-doped TiO2 [28], Hf-doped ZnO [29], Mg-doped ZnO [30], Al-doped ZnO [31], and Cu-doped TiO2 [32], the photocatalytic activity of the TCOs increased, but the PL peak decreased with doping [33,34]. The enhancement of the photocatalytic activity caused by adding dopants was attributed to the higher separation efficiency of the photon-generated carriers—in other words, the lower recombination of electrons and holes due to the generated trap sites in the bandgap.
In contrast to previous studies [28,29,30,31,32,33,34], the photocatalytic activity in the present study continuously increased along with the PL intensity as the Si concentration in the β-Ga2O3 nanofibers increased. This indicated that the mechanism of separation and recombination of photon-generated carriers alone was insufficient to explain the photocatalytic activity of the Si-doped β-Ga2O3 nanofibers. Thus, we introduced a narrower bandgap with Si doping, which generated more carriers. This explained the enhanced photocatalytic activity along with increasing PL intensity as the Si concentration increased. The normalized carrier density in the Si-doped β-Ga2O3 nanofibers with Si concentration, as shown in Figure 4b, was extracted from Formula (2).
Normalized   carrier   density = e ( E g 2 kT )
where Eg, k, and T are the energy bandgap, Boltzmann’s constant, and temperature (kelvin), respectively [35]. It was noted that the donor ionization energy of the Si in the Ga2O3 was calculated to be 36 meV, which was sufficient to be completely ionized at room temperature [18]. This indicated that the doped Si atoms generated additional electrons in the conduction band edge, which were also able to enhance the formation of superoxide anion radicals and, finally, hydroxyl radicals [36,37,38]. The increased number of hydroxyl radicals via Si doping at a given surface area of β-Ga2O3 nanofibers was responsible for the increased degradation of the MB. Though the recombination of photon-generated carriers increased with Si doping, which was evidenced by the PL intensity, it was presumed that the enhanced electron density caused by the bandgap narrowing dominated the photocatalytic activity of the β-Ga2O3 nanofibers with Si doping. Aside from the narrowed bandgap, the population of doping-induced electrons in the conduction band edge also increased with Si doping.
The recyclability of the various β-Ga2O3 nanofibers with different Si concentrations was conducted for three cycles in the photocatalytic degradation of MB, as shown in Figure 5a. More than 99% of the MB degraded even after the third cycle for the β-Ga2O3 nanofibers with Si 1.4 at. %, Si 1.8 at. %, and Si 2.4 at. %. On the other hand, the value decreased to as low as 87% and 66% for the β-Ga2O3 nanofibers with Si 0.6 at. % and the intrinsic β-Ga2O3 nanofibers, respectively. This indicated that the dopants in the β-Ga2O3 nanofibers improved the recyclability as well as the photocatalytic performance. Furthermore, the photocatalytic performance of the Ga2O3 with Si doping is compared to that of ZnO and TiO2 with different dopants in Figure 5 [39,40,41,42,43]. This comparison revealed that the photocatalytic performance of all of the photocatalysts increased with dopants (0~6 at.%), but the dopant effect on the photocatalytic performance was significant particularly for the Si dopants in the Ga2O3. The steeper slope of photocatalytic performance seen in the Ga2O3 with Si doping compared to the TiO2 and ZnO with other dopants, along with the PL analysis, indicated that the enhanced carrier density, rather than generation of defect sites to enhance separation and inhibit the recombination of photon-generated carriers, was more effective in enhancing the photocatalytic performance.

3. Materials and Method

GaCl3 (Sigma-Aldrich, Saint Louis, MO, USA), polyvinylpyrrolidone (PVP, average molecular weight = 1,300,000; Sigma-Aldrich, USA), and Tetraethyl orthosilicata (TEOS, Sigma-Aldrich, USA) were commercially obtained to form the electrospun Si-doped Ga2O3 nanofibers. Synthesis conditions were as follows: GaCl3 (2.56 g), PVP (5.295 g), and TEOS (0.079 mL for Si 0.6 at. %, 0.395 mL for Si 1.4 at. %, 0.553 mL for Si 1.8 at. %, and 0.79 mL for Si 2.4 at. %) were dissolved in the deionized (DI) water (30 mL). The prepared solution was continuously stirred for 24 h before electrospinning. The electrospinning apparatus consisted of a syringe pump, a gauge metal needle, a grounded collector, and a high voltage supply equipped with current and voltage digital meters [12]. The solution was placed in a 10-mL syringe attached to the syringe pump and was fed into the metal needle at a flow rate of 0.1 μL/h. A high voltage of 25 kV was applied between the needle and the aluminum foil ground at a distance of 8 cm. The formed nanofibers were dried at room temperature for 24 h and subsequently annealed at 1000 ˚C for 6 h.
The morphology and elemental image with concentrations of Ga, Si, and O were investigated using field emission scanning electron microscopy (FESEM, JEOL JSM-7100F, Tokyo, Japan) with energy-dispersive X-ray spectroscopy (EDX). The crystallographic structures of the intrinsic and the Si-doped β-Ga2O3 nanofibers were characterized using a powder X-ray diffraction system (XRD, Rigaku SmartLAB, Tokyo, Japan) over the 2θ range of 10-80° with Cu Kα radiation (λ = 0.15405 nm). The fluorescence ability of the Si-doped β-Ga2O3 was analyzed via photoluminescence at 325 nm excitation (PL, Horiba Jobin-Yvon LabRAM HR-800 UV-Visible-NIR). The transmittance and absorbance of the MB solution were analyzed using UV-VIS spectrophotometers (UV-3600 plus, Shimadzu, Kyoto, Japan). The surface area of the of β-Ga2O3 nanofibers with different Si concentrations was determined via the Brunauer, Emmett, and Teller (BET) method using a conventional flow apparatus (BELSORP-mini II, Osaka, Japan) with nitrogen adsorption at −196 °C. The photocatalytic activity of the β-Ga2O3 nanofibers with different Si concentrations was evaluated via MB (0.02 mM) degradation under UVC irradiation. Each of the 3-mg nanofibers with different Si concentrations was added to the 4-mL MB solutions (1.56 mg/L in DI water), which were then exposed under a 254-nm UVC lamp (UVITEC, Cambridge, United Kingdom) at 6 W for 1.5 h. Each of the 4-mL exposed solutions was subsequently taken for an absorbance and transmittance analysis using UV-3600 Plus (Shimadzu, Japan).

4. Conclusions

In summary, Si-doped β-Ga2O3 nanofibers were formed via the electrospinning method, and their photocatalytic properties were evaluated with Si concentrations by degrading the methylene blue under UVC irradiation. The photocatalytic performance of the β-Ga2O3 nanofibers enhanced along with the Si concentration, which was attributed to the increased carrier density caused by the narrowed bandgap rather than the separation and inhibiting recombination of photon-generated carriers caused by the defect sites. The Si-dopant effect on the photocatalytic performance of the β-Ga2O3 nanofibers was more significant compared to those of TiO2 and ZnO with other dopants.

Supplementary Materials

The following are available online at https://www.mdpi.com/2073-4344/9/12/1005/s1, Figure S1: XRD analysis of β-Ga2O3 nanofibers with different Si concentrations using Fullprof suite software.

Author Contributions

Conceptualization, W.S.H.; formal analysis, T.H.Y., H.R. methodology and resources, I.G.L., B.J.C., W.S.H.; writing, review, and editing, T.H.Y., H.R., I.G.L., B.J.C., W.S.H.

Funding

This work was funded by the National Research Foundation of Korea (NRF) through the Basic Science Research Program (2017R1A2B4012278), and by the Center for Advanced Soft-Electronics funded by the Ministry of Science, ICT and Future Planning, through the Global Frontier Project (CASE-2011-0031638).

Acknowledgments

The SEM/EDS and XRD analysis was conducted at the Korea Basic Science Institute (Busan Center).

Conflicts of Interest

The authors declare that there are no conflict of interest.

References

  1. Lee, K.; Yoon, H.; Ahn, C.; Park, J.; Jeon, S. Strategies to improve the photocatalytic activity of TiO2: 3D nanostructuring and heterostructuring with graphitic carbon nanomaterials. Nanoscale 2019, 11, 7025–7040. [Google Scholar] [CrossRef] [PubMed]
  2. Ibusuki, T.; Takeuchi, K. Toluene oxidation on UV-irradiated titanium dioxide with and without O2, NO2 or H2O at ambient temperature. Atmos. Environ. 1967, 20, 1711–1715. [Google Scholar] [CrossRef]
  3. Loh, K.; Gaylarde, C.C.; Shirakawa, M.A. Photocatalytic activity of ZnO and TiO2 ‘nanoparticles’ for use in cement mixes. Constr. Build. Mater. 2018, 167, 853–859. [Google Scholar] [CrossRef]
  4. Hou, Y.; Wang, X.; Wu, L.; Ding, Z.; Fu, X. Efficient decomposition of benzene over a β-Ga2O3 photocatalyst under ambient conditions. Environ. Sci. 2006, 40, 5799–5803. [Google Scholar] [CrossRef]
  5. Hou, Y.; Wu, L.; Wang, X.; Ding, Z.; Li, Z.; Fu, X. Photocatalytic performance of α-, β-, and γ-Ga2O3 for the destruction of volatile aromatic pollutants in air. J. Catal. 2007, 250, 12–18. [Google Scholar] [CrossRef]
  6. Zhao, W.; Yang, Y.; Hao, R.; Liu, F.; Wang, Y.; Tan, M.; Zhao, D. Synthesis of mesoporous β-Ga2O3 nanorods using PEG as template: Preparation, characterization and photocatalytic properties. J. Hazard. Mater. 2011, 192, 1548–1554. [Google Scholar] [CrossRef]
  7. Tien, L.C.; Chen, W.T.; Ho, C.H. Enhanced Photocatalytic Activity in β-Ga2O3 Nanobelts. J. Am. Ceram. Soc. 2011, 94, 3117–3122. [Google Scholar] [CrossRef]
  8. Hwang, W.S.; Verma, A.; Peelaers, H.; Protasenko, V.; Rouvimov, S.; Xing, H.; Albrecht, M. High-voltage field effect transistors with wide-bandgap β-Ga2O3 nanomembranes. Appl. Phys. Lett. 2014, 104, 203111. [Google Scholar] [CrossRef]
  9. Bae, H.J.; Yoo, T.H.; Kim, S.; Choi, W.; Song, Y.S.; Kwon, D.K.; Hwang, W.S. Enhanced Photocatalytic Degradation of 2-Butanone Using Hybrid Nanostructures of Gallium Oxide and Reduced Graphene Oxide under Ultraviolet-C Irradiation. Catalysts 2019, 9, 449. [Google Scholar] [CrossRef]
  10. Tian, G.; Fu, H.; Jing, L.; Xin, B.; Pan, K. Preparation and characterization of stable biphase TiO2 photocatalyst with high crystallinity, large surface area, and enhanced photoactivity. J. Phys. Chem. C 2008, 112, 3083–3089. [Google Scholar] [CrossRef]
  11. Hou, Y.; Zhang, J.; Ding, Z.; Wu, L. Synthesis, characterization and photocatalytic activity of β-Ga2O3 nanostructures. Powder Technol. 2010, 203, 440–446. [Google Scholar] [CrossRef]
  12. Yoon, Y.; Han, K.I.; Kim, B.H.; Lee, I.G.; Kim, Y.; Kim, J.P.; Hwang, W.S. Formation of β-Ga2O3 nanofibers of sub-50 nm diameter synthesized by electrospinning method. Thin Solid Films 2018, 645, 358–362. [Google Scholar] [CrossRef]
  13. Faccini, M.; Amantia, D.; Vázquez-Campos, S.; Vaquero, C.; de Ipiña, J.L.; Aubouy, L. Nanofiber-based filters as novel barrier systems for nanomaterial exposure scenarios. J. Phys. Conf. Ser. 2011, 304, 012067. [Google Scholar] [CrossRef]
  14. Zhao, J.; Zhang, W.; Xie, E.; Liu, Z.; Feng, J.; Liu, Z. Photoluminescence properties of β-Ga2O3: Tb3+ nanofibers prepared by electrospinning. Mater. Sci. Eng. B 2011, 176, 932–936. [Google Scholar] [CrossRef]
  15. Zhao, J.; Zhang, W.; Xie, E.; Ma, Z.; Zhao, A.; Liu, Z. Structure and photoluminescence of β-Ga2O3: Eu3+ nanofibers prepared by electrospinning. Appl. Surf. Sci. 2011, 257, 4968–4972. [Google Scholar] [CrossRef]
  16. Huang, P.; Luan, J. Structure and photocatalytic performance of rice husk-like Ba-doped GaOOH under light irradiation. RSC Adv. 2019, 9, 19930–19939. [Google Scholar] [CrossRef]
  17. Yoon, Y.; Kim, S.; Lee, I.J.; Cho, B.J.; Hwang, W.S. Electrical and Photocurrent Properties of a Polycrystalline Sn-doped β-Ga2O3 Thin Film with a Thickness of 100 nm. Thin Solid Films 2019. under review. [Google Scholar]
  18. Lany, S. Defect phase diagram for doping of Ga2O3. APL Mater. 2018, 6, 046103. [Google Scholar] [CrossRef]
  19. Yu, W.; Jiang, K.; Wu, J.; Gan, J.; Zhu, M.; Hu, Z.; Chu, J. Electronic structures and excitonic transitions in nanocrystalline iron-doped tin dioxide diluted magnetic semiconductor films: An optical spectroscopic study. Phys. Chem. Chem. Phys. 2011, 13, 6211–6222. [Google Scholar] [CrossRef]
  20. Pethuraja, G.G.; Welser, R.E.; Sood, A.K.; Lee, C.; Alexander, N.J.; Efstathiadis, H.; Harvey, J.L. Effect of Ge incorporation on bandgap and photosensitivity of amorphous SiGe thin films. Mater. Sci. Appl. 2012, 3, 67–71. [Google Scholar] [CrossRef]
  21. Jia, J.; Oka, N.; Kusayanagi, M.; Nakatomi, S.; Shigesato, Y. Origin of carrier scattering in polycrystalline Al-doped ZnO films. Appl. Phys. Express 2014, 7, 105802. [Google Scholar] [CrossRef]
  22. Tanemura, S.; Miao, L.; Jin, P.; Kaneko, K.; Terai, A.; Nabatova-Gabain, N. Optical properties of polycrystalline and epitaxial anatase and rutile TiO2 thin films by rf magnetron sputtering. Appl. Surf. Sci. 2003, 212, 654–660. [Google Scholar] [CrossRef]
  23. Mi, W.; Du, X.; Luan, C.; Xiao, H.; Ma, J. Electrical and optical characterizations of β-Ga2O3: Sn films deposited on MgO (110) substrate by MOCVD. RSC Adv. 2014, 4, 30579–30583. [Google Scholar] [CrossRef]
  24. Harwig, T.; Kellendonk, F. Some observations on the photoluminescence of doped β-galliumsesquioxide. J. Solid State Chem. 1978, 24, 255–263. [Google Scholar] [CrossRef]
  25. Nogales, E.; Méndez, B.; Piqueras, J. Cathodoluminescence from β-Ga2O3 nanowires. Appl. Phys. Lett. 2005, 86, 113112. [Google Scholar] [CrossRef]
  26. Shimamura, K.; Víllora, E.G.; Ujiie, T.; Aoki, K. Excitation and photoluminescence of pure and Si-doped β-Ga2O3 single crystals. Appl. Phys. Lett. 2008, 92, 201914. [Google Scholar] [CrossRef]
  27. Harwig, T.; Kellendonk, F.; Slappendel, S. The ultraviolet luminescence of β-galliumsesquioxide. J. Phys. Chem. Solids 1978, 39, 675–680. [Google Scholar] [CrossRef]
  28. Wang, B.; de Godoi, F.C.; Zheng, S.; Gentle, I.R.; Li, C. Enhanced photocatalytic properties of reusable TiO2-loaded natural porous minerals in dye wastewater purification. Powder Technol. 2016, 302, 426–433. [Google Scholar] [CrossRef]
  29. Ahmad, M.; Ahmed, E.; Hong, Z.L.; Iqbal, Z.; Khalid, N.R.; Abbas, T.; Ahmed, W. Structural, optical and photocatalytic properties of hafnium doped zinc oxide nanophotocatalyst. Ceram. Int. 2013, 39, 8693–8700. [Google Scholar] [CrossRef]
  30. Etacheri, V.; Roshan, R.; Kumar, V. Mg-doped ZnO nanoparticles for efficient sunlight-driven photocatalysis. ACS Appl. Mater. Interfaces 2012, 4, 2717–2725. [Google Scholar] [CrossRef]
  31. Ahmad, M.; Ahmed, E.; Zhang, Y.; Khalid, N.R.; Xu, J.; Ullah, M.; Hong, Z. Preparation of highly efficient Al-doped ZnO photocatalyst by combustion synthesis. Curr. Appl. Phys. 2013, 13, 697–704. [Google Scholar] [CrossRef]
  32. Khalid, N.R.; Ahmed, E.; Hong, Z.; Ahmad, M.; Zhang, Y.; Khalid, S. Cu-doped TiO2 nanoparticles/graphene composites for efficient visible-light photocatalysis. Ceram. Int. 2013, 39, 7107–7113. [Google Scholar] [CrossRef]
  33. Mousavi, M.; Habibi-Yangjeh, A.; Abitorabi, M. Fabrication of novel magnetically separable nanocomposites using graphitic carbon nitride, silver phosphate and silver chloride and their applications in photocatalytic removal of different pollutants using visible-light irradiation. J. Colloid Interface Sci. 2016, 480, 218–231. [Google Scholar] [CrossRef] [PubMed]
  34. Nasir, M.; Xi, Z.; Xing, M.; Zhang, J.; Chen, F.; Tian, B.; Bagwasi, S. Study of synergistic effect of Ce-and S-codoping on the enhancement of visible-light photocatalytic activity of TiO2. J. Phys. Chem. C 2013, 117, 9520–9528. [Google Scholar] [CrossRef]
  35. Zeghbroeck, B.V. Principles of Semiconductor Devices; University of Colorado: Boulder, CO, USA, 2007. [Google Scholar]
  36. Pirkanniemi, K.; Sillanpää, M. Heterogeneous water phase catalysis as an environmental application: A review. Chemosphere 2002, 48, 1047–1060. [Google Scholar] [CrossRef]
  37. Ouzzine, M.; Maciá-Agulló, J.A.; Lillo-Rodenas, M.A.; Quijada, C.; Linares-Solano, A. Synthesis of high surface area TiO2 nanoparticles by mild acid treatment with HCl or HI for photocatalytic propene oxidation. Appl. Catal. B 2014, 154, 285–293. [Google Scholar] [CrossRef] [Green Version]
  38. Houas, A.; Lachheb, H.; Ksibi, M.; Elaloui, E.; Guillard, C.; Herrmann, J.M. Photocatalytic degradation pathway of methylene blue in water. Appl. Catal. B 2001, 31, 145–157. [Google Scholar] [CrossRef]
  39. Yoon, H.; Joshi, B.N.; Na, S.H.; Choi, J.Y.; Yoon, S.S. Photodegradation of methylene blue of niobium-doped zinc oxide thin films produced by electrostatic spray deposition. Ceram. Int. 2014, 40, 7567–7571. [Google Scholar] [CrossRef]
  40. Wang, R.; Xin, J.H.; Yang, Y.; Liu, H.; Xu, L.; Hu, J. The characteristics and photocatalytic activities of silver doped ZnO nanocrystallites. Appl. Sur. Sci. 2004, 227, 312–317. [Google Scholar] [CrossRef]
  41. Rafaie, H.A.; Nor, R.M.; Azmina, M.S.; Ramli, N.I.T.; Mohamed, R. Decoration of ZnO microstructures with Ag nanoparticles enhanced the catalytic photodegradation of methylene blue dye. J. Environ. Chem. Eng. 2017, 5, 3963–3972. [Google Scholar] [CrossRef]
  42. Ahmed, M.A. Synthesis and structural features of mesoporous NiO/TiO2 nanocomposites prepared by sol–gel method for photodegradation of methylene blue dye. J. Photochem. Photobiol. A Chem. 2012, 238, 63–70. [Google Scholar] [CrossRef]
  43. Hsieh, S.H.; Ting, J.M. Characterization and photocatalytic performance of ternary Cu-doped ZnO/Graphene materials. Appl. Surf. Sci. 2018, 427, 465–475. [Google Scholar] [CrossRef]
Figure 1. SEM/EDS mapping images and diameter histograms of electrospun Ga2O3 nanofibers with (a) Si 0 at. %, (b) Si 0.6 at. %, and (c) Si 2.4 at. %. After electrospinning, the nanofibers were calcined at 1000 °C for 6 h. The red solid curves in the histograms are the best-fitting Gamma distribution functions. (Scale bar: 1 μm).
Catalysts 09 01005 g001
Figure 2. (a) XRD pattern of electrospun β-Ga2O3 nanofibers with different Si concentrations. (b) Normalized peak reduction of Si-doped (2.4 at. %) β-Ga2O3 nanofibers compared to that of intrinsic β-Ga2O3 nanofibers.
Catalysts 09 01005 g002
Figure 3. (a) Tauc plot (direct bandgap model), (b) corresponding optical bandgap and surface area, and (c) schematic illustration of a (donor) impurity band formation involved in light emission with Si dopants in the β-Ga2O3 nanofibers. (d) PL spectra of β-Ga2O3 nanofibers with different Si concentrations excited at 325 nm.
Catalysts 09 01005 g003
Figure 4. Photocatalytic activity of β-Ga2O3 nanofibers with different Si concentrations under UVC irradiation for 1.5 h. (a) Absorbance spectra of the MB solution in the presence of β-Ga2O3 nanofibers with different Si concentrations and (b) normalized photocatalytic performance of β-Ga2O3 nanofibers as a function of Si concentration. The error bars are graphical representations of the repeatability (three times) of the variability.
Catalysts 09 01005 g004
Figure 5. (a) Recyclability of the various β-Ga2O3 nanofibers with different Si concentrations in the photocatalytic degradation of methyl blue (MB). (b) Benchmark of removal efficiency for different transparent conductive oxides (TCO) photocatalysts with various dopant concentrations via MB degradation at 254 nm irradiation. The irradiation time (h), MB concentration (mM), and light source power (W) are listed sequentially in the legend.
Catalysts 09 01005 g005