Article

Estimation of the Effectiveness Factor for Immobilized Enzyme Catalysts through a Simple Conversion Assay

Department of Chemical and Environmental Engineering, Technical University Federico Santa María, PO Box 110-V, Valparaíso 2340000, Chile
*
Author to whom correspondence should be addressed.
Catalysts 2019, 9(11), 930; https://doi.org/10.3390/catal9110930
Submission received: 30 September 2019 / Revised: 22 October 2019 / Accepted: 25 October 2019 / Published: 7 November 2019

Abstract

:
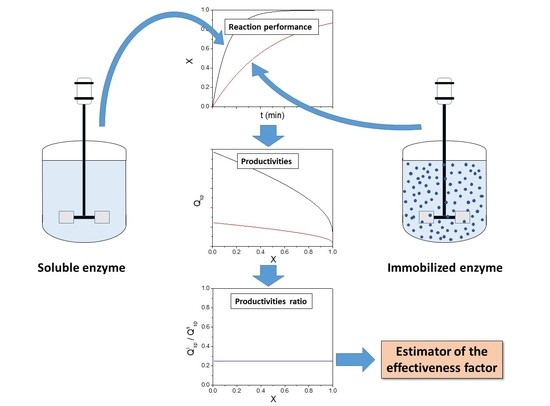
A novel methodology to estimate the effectiveness factor (EF) of an immobilized enzyme catalyst is proposed here. The methodology consists of the determination of the productivity of both the immobilized enzyme catalyst and its corresponding soluble enzyme, plotted as a function of the reaction conversion. The ratio of these productivities corresponds to the EF estimator of the catalyst. Conversion curves were simulated in a batch reactor with immobilized enzyme and soluble enzyme for different values of the S0/KM ratio and Thiele modulus (Φ) to demonstrate this hypothesis. Two different reaction orders were tested: first-order kinetic and Michaelis–Menten-based kinetic with product inhibition. The results showed that the ratio of productivities between the immobilized and soluble enzymes followed the behavior profile presented by the EF with satisfactory agreement. This simple methodology to estimate the EF is based on routine conversion experiments, thus avoiding the exhaustive kinetic and mass transfer characterization of the immobilized enzyme catalyst.

Graphical Abstract

1. Introduction

Physical and/or chemical enzyme immobilization in permeable solid supports is a fascinating challenge in modern biotechnology. It enables the recovery and reuse of the enzyme through several reaction cycles, thus reducing global production costs and providing an environmentally friendly technology. Furthermore, enzyme stabilization enables operation at high temperatures and in the presence of organic or ionic solvents and extreme pH conditions [1].
Some considerations must be taken into account after the enzyme immobilization. The reaction kinetics of soluble and immobilized enzymes may differ due to conformational changes caused by the interaction between the enzyme and the support matrix [2]. Mass transfer processes through the stagnant layer around the catalyst particle or inside particle pores interplay with the catalytic process. The consequence is substrate and product gradient concentrations in the stagnant layer and inside the catalyst that may decrease the catalytic potential of the enzyme. These are called diffusional restrictions and need to be quantified experimentally in each case [3,4].
The effectiveness factor (EF) is the relationship between the global rate of substrate consumption within the particle and the assessed substrate concentration rate at the surface [5]:
η = v v b
where v is the effective reaction rate (at the surface and/or inside the pores of the catalyst) and vb is the reaction rate evaluated at the bulk phase. In other words, v is the reaction rate affected by diffusional restrictions and vb is the reaction rate free from diffusional restrictions. As the definition of EF in Equation (1) corresponds to a singular position inside the catalyst particle, an integration must be done to evaluate the EF of the whole catalyst. The mean integral value of the EF for a spherical particle results in
η = 3 0 1 η ρ 2 d ρ
where ρ is the dimensionless position in the spherical particle (radius). For a first-order reaction, the mean integral EF is given by Equation (3):
η = 1 Φ [ 1 t a n h ( 3 Φ ) 1 3 Φ ]
where Φ is the Thiele modulus for a first-order reaction and spherical catalyst.
Φ = R 3 k c a t · E 0 K M · D e
The EF directly indicates the magnitude of the diffusional restrictions caused by the immobilization. The EF has values between 0 and 1: a catalytic potential similar to that of the soluble enzyme is obtained with a value close to 1, and for values below that, a loss of catalytic activity due to diffusional restrictions is implied [6].
The determination of the global rate of substrate consumption within the catalyst involves the modelling and simulation of partial differential equations (PDEs) of conservation for every species for a specified geometry. The PDEs are subject to several boundary and spatial symmetry conditions [7,8], normalized by the ordinary differential equation (ODE) related to the reaction rate evaluated at the surface concentration.
One of the approaches used to evaluate the EF is the use of the substrate mass balance equation inside the catalyst to obtain the substrate concentration profile and, therefore, to calculate the EF. The analytic solution of the concentration profile can be calculated for simplifications of the Michaelis–Menten equation; i.e., zero and first order [2,9]. Several analytical approximations and numerical techniques have been implemented to calculate the EF in one-substrate reactions with low-complexity mechanisms in a steady state:
  • Explicit finite differences schemes [4,10]: These methods have the advantages of easy computational implementation and quick numerical solution in the steady state. However, they are sensitive to stability criteria, require variable changes to replace conditions in the center of the spherical catalytic particles, and fail to represent the behavior of the transient enzyme system.
  • Taylor series expansions [11]: This solution method allows us to represent the EF behavior as a function of the competitive and uncompetitive inhibition constants and the Thiele modulus. However, its generalization is not possible, as the different enzymatic mechanisms and catalyst geometries can present singularities where the Taylor series does not converge.
  • Runge–Kutta and Runge–Kutta–Gill methods [2,12,13,14,15,16]: These numerical methods have been widely used given their stability and precision in the resolution of PDEs. However, they require a high level of computational solving, which increases with decreasing Thiele modulus and where the boundary conditions involve mass transfer due to convection forces.
  • Newton’s iteration techniques [17]: A program to determine the EF was developed in a reaction that presents competitive inhibition by the product and uncompetitive inhibition by the substrate. It includes a model of a nonuniform enzyme distribution with the presence of internal and external mass transfer restrictions. The method replaces the differential equations system for nonlinear algebraic equations such as the Taylor series, which have the same singularity inconveniences discussed before.
  • The homotopy perturbation method [18]: This is a modern and promising analytical method to obtain the solutions to nonlinear PDEs. The method consists of expanding the relevant variables and some parameters if needed, as well as power series depending on the homotopy parameter (p). The method has proved to be highly effective, but there are still no studies related to the comparison of experimental data or to its application in multisubstrate reactions.
  • Approximated analytical solutions [19,20,21,22,23]: While analytical solutions provide an understanding of the system with a satisfactory precision, they are usually related to one-substrate reactions. They use complex hyperbolic periodic equations, which are tedious to use and diverge from the real EF behavior as the Thiele modulus increases. This happens due to the imposed restrictions and assumptions in the mathematical modelling derivation.
  • Modified Adomian decomposition method [24,25]: The method has been widely used as a solution method for nonlinear differential problems, where it cannot always satisfy the boundary conditions imposed (applicability limitations) and also has the added complexity of calculation of the Adomian polynomials, which are usually impractical to apply.
  • Orthogonal placement [14,21,22,26,27,28]: This method increases the computational time substantially compared to the Runge–Kutta methods as five or more placement points are implemented in its resolution. Additionally, it presented numerical instabilities in research by Vos et al. [14] for the calculation of mass transfer in thin biofilms.
All the methodologies mentioned above require high effort in terms of mathematical modeling and advanced computer simulations. They also require protocols that involve a large amount of experimental work to determine the intrinsic kinetic constants, diffusional parameters, and particle size distributions to guarantee reliable results [6]. Because of the above, the present article proposes an experimental methodology to evaluate the EF of any enzymatic reaction by obtaining data from the reaction progress in a batch reactor using soluble and immobilized enzymes. The methods are detailed in the next section.

2. Theory

The EF can be calculated from data obtained by a routine assay of reactor performance. The reaction progress is usually evaluated in biocatalysis reactions. It consists of the quantification of the substrate or product concentration during the enzymatic reaction. A plot of these variables against time allows for the visualization of the reaction performance. The calculation of the specific productivity (Qsp) is shown in Equation (5):
Q s p = S 0 X E R t
where S0 is the initial substrate concentration, X is the conversion, ER is the enzyme concentration in the reactor volume, and t is the reaction time. The specific productivity depends on the reaction time, which depends on the kinetic model and the enzyme format used (soluble or immobilized). In the case of the soluble enzyme, the conservation equation in a batch reactor is
d X d t = v S 0 .
Considering a simple case of a kinetic model, a first-order kinetic would yield
d S d t = k S 0 ( 1 X )
X = 1 e k t
t = ln ( 1 X ) k
where k is the first-order kinetic constant. In the case of an immobilized enzyme catalyst, the conservation equation considers the effectiveness factor, which yields
d S d t = η k S 0 ( 1 X )
X = 1 e η k t
t = ln ( 1 X ) η k
Now, the calculation of the specific productivity for each case—of a soluble or immobilized enzyme—is as follows:
Q s p s = S 0 X k E R ln ( 1 X )
Q s p i = S 0 X η k E R ln ( 1 X )
The ratio of the specific productivity with an immobilized enzyme ( Q s p i ) regarding the specific productivity with a soluble enzyme ( Q s p s ) results in the EF.
Q s p i Q s p s = η
The general expression for Equation (15), considering the cases where no analytical solution can be achieved for the mean integral EF, is indicated in Equation (16).
Q s p i Q s p s = d X v d X η v
Equation (15) is valid when both specific productivities—those for soluble and immobilized enzymes—were evaluated at the same ER. This can be achieved by adding the same total enzyme activity to the same reaction volume in both cases. The relationship between the soluble enzyme concentration and the immobilized enzyme concentration (catalyst concentration) is shown in Equation (17):
V R E R = V c a t E 0
where VR is the reaction volume, Vcat is the catalyst volume, and E0″ is the enzyme concentration in the catalyst. As the soluble enzyme homogeneously distributes in the reaction volume, its concentration is the same as the concentration in the reactor (ER). However, the immobilized enzyme distributes only inside the catalyst volume and differs from ER according to Equation (17). Equation (16) cannot be solved for diffusion–reaction systems based on Michaelis–Menten kinetics because there is no analytical solution for the mean integral EF ( η ) in this case.
Two cases were analyzed and used as a demonstration of the hypothesis involved in Equation (15). The first case is the hydrolysis of lactose by β-galactosidase (EC 3.2.1.23) considering the kinetic model proposed by Jurado et al. (2002) [29]. In this model, lactose and galactose present similar affinity for the enzyme; thus, the kinetic model is under the assumption KM = KI. The model is as follows:
d S d t = k c a t E 0 S K M + K M K I P + S
d S d t = k c a t E 0 S K M + P + S
d S d t = [ k c a t E 0 K M + S 0 ] S
The term in brackets corresponds to a first-order kinetic constant k, such as that in Equation (7). Therefore, the solution of Equation (19) is like that of Equation (7), obtaining the same result as in Equation (8). Analogously, in the case of a reactor with immobilized β-galactosidase, the batch reactor performance is given by Equation (21).
d S d t = η [ k c a t E 0 K M + S 0 ] S
The solution for Equation (21) will be the same as that for Equation (10). Finally, the result obtained in Equation (15) is valid for the first-order case of the β-galactosidase model according to Jurado et al. In conclusion, we know that Equation (15) is valid for a first-order reaction. However, we do not know whether Equation (15) is valid for complex orders such as the Michaelis–Menten equation because we cannot solve Equation (16). The problem is the lack of an analytical solution for the mean integral EF when the kinetic model is different from a zeroth or first-order reaction, such as Michaelis–Menten or other mechanisms such as product or substrate inhibition. The nonlinearity of this type of equation prevents the possibility of obtaining an analytical solution for the mean integral EF. There are some approximations available to solve this problem, such as the classical approach of Moo-Young and Kobayashi [19], in which the mean integral EF for a complex order is a weighting between the zeroth and first-order EFs. However, this approximation cannot be used to obtain an analytical solution for the mean integral EF. All the complex-order reactions have to be solved by numerical iteration to obtain the values of the mean integral EF and, therefore, to obtain the batch reactor performance using immobilized enzyme catalysts. The second case analyzed was the hydrolysis of penicillin G (PenG) by penicillin G acylase (PGA, EC 3.5.1.11) for the production of semisynthetic antibiotics derived from penicillin [30]. This is an example of a complex-order reaction. The enzymatic reaction exerts substrate uncompetitive inhibition, competitive inhibition by phenylacetic acid (PAA, P1), and uncompetitive inhibition by 6-aminopenicillanic acid (6-APA, P2) [30,31,32]. The kinetic model for this reaction is shown in Equation (22).
v = k c a t E 0 S K M + S + S 2 K S + K M P 1 K 1 + K M P 2 K 2 + S P 2 K 2 + K M P 1 P 2 K 1 K 2
Heterogeneous catalysis using immobilized penicillin acylase in porous supports is modeled using the mass conservation equation inside catalyst particles. The resulting reaction–diffusion equations for the substrate and for both products, considering spherical particles, are shown in Equations (23)–(25):
S t = D e ( 2 S r 2 + 2 r S r ) v
P 1 t = D e 1 ( 2 P 1 r 2 + 2 r P 1 r ) + v
P 2 t = D e 2 ( 2 P 2 r 2 + 2 r P 2 r ) + v
where De, De1, and De2 are the effective diffusion coefficients for PenG (S), PAA, and 6-APA, respectively. The terms r, t, and v correspond to the radial position inside the catalyst, the reaction time, and the kinetic model in Equation (22), respectively. The boundary conditions for these equations are as follows.
At r = 0,
S t | r = 0 ( r , t ) = P 1 t | r = 0 ( r , t ) = P 2 t | r = 0 ( r , t ) = 0
At r = R, there are concentration changes over time for the reagents and products because of transport inside the catalyst sphere and the reaction. The PenG, PAA, and 6-APA concentrations’ rates of change at the bulk will depend as much on the diffusive and the reactive phenomena. They can be expressed in terms of the transport velocity from the catalyst–liquid interface inside the catalytic particle as follows:
S b t = 3 D e V c R V b S r | r = R
P 1 , b t = 3 D e 1 V c R V b P 1 , b r | r = R
P 2 , b t = 3 D e 2 V c R V b P 2 , b r | r = R
where Vb, Vc, and R are the liquid phase volume, the catalyst volume, and the catalytic particle equivalent radius, respectively. The system of equations from Equations (23)–(29) was previously solved by discretization through finite differences using the Crank–Nicolson method [31]. The algorithm was implemented and solved in Python software to obtain the reaction progress. The mean integral EF for this system can be obtained from the concentration profiles inside the catalyst particle, as previously published [31], by calculating the corresponding reaction rate profile and computing the data according to Equation (30).
η = 3 0 1 v ρ 2 d ρ v b 3 i = 1 N v i ρ i 2 Δ ρ v b
The EF calculated by this procedure was considered the real mean integral EF and was compared to that obtained by the specific productivity ratio.
The methodology proposed here to estimate the mean integral EF consists of the calculation of the reaction progress to obtain a conversion plot with both the soluble and the immobilized enzymes. The specific productivity was calculated for both cases and plotted against the conversion. This step is fundamental because the productivity values of both the soluble and immobilized enzymes are normalized by the conversion, and they become independent of the reaction time. The specific productivity (or the volumetric productivity using the same enzyme concentration in the reactor) plotted against the conversion provides the estimation of the mean integral EF and its evolution during the reaction progress.
All calculations consider the following assumptions in the reaction–diffusion model:
  • The system is exempt from external diffusional restrictions;
  • The batch reactor operates isothermally;
  • There is a homogeneous distribution of enzyme molecules inside the catalyst particle;
  • The enzyme is not (significantly) affected by thermal inactivation during the reaction time;
  • There are no pH gradients inside the catalyst;
  • The effective diffusion coefficient is independent of the concentration.
The proposed methodology is able to work for different cases of reaction order, reaction kinetics, catalyst geometry, immobilized enzyme distribution, particle size distribution, and operating conditions. This is possible because the effect of all these parameters is reflected in the reaction performance and, consequently, in the productivity of the immobilized enzyme reactor. Finally, the productivity is the indicator of the diffusional restrictions when compared to the soluble enzyme productivity. The exception is that the proposed methodology is not suited when significant enzyme inactivation occurs. Thermal inactivation of the enzyme generates an increase in the Thiele modulus, thus increasing the EF during the reaction. The ratio of specific productivities between soluble and immobilized enzymes will not yield the EF in this case, even with first-order reactions.

3. Results and Discussion

Two different cases were analyzed to demonstrate the proposed methodology for the estimation of the EF of immobilized enzyme catalysts. The first case consists of the hydrolysis of lactose catalyzed by β-galactosidase, published by Jurado et al. [29]. The kinetic model considers similar affinities for lactose and galactose, which yields a first-order reaction model. The reaction progress with the soluble enzyme was obtained from Equation (19), while for the immobilized enzyme, the solution was obtained from Equation (20). The kinetic constants and parameters for the hydrolysis of lactose by β-galactosidase are summarized in Table 1.
A solid and porous support is used for immobilized enzyme catalysts. For example, glyoxyl agarose is a common support usually employed for the immobilization of different enzymes [33]. Some properties of the immobilized enzyme catalyst are important to the characterization of the diffusional restrictions during the reaction performance. The catalyst properties are summarized in Table 2, where the catalyst concentration (Ccat) corresponds to the catalyst mass per unit of reaction volume.
The effective diffusion coefficient (De) was calculated from the relationship between the diffusion coefficient (D0) and the porosity/tortuosity ratio (ε/τ), according to Engasser and Horvath [4], given in Equation (31).
D e = D 0 ε τ
The magnitude of the diffusional restrictions depends on the catalyst enzyme loading (E0″) and the particle radius (R). The reaction performance for the immobilized enzyme catalyst was calculated for different Thiele moduli as a function of the particle size. The values for the particle radius, Thiele modulus, and EF are listed in Table 3.
The reaction performance for the soluble β-galactosidase and each catalyst was calculated to illustrate the methodology and to demonstrate the proposal. The results are plotted in Figure 1.
A decreasing reaction rate can be observed in Figure 1a as a function of the EF values. The higher reaction rate was for the soluble enzyme, while it was lower for the immobilized enzyme cases. Figure 1b was obtained by calculating the specific productivity and plotting it against the conversion (not the reaction time). This is a very important step in the methodology because the normalization of the productivity was executed. The results clearly show that the productivity decreased as a function of the mean integral EF. Figure 1c is the result of calculating the ratio of the immobilized and soluble enzymes’ specific productivities. The result is a constant value which is independent of the conversion and consists of the mean integral EF. This is valid for the first-order reaction according to the model proposed by Jurado et al. [29], where the EF is independent of the substrate(s) and product(s) concentrations. This case is a demonstrative example, because the productivity ratio between the immobilized and soluble enzymes as a function of conversion is exactly the mean integral EF, as established in Equation (15).
The second case consisted of the hydrolysis of penicillin G by PGA, which is of a complex order according to its kinetic equation (Equation (21)). The kinetic constants and parameters used to calculate the reaction performance in the hydrolysis of PenG are shown in Table 4 [31].
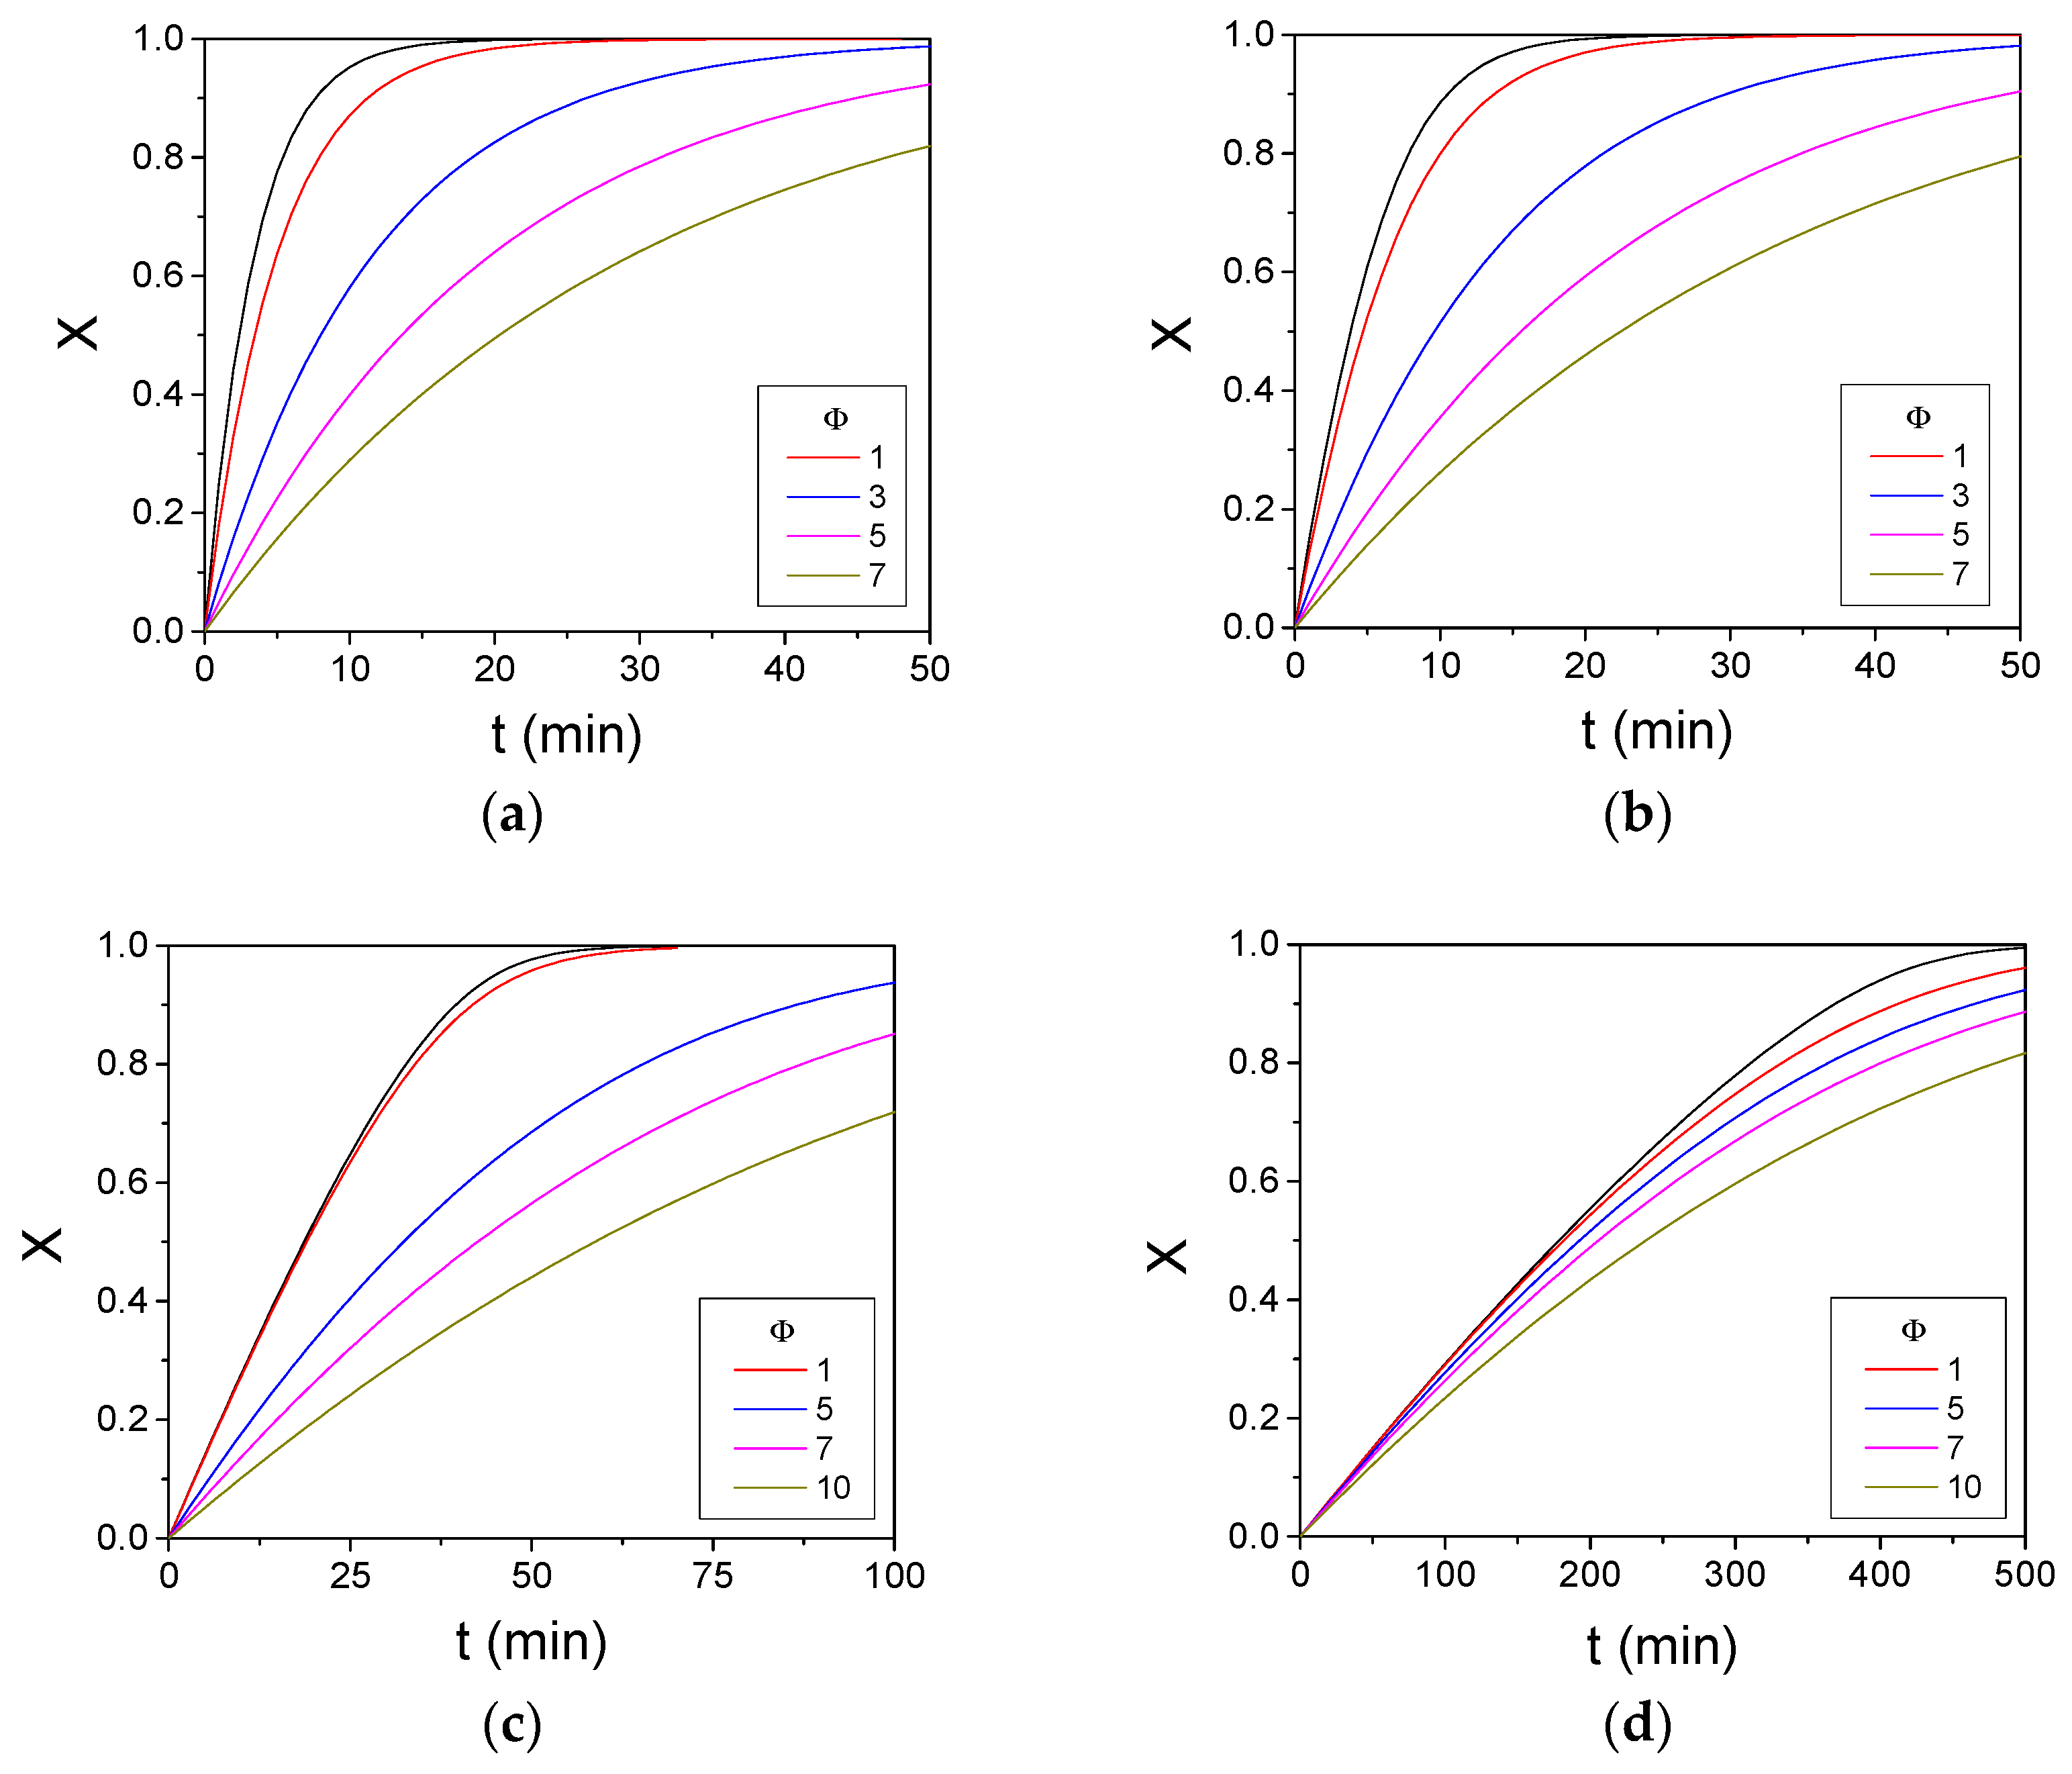
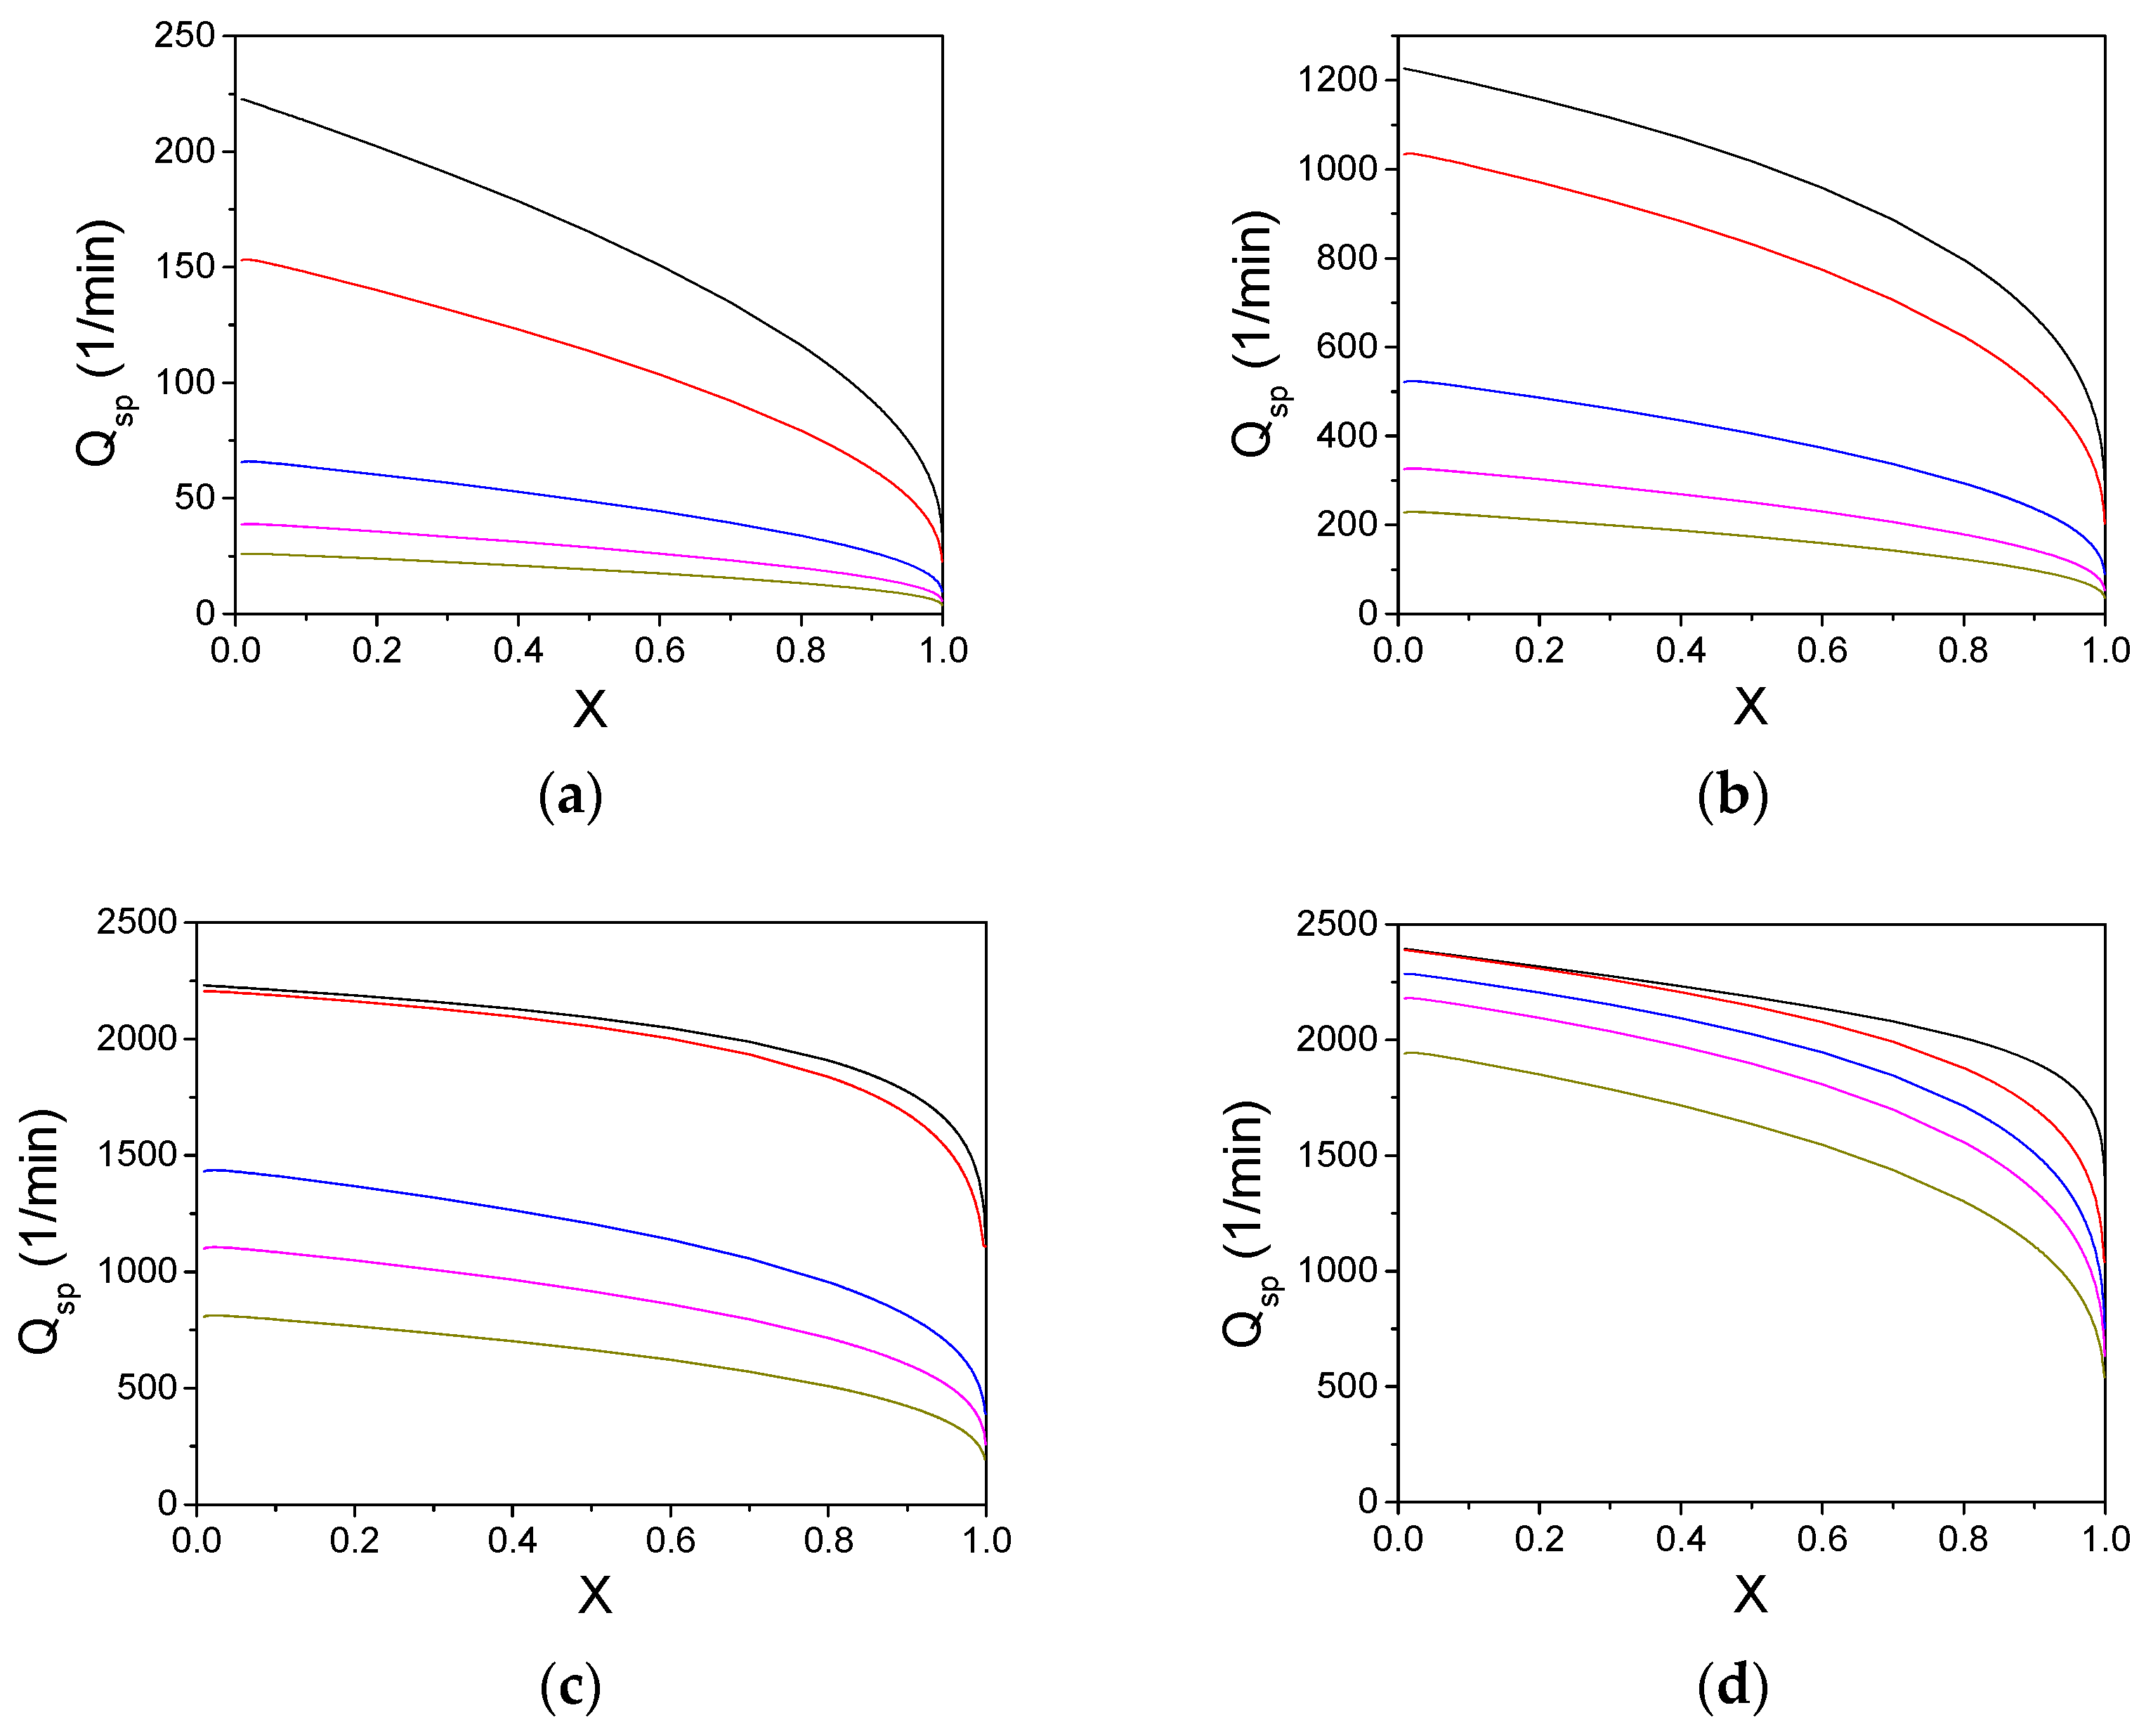
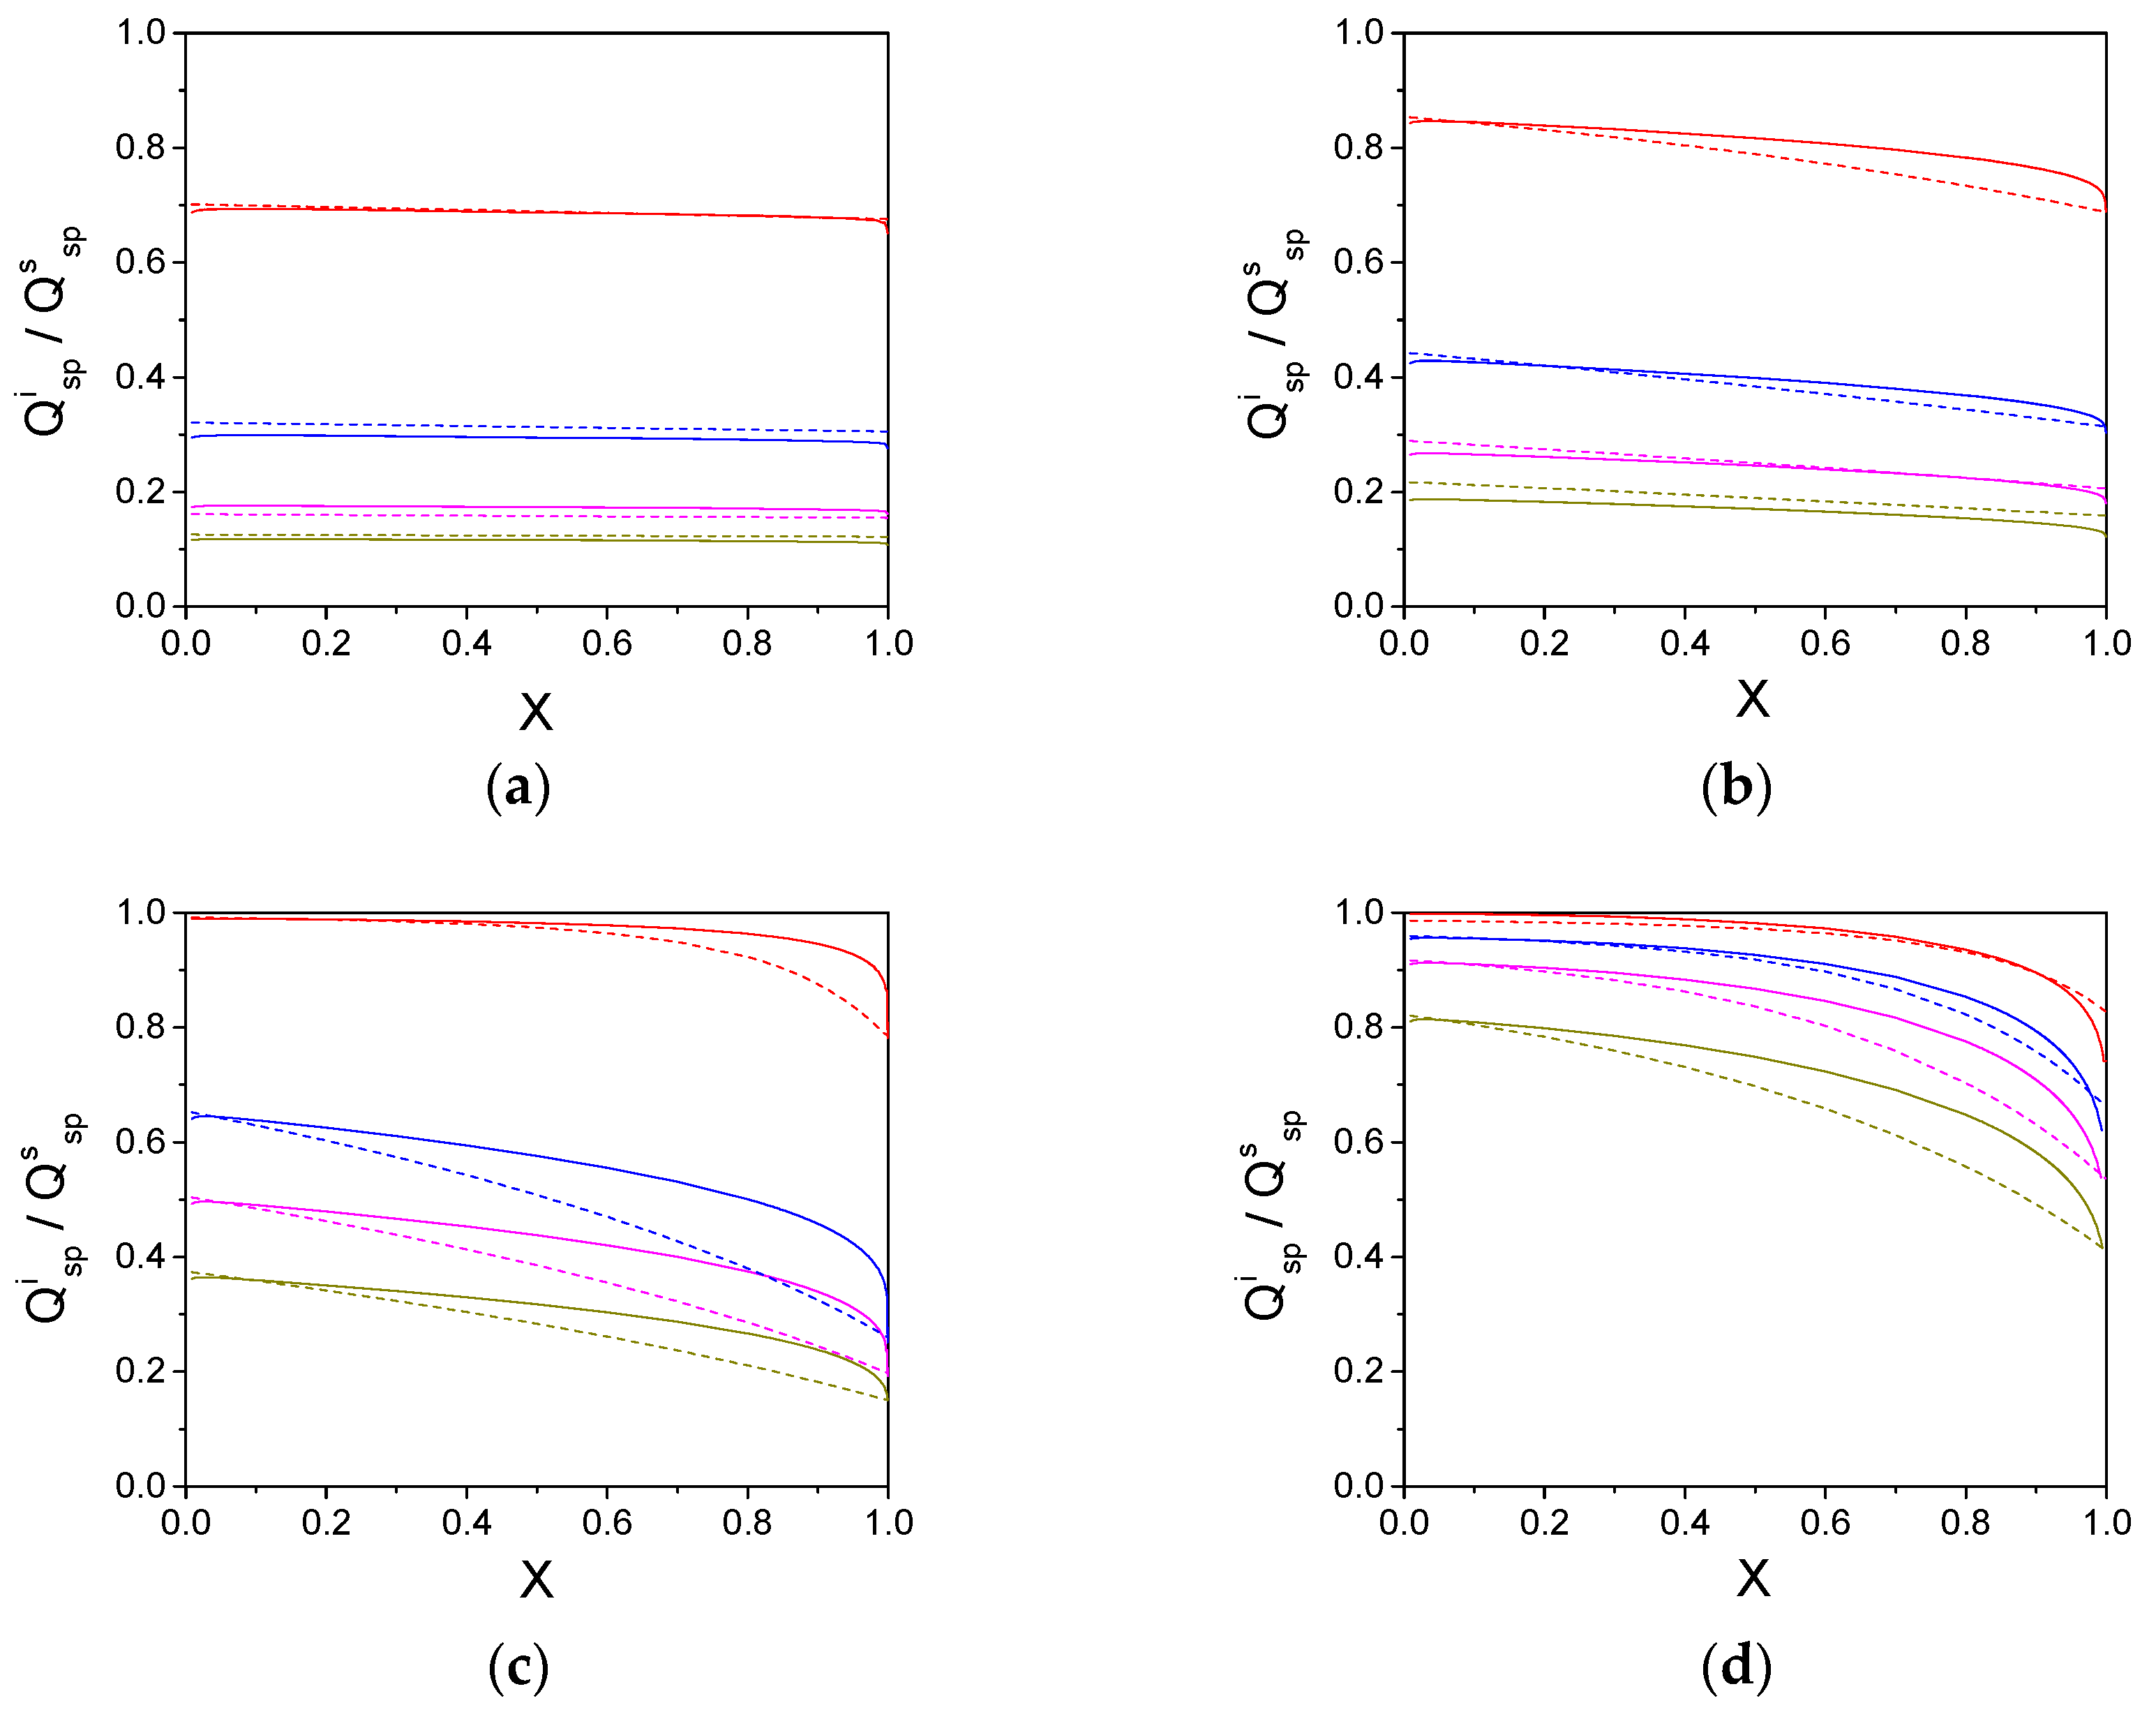
The Thiele modulus was calculated for different particle sizes in order to yield the values indicated in Figure 2. The particle size was in the range of 2 to 20 µm, maintaining the enzyme concentration inside the catalyst at 4.0 mM. Figure 2a–d shows the reaction progress of the hydrolysis of PenG by soluble and immobilized PGA with different initial PenG concentrations (S0/KM) and Thiele modulus values (Φ). They reflect the impact of the diffusional restrictions and their effect on the reaction performance. The decreasing catalyst efficiency as a function of the Thiele modulus can be clearly observed in Figure 2. The higher the particle size, the greater the reaction time to achieve a certain conversion value. However, the differences in efficiency between the immobilized and soluble enzymes diminished as the initial substrate concentration increased. This effect is due to the increase in the mass transfer rate. These curves of the reaction progress were used to calculate the specific productivity for each catalyst, including the soluble PGA. The specific productivities for the soluble and immobilized PGA catalysts plotted against the conversion are shown in Figure 3. The specific productivity followed the same trend as the reaction performance in Figure 2; that is, decreasing as a function of the Thiele modulus. The specific productivities were closer to that of the soluble PGA with high initial PenG concentration because of the increased mass transfer rate. Figure 4 shows the calculated mean integral EF from the concentration profiles, obtained through the resolution of the system of Equations (23)–(29), and the ratio of specific productivities between the immobilized PGA catalysts and the soluble PGA. The mean integral EF was calculated from the results of the system of Equations (23)–(29) by applying Equation (30). Both the EF and the specific productivity ratio are plotted against the reaction conversion (X). In general, the ratio of specific productivities and the calculated mean integral EF followed the same trend as a function of conversion for all the initial PenG concentrations and Thiele modulus values. The difference between both EFs was very low at low initial PenG concentrations for S0/KM values 0.1 and 1. At S0/KM = 0.1, the reaction was practically first order. Thus, this case is very similar to the previously analyzed case of a first-order reaction. We can infer that at a low initial substrate concentration (S0/KM = 0.1), the best estimation of the EF will be obtained. Increased differences between the ratio of specific productivities and the mean integral EF were observed for S0/KM values 10 and 100. It can be inferred that the ratio of specific productivities gives a better estimation of the EF at lower diffusional restrictions. However, at high diffusional restrictions, the ratio of specific productivities is within the range of variation of the mean integral EF. Furthermore, the ratio of specific productivities and the mean integral EF values were very similar at the initial and final stages of the reaction, as can be observed in Table 5 for all the analyzed cases of hydrolysis of PenG. An approximated Thiele modulus can be determined with this information. The estimated mean integral EF can be used to compute the Thiele modulus from Equation (3). The closer the behavior is to that of a first-order reaction, the better the estimation of the Thiele modulus, as can be observed in Table 6. The inhibition exerted by products in this reaction is very important at S0/KM equal to or higher than 100. This observation was analyzed in a previous publication by Valencia et al. [31], where the specific productivity presented a maximum value at an initial concentration of 100 mM of PenG. Despite this observation, product inhibition negatively affects the reaction performance due to the combination of the non-competitive inhibition and the competitive inhibition exerted by 6-APA and PAA, respectively. The differences observed between the estimator of the EF and the mean integral EF calculated using Equation (30) may be caused by product inhibition. This may be due to the fact that the reaction products accumulate inside the catalyst particles, exerting a higher degree of inhibition compared to the soluble enzyme. This is a plausible explanation because the mean integral EF calculated by Equation (30) is lower than the productivity ratio when the product concentration is higher (Figure 4). This will affect the calculations of reaction rates (v) in Equation (16) because the product concentration inside the catalyst for the immobilized enzyme case will be different to the product concentration in the homogeneous phase for the soluble enzyme case. In general, it can be established that the specific productivity ratio between the immobilized and soluble enzymes follows a behavior profile that is satisfactorily close to the mean integral EF calculated from the concentration profiles inside the catalyst. The estimation is especially accurate when the reaction conditions approximate a first-order reaction (low S0/KM).
The main limitation of the proposed methodology is that it does not work when significant enzyme inactivation occurs. In this case, the productivity ratio will be very different to the mean integral EF because thermal inactivation will decrease the enzyme concentration, decreasing the Thiele modulus and increasing the EF, while the productivity ratio decreases. A very interesting challenge lies in the expression in Equation (16), where analytical expressions for kinetic orders different from first order would help to explain the differences between the EF estimator, the productivity ratio, and the mean integral EF.
In conclusion, a new methodology for the estimation of the EF in immobilized enzyme catalysts was proposed herein. The methodology is simple because it requires routine assays, such as those for enzymatic activity, using the soluble and immobilized enzymes. A reaction progress plot, obtained from the substrate or product concentration as a function of time, can be used to calculate the specific productivity, which is then plotted against the reaction conversion. This estimation of the EF is highly precise, especially if the S0/KM ratio is low, as this case approximates first-order kinetics.

Author Contributions

Conceptualization, P.V.; methodology, P.V.; validation, P.V. and F.I.; formal analysis, P.V.; data acquisition and simulations, F.I.; supervision, P.V.; writing—original draft preparation, P.V. and F.I.; writing—review and editing, P.V.; funding acquisition, F.I.

Funding

This research was funded by Technical University Federico Santa María, Program of Incentive to the Scientific Initiation (PIIC) of the Postgraduate Direction, grant #0182017.

Conflicts of Interest

The authors declare no conflict of interest.

References

  1. Jesionowski, T.; Zdarta, J.; Krajewska, B. Enzyme immobilization by adsorption: A review. Adsorption 2014, 20, 801–821. [Google Scholar] [CrossRef]
  2. Oliveira, S.C. Evaluation of effectiveness factor of immobilized enzymes using Runge-Kutta-Gill method: How to solve mathematical undetermination at particle center point? Bioprocess Eng. 1999, 20, 185–187. [Google Scholar] [CrossRef]
  3. Valencia, P.; Wilson, L.; Aguirre, C.; Illanes, A. Evaluation of the incidence of diffusional restrictions on the enzymatic reactions of hydrolysis of penicillin G and synthesis of cephalexin. Enzym. Microb. Technol. 2010, 47, 268–276. [Google Scholar] [CrossRef]
  4. Engasser, J.-M.; Horvath, C. Effect of internal diffusion in heterogeneous enzyme systems: Evaluation of true kinetic parameters and substrate diffusivity. J. Theor. Biol. 1973, 42, 137–155. [Google Scholar] [CrossRef]
  5. Tischer, W.; Wedekind, F. Immobilized Enzymes: Methods and Applications. In Biocatalysis—From Discovery to Application; Fessner, W.-D., Archelas, A., Demirjian, D.C., Furstoss, R., Griengl, H., Jaeger, K.E., Morís-Varas, E., Öhrlein, R., Reetz, M.T., Reymond, J.L., et al., Eds.; Springer: Berlin/Heidelberg, Germany, 1999; pp. 95–126. [Google Scholar] [CrossRef]
  6. Illanes, A.; Miguel Gonzalez, J.; Manuel Gomez, J.; Valencia, P.; Wilson, L. Diffusional restrictions in glyoxyl-agarose immobilized penicillin G acylase of different particle size and protein loading. Electron. J. Biotechnol. 2010, 13. [Google Scholar] [CrossRef] [Green Version]
  7. Thiele, E.W. Relation between Catalytic Activity and Size of Particle. Ind. Eng. Chem. 1939, 31, 916–920. [Google Scholar] [CrossRef]
  8. Damkohler, G. Einflusse der stromung, diffusion und des warmeubergangs auf die leistung von reaktionsofen. Z. Elektrochem. Angew. Phys. Chemie 1936, 42, 846–862. [Google Scholar]
  9. Cohen, D.; Merchuk, J.; Zeiri, Y.; Sadot, O. Catalytic effectiveness of porous particles: A continuum analytic model including internal and external surfaces. Chem. Eng. Sci. 2017, 166, 101–106. [Google Scholar] [CrossRef]
  10. Carrasco, J.L.G.; Santoyo, A.B.; Gómez, E.G.; Rodríguez, J.B.; Martín, M.F.M.; Gómez, M.G. A short recursive procedure for evaluating effectiveness factors for immobilized enzymes with reversible Michaelis–Menten kinetics. Biochem. Eng. J. 2008, 39, 58–65. [Google Scholar] [CrossRef]
  11. Alfani, F.; Cantarella, M.; Gallifuoco, A.; Romano, V. On the effectiveness factor of immobilized enzymes with linear mixed-type product inhibition kinetics. Chem. Eng. J. Biochem. Eng. J. 1995, 57, B23–B29. [Google Scholar] [CrossRef]
  12. Fink, D.J.; Na, T.; Schultz, J.S. Effectiveness factor calculations for immobilized enzyme catalysts. Biotechnol. Bioeng. 1973, 15, 879–888. [Google Scholar] [CrossRef] [Green Version]
  13. Manjón, A.; Iborra, J.L.; Gómez, J.L.; Gómez, E.; Bastida, J.; Bódalo, A. Evaluation of the effectiveness factor along immobilized enzyme fixed-bed reactors: Design of a reactor with naringinase covalently immobilized into glycophase-coated porous glass. Biotechnol. Bioeng. 1987, 30, 491–497. [Google Scholar] [CrossRef] [PubMed]
  14. Vos, H.J.; Heederik, P.J.; Potters, J.J.M.; Luyben, K.C.A.M. Effectiveness factor for spherical biofilm catalysts. Bioprocess Eng. 1990, 5, 63–72. [Google Scholar] [CrossRef]
  15. Bódalo, A.; Gómez, J.L.; Gómez, E.; Bastida, J.; Iborra, J.L.; Manjón, A. Analysis of diffusion effects on immobilized enzymes on porous supports with reversible Michaelis-Menten kinetics. Enzym. Microb. Technol. 1986, 8, 433–438. [Google Scholar] [CrossRef]
  16. Gómez, J.L.; Bódalo, A.; Gómez, E.; Bastida, J.; Máximo, M.F. Two-parameter model for evaluating effectiveness factor for immobilized enzymes with reversible Michaelis–Menten kinetics. Chem. Eng. Sci. 2003, 58, 4287–4290. [Google Scholar] [CrossRef]
  17. Gusakov, A.V. A Fortran Program for Evaluation of the Effectiveness Factor of Biocatalysts in the Presence of External and Internal Diffusional Limitations. Biocatalysis 1988, 1, 301–320. [Google Scholar] [CrossRef]
  18. Rani, J.; Sevukaperumal, S.; Rajendran, L. Analytical expression of effectiveness factor for immobilized enzymes system with reversible Michaelis-Menten kinetics. Asian J. Sci. Appl. Technol. 2015, 4, 10–16. [Google Scholar]
  19. Moo-Young, M.; Kobayashi, T. Effectiveness factors for immobilized-enzyme reactions. Can. J. Chem. Eng. 1972, 50, 162–167. [Google Scholar] [CrossRef]
  20. Fang, Y.; Govind, R. A New Thiele’s Modulus for the Monod Biofilm Model. Chin. J. Chem. Eng. 2008, 16, 277–286. [Google Scholar] [CrossRef]
  21. Gottifredi, J.C.; Gonzo, E.E. On the effectiveness factor calculation for a reaction—Diffusion process in an immobilized biocatalyst pellet. Biochem. Eng. J. 2005, 24, 235–242. [Google Scholar] [CrossRef]
  22. Xiu, G.-H.; Jiang, L.; Li, P. Mass-Transfer Limitations for Immobilized Enzyme-Catalyzed Kinetic Resolution of Racemate in a Batch Reactor. Ind. Eng. Chem. Res. 2000, 39, 4054–4062. [Google Scholar] [CrossRef]
  23. Szukiewicz, M.; Petrus, R. Approximate model for diffusion and reaction in a porous pellet and an effectiveness factor. Chem. Eng. Sci. 2004, 59, 479–483. [Google Scholar] [CrossRef]
  24. Narayanan, K.; Meena, V.; Rajendran, L.; Gao, J.; Subbiah, S. Mathematical analysis of diffusion and kinetics of immobilized enzyme systems that follow the Michaelis-Menten mechanism. Appl. Comput. Math. 2017, 6, 143–160. [Google Scholar] [CrossRef]
  25. Praveen, T.; Valencia, P.; Rajendran, L. Theoretical analysis of intrinsic reaction kinetics and the behavior of immobilized enzymes system for steady-state conditions. Biochem. Eng. J. 2014, 91, 129–139. [Google Scholar] [CrossRef]
  26. Al-Muftah, A.E.; Abu-Reesh, I.M. Effects of internal mass transfer and product inhibition on a simulated immobilized enzyme-catalyzed reactor for lactose hydrolysis. Biochem. Eng. J. 2005, 23, 139–153. [Google Scholar] [CrossRef]
  27. Al-Muftah, A.E.; Abu-Reesh, I.M. Effects of simultaneous internal and external mass transfer and product inhibition on immobilized enzyme-catalyzed reactor. Biochem. Eng. J. 2005, 27, 167–178. [Google Scholar] [CrossRef]
  28. Ramachandran, P.A. Solution of immobilized enzyme problems by collocation methods. Biotechnol. Bioeng. 1975, 17, 211–226. [Google Scholar] [CrossRef]
  29. Jurado, E.; Camacho, F.; Luzón, G.; Vicaria, J.M. A new kinetic model proposed for enzymatic hydrolysis of lactose by a β-galactosidase from Kluyveromyces fragilis. Enzym. Microb. Technol. 2002, 31, 300–309. [Google Scholar] [CrossRef]
  30. Kheirolomoom, A.; Ardjmand, M.; Fazelinia, H.; Zakeri, A. Clarification of penicillin G acylase reaction mechanism. Process Biochem. 2001, 36, 1095–1101. [Google Scholar] [CrossRef]
  31. Valencia, P.; Flores, S.; Wilson, L.; Illanes, A. Effect of Internal Diffusional Restrictions on the Hydrolysis of Penicillin G: Reactor Performance and Specific Productivity of 6-APA with Immobilized Penicillin Acylase. Appl. Biochem. Biotechnol. 2011, 165, 426–441. [Google Scholar] [CrossRef]
  32. Van Roon, J.L.; Arntz, M.M.H.D.; Kallenberg, A.I.; Paasman, M.A.; Tramper, J.; Schroën, C.G.P.H.; Beeftink, H.H. A multicomponent reaction–diffusion model of a heterogeneously distributed immobilized enzyme. Appl. Microbiol. Biotechnol. 2006, 72, 263–278. [Google Scholar] [CrossRef] [PubMed]
  33. Mateo, C.; Palomo, J.M.; Fuentes, M.; Betancor, L.; Grazu, V.; López-Gallego, F.; Pessela, B.C.C.; Hidalgo, A.; Fernández-Lorente, G.; Fernández-Lafuente, R.; et al. Glyoxyl agarose: A fully inert and hydrophilic support for immobilization and high stabilization of proteins. Enzym. Microb. Technol. 2006, 39, 274–280. [Google Scholar] [CrossRef]
Figure 1. Plot series to calculate the EF from the reactor performance. Data for the hydrolysis of 150 mM lactose by soluble and immobilized β-galactosidase at 1 g/L (ER) and 35 °C. (a) Reaction progress with the effectiveness factor as a parameter; (b) volumetric productivity as a function of the conversion; (c) calculation of the mean integral EF according to Equation (15).
Catalysts 09 00930 g001
Figure 2. Reaction progress for the hydrolysis of penicillin G by soluble (black line) and immobilized PGA (color lines) for catalysts with different initial PenG concentrations (S0/KM) and Thiele moduli (Φ): (a) S0/KM = 0.1; (b) S0/KM = 1.0; (c) S0/KM = 10; (d) S0/KM = 100.
Catalysts 09 00930 g002
Figure 3. Specific productivities for the hydrolysis of penicillin G by soluble (black line) and immobilized PGA (color lines) for catalysts with different initial PenG concentrations (S0/KM) and Thiele moduli (Φ): (a) S0/KM = 0.1; (b) S0/KM = 1.0; (c) S0/KM = 10; (d) S0/KM = 100. All specific productivities were calculated from data in Figure 2. Legends are the same as those in Figure 2.
Catalysts 09 00930 g003
Figure 4. Ratio between immobilized PGA catalyst and soluble PGA-specific productivities (continuous lines) for the hydrolysis of penicillin G with different initial PenG concentrations (S0/KM) and Thiele moduli (Φ): (a) S0/KM = 0.1; (b) S0/KM = 1.0; (c) S0/KM = 10; (d) S0/KM = 100. Results for the mean integral EF were calculated from the concentration profiles inside catalyst particles (dotted lines). All specific productivities were calculated from data in Figure 2. Legends are the same as those in Figure 2.
Catalysts 09 00930 g004
Table 1. Kinetic constants and parameters for the hydrolysis of lactose catalyzed by β-galactosidase at 35 °C.
Constant/ParameterValueUnit
kcat5.15mM⋅L/g⋅min
KM8.43mM
ER1.00g/L
S0150mM
Table 2. β-galactosidase catalyst properties used in the calculation of the conversion curves for the hydrolysis of lactose at 35 °C.
Constant/ParameterValueUnit
E016.0 1g/L
D03.97 × 10−8m2/min
De2.98 × 10−8m2/min
ε/τ0.75-
Ccat50g/L
1 Enzyme concentration in the catalyst, calculated according to Equation (17).
Table 3. Effectiveness factor (EF) and Thiele modulus as a function of the particle radius (R) for the different β-galactosidase catalysts used in the calculation of the conversion curves for the hydrolysis of lactose at 35 °C.
R (µm)Φη′
3160.40.90
5740.80.75
11321.60.50
26073.60.25
69309.70.10
Table 4. Kinetic constants and parameters for the hydrolysis of penicillin G (PenG) by penicillin G acylase (PGA) at 30 °C and pH 7.8.
Constant/ParameterValueUnit
KM0.13mM
KS821mM
K11.82mM
K248.0mM
kcat2460min−1
E04.0mM
De3.18 × 10−8m2/min
De14.40 × 10−8m2/min
De23.53 × 10−8m2/min
T303K
Catalyst concentration2.5g/L
Table 5. Ratios of specific productivities (SPRs) and mean integral EF (MIEF) values at the initial and final stages of the hydrolysis of PenG by PGA at 30 °C and pH 7.8.
S0/KMThiele Modulus (Φ)InitialFinal
SPRMIEFSPRMIEF
0.110.6870.7020.6510.676
30.2950.3210.2760.306
50.1740.1610.1610.155
70.1160.1260.1080.122
110.8430.8530.7160.688
30.4250.4420.3040.314
50.2650.2890.1800.207
70.1860.2170.1220.159
1010.9890.9920.7820.787
50.6410.6520.2510.261
70.4930.5040.1920.198
100.3620.3730.1500.151
10010.9980.9860.7410.828
50.9540.9590.6200.662
70.9100.9170.5380.536
100.8110.8210.4160.411
Table 6. Estimated Thiele moduli from the ratios of specific productivities at the initial and final stages of the hydrolysis of PenG by PGA at 30 °C and pH 7.8.
S0/KMThiele Modulus (Φ)Estimated Φ
InitialFinal
0.110.9591.057
33.023.25
55.395.86
78.278.91